a systems approach to urban water services in the context ... · utilising the water evaluation and...
TRANSCRIPT

Abstract
The City of Cape Town derives the bulk of its pres-
ent water supply from surface water resources and
is the central water service authority for metropoli-
tan consumers. The City is also a provider of bulk
water to neighbouring municipalities. An explo-
ration of the energy consumption for water and san-
itation services for the City of Cape Town was con-
ducted with an emphasis on water supply augmen-
tation options for the near future (2011-2030). A
systems analysis of municipal urban water services
was undertaken to examine the energy require-
ments of supply alternatives and the efficacy of the
alternatives in respect of supply availability and reli-
ability. This was achieved using scenario based
analysis incorporating a simple additive value func-
tion, to obtain a basic performance score, to rank
alternatives and facilitate a quantitative comparison.
Utilising the Water Evaluation and Planning hydro-
logical modelling tool, a model for urban water
services was developed for the City and used to
conduct scenario analyses for a representative port-
folio of previously identified options. Within the
scope of the research objectives, the scenario analy-
ses examines the direct energy consumption for the
provision of water services for the City as influenced
by external factors such as population growth, sur-
face water runoff variability, available alternatives
and the policies that are adopted which ultimately
determine the future planning. It is contended that
the modelling process presented here integrates
energy and water planning for an assessment of
water and energy resources required for future
growth, and the optimal measures that could be
pursued to reconcile the demand for water and the
concomitant energy requirements.
Keywords: City of Cape Town, energy and water
planning, water evaluation and planning
Introduction
South Africa is a country with a precarious energyand water resource landscape. Both sectors sufferfrom ageing infrastructure and the capacity to func-tion sustainably (Coetzer, 2012; Gaunt, 2010). Theenergy capacity crisis of 2007/8 led to power short-ages with a direct impact on economic growth(Eberhard, 2008). In the Vaal Triangle, the eco-nomic and industrial heart of the country, the waterstressed industry has expressed concerned that adrought in the near future could have drastic eco-nomic consequences (Davies 2012). In the recentpast in the Western Cape Province, located in thesouth west of South Africa, a decline in surfacewater storage required the imposition of waterrestrictions in the City of Cape Town in 2000/1 and2004/5 (DWAF, 2007c). An investigation of futurewater requirements for the CCT suggested that,without any interventions, demand would exceedthe available supply by 2020 for a low populationand economic growth scenario and earlier if highergrowth is experienced (DWAF, 2007c). The expansion of water services infrastructure to
meet growing demand in a future of increasingenvironmental and energy constraints requires theconsideration of alternative water supplies as thecapacity of the present system is reached. SouthAfrica’s White Paper on the National ClimateChange Response (2011) emphasizes the investiga-tion of other sources, beyond the traditionalreliance on surface water systems, as a key elementin water sector growth and security, stating theimportance of ‘exploring new and unusedresources, particularly groundwater, re-use of efflu-ent, and desalination’.The scope of this study is restricted to urban
municipal water services for the City of Cape Townand excludes any energy used directly by con-sumers in the use and disposal of water and
Journal of Energy in Southern Africa • Vol 25 No 4 • November 2014 59
A systems approach to urban water services in the
context of integrated energy and water planning: A City of
Cape Town case study
Fadiel Ahjum Energy Research Centre, University of Cape Town, Cape Town, South Africa
Theodor J StewartDepartment of Statistical Sciences, University of Cape Town, Cape Town, South Africa
sewage. Figure 1 illustrates the municipal waterservices cycle in the context of this study. Similarly,agricultural water demands in the region are alsonot examined in detail except where waterresources are shared such as the surface waterschemes, for example.
It was estimated that the provision of water andsanitation services for the period 2007/08 account-ed for half of the City’s electricity consumption witha third attributed to waste water treatment alone(Jennings 2012). The potential for an increase inenergy consumption for future water and sanitationservices motivated this study which aimed to com-plement previous studies that have quantified theenergy demands of water services (Cooley andWilkinson, 2012; deMonsabert and Bakhshi 2009;Larabee et al., 2011; Olsson, 2011). From ‘source to discharge’ as water is abstract-
ed, transformed and conveyed for the needs of theurban sector, the study aimed to evaluate the ener-gy implications and efficacy of reconciling demandand supply of a portfolio of alternate intervention
measures, which cater for future scenarios compris-ing: population and economic growth; reduced sur-face water availability (e.g. environmental con-straints); and more energy intensive treatmentprocesses. This was achieved using scenario basedanalysis incorporating a simple additive value func-tion, to obtain a basic performance score, to rankalternatives and facilitate a quantitative comparisonin respect of supply availability, reliability and ener-gy intensity.Utilising the Water Evaluation and Planning
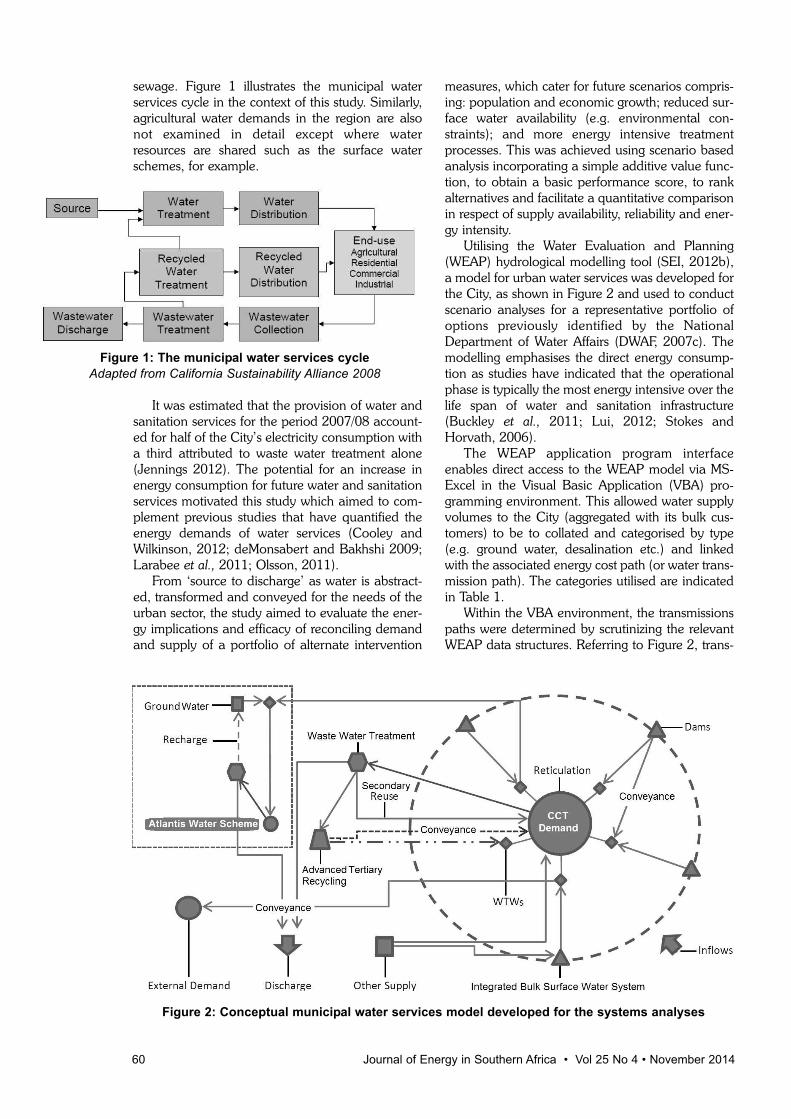
(WEAP) hydrological modelling tool (SEI, 2012b),a model for urban water services was developed forthe City, as shown in Figure 2 and used to conductscenario analyses for a representative portfolio ofoptions previously identified by the NationalDepartment of Water Affairs (DWAF, 2007c). Themodelling emphasises the direct energy consump-tion as studies have indicated that the operationalphase is typically the most energy intensive over thelife span of water and sanitation infrastructure(Buckley et al., 2011; Lui, 2012; Stokes andHorvath, 2006).The WEAP application program interface
enables direct access to the WEAP model via MS-Excel in the Visual Basic Application (VBA) pro-gramming environment. This allowed water supplyvolumes to the City (aggregated with its bulk cus-tomers) to be to collated and categorised by type(e.g. ground water, desalination etc.) and linkedwith the associated energy cost path (or water trans-mission path). The categories utilised are indicatedin Table 1.Within the VBA environment, the transmissions
paths were determined by scrutinizing the relevantWEAP data structures. Referring to Figure 2, trans-
60 Journal of Energy in Southern Africa • Vol 25 No 4 • November 2014
Figure 1: The municipal water services cycle
Adapted from California Sustainability Alliance 2008
Figure 2: Conceptual municipal water services model developed for the systems analyses

mission links within WEAP connect the variousstages of the water use cycle. Dams can be inter-connected and linked to demand sites which arethen, for example, linked to waste water treatmentplants (WWTP) which process the return flows(effluent). In the model depicted, for example, thesepaths are located in the WEAP data branches:• ‘Supply and Resources\Transmission Links\toCCT Dist’ (Supply to City’s distribution network)
• ‘Supply and Resources\Transmission Links\toCCT EX BULK Dist’ (Supply to City’s externalcustomers)
• ‘Supply and Resources\Transmission Links\toCCT Dist Atlantis_Mamre’ (Supply to City’sAtlantis Water Scheme)
The most recent issue of WEAP includes func-tionality to link directly with its companion energymodelling software tool, Long-term EnergyAlternatives Planning (LEAP) system, to facilitatewater-energy modelling (SEI, 2012a). At the timethis research was conducted, this functionality waslacking. Therefore, energy consumption was incor-porated using WEAP’s financial analysis module byincorporating a user defined ‘energy currency’based on the energy intensity or specific energy ofa process. These ‘costs’ need to be assigned to thevarious stages of the water use cycle. This is eitherderived from empirical data or a first principle cal-culation. For example, the theoretical hydraulicenergy required transporting water via a pipelineacross known topography; or the energy generatedat a WTW exploiting the existing hydraulic gradient(SACN, 2011) as approximated by Equation 1:
E(kWh)/ month = 1/e * pg QH/3.6MJE(kWh)/ month = 1/e *0.002725 QH (1)
Where e = system efficiency, Q =flow rate (m3/month), H = Head (m), p = density of water(kg/m3), g = gravity m/s2
The net energy cost for water and sanitationservices is then the linear sum of the product of theenergy intensities and the volumes of water (oreffluent) that is processed at each stage. This is
mathematically expressed in Equation 2. Themethodology is similar to that adopted in LEAP.
(2)
Where e = energy intensity (kWh/m3); s=stage(m3); k=WEAP object In further discussion, the specific energy or ener-
gy intensity of the water sector is defined as theenergy consumption per m3 of water supplied to thedistribution network or effluent conveyed and treat-ed.Empirical energy data for the City’s Reticulation
and Bulk Water Supply network were not availableat the time requests were made (Allpass, 2012;Mashoko, 2012; Moll, 2012). In their absence, esti-mates are used as reported in the literature.Reported data was scrutinised for their applicabilityto Cape Town’s environment as topography as wellas the manner of water supply and conveyance isan important factor in the energy consumption ofthe water sector (Friedrich et al., 2009; Kenway etal., 2008). Figure 3 illustrates the modelling process.Table 2 and Table 3 list the individual options
and class of interventions comprising the optionsused for this case study. The interventions representan orientation towards a particular category of sup-ply or demand management. That is, an interven-tion programme which prefers sea water desalina-tion, surface water, ground water or effluent recy-cling options. The interventions are also comparedagainst a partial or continued water conservationand water demand management (WC/WDM) pro-gram.Unrestricted and regulated usage of dam vol-
umes for urban water consumption are also exam-ined and compared for their relative performance. Itis assumed that this simulates drought mitigationmeasures or water rationing that the NationalDepartment of Water Affairs and City practices toensure a minimum reserve. In contrast, the unre-stricted usage of water from the dams (aside fromthe allocations to agriculture) is also modelled as acomparison of the water supply and energy con-sumption requirements.
Journal of Energy in Southern Africa • Vol 25 No 4 • November 2014 61
Table 1: Stages or categories of the urban water cycle as implemented in WEAP
WEAP object prefix Description Example WEAP object
WTW Water treatment works ‘CCT WTW Faure’ (Individual City WTW plant)
WWTP Waste water treatment works ‘CCT WWTP’ (Lumped treatment process)
GW Ground water ‘GW TMG THK’ (Specific option: Table Mountain Group)
DIST Potable water distribution ‘CCT Dist’ (The City’s distribution network)
SWD Sea water desalination ‘CCT SWD’ (Lumped SWD option for the City)
WWR Waste water reclamation ‘CCT WWR NEWater’ (Specific treatment process)
n/a Other Refers to conveyance of water across the system that is not accounted for (e.g. pump stations for water transfers)

Table 2: A summary of policy options for water
supply and demand reconciliation in the model
(1) Water Conservation / Water Demand Management(WC/WDM) (a): limited programme
(2) WC/WDM (b) : extended programme
(3) Ground Water Augmentation of Theewaterskloof dam from TMG (TMG-THK)
(4) Additional Surface Water Options
(5) Reuse of Secondary Treated Effluent
(6) Advanced Recycling of Effluent (including potable augmentation)
(7) Sea Water Desalination
(8) Regulation of Water Releases from the Berg River and Theewaterskloof Dams
Table 3: Candidate interventions comprising
the policy options modelled in WEAP
Intervention Policy option preference
(a) WC/WDM (1) > Ground water (3) > Reuse (5)> Desalination (7)
(b) WC/WDM (1) > Surface (4) > Reuse (5) > Ground water (3) > Recycling-Potable (6)
(c) WC/WDM (2) > Desalination (7) > Reuse (5)
(d) WC/WDM (2) > Reuse (5) > Recycling-Potable (6) > Ground water (3)
The interventions are illustrative of the impact ofpolicy decisions and do not represent an exhaustiveanalysis of the complete range of possibilities butrather serve to highlight the modelling process aswell, which attempts to address three dimensions ofwater and energy planning. These are: energy con-
sumption, water availability and assurance of sup-ply. The scenarios modelled are summarised in
Table 4. The water demand scenarios are based on the
DWAF Future Water Requirements Study (2007),where two water demand scenarios account for acombination of high economic and populationgrowth and conversely low economic and popula-tion growth. The 2007 DWAF forecast is depicted inFigure 4, which includes the actual demand up tothe period 2009/10 along with the economic andpopulation growth rates used. Figure 5 contrasts theDWAF forecast with the adjusted WEAP demandscenarios which utilise 2009/10 as the base year.Water availability is quantified with a compari-
son of the surface water storage of the major damsat the start and end of the period. A ‘SystemStorage Index’ is created and refers to the ratio ofminimum dam storage (occurring about the monthof April) at the end of the period to that at the start,based on a four year average. The WEAPReliability variable which quantifies the extent thatsupply is able to meet demand over the period isused to indicate the assurance of supply for a par-ticular intervention. Within WEAP, the system relia-bility indicates the percentage of time that demandis met for the period (i.e. 100% = no unmetdemand for the period and 50% = half the timethere is unmet demand).To facilitate a performance comparison of the
interventions in relation to the three parametersmentioned, a basic performance index (α) is used.In the context of the research presented here, afavourable intervention is that which minimises
62 Journal of Energy in Southern Africa • Vol 25 No 4 • November 2014
Figure 3: The integrated water-energy modelling process

energy consumption (i.e. low energy intensity) andmaximises water availability and supply. Therefore,the performance index consists of the unweighted(or neutral) product of the inverse of the systemenergy intensity (Ei), and the system reliability andsystem storage index. Expressed in Equation 3, theresultant magnitude of α suggests a more favour-able intervention where α is larger.
α = 1/Ei * Reliability * System Storage Index (3)
Expressed in logarithmic terms, as shown inEquation 4, it can be viewed as a simple additivevalue function which forms the basis of decision
analysis in Multi-Attribute Value Theory (MAVT)whereby selected alternatives are evaluated accord-ing to set criteria and ranked by an aggregatedscore as calculated by a value function (vanHerwijnen, 2012). The logarithmic expression isgiven below in Equation 5.
A = ln(α) = ln(1/Ei) + ln(Reliability) +ln(System Storage Index) (4)
Although no scaling is applied to the indicatorsfor the analyses conducted here, it should be notedthat due to the logarithmic summation, a ratio pref-erence scaling is implied for this expression. In
Journal of Energy in Southern Africa • Vol 25 No 4 • November 2014 63
Table 4: A summary of the scenarios modelled with WEAP
Scenario Water demand Surface inflow Water quality Dam waters Comments
1 High Historic Low degradation Regulated Reference Case
2 High Historic Low degradation Unrestricted
3 High Reduced Inflow Higher degradation Regulated Worst case
4 High Reduced Inflow Higher degradation Unrestricted
5 Low Historic Low degradation Regulated
6 Low Reduced Inflow Higher degradation Unrestricted
Figure 4: DWAF aggregated demand forecast for CCT (including bulk customers)
with economic and population forecast growth rates

MAVT, ratio scaling provides an indication of therelative preference of one option to another byassuming that criteria are directly comparable bytheir weighting value (Simpson, 1994).
Results and discussion
The analyses focused on the case of high growth inwater demand by the City. The options which wereimplemented are a representative sample of theidentified set and it is likely that these are subject tofuture revision with improved analysis. Therefore, itis important to note that the interventions are pri-marily illustrative of the modelling approach itself,which provides a tool for scenario analyses where‘what if’ questions can be quantitatively examinedfor their outcomes and compared with alternatives;and that the accuracy and precision of the resultsreflect the best available estimates and knowledgeof the model parameters at the time. The calculation of separate energy intensities (or
specific energies) for the supply of potable waterand that for sanitation becomes intractable wheninterventions are considered because the bound-aries of the two branches become more inter-con-nected as in the case of effluent recycling forpotable consumption or reuse. Therefore, as a com-parative measure, the energy intensity of the urbancycle is used which is taken to be the ratio of theannual total energy consumed by the water sector(kWh) to the annual volume of water produced(m3) inclusive of system losses. This would includethe supply, treatment and distribution of raw,potable and waste water. The case of prioritising the existing surface water
supply system with desalination as a secondary sup-ply option is also compared. In this case, supplyfrom desalination is endogenously determined as a
supplementary supply when other options are insuf-ficient to reconcile demand. This is contrasted withthe default implementation in which desalinationoperates conjunctively with the surface water sys-tem and capacities are exogenously determined.
The performance of the interventions
A reference value is used to provide a comparativefigure for the performance (α) of the interventionsagainst the aforementioned criteria for the selectedscenarios. This value is obtained with the combina-tion of the energy intensity of the reference sce-nario, an ideal reliability of 100% and a status quosurface water storage (i.e. storage index = 1). Thisgives a reference performance index of α = 164.Table 5 displays the overall performance where
the best performing intervention for each scenariois underlined for emphasis. The average perform-ance of scenarios 1 and 3, which represent theextremes of scenario factors, is ca. 49 and is 20%greater than the alternate grouping of scenarios 2and 4 for which the value is 39. However, in thecontext of no interventions, if assurance of supply ispreferred at the expense of strategic water storage inthe near future then, depending on the relativeweighting, a reliable water supply system may beconsidered more resilient. The resultant perform-ance can be further weighted by scenario such that,for example, the reduced inflow scenarios are givenmore prominence. The results for the implementa-tion of the suggested interventions, as expected,show an improvement in reliability for all scenariosand interventions. The general pattern that emergesis that unrestricted usage increases reliability at theexpense of system storage. The data in Table 5 fur-ther indicates that the intervention (d) that max-imises effluent reuse-recycling in tandem with a
64 Journal of Energy in Southern Africa • Vol 25 No 4 • November 2014
Figure 5: Aggregated demand forecast for CCT (including bulk customers)
compared to the 2007 DWAF forecast

continued WC/WDM programme is the best optionfor each of the possible scenarios considered. A scenario comprising historical average inflows
to the system dams does not reflect the historic vari-ation in system storage and therefore a reducedinflow scenario was included to gauge the systemresponse between the two extremes. Thus, if inflowsto the system were reduced or simply less wateravailable from the dams, then the intervention (c)comprising desalination with a continuedWC/WDM programme provides the next best per-formance. Between the two extremes of surfacewater availability with (d) providing the best per-formance, (c) is the next preferred interventionbased on the reduced inflow performance as indi-cated.Referring to Table 6, the energy intensities are
similar for all scenarios with no interventions as the
existing infrastructure essentially remains a surfacewater scheme. For the case of no interventions, sce-narios 2 and 4 for which dam usage is unrestricted,result in the lowest unmet demands and thus havehigher reliability values. However, their storageindex is lower as a result of the increased dischargeof dam waters. In contrast, for the case of regulatedreleases, the system reliability is reduced to 60% ofthe latter option with ca. 50% of water demandbeing unmet over the period, but with enhancedwater storage. This is the case for both surfacewater inflow scenarios (average and reduced) sug-gesting a more resilient intervention as existingwater volumes are strategically managed or con-served.The ground water option (3) features in all the
interventions except (c). Based on the performanceof (c), which includes the continued WC/WDMoption, ground water appears less important as amunicipal supply option for the Greater Cape in thenear future. This is in contrast to the key optionsidentified by their performance which includesdesalination, effluent reuse-recycling and WC/WDM. However, since the City’s WC/WDM pro-gramme includes an increase of end-user exploita-tion of ground water, the impact may be consideredindirectly via the success of this component withinthe WC/WDM programme although the volumessuggested (3.6 Mm3/a) would still represent a minorcontribution should the high water demand growthtrajectory be realised.
The case of low growth in water demand
The performance of the existing water supply sys-tem, as approximated in the model, is given inTable 7 for the case of low growth in water demand.Reliability and storage are similar to that of the highwater demand scenarios with interventions applied.Scenario 6, for unrestricted dam usage and averagesurface water availability, results in no unmetdemand over the period with a comparable per-formance in storage to scenario 5 and 7 where damusage is restricted. This scenario has the highestoverall performance and the system performanceindicates that minimal additional supply augmenta-tion would be required in the near future if waterdemand approaches the low growth trajectory.Allowing for the uncertainty in surface waterinflows, as represented by scenario 7, a full imple-mentation of WC/WDM would require no addition-al measures. A partial WC/WDM programme wouldpotentially necessitate intervention in the period2027/30.
The scenario interventions
Figure 6 compares dam storage and unmet demandfor the scenarios with no interventions applied.Relative to the reference case, scenario 3 experi-ences similar unmet demand at the expense of dam
Journal of Energy in Southern Africa • Vol 25 No 4 • November 2014 65
Table 5: The performance (α) of the candidate
interventions for the case of high water
demand
Scenario none a b c d
1 62 80 117 96 132
2 45 96 137 104 151
3 37 49 36 71 89
4 33 46 40 59 65
Table 6: The performance of the candidate
interventions against the individual criteria for
the case of high water demand
Indicator or category
Inter- Scenario Energy Reliability System
vention intensity storage index
none 1 (reference) 0.61 49 0.77
2 0.58 85 0.31
3 0.63 48 0.48
4 0.59 80 0.24
a 1 1.01 84 0.97
2 1 99 0.97
3 1.06 84 0.61
4 1.03 99 0.48
b 1 0.73 89 0.96
2 0.72 100 0.99
3 0.76 87 0.31
4 0.73 98 0.29
c 1 0.96 92 1.00
2 0.95 100 0.99
3 0.98 89 0.78
4 0.96 100 0.56
d 1 0.66 91 0.96
2 0.65 100 0.98
3 0.69 90 0.68
4 0.67 100 0.44

storage. Scenarios 2 and 4 display very differentunmet demands over the period which is due to theunrestricted operation of the dams. In this mode ofoperation, the supply system is less resilient by com-parison to the grouping of scenarios 1 and 3.
Municipal energy consumption
The energy intensities of the scenarios without anyinterventions are displayed in Figure 7.
Scenario 2 and 4, by grouping, display similarcharacteristics to the grouping of the reference sce-nario and scenario 3. Scenario 3 departs from thereference scenario due to the increased cost ofwater treatment, in terms of energy consumption,from the year 2015 although the average energycost of the urban water cycle for the two predomi-nantly surface water interventions over the period issimilar. When comparing the average energy inten-
66 Journal of Energy in Southern Africa • Vol 25 No 4 • November 2014
Table 7: The system performance for the low water demand scenarios without interventions
Intervention Scenario Indicator α
Energy intensity Reliability System storage index
none 5 0.61 78 0.93 119
6 0.59 100 0.86 146
7 0.62 76 0.87 107
Figure 6: Dam storage and unmet demands for the scenarios without interventions

sity by five year intervals, the difference in energyconsumption doubles every five years reaching 8%by 2030. The increase in energy consumption is pri-marily borne by the potable water treatmentprocesses as displayed in Figure 8, which is domi-nated by the City’s Voelvlei WTW. In scenario 3, the Voelvlei WTW comprises 95%
of water treatment energy consumption, whichreduces to 75% by 2026/30. The contribution of theother WTWs is due to the influence of the contin-ued reduction in surface inflows, which impacts themini-hydro energy generation capacity at theseplants while the WTWs at Pniel and Atlantis aremodelled with no onsite generation. The peaking ofenergy consumption at the Voelvlei WTW correlateswith the reduction in water supply from Voelvleidam. The proportion of the total energy consumed,in scenario 3, for water treatment grows from an ini-tial 4% (2011/15) to 11% (2026/30). This comparesto the reference case, where WTWs comprise 3% to4% of total energy consumption for the period2011/30.The total energy consumption of the interven-
tions for the scenarios are given in Table 8. Figure 9illustrates their relative impact by energy intensity –note that the energy intensities for scenarios 2 and4 are similar for the reference case and scenario 3.
Table 8: Total energy consumption for the
period 2011/30 (GWh)
Scenario Intervention
(a) (b) (c) (d)
1 9577 6783 8293 5499
2 9615 6740 8275 5501
3 10076 7017 8461 5794
4 9983 6794 8347 5705
An examination of the data reveals that, for agiven growth demand scenario, the energy intensi-ty of the interventions are similar between the sce-narios such that the influence of surface waterinflows and treatment is marginal in terms of thedirect energy consumption required for the urbanwater cycle. This similarity is due to the equal prior-ity of supply options in the model for the urban sec-tor. As the bulk of the existing surface water supplyoptions are shared with the agricultural sector, thesolver within the model attempts to satisfy the urbandemand with the alternative supply options firstly,in order to ensure adequate water availability foragricultural users. Within WEAP, users with equal (demand) prior-
ity of a shared resource are granted equal privilegesand unmet demands are calculated in proportion tothe volume of water required. For example, withurban and agricultural users the full capacity of analternative option such as desalination is utilisedcausing increased energy consumption in order to
ensure minimal unmet demand for both users(assuming they have equal demand priority to thedams).If the existing relatively low energy surface water
interventions are prioritised over the more energyintensive desalination option, the requirement forsupply augmentation by desalination varies accordingto whether dam water releases are regulated or not.With desalination given secondary preference to
surface water supply, the energy consumption forinterventions (a) and (c) which implement desalina-tion are listed in Table 9, while Figure 10 depicts theenergy intensities. It is noted that the energy con-sumption for intervention (a) is now similar to theequal supply priority desalination option with acontinued WC/WDM program as would occur inintervention (c). For a secondary desalination sup-ply, intervention (c) is similar in energy consump-tion to the effluent oriented intervention (d). An examination of Figure 10 highlights the
grouping of the energy intensity of the scenarios bysurface water usage.
Journal of Energy in Southern Africa • Vol 25 No 4 • November 2014 67
Figure 7: Energy intensities for the scenarios without
interventions
Figure 8: The estimated energy consumption for water
treatment in Scenario 3 with no interventions

With the surface water options prioritised, damstorage displays greater variation for the unrestrict-ed case, while unmet demands are more susceptibleto disruptions in surface inflows.This is observed by the divergence in energy
intensities for the grouping of scenarios 2 and 4 assurface water inflow is reduced. In scenario 4 anincreased reliance on desalination occurs inresponse to a reduction in supply from the dams ifdesalination favoured policy were pursued in com-bination with unregulated usage of surface waterfrom the dams.
Conclusions
The research presented here demonstrates the flex-ibility and importance of a systems approach towater resources planning. The results are indicativeof a holistic appraisal of the water and sanitationsector in the context of urban municipal water serv-ices. In specific, a strategic analysis of the energyintensity of water services, comprising a suite ofsupply and demand options, for the City of CapeTown was conducted via a systems analysis process.The value of the research presented here, it isbelieved, lies primarily in the flexibility of the sys-tems modelling approach to incorporate a multi-tude of water resources options (e.g. demand man-agement or supply augmentation) in order to eval-uate their performance by specific criteria for givenobjectives. A systems perspective or integrated assessment
further allows the examination of the interrelation-ship of the different stages of the urban water cycleand assists in identifying key linkages. For example,the effect of a WC/WDM programme on the extentof waste water reclamation; pumping energy forwater services; or the energy intensity of water orwaste water treatment for specific processes. Themodel parameters can be applied to specific infra-structure (e.g. Voelvlei WTW) or aggregated in thecase of data paucity. The scope of analysis is also adetermining factor in the necessary refinement ofparameters. For example, the energy intensity of thedistribution network can be aggregated when con-ducting a strategic appraisal. For strategic analysesthe WC/WDM options were aggregated as a poten-
68 Journal of Energy in Southern Africa • Vol 25 No 4 • November 2014
Figure 9: The relative energy intensities of the different
interventions for Scenarios 1 and 3
Table 9: Total energy consumption for the
period 2011/30 for the urban water cycle with
desalination as a secondary augmentation
option
Scenario Intervention
(a) (c)
Total (GWh) Total (GWh)
1 8684 6537
2 7877 5421
3 9163 6749
4 8122 5738
Figure 10: The energy intensity of the scenarios with surface
water supplies prioritised and sea water desalination as a
secondary supply

tial bulk yield although the model allows for a moredetailed analysis with specific emphasis on particu-lar WC/WDM measures. This may involve a bot-tom-up sectorial analysis (e.g. residential, food andbeverage industry, etc.) which would be imple-mented to gauge the impact of specific water (orenergy) efficient technologies or processes. Forexample, water demand elasticity functions can beincluded to model the response to tariffs by con-sumers and the resultant impact on water and ener-gy resources.The interventions as proposed within this analy-
sis were examined within a context of energy andwater planning for the City of Cape Town such thatenergy considerations or costing could be incorpo-rated within the long term marginal costing of futurewater and sanitation infrastructure (Ratnayaka etal., 2009). As such, the modelling process facilitat-ed an exploration of the water–energy nexus in thecontext of urban municipal water services.
ReferencesAllpass, D. (2012). City of Cape Town – Bulk Water
Branch: Energy Consumption. [14 June 2012].Cape Town.
Buckley, C., Friedrich, E. & von Blottnitz, H. (2011).Life-cycle assessments in the South African watersector: A review and future challenges. Water SA.37(5).
California Sustainability Alliance (2008). The Role ofRecycled Water in Energy Efficiency andGreenhouse Gas Reduction. California, USA:California Sustainability Alliance.
CCT (2001). Future Infrastructure Requirements. CapeTown: City of Cape Town.
CCT (2005). Water Resources and Water ResourcePlanning: Background Information for WSDP. CapeTown: City of Cape Town.
CCT (2010). Bulk Water Supply Infrastructure SummaryDescription. Cape Town: City of Cape Town.
CCT (2011). Water Services Development Plan 2011/12to 2015/16. Cape Town: City of Cape Town.
Cooley, H. & Wilkinson, R. (2012). Implications ofFuture Water Supply Sources for Energy Demands.USA: WateReuse Research Foundation.
Coetzer, P. (2012). Let’s be H2O wise. 42. Cape Town:Cape Media Corporation.
Davies, R. (2012). Eskom, Sasol sound warning overwater supply. [Online]. Available:http://mg.co.za/article/2012-03-18-eskom-sasol-sound-warning-over-water-supply [2012, 3/18].
deMonsabert, S. & Bakhshi, A. (2009). IncorporatingEnergy Impacts into Water Supply and WastewaterManagement. Washington: American Council for anEnergy Efficient Economy.
Eberhard, A. (2008). South Africa’s Power Crisis: under-standing its root causes and assessing efforts torestore supply security. Cape Town: University ofCape Town.
Eindhoven University of Technology (2006). Mini-HydroPower. Netherlands: Eindhoven University ofTechnology.
Friedrich, E., Pillay, S. & Buckley, C. (2009).Environmental life cycle assessments for water treat-ment processes – A South African case study of anurban water cycle. Water SA. 35(1).
Gaunt, T. (2010). Introduction to Electricity in SouthAfrica. Cape Town.
Jennings, L. (2012). City of Cape Town: MunicipalEnergy Consumption. August 2012]. Cape Town.
Kenway, S. et al. (2008). Energy use in the provisionand consumption of urban water in Australia andNew Zealand. Australia: CSIRO.
Larabee, J., Ashktorab, H. & Darlow, K. (2011). FromWatts to Water. USA: Santa Clara Valley WaterDistrict.
Louw, D. et al. (2012). Managing climate risk for agri-culture and water resources development in SouthAfrica: Quantifying the costs, benefits and risks asso-ciated with planning and management alternatives.Canada: International Development ResearchCentre.
Lui, F.et al. (2012). A primer on energy efficiency formunicipal water and wastewater utilities.Washington: The World Bank.
Mashoko, P. (2012). City of Cape Town: EnergyConsumption for Water and Sanitation Services. [20June 2012]. Cape Town.
Mo, W. et al. (2011). Embodied energy comparison ofsurface water and groundwater supply options.Water research. 45(17):5577-5586.
Moll, A. (2012). City of Cape Town – ReticulationBranch: Energy Consumption. [5 June 2012]. CapeTown.
Nkomo, J. & Gomez, B. (2006). Estimating andComparing Costs and Benefits of AdaptationProjects: Case Studies in South Africa and Gambia.Project No. AF 47. Washington, USA: TheInternational START Secretariat.
Ogutu, C. (2007). Water demand management optionsfor cape metropolitan area- South Africa. Pretoria:Tshwane University of Technology.
Olsson, G. (011). The urban water – energy nexus:energy efficiency along the water value chain.Sweden: Lund University.
Ratnayaka, D. et al. (2009). Twort’s Water Supply. 6thEd. Great Britain: Elsevier Ltd.
Simpson, L. (1994). MAVT and Outranking: AComparison of Two Multi-Criteria Decision AnalyticMethods, Report 94.3. United Kingdom: Universityof Leeds, Division of Operational Research andInformation Systems.
Singels, A. (2012). City of Cape Town: Bulk WaterOperations. 27 June]. Cape Town.
South African Department of Environmental Affairs(2011). White Paper on the National ClimateChange Response. Pretoria: Government Printer.
South African Department of Water Affairs and Forestry(2004). Berg WMA: Internal Strategic Perspective.Pretoria: Government Printer.
South African Department of Water Affairs and Forestry2006. Guidelines for Water Supply Systems
Journal of Energy in Southern Africa • Vol 25 No 4 • November 2014 69

Operation and Management Plans during Normaland Drought Conditions (RSA C000/00/2305),Volume 2, Appendix A: The Western Cape WaterSupply System Pilot Study. Pretoria: GovernmentPrinter.
South African Department of Water Affairs and Forestry2007a. Western Cape Water Supply SystemReconciliation Strategy Study: Scenario Planning forReconciliation of Water Supply and Requirement.Pretoria: Government Printer.
South African Department of Water Affairs and Forestry(2007b). Western Cape Reconciliation StrategyStudy: Determination of Future Water Requirements.Pretoria: Government Printer.
South African Department of Water Affairs and Forestry(2007c). Western Cape Water Supply SystemReconciliation Strategy Study: Summary Report.Pretoria: Government Printer.
South African Department of Water Affairs and Forestry(2009). The Assessment of Water Availability in theBerg Catchment (WMA 19) by Means of WaterResource Related Models: Report 4. Land Use andWater Requirements Vol. 1. Data In Support OfCatchment Modelling. Pretoria: Government Printer.
South African Department of Water Affairs and Forestry(2010). The Assessment of Water Availability in theBerg Catchment (WMA 19) by Means of WaterResource Related Models: Report No. 8. SystemAnalysis Status Report. Pretoria: GovernmentPrinter.
South African Cities Network (SACN) (2011). City ofCape Town Micro Hydro Potential Study. CapeTown: South African Cities Network.
Sparks, A. (2012). Western Cape Systems Analysis(1928-2004): before adding detailed Berg andPalmiet EWR nodes. May 2012]. Cape Town.
Stockholm Environment Institute (SEI) (2012a). Long-range Energy Alternatives Planning system. 2012.Stockholm: Stockholm Environment Institute.
Stockholm Environment Institute (SEI) (2012b). WaterEvaluation and Planning System. 3.3. Stockholm:Stockholm Environment Institute.
Stokes, J. & Horvath, A. (2006). Life-cycle EnergyAssessment of Alternative Water Supply Systems.The international journal of life cycle assessment.11(5):335.
van Herwijnen, M. (2012). Multiple−attribute value the-ory (MAVT). Netherlands: University of Amsterdam,Institute for Environmental Studies.
Vince, F. et al. (2008). LCA tool for the environmentalevaluation of potable water production.Desalination. 220(1–3):37-56.
Received 28 March 2014; revised 17 October 2014
70 Journal of Energy in Southern Africa • Vol 25 No 4 • November 2014