a tale of two central banks - federal reserve bank of new york
TRANSCRIPT

Federal Reserve Bank of New YorkStaff Reports
The Execution of Monetary Policy: A Tale of Two Central Banks
Leonardo BartoliniAlessandro Prati
Staff Report no. 165April 2003
This paper presents preliminary findings and is being distributed to economistsand other interested readers solely to stimulate discussion and elicit comments.The views expressed in the paper are those of the authors and are not necessarilyreflective of views at the Federal Reserve Bank of New York or the FederalReserve System. Any errors or omissions are the responsibility of the authors.
The Execution of Monetary Policy: A Tale of Two Central BanksLeonardo Bartolini and Alessandro PratiFederal Reserve Bank of New York Staff Reports, no. 165April 2003JEL classification: E43, E52, E58
Abstract
The Eurosystem and the U.S. Federal Reserve System follow quite different approaches tothe execution of monetary policy. The former institution adopts a “hands-off” approach thatlargely delegates to depository institutions the task of stabilizing their own liquidity at highfrequency. The latter institution follows a much more “hands-on” approach involving dailyintervention to fine-tune the liquidity of the banking system. We review the implications ofthese contrasting approaches, focusing on their impact on the high-frequency behavior ofvery short-term interest rates. We also examine interest rate behavior following the Y2Kdate change and the 9/11/2001 crisis—events that required the two central banks to deviatesignificantly from their customary style of liquidity management. We find that, despitedifferences in operational framework, certain elements of the institutions’ styles of day-to-day intervention have caused very short-term interest rates to behave similarly in the euroarea and the United States. Significantly, during periods of anticipated or actual crisis, thetwo institutions have acted very much alike in managing the liquidity of the interbankmarket in response to shocks.
Bartolini: Research and Market Analysis Group, Federal Reserve Bank of New York(e-mail: [email protected]); Prati: Research Department, International Monetary Fund(e-mail: [email protected]). This paper was presented at the 37th Panel Meeting of EconomicPolicy, held in Athens, Greece, on April 11-12, 2003. The authors thank Raymond Guiterasand Mychal Campos for excellent research assistance and Ulrich Bindseil and two refereesfor useful comments. The views expressed in the paper are those of the authors and do notnecessarily reflect those of the Federal Reserve Bank of New York, the Federal ReserveSystem, or the International Monetary Fund.
1
1. Introduction
Since the launch of European Monetary Union in January 1999, the central banks of the
world’s two largest economies—the European System of Central Banks and the U.S. Federal
Reserve—have pursued distinct approaches to the execution of monetary policy: a “hands-off”
approach for the Eurosystem, centered on delegating to depository institutions the task of
managing their own liquidity on a day-to-day basis; and a “hands-on” approach for the Fed,
centered on active involvement in the provision of the “right” amount of liquidity to markets.
Specifically, the Eurosystem has adopted a framework for monetary policy execution involving:
• a key role for reserve requirements in inducing banks to manage liquidity and stabilize short-
term interest rates independently of central bank action;
• an important role for marginal borrowing/deposit facilities, operated at the initiative of banks,
in providing liquidity to banks in response to shocks;
• infrequent (i.e., weekly) open-market intervention.
By contrast, the Fed’s operational framework involves:
• a small and diminishing role for periodic reserve requirements;
• a very limited role for marginal liquidity-management facilities;
• frequent (usually daily) open market intervention.
How have these different styles of monetary policy execution affected the behavior of
interbank markets in the euro area and the United States in recent years? Specifically, have such
differences affected the relative success of the two central banks in their day-to-day task of
stabilizing short-term interest rates and interbank liquidity? Are recent and ongoing changes in
the two banks’ policy frameworks likely to soften or deepen observed differences in behavior
between the euro area and U.S. interbank markets over the next few years?
In tackling these questions, we will keep our paper’s focus firmly on the ‘execution’
aspects of monetary policy, that is, on the set of institutions and procedures that shape central
banks’ management of money market liquidity at high (typically daily) frequency. From this
perspective, themes dear to textbook monetary analysis, such as “What are the long-term goals of
monetary policy?” or “How do policy changes transmit to inflation and output over the business
cycle?” become of secondary interest. Rather, the key questions in the analysis become: “What
2
determines daily movements of market interest rates, given the long-term goals of monetary
policy?” and “How do changes in monetary conditions transmit to financial markets on a daily
basis?” This perspective is clearly much closer to that of central banks’ open-market desks than
to that of their policy boards; closer to the perspective of financial institutions’ money managers
than to that of their CEOs; and closer, perhaps, to the perspective of scholars of financial
markets than to that of macroeconomists. An implication of this focus is that our study will not
discuss differences between the Eurosystem and the Fed in terms of broad policy frameworks or
governance, for analysis of which we refer to De Nederlandsche Bank (2001) and Ruckriegel
and Seitz (2002), among others.
With this caveat in the background, one of the main findings of our analysis is that
despite significant differences in operational frameworks between the Eurosystem and the Fed,
the interbank markets of the euro area and the United States—the main channels for monetary
policy implementation in both areas—have exhibited strikingly similar behavior in recent years,
with very short-term interbank interest rates responding very similarly to exogenous liquidity
shocks and to anticipated and realized policy changes.
We attribute this similarity in market behavior to two main factors. First, certain
ingredients of the two institutions’ style of monetary policy execution—such as the already-
strong credibility of the Eurosystem’s commitment to interest stabilization, and asymmetries in
both areas in smoothing interest rate behavior in advance of policy changes—have tended to
“undo” formal differences in policy frameworks, such as in the frequency of open-market
intervention or in the importance of reserve requirements. Second, our two central banks have
tended to respond quite similarly to large shocks to market liquidity: when it really matters—
i.e., during periods of anticipated or actual crisis—the two institutions have behaved remarkably
similarly in managing the liquidity of the interbank market in response to shocks.
2. The interbank market and the Eurosystem’s and the Fed’s operational frameworks
The interbank reserve market plays a key role in the execution of monetary policyin both the euro area and the United States. In this market, depository institutions(“banks”) lend unsecured reserves to each other, mostly at overnight maturity, to satisfyanticipated needs for liquidity—which reflect customer-originated transactions, thebanks’ own speculative purposes, and the need to satisfy reserve requirements—and to
3
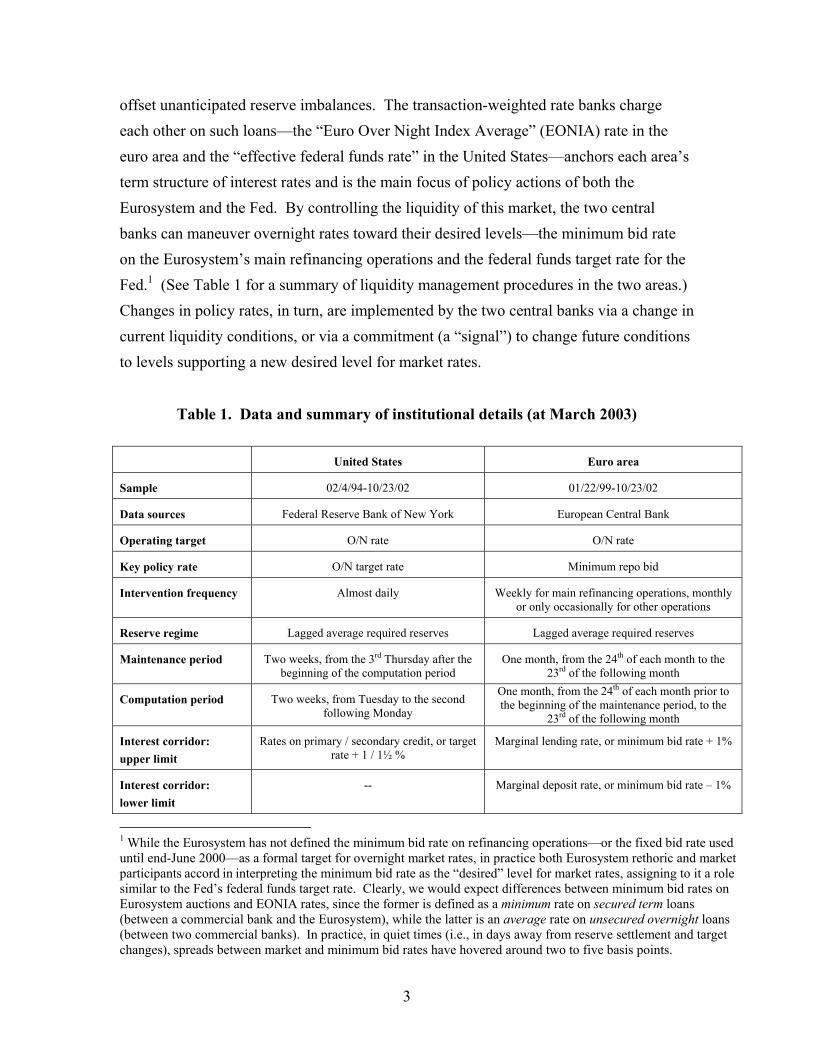
offset unanticipated reserve imbalances. The transaction-weighted rate banks chargeeach other on such loans—the “Euro Over Night Index Average” (EONIA) rate in theeuro area and the “effective federal funds rate” in the United States—anchors each area’sterm structure of interest rates and is the main focus of policy actions of both theEurosystem and the Fed. By controlling the liquidity of this market, the two centralbanks can maneuver overnight rates toward their desired levels—the minimum bid rateon the Eurosystem’s main refinancing operations and the federal funds target rate for theFed.1 (See Table 1 for a summary of liquidity management procedures in the two areas.)Changes in policy rates, in turn, are implemented by the two central banks via a change incurrent liquidity conditions, or via a commitment (a “signal”) to change future conditionsto levels supporting a new desired level for market rates.
Table 1. Data and summary of institutional details (at March 2003)
United States Euro area
Sample 02/4/94-10/23/02 01/22/99-10/23/02
Data sources Federal Reserve Bank of New York European Central Bank
Operating target O/N rate O/N rate
Key policy rate O/N target rate Minimum repo bid
Intervention frequency Almost daily Weekly for main refinancing operations, monthlyor only occasionally for other operations
Reserve regime Lagged average required reserves Lagged average required reserves
Maintenance period Two weeks, from the 3rd Thursday after thebeginning of the computation period
One month, from the 24th of each month to the23rd of the following month
Computation period Two weeks, from Tuesday to the secondfollowing Monday
One month, from the 24th of each month prior tothe beginning of the maintenance period, to the
23rd of the following month
Interest corridor:upper limit
Rates on primary / secondary credit, or targetrate + 1 / 1½ %
Marginal lending rate, or minimum bid rate + 1%
Interest corridor:lower limit
-- Marginal deposit rate, or minimum bid rate – 1%
1 While the Eurosystem has not defined the minimum bid rate on refinancing operations—or the fixed bid rate useduntil end-June 2000—as a formal target for overnight market rates, in practice both Eurosystem rethoric and marketparticipants accord in interpreting the minimum bid rate as the “desired” level for market rates, assigning to it a rolesimilar to the Fed’s federal funds target rate. Clearly, we would expect differences between minimum bid rates onEurosystem auctions and EONIA rates, since the former is defined as a minimum rate on secured term loans(between a commercial bank and the Eurosystem), while the latter is an average rate on unsecured overnight loans(between two commercial banks). In practice, in quiet times (i.e., in days away from reserve settlement and targetchanges), spreads between market and minimum bid rates have hovered around two to five basis points.

4
Historically, central banks have used three main instruments to stabilize very short-term
(overnight) interest rates: reserve requirements, intra-marginal (open-market) intervention, and
liquidity provision/absorption at marginal facilities.
Of these instruments, reserve requirements are the one most distinctly on the wane,
reflecting a worldwide trend in recent decades towards lower reserve ratios and shrinking
liabilities subject to reserve. These requirements are usually implemented on an average periodic
basis, whereby banks’ actual reserves, defined as daily averages over so-called “reserve
maintenance periods” (lasting one month in Europe and two weeks in the United States), are
required to exceed required reserves, also defined as average fractions of “reservable” liabilities
over prior “reserve computation periods.”
When binding, reserve requirements play a key role in stabilizing interest rates through
two interrelated channels. First, by forcing banks to hold a cushion against unforeseen changes
in liquidity, they help buffer the market from shocks. Second, they encourage banks to behave in
a way that tends to stabilize interest rates with no need for central bank action, since with
periodic reserve requirements, reserves held on different days of the same reserve periods are
equivalent for the purpose of meeting requirements. Hence, if banks anticipate changes in
interest rates within a reserve period, they will try to purchase reserves in days with “low” rates
and sell reserves in days with “high” rates, bidding low rates up and high rates down, until rates
are expected to remain constant within the reserve period (aside from negligible discounting).
This prediction on the effect of reserve averaging on the behavior of overnight rates,
technically known as the “martingale property” of overnight interest rates, is a powerful one and
has played a key role, historically, in support of reserve requirements as an ingredient of
monetary policy execution. When the martingale property holds in a regime of binding reserve
requirements, and banks face no impediment to holding reserves on any day of the reserve
period, the central bank need only worry about providing the right amount of liquidity on a
cumulative basis over the reserve period: interest rates should display no pattern within the
period even when reserve flows display systematic patterns (which may reflect predictable
Treasury payments, patterns in security settlements, and other systematic features of the payment
system). Accordingly, the central bank could sit out the whole reserve period, let banks bid rates
in line with the rate expected to prevail on “settlement day” (the last day of the period), and

5
intervene only once on settlement day, by providing just enough liquidity for the expected
settlement-day rate to equal its desired level for that day. This single operation would stabilize
rates perfectly, at their desired level, in all days before settlement.
Needless to say, the conditions for the martingale property to hold exactly are rarely met
in practice. In particular, reserves play roles other than satisfying reserve requirements (although
the fact that banks in most countries tend to hold actual reserves in amounts close to required
reserves is prima facie evidence of a significant binding role of reserve requirements). Also,
banks face a variety of institutional and business-related costs when attempting to shift reserves
between days to exploit predictable changes in interest rates. Indeed, several studies of interbank
markets have provided strong statistical evidence that the martingale property fails in the main
industrial countries’ money markets.2 Nevertheless, deviations from the martingale property
tend to be economically small in magnitude, and the sophisticated econometrics generally
required to identify them is, in a way, proof of how close this property comes to being satisfied
in most markets and, therefore, of the potential interest-stabilizing role of reserve requirements.
2.1. The Eurosystem’s operational framework
When work on the operational framework of the Eurosystem began in 1994, the interest-
stabilizing properties of reserve requirements, which had played a key role in the execution of
monetary policy of most EMU legacy countries, were clearly in the mind of EMU designers.
Equally pressing were the costs associated with reserve requirements as traditionally designed:
by holding unremunerated reserves in their accounts at the central bank, banks forego lending
such reserves in the market at a positive rate:3 “Some members found reserve requirements with
an averaging mechanism to be an essential part of the framework in order to enlarge the
structural liquidity deficit of the banking sector and stabilize the overnight market rate without
the need for frequent recourse to open market operations. By contrast, others considered them to
be in conflict with the principle of market orientation.” (Hamalainen, 2000).
2 See Hamilton (1996) and Balduzzi et al. (1998) for the U.S. market, Perez-Quiros and Rodriguez-Mendizabal(2000) and Bindseil and Seitz (2001) for the euro area market, and Prati et al. (2002) for multi-country evidence.3 For instance, Borio (1997) estimates seignorage from reserve requirements in 1996 at 0.01 percent of GDP inFrance and the United States, 0.04 percent of GDP in Germany, and 0.12 percent of GDP in Italy. In addition, banksface administrative costs of managing reserve requirements and deadweight losses associated with portfoliodistortions needed to meet reserve requirements.
6
Eventually, what had become the thorniest point in the design of EMU’s operational
framework was resolved by letting the Eurosystem remunerate banks’ required reserves at a rate
close to market (namely, at the average official repo rate over the reserve period).4 By doing so,
the average cost of holding reserves was reduced essentially to zero, but its marginal cost was
kept positive (equal to the interbank rate), thus preserving the incentive for banks to act to
stabilize rates. In addition, banks were required to maintain non-negative end-of-day reserve
accounts—a common requirement for industrial country banks, including U.S. banks.
With reserve requirements established as the first plank of the Eurosystem’s frame-
work, the foundation for a hands-off approach to monetary policy execution was laid.
The next element in the framework was a schedule of infrequent open-market operations,
aimed at steering the overnight interest rate towards its desired level, currently the
minimum accepted bid rate (formerly the fixed bid rate) on main refinancing operations.
Eurosystem open-market intervention, executed in decentralized fashion by
national central banks under ECB guidance, involves two main types of operations:
“main” refinancing operations, normally injecting liquidity into the market, and usually
executed every Tuesday via two-week repos with next-day settlement; and “longer-term”
operations, normally executed at a monthly frequency with a maturity of three months.
As in the operational framework of EMU legacy countries (as well as in the framework
of most other industrial countries), these operations carry the burden of managing market
liquidity,5 and may occasionally be supplemented by other open-market instruments.6
The third main ingredient of the liquidity-management framework of the Eurosystem
consists of marginal facilities at penalty rates—a deposit facility at below-market rate and a
borrowing facility at above-market rate—operated at the initiative of banks without restriction on
amounts borrowed or deposited (other than placement of acceptable collateral against borrowed
funds). These facilities operate as safety valves against aggregate liquidity shocks occurring too
4 By contrast, required reserves did not change much from the pre-EMU level, falling from an average of about 2percent of GDP (Escriv< and Fagan, 1996) to about 1½ percent of GDP for EMU.5 One measure of such predominance, the ratio of the standard deviation of intra-marginal liquidity flows tothe standard deviation of marginal liquidity flows, shows that only Austria and Australia among the mainindustrial countries have relied more on marginal than on intra-marginal facilities to manage interbankliquidity (Borio, 1997).6 These instruments include “fine-tuning operations,” executed through repos, outright purchases and sales ofsecurities, foreign exchange swaps, and collection of fixed-term deposits, and “structural operations,” alsoimplemented through repos, outright transactions, and issuance of debt certificates.

7
late in the day or in the reserve period for the central bank to intervene. They also help the
Eurosystem in its role of intermediary in settling liquidity imbalances among banks. For
instance, banks with negative end-day reserve accounts are automatically referred to the
marginal lending facility to cover imbalances. Conversely, banks with excess reserves can
deposit funds to limit the cost of an excess reserve position. Because the facilities are
unrestricted, and no bank would borrow or lend in the market if it could obtain more favorable
rates directly from the central bank, the rates on the marginal facilities provide an effective,
symmetric corridor of fluctuation for market rates around the Eurosystem’s key policy rate.7,8
Altogether, this operational framework was certainly consistent with—in the words of
Issing et al. (2001)—a “European model” of monetary control, the goal of which was to limit the
presence of the central bank in the open market by minimizing the need for fine-tuning
operations. In designing this regime, the policy regimes of the main pre-EMU central banks
clearly worked as the status quo, deviations from which required strong justification: “It was
agreed that [...] continuity with the current practices of the national central banks should be
respected to the extent that this did not conflict with the other participants.” (Hamalainen, 2000).
2.2. The Fed’s operational framework
In reaching its current framework for monetary policy execution, the Fed has followed a
path that seems, at first glance, to have involved a certain amount of experimentation. For
instance, after introducing a regime with fully lagged reserve “maintenance” and “computation”
periods in 1968, in 1984 the Fed shifted to a regime of almost-contemporaneous reserve
accounting, largely reflecting a view that money aggregates could be controlled better if required
and actual reserves were determined simultaneously. In July 1998 the Fed returned to a regime
of lagged reserve accounting, lagging the maintenance period by 30 days (instead of only two
days) with respect to the computation period. This time, the change was aimed at reducing the
volatility of excess reserves by pre-determining required reserves, even though the major source
of variability—Treasury flows affecting actual reserves—was not affected by the reform. In
7 In principle, given that transactions in the interbank market are unsecured, the overnight rate could exceedthe marginal lending rate in the presence of significant counterparty risk in the interbank market.8 In implementing this corridor, the Eurosystem broke partly with the tradition of its EMU precursors. Among these,only the central banks of Austria, Belgium, France, and Italy had implemented some sort of interest rate corridors,
8
recent times, the Fed has also experimented with different timings for daily intervention, moving
from 11:30 to 10:30 a.m. in 1997, and then to 9:30 a.m. in 1999, in an attempt to schedule open
market operations at the time of deepest market liquidity. It has also followed, at different times,
different strategies for communicating its perceived “bias” or “balance of risk” underlying future
policy moves.
In fact, we would characterize the evolution of the Fed’s monetary execution procedures
less as a case of trial and error than as a case of adaptation to the evolution of the market and of
the Fed’s own philosophy about the goals of monetary policy. The Fed’s decreasing reliance on
reserve requirements as an instrument for monetary control since the beginning of the 1990s
provides an especially suggestive example. Until 1990, the Fed’s reliance on reserve requirements
was comparable—in terms of reserve ratios and eligible liabilities—to those of most other
industrial countries (outside the United Kingdom). At the end of 1990, however, the Fed
lowered requirements on non-transaction deposits to zero, thereby promoting a major decline in
required reserves. Additionally, in January 1994 the Fed clarified its regulation of deposit
accounts, effectively sparking a dramatic growth in retail sweep accounts—banks’ practice to
“sweep” overnight balances from liabilities subject to reserve requirement, such as checking
accounts, to liabilities free of requirement, such as money market accounts (see Figure 1).
As a result of these developments, required reserves in the United States have declined
from $60 billion in 1989 to $37 billion in 2002. 9 At the same time, a growing fraction of
banks—especially smaller, local banks—has been able to satisfy reserve requirements in full by
holding cash,10 thus becoming effectively unbound by requirements (Bennett and Peristiani,
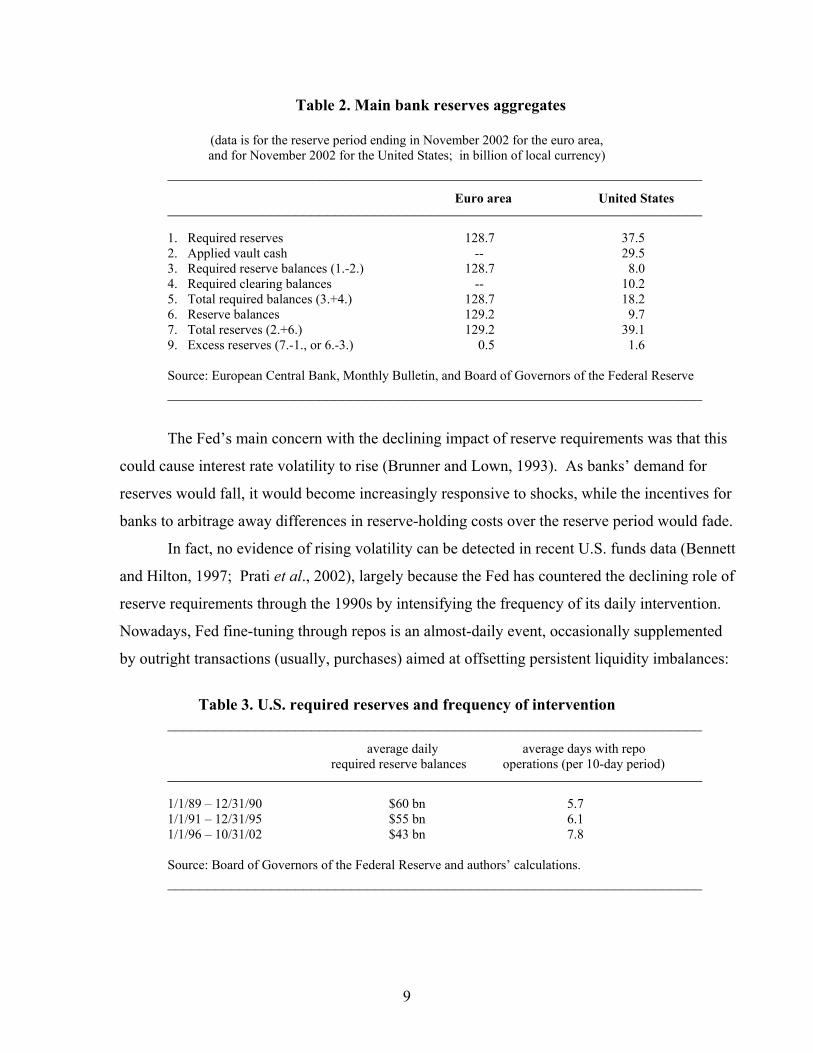
2002). This situation contrasts sharply with that of the euro area—see the summary in Table 2—
where a deposit market of comparable size is associated with an amount of reserve balances a
dozen times larger.
although without fully self-enforcing features such as those of the Eurosystem, namely, unconstrained, overnightborrowing and lending at posted rates.9 These amounts exclude “clearing balances,” a reserve-like requirement to which U.S. banks must pre-commit, andfor which they are compensated by credits usable to purchase services provided by the Fed.10 Unlike in the euro area, cash is admitted as reserve in the United States.
9
Table 2. Main bank reserves aggregates
(data is for the reserve period ending in November 2002 for the euro area,and for November 2002 for the United States; in billion of local currency)
___________________________________________________________________Euro area United States___________________________________________________________________
1. Required reserves 128.7 37.52. Applied vault cash -- 29.53. Required reserve balances (1.-2.) 128.7 8.04. Required clearing balances -- 10.25. Total required balances (3.+4.) 128.7 18.26. Reserve balances 129.2 9.77. Total reserves (2.+6.) 129.2 39.19. Excess reserves (7.-1., or 6.-3.) 0.5 1.6
Source: European Central Bank, Monthly Bulletin, and Board of Governors of the Federal Reserve___________________________________________________________________
The Fed’s main concern with the declining impact of reserve requirements was that this
could cause interest rate volatility to rise (Brunner and Lown, 1993). As banks’ demand for
reserves would fall, it would become increasingly responsive to shocks, while the incentives for
banks to arbitrage away differences in reserve-holding costs over the reserve period would fade.
In fact, no evidence of rising volatility can be detected in recent U.S. funds data (Bennett
and Hilton, 1997; Prati et al., 2002), largely because the Fed has countered the declining role of
reserve requirements through the 1990s by intensifying the frequency of its daily intervention.
Nowadays, Fed fine-tuning through repos is an almost-daily event, occasionally supplemented
by outright transactions (usually, purchases) aimed at offsetting persistent liquidity imbalances:
Table 3. U.S. required reserves and frequency of intervention___________________________________________________________________
average daily average days with repo required reserve balances operations (per 10-day period)___________________________________________________________________
1/1/89 – 12/31/90 $60 bn 5.71/1/91 – 12/31/95 $55 bn 6.11/1/96 – 10/31/02 $43 bn 7.8
Source: Board of Governors of the Federal Reserve and authors’ calculations.___________________________________________________________________

10
In contrast with the Eurosystem, the Fed has not relied significantly on marginal facilities
to stabilize interbank rates within a corridor over the past fifteen years. The Fed’s main
emergency lending facility—the discount window—effectively ceased to operate in the late-
1980s, when a series of episodes of financial distress, beginning with the crisis of Continental
Illinois in 1984, left U.S. banks reluctant to borrow from the window, for fear that borrowing
could be perceived as a signal of financial weakness.11 As a result, discount borrowing has been
near zero since the late 1980s, except in occasions such as the aftermath of the terrorist attacks of
September 2001.12 Similarly, U.S. banks have been reluctant to use other lines of Fed credit,
such as end-day account overdrafts or end-period reserve deficiencies. At the opposite end, the
Fed offers no deposit facility to U.S. banks seeking to minimize the cost of excess reserves,
beyond limited scope for rolling excess reserves over to subsequent reserve periods. As a result,
only the lower bound of zero operates effectively as a floor for U.S. interbank rates.
Altogether, the Fed’s operational framework displays sharp differences with that adopted
by the Eurosystem, emphasizing an active role for the central bank in fine-tuning market
liquidity through open-market operations, a minimal role for marginal borrowing at the initiative
of banks, and a fading role for reserve requirements. In the next section, we examine how these
differences have shaped the behavior of overnight interest rates in the two areas.13
3. The behavior of overnight rates in the euro area and in the United States 3.1. The empirical model
We now study the behavior of overnight interest rates in the euro area and the United
States, with a view to linking differences in interest rate behavior between the two areas to
differences in monetary policy execution between the respective central banks.
11 In administering discount loans, the Fed also displayed a more hands-on approach than the Eurosystem’s approachto marginal lending. With a discount rate normally set below market, the Fed has rationed loans and pledged toverify that banks seeking credit had no access to other sources of financing and were not re-lending funds borrowedat the window. By contrast, the Eurosystem—with a marginal lending rate set above market—has relied only on aprice-based mechanism, offering funds (against collateral) without rationing, at the sole initiative of banks.12 We review later in this paper the reform of credit facilities implemented by the Fed in January 2003.13 Our synopsis overlooks other features, such as differences in the collateral base for lending operations (which iswider for the Eurosystem), and procedures for changing policy rates, including on days away from policy-settingmeetings, which are very similar in the two areas. Specifically, the ECB’s Governing Council, normally meetingevery other Thursday, can consult on short notice to change rates between meetings. Similarly, the FOMC meets
11
Our empirical model, details of which are provided in Appendix A, is conceptually
similar to those adopted in recent research on money markets by Hamilton (1996), Balduzzi et
al. (1998), and Prati et al. (2003), among others. The model assumes that the overnight interest
rate in day t, measured as the difference from the current key policy rate, equals its (time-
varying) mean plus its (time-varying) volatility multiplied by an error term:
rate (t) = mean rate (t) + volatility (t) * error (t) .
The mean rate itself evolves over time as a function of exogenous factors. These include
dummy variables for each day of the week; dummies for month-end, quarter-end, and year-end
days and for days preceding and following these days; dummies for days preceding and
following holidays; dummies for each day of the reserve period (counted backward from
settlement day); and past, contemporaneous, and future changes in policy rates to assess the
impact of such changes on market rates in the preceding and following days.
The volatility term also evolves in response to its determinants, which include dummies
for each week-day, month-end, quarter-end, and year-end days; dummies for days preceding and
following holidays; dummies for each day of the reserve period; a dummy for the first day of
each period in the euro area (which is independent of the previous dummy, because of varying
length of the euro area’s reserve period); and a dummy for days in which a policy rate changes.
As in standard EGARCH models, we allow volatility to behave stochastically, with an
empirically determined speed of reversion to its steady state. We also allow interest rates to
respond asymmetrically to positive and negative shocks.
We estimated this model using data on transaction-weighted interbank rates for the euro
area and the United States (the EONIA and the effective federal funds rate, respectively) and on
the two areas’ key policy rates (the minimum bid rate and the fixed rate on main refinancing
operations for the euro area, and the target federal funds rate for the United States; see Figure 2
for a plot of the raw data.) The euro area sample begins January 22, 1999 and ends October 23,
2002. (We dropped all data from January 1 to January 21, 1999, during which time the
Eurosystem experimented with a narrow 50 basis point corridor for market rates.) The U.S.
sample begins on February 4, 1994, when public announcements of federal funds rate targets
eight times per year, but can act to change rates between meetings. In practice, intra-meeting changes in policy ratesare infrequent in both areas.
12
began, and also ends on October 23, 2002. To estimate the model, we assumed the error terms to
be distributed as Student t variables, so as to capture the observed fat tails of interest rate
distributions, and estimated the model by maximum likelihood using numerical optimization.
3.2. Results
Figures 3 - 5 and Table 4 report the results of our estimation, for which a final
specification was obtained by retaining only variables statistically significant at the 10 percent
level.14 Specifically, while Figures 3 - 5 plot our main results, which relate to differences in
policy execution between the two areas, Table 4 includes details of secondary and more technical
results. These include, among other results, evidence of high rates around holidays and end-
quarters in both areas (likely reflecting end-quarter surges in payments and window-dressing
effects) and evidence of time-varying and persistent volatility (which, in the United States, we
also found to respond asymmetrically to positive and negative shocks).
The most interesting results highlighted by our empirical work pertain to the behavior of
market rates around policy rates and over a typical reserve period. It is useful, in this respect, to
discuss the behavior of interest rates around dates of policy changes (distinguishing between
“anticipation” and “announcement” effects of policy changes on market rates), separately from
the behavior of interest rates over a typical reserve maintenance period (“reserve period” effects).
3.2.1 Anticipation effects
The behavior of market rates in days preceding policy changes provides a good starting
point to assess a central bank’s commitment to its operational task of stabilizing the interbank
rate around its desired level. In general, banks anticipating a change in the policy rate before the
end of a reserve period will bid market rates away from the current level towards the new,
anticipated level of the policy rate, as they try to hold more reserves before a rate hike than
afterwards (and vice versa for an anticipated rate cut).
A central bank could respond passively to this behavior by disregarding the intra-perioddeparture of market rates from their desired level and continuing to provide a smooth flow of
14 Day-of-the-week and day-of-the-maintenance-period dummies were retained if jointly significant at the10 percent level in Wald tests. We always retained all the EGARCH parameters.
13
reserves. Alternatively, it could seek to counteract such behavior by skewing reserve provisionwithin the period, e.g., by injecting funds before a rate hike and withdrawing them afterwards.Hence, the extent to which market rates “anticipate” future policy changes will reflect a centralbank’s propensity to lean against the wind by altering the time profile of reserve provision, aswell as its disposition to show its hand regarding planned policy changes.
Note that periodic reserve requirements play a key role in supporting such “anticipationeffects” by linking current rates to expected future rates via banks’ attempt to take advantage ofinterest rate gaps over the reserve period. From this viewpoint, differences between Eurosystemand Fed frameworks suggest that anticipation effects should be stronger in the euro area than inthe United States. First, given its option to intervene every day, the Fed enjoys ample scope tokeep market rates near target, until a target change is actually implemented, by injecting liquidityinto the market prior to a target hike and mopping up liquidity afterwards. Second, the shorter(two week) U.S. reserve period eases the Fed’s task of leaning against expected target changes:only changes expected over (up to) the next two weeks cause significant pressure on marketrates. The Eurosystem has a tougher task, given its commitment to infrequent intervention andto longer (one month) reserve periods, which let expectations of rate changes up to one monthahead push overnight rates away from their currently-desired level.
To assess the importance of anticipation effects in our data, we estimated our model byincluding actual policy rate changes as regressors in our mean equations in the days precedingeach change. Because policy changes are known in advance only up to a forecast error, theseregressors’ estimated coefficients tend to zero the more uncertain are market participants aboutthe policy change and the more the central bank manages liquidity to keep market rates close tothe current target in advance of the change. To allow for asymmetric responses, we estimateseparate coefficients for phases of policy tightening and policy loosening.
Figure 3 shows the estimated cumulative response of the overnight rate to an upcomingpolicy change. These estimates confirm significant anticipation effects in both the U.S. and euroarea markets. Most interestingly, in both markets anticipation effects are stronger during phasesof policy tightening, with a particularly long lead during the tightening phase of 1999-2000 in theeuro area. Specifically, in the United States, target rate changes are usually preceded by gradualmovements of market rates towards the new target beginning three days before a target hike, andtwo days before a target cut. Moreover, anticipation of target hikes not only starts earlier but isalso stronger: by the time the Fed implements a target hike, 60 percent of the change is usuallyalready reflected in market rates. The corresponding measure for target cuts is only 30 percent.
14
In the euro area, the asymmetry in behavior between policy tightening and policy
loosening is even more acute. As simple inspection of the data indicates (see Figure 2), policy
rate hikes have been anticipated with much longer leads than policy rate cuts.15 As our estimates
confirm, only 20 percent of the latter have been typically anticipated in market rates, while the
corresponding estimate for rate hikes is about 55 percent, much of which was anticipated as early
as the beginning of the reserve period in which the hike took place, with some weak evidence of
anticipation effects in the previous reserve period.16
The significance of anticipation effects in the United States and the euro area reveal that
neither the Fed nor the Eurosystem is managing liquidity tightly enough to prevent all deviations
of overnight rates from their desired level in the presence of expected policy changes. A policy
of this type may reflect the objective of smoothing liquidity provision over time. For instance, a
recent study (Ejerskov et al. 2003) has concluded that the ECB assigns a significant importance
“to providing liquidity in a smooth and neutral manner.” Similarly, the fact that the Fed does not
intervene literally every day in the market is evidence that liquidity smoothing plays some role in
its monetary execution strategy.17 However, as Table 3 suggests, this inertia has recently
declined, suggesting a declining role for liquidity smoothing by the Fed in recent years.
Additionally, the asymmetric response of market rates to anticipated policy rate hikes and
cuts suggest investigating political-economy considerations that may lead central banks to
provide liquidity asymmetrically during policy-tightening and policy-loosening phases. Our
estimates show that in both markets the surprise content of rate cuts was more significant than
that of rate hikes. This evidence is consistent with a strategy that policy rate hikes already
justified by “fundamentals” may be delayed—or smaller rate increases than expected may be
implemented—than it is the case for corresponding policy cuts. After all, policy tightening has
never been as popular as policy loosening.
15 In addition, as market participants anticipated rate hikes that did not occur in the 1999-2000 period, theyhad to rebalance reserves on the last day of each reserve period, causing the large down-swings in theEONIA at settlement observed in the 1999-2000 period.16 The short euro area sample made individual coefficients for the tightening phase unstable and difficult toestimate. To overcome this difficulty, we estimated a separate coefficient for the day preceding a targetchange (13 percent) and an average coefficient for all the previous days in the same reserve period (1.9percent per day, implying an anticipation effect of 41 percent). By estimating an average coefficient alsofor the reserve period preceding a target change, we found a further anticipation effect of 3 percent; thisestimate was not statistically significant, however.17 An older study of the Fed’s liquidity management strategy (Feinman, 1993) argues that the Fed may havedisplayed inertia in the 1980s in response to small shocks.

15
There is, however, a feature of the Eurosystem’s monetary framework that can also
explain the observed asymmetric response to anticipated policy rate cuts and hikes. This feature
reflects the interaction between the Eurosystem’s preference for smooth provision of liquidity
over time with a specific format for Eurosystem auctions, in an environment of structural deficit
reserve position for euro area banks.18 To understand this interaction, consider first the
equilibrium response of rates in Eurosystem auctions to an anticipated policy rate hike, when the
central bank does not accommodate fully the higher demand for reserves resulting from this
anticipation, because that would require excessive skewing of liquidity within the reserve period.
In this case, the equilibrium auction rate rises above the current policy rate (either the fixed
tender rate used in Eurosystem auctions until June 2000, or the minimum bid rate used
afterwards). Scarce liquidity allocated at the auction, in turn, lifts the equilibrium interbank rate
up towards the new, anticipated policy rate.
Consider next the response of equilibrium auction and interbank rates to an expected
policy rate cut. In this case, auction participants would like to bid below the current minimum
(or fixed) rate, since that rate is expected to fall and there is no reason to borrow funds now at a
rate higher than that expected to prevail later. However, bids below the floor (until June 2000,
the fixed bid rate; afterwards, the minimum bid rate) are rejected. Bidders will then respond by
under-subscribing the auction to keep the equilibrium auction rate at its minimum. The resulting
reduction in liquidity allocated to the interbank market keeps interbank rates from falling in
advance of the rate cut. Effectively, the minimum (or fixed) tender rate acts as a floor for market
rates. Thus, while anticipated increases in policy rates result mostly in a rise of market rates,
anticipated rate cuts result mostly into a decline in reserves and little change in interest rates, in
accord with our estimated behavior of interbank rates prior to Eurosystem policy rate changes.
Why has the fixed rate on Eurosystem auctions not acted as a ceiling for market rates in
anticipation of rate hikes, in the same way that the minimum bid rate has acted as a floor in
anticipation of rate cuts? The answer rests on two facts: i) binding reserve requirements
typically place euro area banks in a structural (reserve) deficit position, so that Eurosystem
intervention normally involves an injection of reserves; and ii) the Eurosystem rationed the
reserves injected at the fixed-rate repo auctions. Under these circumstance, euro area banks are
18 We thank an anonymous referee for calling our attention to the asymmetry induced in market rates by the formatof the Eurosystem’s refinancing auctions. Detailed studies of the impact of Eurosystem auctions on the euro area
16
normally able to absorb less reserves than the Eurosystem wishes to inject (by underbidding in
auctions), but cannot hold more reserves than desired by the central bank. (The opposite would
be true for a banking system in a structural surplus position.) As a result, while market forces
will automatically keep the interbank rate near the (minimum or fixed) tender rate when a rate
cut is expected, only sufficient injection of reserves by the central bank will keep market rates
near the tender rate when a rate hike is expected.
3.2.2. Announcement effects
The extent to which market rates depart from their desired level in the aftermath of a
policy change is also instructive of a central bank’s liquidity-management style.
On its own account, a change in a policy (or ‘target’) rate is only a commitment by the
central bank to alter current and future liquidity to levels supporting the new target. For
overnight market rates actually to adjust to the new target, market participants must believe that
the central bank will validate this new level by providing adequate funds through the end of the
reserve period. If the credibility of this commitment is limited, the market rate may fail to
adjust—or adjust only partially—to the newly announced policy rate.
To study the response of market rates to changes in policy rates, we included actual
changes in policy rates as determinants of mean market rates in days of policy changes and in n
subsequent days (including up to all days in the same reserve maintenance period). The estimated
coefficients for these regressors (α0,…, αn in the Appendix) show the fraction of policy rate
changes reflected in market rates 0,…, n days after a change, respectively.
In interpreting these estimates, we begin by noting that the fraction α0 of policy rate
changes reflected in effective market rates on the same day of a policy change is not a very
informative statistic. Since policy changes in both areas are normally announced in the middle
of the trading day, effective rates for these days aggregate both pre-change and post-change
transactions, causing policy changes to yield smaller-than-one estimates for α0 even in the
absence of anticipation effects and with instantaneous adjustment of rates to the new target.
It is more interesting to examine how long it takes for market rates to adjust fully to their
new desired level. Our estimates indicate that this lag is minimal in both the United States and
interbank market include Bindseil (2002) and Würtz (2003).
17
the euro area: the only coefficients that we included in the final specification were α0 and α1,
since all other αi (i>1) coefficients were never statistically significant. These results imply that
market rates adjust to the new desired level within a day after a policy change in both areas
(Figure 3). In the United States, same-day and next-day announcement effects sum to 44 percent
during the policy-tightening period and to 73 percent during the policy-loosening period,
reflecting the greater role played by anticipation effects in the former period. Similarly, in the
euro area, same-day and next-day announcement effects sum to 32 percent during the policy-
tightening period and to 72 percent during the policy-loosening period.
Our estimated rapid announcement effects are intuitive for the United States: the Fed
usually begins to intervene the morning after a target change and can reinforce its commitment to
the new target by intervening every day through the end of the reserve period. The same result is
more surprising for the euro area, where policy changes are normally announced on Thursdays,
and remain nothing more than a commitment until the following Tuesday’s operation. Also, the
Eurosystem executes (on average) only a pair of operations between the day of a policy change
and settlement day, leaving relatively little scope for experimenting with liquidity injections and
withdrawals at the new rate. All said, we consider the rapid adjustment of euro area market rates
to policy changes to be the clearest sign of the speed with which the Eurosystem has earned
credibility among market participants since its inception in 1999, and of the clear signaling role
played by its main policy rate in anchoring and stabilizing market rates.
3.2.3. Reserve period effects
Finally, our estimation allows us to examine the cyclical behavior of euro area and U.S.
interest rates over a typical reserve period. Our goal is to identify patterns in interest rates that
reveal our two central banks’ propensity to lean against shocks from the non-bank sector and
against patterns in rates induced, inadvertently, by reserve requirements.
One particular pattern that has attracted attention in previous research is the tendency of
overnight rates to rise at the end of reserve periods. This pattern has been documented in data
for both the United States (Hamilton, 1996; Bartolini et al. 2001; Clouse and Dow, 2002) and
the euro area (Perez-Quiros and Rodriguez-Mendizabal, 2000; Bindseil and Seitz, 2001). As
with other predictable patterns in mean rates, a systematic rise in rates at settlement is potentially
relevant for policy, because it indicates that banks fail to treat reserves held on different days as
18
perfect substitutes, and that the central bank has failed to offset higher demand for funds on
specific days of the reserve period. (Higher rates at settlement, in particular, have been
interpreted as reflecting frictions such as transaction costs and penalties on overnight overdrafts,
leading banks to accumulate the bulk of their reserves at the end of the period.)
Contrasting previous research, our estimates show only weak evidence of reserve-related
patterns in mean rates in both areas. Euro area rates tend to fall slightly until the day before
settlement, and rise approximately seven basis points at settlement. U.S. rates are somewhat
high on the two Mondays of each reserve period (that is, seven and two days before settlement)
and on settlement days. This evidence is summarized in the top panels of Figure 4, which
display estimates of the reserve period mean coefficients tmd . (As discussed below, the main
reason for the difference between our results and those of previous research can be traced to
differences in samples and, in recent years, to more aggressive efforts by the two central banks to
offset previously-observed patterns in rates.)
In contrast with the broadly non-cyclical behavior of mean rates, we find that interest
volatility displays sharp cyclical patterns in both areas, as documented in the top panels of Figure
5. In the figure, the reserve-period effects on the standard deviation of interest rate shocks (the
coefficients 'tm
d in the Appendix) are plotted as ratios of the standard deviation on settlement
day. These estimates show a striking similarity between the qualitative behavior of interest rate
volatility over the reserve period in the euro area and in the United States. In both areas,
volatility is sharply higher on settlement days than on previous days. In both areas, interest
volatility also begins to rise towards its settlement-day level in advance of settlement: 2 days in
advance of settlement in the United States and 4 days in advance of settlement in the euro area.
To interpret these findings, recall that high settlement-day volatility is a direct effect of
periodic reserve requirements: at settlement, individual banks scramble to unload excess reserves
or fill reserve shortages. When the banking sector as a whole shows a reserve imbalance at
settlement, interbank rates must adjust to induce banks to absorb such imbalance.
Rising volatility prior to settlement, instead, is indicative of a central bank’s unwilling-
ness (or inability) to provide unlimited quantities of funds at a fixed price in response to liquidity
shocks to the banking sector. Banks need not lay pressure on interest rates prior to settlement, if
they expect the central bank to intervene before period-end to eliminate current reserve
imbalances. In this case, interest volatility should remain relatively low and constant through the
19
last-but-one day of the maintenance period, and spike only on settlement day. If, however, the
central bank does not fully offset aggregate shocks experienced by banks during the reserve
period, then shocks recorded before settlement will be partially reflected as end-period
imbalances, the more so the closer to settlement they occur. Interest volatility will then rise
gradually as settlement approaches, in accord with our estimates for both our sample markets.
There are many reasons why a central bank may be reluctant to offset aggregate liquidity
shocks completely.19 The most relevant issue for us, however, is that the Eurosystem has
adopted a schedule of once-per-week intervention, which usually requires executing the last
operation of each reserve period several days before settlement. In this case, interest rate
volatility is clearly expected to spread from settlement days to previous days.
From this viewpoint, the surprising aspect of our estimation is the absence of even greater
differences in volatility behavior between the two areas. Unlike the Eurosystem, the Fed has
retained the option of offsetting shocks to banks’ liquidity at high frequency. Our analysis
reveals that—historically at least—the Fed seems to have been reluctant to use this flexibility
fully although, as discussed below, the cyclical behavior of volatility has weakened greatly in
recent data. Also, the Fed’s frequent intervention schedule helped smooth U.S. interest rate
volatility over the reserve period, but—with all obvious caveats in place when conducting cross-
country quantitative comparisons—has not led to less volatile interest rates than in the euro area.
Indeed, while settlement-day volatility is quantitatively similar in the two areas (the mean
absolute median difference of settlement-day interest rate changes is about 25 basis points in
both areas), non-settlement-day volatility is less than one-tenth of its settlement-day level in the
euro area, but only about half of its settlement-day level in the United States. As a result, away
from settlement, euro area rates are less volatile than U.S. rates.
19 Among these, central banks are often reluctant to undertake very large repos, fearing that the underlyingcollateral market might be unduly stressed. This is a concern that the Fed had clearly in mind when itrescheduled its operations around the time of deepest liquidity of the Treasury market, and which provedespecially relevant in the wake of the large operations executed after September 11, 2001. Central banksare also often reluctant to respond fully to large shocks, fearing the need to take opposite action at a latertime, a practice that has been felt could provide mixed signals of the central bank’s policy stance. Finally,and perhaps more binding for the Fed in recent years, a central bank may be reluctant to undertake largeoperations because these may pressure banks against their daily overdrafts limits: a large reserve drain in asingle day may tighten the market as banks scramble to avoid daily overdraft limits; a large injection maysoften the market, as banks try to avoid excess reserves that may be difficult to unwind before settlement.

20
4. Crisis, and Ongoing Changes in the Eurosystem’s and the Fed’s Frameworks
Ultimately, a central bank’s behavior during ordinary business days may be less
important than its behavior during crises—events with potential for wreaking havoc in a
country’s payments and financial system. Historically, financial crises have also often spurred
changes in central banks’ frameworks that have carried well beyond emergency periods and
affected central banks’ conduct during ordinary business days as well.
For better or worse, during its short life the Eurosystem has already witnessed two
landmark crisis episodes, spanning in important ways the taxonomy of emergencies potentially
facing a central bank. The first episode, the Millennium (or “Y2K”) date change, provides a rare
example of a fully anticipated shock that was believed to have the potential to cause major
disruption to the world’s financial infrastructure. The second episode, the September 11 terrorist
attack, provides a textbook example of a completely unanticipated shock, which caused
substantial disruption in the global financial system and required prompt central bank action to
prevent even more significant damage to the U.S. and euro area’s financial structure.
How did the Fed and the Eurosystem flex their policy frameworks to deal with these two
episodes? Did they behave in these circumstances in more or less similar fashion than during
ordinary business days?
A review of the Eurosystem’s and Fed’s actions in the periods surrounding the two
episodes reveals two key common ingredients in the two institutions’ recipes for responding to
(threatened or actual) crisis:20 first, the provision of an extraordinary amount of liquidity to
markets, as insurance against liquidity shortages to banks and non-banks; and, second, effort to
organize and execute policy so as to minimize its potentially destabilizing impact on markets
(especially the market for underlying collateral). Interestingly, in combining these ingredients
during the unfolding of the Y2K and September 11 episodes, the Eurosystem and the Fed have
behaved in remarkably similar fashion. Prompted in part by these same crisis episodes, the two
institutions are also implementing changes in their operational frameworks that are likely to lead
to even greater similarity in monetary policy execution in the two areas in the next few years.
20 The two institutions have provided detailed information on actions taken to stem the financial impact ofboth crises. Our main sources of information were various issues of the ECB Monthly Bulletin and PressReleases for the Eurosystem, and various issues of the Federal Reserve Bank of New York’s Annual Reporton Domestic Open Market Operations for the Fed.

21
The Y2K date change provides an especially instructive example of the effort undertaken
by the two central banks to manage liquidity in (potentially) thin money and collateral markets.
In the run-up to the date change, the two institutions’ main concern was that Y2K-related bugs
could cause widespread information system failures which could prevent execution of payments
and settling of accounts, and ultimately lead to drying up of trading and shortage of liquidity for
both banks and non-banks. To address this concern, the Fed moved to provide liquidity
aggressively in advance of the date change,21 and to expand the set of collateral accepted for
liquidity-injecting repurchase agreements (notably, to include securities issued by government-
sponsored enterprises and other government-backed securities). At the same time, the Fed tried
to minimize the risk of a crunch of potentially destabilizing operations in the days surrounding
the date change by lengthening the maximum maturity of repos from 60 to 90 days, a move that
allowed it to enter, well in advance of year-end, into transactions expiring beyond January 1.
The Eurosystem acted similarly. To avoid conducting operations in the proximity of the
date change, it shortened the term of its September 30 longer-term operation, moving its maturity
from December 30 to December 23. It also lengthened the term of the December 22, 1999 and
December 30, 1999 operations to three weeks, so as to prevent any operation from maturing on
the first week of the year, and committed not to launch any main refinancing operation in the
first week of 2000. At the same time, the Eurosystem expanded significantly the average size of
its December 1999 operations, so that loans outstanding around the date change rose loans by
about 40 billion of euros (or about 20 percent) above their September-November 1999 norm.
Liquidity injection was much more dramatic, in both areas, in response to the terrorist
attacks of September 2001. The Fed used virtually all channels at its disposal to provide an
unprecedented amount of liquidity to the interbank market. Flexible administration of the
discount window lifted discount loans from a typical daily amount of a few hundred million
dollars to $18 billion on September 11 and to $46 billion on September 12. Massive temporary
operations, for $38 billion on September 12, $70 billion on September 13, and $81 billion on
September 14 (compared to a typical amount of between $2 and $6 billion), raised reserve
balances to the record level of $100 billion. The Fed also accommodated an extraordinary
21 The Fed stepped up liquidity provision effort beginning in October 1999, when forward rates on contractsexpiring after the date change began to rise. By combining standard operations and forward repos (a type ofoperation rarely used before), the Fed added liquidity until December 31. Outstanding repos rose to $141

22
amount of float,22 up to $47 billion on September 13 and, on September 17, it lowered its target
rate by ½ percent to 3 percent.23
Although the Eurosystem did not face as dramatic a market disruption as the Fed, it acted
promptly nonetheless “to support normal functioning of markets” (ECB Press Release,
September 11, 2001). On September 12, it implemented only the second liquidity-providing
fine-tuning operation in its history: a one-day, quick tender at the fixed rate of 4.25 percent
without pre-specified allotment amount,24 which provided 69 billion euro to the market. Another
one-day quick tender at the fixed 4.25 percent rate was implemented on September 13, injecting
40 billion euro. After following the FOMC and lowering its main refinancing rate from 4.25
percent to 3.75 percent on September 17, the Eurosystem implemented its (regularly scheduled)
main refinancing operation on September 19 for 71 billion euro, effectively withdrawing funds,
since 82 billion euro were in expiration. By that date, liquidity conditions in the euro area had
returned essentially to normal.
What is especially interesting of the two institutions’ liquidity management response to
the two crisis episodes is that neither the anticipated (but never occurring) Y2K crisis nor the
unanticipated (but tragically occurring) September 2001 crisis were examples of classic “banking
crises” induced by a sudden loss of confidence in the solvency of the banking system or of a set
of financial institutions. The immediate problem confronting the Fed and the Eurosystem during
the Y2K date change, and especially the Fed during the September 2001 crisis, was not one of
aggregate liquidity shortage, but rather one of liquidity dislocation, reflecting (actual or
anticipated) breakdown in payments systems and the coexistence of institutions unable to unload
excess funds with other institutions awaiting for funds and in need to cover their position. Yet,
in both cases, the Fed and the Eurosystem opted for an asymmetric response, assigning a large
weight to the risk of liquidity shortage faced by banks in need of funds, and acted to prevent the
liquidity squeeze from spilling across banks and to the non-bank sector. The time-honored
principle that a central bank’s best response to major tumult is to flood the market with liquidity
billion on the date change (far above the previous $52 billion record of April 1997), while total liquiditypeaked at some $80 billion above norm.22 “Float” refers to items in course of processing, and typically causes double counting of items credited torecipient institutions before they are debited to issuing institutions.23 On September 13 the Fed also agreed to new or expanded swap lines with the ECB, the Bank of England,and the Bank of Canada. Only the ECB drew on its $50 billion line, for up to $19 billion on September 13.24 Another liquidity-providing quick tender had been implemented on June 21. By contrast, the quick-tenderimplemented on January 5, 2000, was a liquidity-draining operation.
23
prevailed on both sides of the Atlantic, despite differences the Eurosystem and the Fed might
have displayed in dealing with less dramatic shocks to liquidity in non-emergency days.
Interestingly, some of the changes in policy execution that were implemented (especially
in the United States) to cope with the two crises, have since become a more permanent fixture of
the liquidity management toolkit of the two institutions.
In the United States, two main changes in monetary framework have occurred since
1999, both of which are bound to help closing the gap with how the Eurosystem executes policy
in the euro area. First, after expanding the set of collateral accepted for temporary operations in
the run up to Y2K, the Fed has continued to accept a broader pool of collateral for its repos.25
This choice brings the Fed marginally closer to the practice of the Eurosystem, which accepts a
very broad class of securities as collateral, including—unlike the Fed—private sector securities.26
Second, and more interesting, after experimenting from October 1999 to April 2000 with
the “Century Date Change Special Liquidity Facility,” a lending program that allowed banks to
borrow funds in accord with traditional European-style practice (loans were granted at penalty
rates, with no limit on banks’ use of borrowed funds nor any requirement for banks to seek funds
elsewhere first), a closely related lending program was implemented beginning on January 9,
2003. The new program replaces the Fed’s main discount window program and offers “Primary”
and “Secondary” collateralized credit to banks on a “no question asked” basis, at premium rates
over the target federal funds rate.27 Like the Eurosystem’s marginal borrowing facility, the new
program is expected to act to limit market rate fluctuations above target in times of market
tightness. At the time of writing, only a few weeks of loan data have been generated by the new
program (showing an average of $20 million in outstanding loans). Clearly, the new facility’s
chances of success hinge on its ability to assuage banks’ reluctance to borrow for fear that such
decision may reveal a weak financial condition. A possible concern is that as long as a bank
25 While the Y2K date change provided scope for experimenting with a broader collateral base, the choiceto expand such base permanently was in large part aimed to facilitating policy execution in an environmentwith a shrinking supply of Treasury securities. Meanwhile, the urgency of the latter problem has abated.26 Two factors seem to explain the acceptance of a broad class of collateral by the Eurosystem (including,currently, about 20,000 marketable securities). First, a desire to smooth the transition from the pool ofsecurities accepted as collateral in pre-EMU countries. Second, a concern parallel to that prevailing in theUnited States: to assure that “sufficient collateral with the desired characteristics should be available to theEurosystem’s counterparties in order to allow the Eurosystem to supply the required amount of liquidity inthe system” (Mastroeni, 2000).27 Depository institutions deemed to be financially sound are eligible for primary credit at 1 percent abovetarget; the other institutions are eligible for secondary credit at 1½ percent above target.
24
perceives a decision to borrow from the Fed as revealing information on its financial conditions,
it may be even more reluctant to borrow from the new facility at a penalty rate than it was to
borrow from the discount window at a subsidized rate.
Across the ocean, on January 5, 2000 the Eurosystem utilized for the first time a U.S.-
style, same-day-settlement fine-tuning measure—a one-week fixed-term collection of deposits—
to mop up the liquidity stockpiled in the market in preparation for the date change. In fact, since
then, the Eurosystem has used fine-tuning measures in a handful of occasions—a slight change
in intervention style that has not required amending the policy framework, which was designed
from the outset to allow for a great deal of choice among different intervention tools. This small
sample hardly establishes a trend, yet the Eurosystem seems to be growing more comfortable
with off-schedule, quick-settlement operations that are in common use in the United States.
Clearly, the most widely-acclaimed change in the Eurosystem’s framework since its
inception in 1999 has been the switch from a fixed-rate to a variable-rate-with-minimum-bid
format for refinancing auctions on June 28, 2000. This switch, as intended, eliminated the severe
problems of overbidding that had marred previous Eurosystem auctions.28 As we discuss below,
it may also have stabilized the Eurosystem’s liquidity provision to the interbank market, although
our discussion in Section 3 suggests that problems of interest rate instability in the euro area in
advance of policy rate hikes in 1999-2000 were unlikely to reflect the specific fixed-rate format:
both fixed-rate and minimum-rate auctions are bound to induce upward drifting of market rates
when policy tightening is expected.
In part to address problems of interest rate instability induced by its own operational
framework, in January 2003 the ECB announced its plan (to become effective in 2004) to
synchronize the beginning of each maintenance period with the settlement of the first main
refinancing operation following the policy-setting meeting of the ECB Council (usually held on
the first Thursday of each month). This change is intended to mitigate the destabilizing role of
expected policy changes, which would become effective only on the first day of the following
reserve period. (Our estimation suggests that this goal is likely to be achieved: most policy
changes are anticipated within the same maintenance period in which they occur.) 29
28 See Ayuso and Repullo (2001) and Oechssler and Nautz (2001) for a detailed analysis of the overbiddingphenomenon in Eurosystem fixed-rate auctions.29 Also, the maturity of the main financing operations will be shortened from two weeks to one week, so asto keep the liquidity impact of each operations within the current reserve period.
25
Thus, partly in response to episodes of market instability, partly (especially for the
Eurosystem) as a manifestation of a process of learning how to operate in a new and rapidly
evolving market, both central banks have implemented a number of changes to their operational
frameworks in recent years. To provide preliminary evidence on how such changes have
affected market behavior in the two areas, we followed a simple event-study methodology, and
split our data into “early” and “late” samples to study differences in the behavior of interest rate
means and volatilities and in the associated liquidity management strategies between the two
samples. We set the break-points for the two samples at the times of the main operating changes
in the two areas—the shift from fixed-rate to minimum-bid-rate auctions in June 2000 for the
euro area, and the switch from (almost) contemporaneous to lagged reserve requirements in
August 1998 for the United States—, knowing well that this split may end up capturing other
policy-driven and autonomous changes in market behavior between the two periods as well. We
then re-estimated the model separately over each sub-sample, using the same methodology
described in the previous section.
The main results from our sample-broken estimations are reported in Figures 4-6.30
The first item highlighted in Figure 4 is that the split-sample estimation allows us to
reconcile our findings of essentially acyclical behavior of mean rates, discussed in the previous
section, with previous evidence of market-tightening around settlement. Our estimates reveal
evidence of a sharp up-turn in rates near settlement for the euro area in the ‘early’ sample
(middle panels of Figure 4), consistent with the findings of Perez-Quiros and Rodriguez-
Mendizabal (2000) and Bindseil and Seitz (2001), as well as for the U.S. sample, consistent with
the findings of Hamilton (1996) and others. Over our ‘late’ samples, however, this evidence has
all but disappeared in both areas (bottom panels in Figure 4).
Could this change in interest rate behavior be related to changes in liquidity management
by the Fed and the ECB? Liquidity supply data, plotted in Figure 6, shows that both banks—
especially the Fed—have moved aggressively in the later sample to skew liquidity supply to
offset market tightness around settlement. In the earlier sample, the Fed typically increased its
supply of liquidity over the last three days of the period by about six percent of required
reserves; in the later sample, the increase in liquidity over the last three days of the period was
about 25 percent of required reserves. Similarly, the Eurosystem moved from tightening
30 Detailed results from the sample-split estimations are available from the authors upon request.
26
liquidity by about two percent of required reserves in the last five days of the period in the earlier
sample to increasing liquidity by about four percent of required reserves in the later sample.
Our split-sample analysis also documents interesting changes in interest volatility after
the Eurosystem shifted to variable-rate auctions in June 2000. Specifically, while the qualitative
behavior of volatility over the reserve period was essentially unchanged from the pre-June 2000
to the post-June 2000 period (see the two bottom-left panels in Figure 5), there was an overall
decline in volatility from the earlier to the later sample: the mean absolute median difference of
daily interest rate changes fell from 0.077 (about 8 basis points) in the earlier sample to 0.056 in
the later sample, suggesting that the change in auction format may have enhanced the
Eurosystem’s ability to control the liquidity of the interbank market.31 As for the U.S.
experience, results for which are also plotted in Figure 5, the most interesting feature highlighted
by our split-sample estimates is of a substantially weaker cyclical behavior of volatility in the
“late” sample, likely reflecting more aggressive and frequent intervention by the Fed and the
weakening in reserve requirements from the earlier period discussed in Section 2.
5. Conclusions
We conclude by addressing a question of more general relevance. Why is it important for
central banks to stabilize very short-term interest rates, when deviations of such rates from their
desired level tend to display little persistence, disappearing in most cases within a few days?
Rather than providing an answer of our own to this question, we queried several open-
market officials and received answers that included: i) the interbank market is a major source of
funds for many financial institutions, and high-frequency changes in interest rates may have
significant repercussions on banks’ borrowing costs; ii) open market desks are responsible for
keeping market rates near their desired level; failure in this simple endeavor may have negative
repercussions for the central bank’s reputation in its other roles, such as that of financial
supervisor; iii) interest volatility has an adverse effect on the effectiveness of the interbank
market as intermediary of funds among banks and the non-bank sector; iv) interest volatility is a
symptom of deeper ills, including misallocation of liquidity among financial institutions and
31 The decline in volatility is significant at the 0.03 level or less, according to standard non-parametric tests.Needless to say, comparison of overall volatility across samples provides only prima facie evidence on the

27
uncertainty about the future course of monetary policy; v) interest volatility complicates central
banks’ job by blurring signals sent by the market on its own liquidity conditions.
While no single one of these arguments convinces us entirely, we accept that each has
played a role, at different times in recent decades, in causing industrial countries’ central banks
to tinker with their monetary policy framework, so as to find better ways to stabilize very-short-
term interest rates around levels dictated by longer-term monetary objectives. This evolution has
led the central banks of the world’s two main currency areas—the Eurosystem and the Fed—to
adopt two rather different frameworks for their day-to-day execution of policy: a more “hands-
off” approach for the Eurosystem, centered on largely delegating to depository institutions the
task of stabilizing their own liquidity at high frequency; and a more “hands-on” approach for the
Federal Reserve, involving daily intervention to fine-tune the liquidity of the banking system.
Despite these differences in formal frameworks, we find that certain ingredients of the
two institutions’ style of monetary policy execution have significantly mitigated differences in
market behavior between the two areas. For instance, although the Fed has retained fully the
option of offsetting shocks to banks’ liquidity at high frequency, it has not used this flexibility
fully—historically at least—to stabilize pre-settlement interest volatility, nor to keep rates tightly
close to their pre-change target before a target change. On the other hand, although the
Eurosystem’s framework leaves little scope for daily fine-tuning, the quickly-earned credibility
of the central bank’s commitment to interest rate stabilization and the intertemporal smoothing
induced by reserve requirements have allowed the Eurosystem to stabilize interest rates
effectively and reap essentially all the ‘announcement effect’ benefits of policy changes. Also,
asymmetries in both central banks’ provision of liquidity in advance of policy rate hikes and cuts
have induced qualitative similarities in the behavior of market rates in advance of policy
changes. Most importantly, perhaps, in times of crisis both central banks have displayed a
remarkable willingness to make full use of the flexibility offered by their monetary frameworks
for day-to-day liquidity management, and behaved in very similar fashion to secure the stability
of the domestic financial system.
effect of a policy shift, since it does not separate the volatility effect of the policy shift from possiblechanges in volatility of autonomous flows across samples.

28
Appendix. The econometric model
The EGARCH model outlined in the text is essentially in the style of Nelson (1991). We
begin by measuring interest rates as differences between daily effective (i.e., transaction
weighted) overnight rates and contemporaneous key policy rates, denoting these difference by
r~ t. We then assume:
tr~ = µt + σt υt , (1)
µt = 1~
−tr + tmd +
twd + tcd + α0 ∆ *
tr + … + αn ∆ *ntr − + φ1 ∆ *
1+tr + …+ φm ∆rt+m* , (2)
ln(σ 2t ) = λln(σ 2
1−t ) + (1-λL)(tmd ' +
twd ' + tcd ' +
tpd ' ) + εt . (3)
In (2) and (3), mt = T,…1,0, counts days until the end of the maintenance period at t; wt =
Monday, ..., Friday, is a week-day pointer at t; ct is a pointer to other calendar days (end months,
end quarters, days before and after one, two, and three-day holidays) at t; tmd ,
twd , and tcd in
the mean equation, and tmd ' , twd ' , and
tcd ' in the variance equation, are the corresponding
dummies for reserve period, weekday, and other calendar effect coefficients;32 tpd ' is a dummy
for days in which a policy rate changed; L is the lag operator; υt is a mean-zero, unit variance,
i.i.d. error term; and α0,…, αn and φ1,…, φm are coefficients associated with policy rate changes
occurring, respectively, 0,..., n days earlier and 1,..., m days later, respectively.
Because of limits on banks’ ability to carry reserve imbalances to future maintenance
periods (some carryover is permitted in the United States but not in the euro area), we must allow
for first-day coefficients in the mean equation to differ from other days’ coefficients. We do so
by interacting the coefficients in (2) with a first-day dummy.
We model the shock in the variance equation as 11 || −− + tt θννκ , allowing the effect on
the variance of positive and negative shocks to differ when θ is different from zero. In
estimation, we approximated the absolute-value function || 1−tν , as in Andersen and Lund, 1997,
by setting |||| tt νν = for kt 2/|| πν > and kk tt /))cos(5.0(|| νπν −= for kt 2/|| πν < , setting
k=20. Analysis of the residuals led us to an EGARCH(1,1) model for both countries.
32 In the United States, maintenance periods always end on Wednesdays, so the coefficients are not separatelyidentified. In the euro area, the maintenance period is linked to calendar months. One linear restriction then sufficesto identify both weekday and maintenance period effects (we use Σwt=0).

Table 4
Estimated parameters not included in Figures 3-5(standard errors in parentheses; ** and * indicate significance at 5% and 10% level)
Euro area United StatesMean Variance Mean Variance
Monday 2.593(4.192)
Tuesday1 0.286 (0.208)
Wednesday1 0.720 ** (0.219)
Thursday1 0.084 (0.221)
Friday1 0.422 **(0.205)
First day of the 5.746 **maintenance period (0.517)
Day in which target rate changes 0.990 **(0.325)
End of months 1,2,4,5,7,8,10,11, 2.196 **or the previous and following days (0.382)
End of quarter, or the previous 3.709 ** 1.838 **and following days (0.521) (0.201)
End of year, or the previous 3.207 ** 1.574 ** and following days (0.590) (0.413)
Day before end of month 0.013 *(0.007)
End of month 0.052 ** 0.078 **(0.006) (0.007)
Day after end of month -0.033 ** -0.038 **(0.006) (0.008)
End of quarter 0.088 ** 0.167 **(0.014) (0.026)
Day after end of quarter -0.105 ** -0.095 **(0.014) (0.032)
End of year 0.280 ** -0.788 **(0.134) (0.054)
Day after end of year -0.322 ** 1.162 **(0.074) (0.069)
Day before 1-day holiday 1.273 **(0.367)
Day after 1-day holiday 1.286 **(0.394)
Day before 3-day holiday -0.024 **(0.008)
Day after 3-day holiday 0.202 ** 0.541 **0.011 (0.273)
Degrees of freedom 2.182 ** 2.374 **of the t-distribution (0.201) (0.167)
EGARCH parameters:
α 1.596 ** 1.244 **(0.767) (0.226)
δ 0.810 ** 0.554 **(0.029) (.039)
χ 0.098 0.434 **(0.112) (0.097)
1 Mean difference from Monday (basis points).

Figure 1U.S. transaction balances swept into money market deposits
0
100
200
300
400
500
600
1994 1995 1996 1997 1998 1999 2000 2001 2002 2003
reserve period
cum
ulat
ive
tota
l of i
nita
l am
ount
s (b
illio
ns o
f U.S
. dol
lars
)
Source: Board of Governors of the Federal Reserve
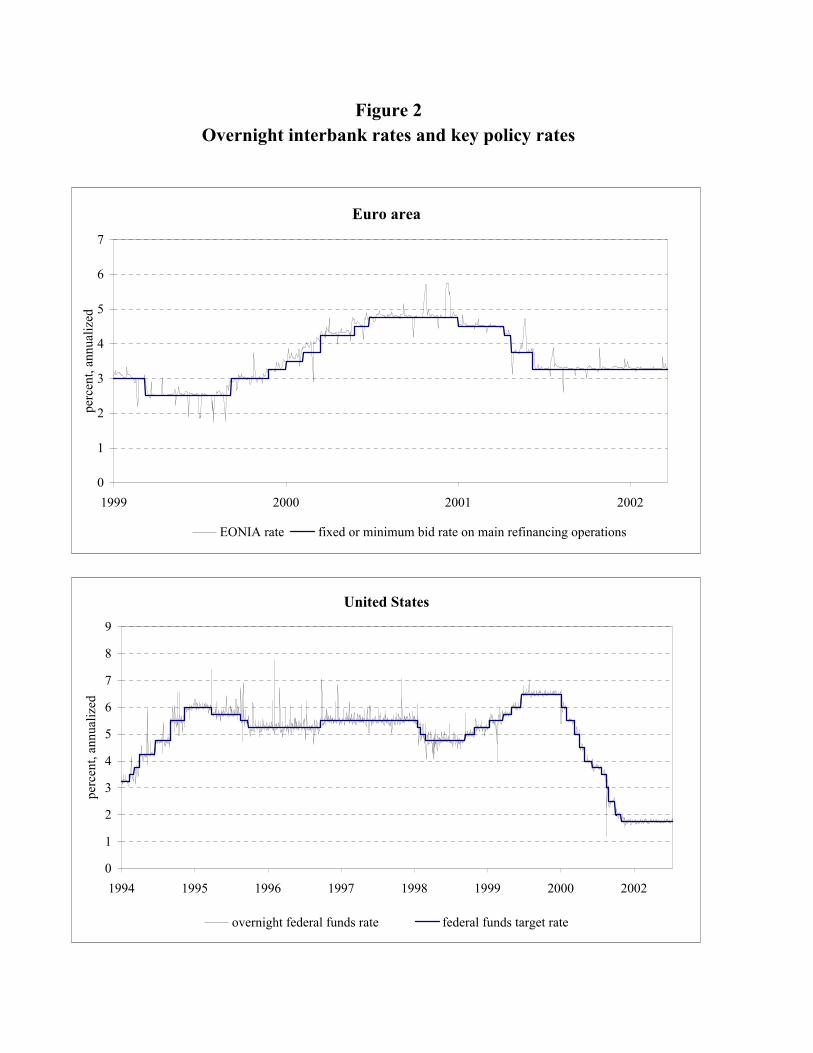
Overnight interbank rates and key policy ratesFigure 2
Euro area
0
1
2
3
4
5
6
7
1999 2000 2001 2002
perc
ent,
annu
aliz
ed
EONIA rate fixed or minimum bid rate on main refinancing operations
United States
0
1
2
3
4
5
6
7
8
9
1994 1995 1996 1997 1998 1999 2000 2002
perc
ent,
annu
aliz
ed
overnight federal funds rate federal funds target rate

Figure 3Estimates of anticipation and
announcement effects of policy rate changes
United States
0
0.2
0.4
0.6
0.8
1
1.2
t = -4 t = -3 t = -2 t = -1 t = 0 t = +1 t = +2
cum
ulat
ive
frac
tion
of ta
rget
ch
ange
s inc
orpo
rate
d in
mar
ket r
ates
rate hike
rate cut
Euro area
0
0.2
0.4
0.6
0.8
1
1.2
t = -47 t = -24 t = -2 t = -1 t = 0 t = +1 t = +2
cum
ulat
ive
frac
tion
of ta
rget
ch
ange
s inc
orpo
rate
d in
mar
ket r
ates
rate hike
rate cut

Euro area United States
Mean overnight interest rate by day of the reserve periodFigure 4
Full sample:January 22, 1999 - October 23, 2002
-30-25-20-15-10
-505
101520
22 20 18 16 14 12 10 8 6 4 2 0
days to the end of the maintenance period
mea
n di
ffere
nce
from
the
first
day
of t
he p
erio
d(b
asis
poi
nts)
Full sample:February 4, 1994 - October 23, 2002
-20
-15
-10
-5
0
5
10
9 8 7 6 5 4 3 2 1 0
days to the end of the maintenance period
mea
n di
ffere
nce
from
the
first
day
of t
he p
erio
d(b
asis
poi
nts)
January 22, 1999 - June 28, 2000
-30-25-20-15-10
-505
101520
22 20 18 16 14 12 10 8 6 4 2 0
days to the end of the maintenance period
mea
n di
ffer
ence
from
th
e fir
st d
ay o
f the
per
iod
(bas
is p
oint
s)
February 4, 1994 - July 31, 1998
-20
-15
-10
-5
0
5
10
9 8 7 6 5 4 3 2 1 0
days to the end of the maintenance period
mea
n di
ffere
nce
from
th
e fir
st d
ay o
f the
per
iod
(bas
is p
oint
s)
June 29, 2000 - October 23, 2002
-30-25-20-15-10
-505
101520
22 20 18 16 14 12 10 8 6 4 2 0
days to the end of the maintenance period
mea
n di
ffere
nce
from
th
e fir
st d
ay o
f the
per
iod
(bas
is p
oint
s)
August 3, 1998 - October 23, 2002
-20
-15
-10
-5
0
5
10
9 8 7 6 5 4 3 2 1 0
days to the end of the maintenance period
mea
n di
ffer
ence
from
th
e fir
st d
ay o
f the
per
iod
(bas
is p
oint
s)
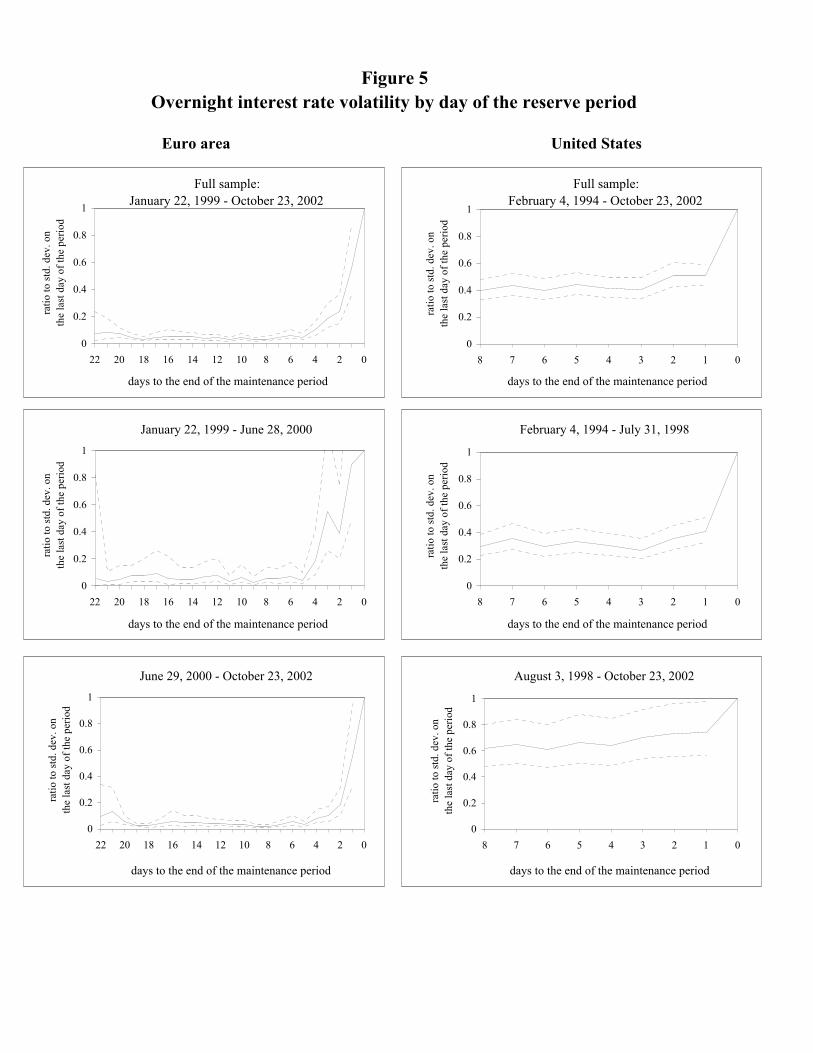
Euro area United States
Overnight interest rate volatility by day of the reserve periodFigure 5
Full sample:January 22, 1999 - October 23, 2002
0
0.2
0.4
0.6
0.8
1
22 20 18 16 14 12 10 8 6 4 2 0
days to the end of the maintenance period
ratio
to st
d. d
ev. o
n th
e la
st d
ay o
f the
per
iod
Full sample:February 4, 1994 - October 23, 2002
0
0.2
0.4
0.6
0.8
1
8 7 6 5 4 3 2 1 0
days to the end of the maintenance period
ratio
to st
d. d
ev. o
n th
e la
st d
ay o
f the
per
iod
January 22, 1999 - June 28, 2000
0
0.2
0.4
0.6
0.8
1
22 20 18 16 14 12 10 8 6 4 2 0
days to the end of the maintenance period
ratio
to st
d. d
ev. o
n th
e la
st d
ay o
f the
per
iod
February 4, 1994 - July 31, 1998
0
0.2
0.4
0.6
0.8
1
8 7 6 5 4 3 2 1 0
days to the end of the maintenance period
ratio
to st
d. d
ev. o
nth
e la
st d
ay o
f the
per
iod
June 29, 2000 - October 23, 2002
0
0.2
0.4
0.6
0.8
1
22 20 18 16 14 12 10 8 6 4 2 0
days to the end of the maintenance period
ratio
to st
d. d
ev. o
n th
e la
st d
ay o
f the
per
iod
August 3, 1998 - October 23, 2002
0
0.2
0.4
0.6
0.8
1
8 7 6 5 4 3 2 1 0
days to the end of the maintenance period
ratio
to st
d. d
ev. o
nth
e la
st d
ay o
f the
per
iod
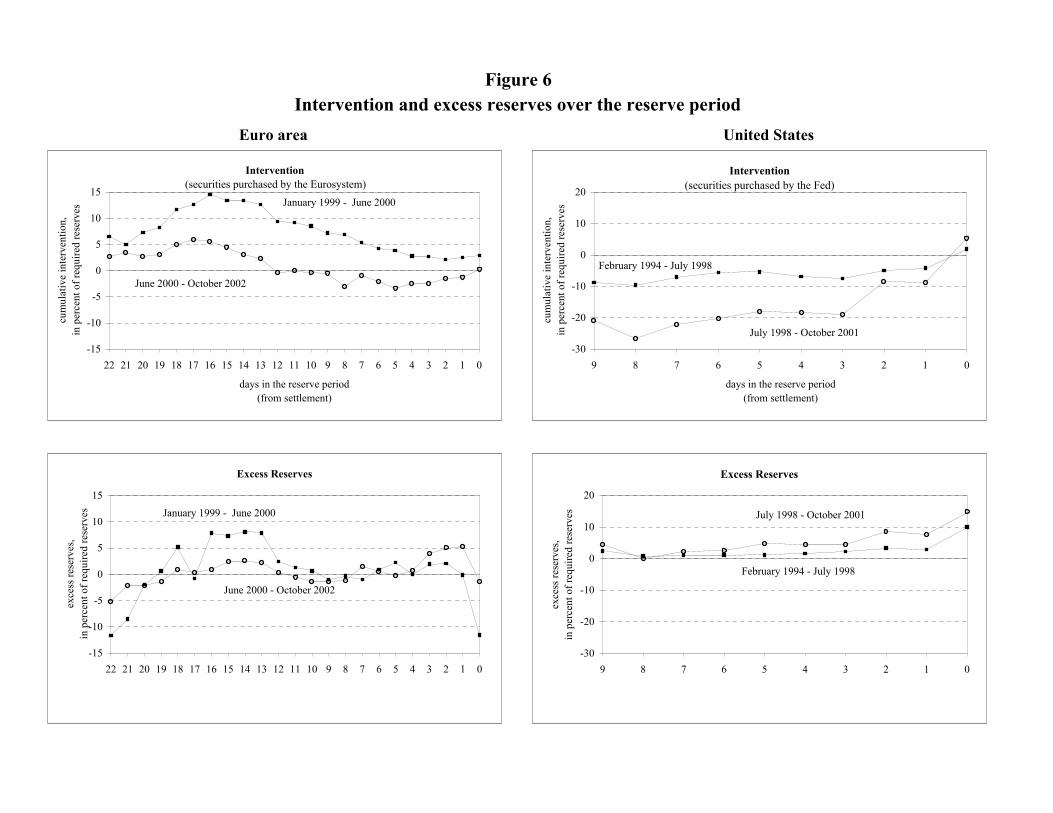
Euro area United States
Figure 6Intervention and excess reserves over the reserve period
Intervention(securities purchased by the Fed)
-30
-20
-10
0
10
20
9 8 7 6 5 4 3 2 1 0
days in the reserve period(from settlement)
cum
ulat
ive
inte
rven
tion,
in
per
cent
of r
equi
red
rese
rves
July 1998 - October 2001
February 1994 - July 1998
Intervention(securities purchased by the Eurosystem)
-15
-10
-5
0
5
10
15
22 21 20 19 18 17 16 15 14 13 12 11 10 9 8 7 6 5 4 3 2 1 0
days in the reserve period(from settlement)
cum
ulat
ive
inte
rven
tion,
in
per
cent
of r
equi
red
rese
rves
June 2000 - October 2002
January 1999 - June 2000
Excess Reserves
-30
-20
-10
0
10
20
9 8 7 6 5 4 3 2 1 0
exce
ss re
serv
es,
in
per
cent
of r
equi
red
rese
rves July 1998 - October 2001
February 1994 - July 1998
Excess Reserves
-15
-10
-5
0
5
10
15
22 21 20 19 18 17 16 15 14 13 12 11 10 9 8 7 6 5 4 3 2 1 0
exce
ss re
serv
es,
in
per
cent
of r
equi
red
rese
rves
June 2000 - October 2002
January 1999 - June 2000
29
References
Andersen, Torben G., and Jesper Lund (1997) “Estimating Continuous-Time StochasticVolatility Models of the Short-term Interest Rate,” Journal of Econometrics 77,343-377.
Angelini, Paolo (2002), “Liquidity and Announcement Effects in the Euro Area,” Bancad’Italia, manuscript.
Ayuso Juan, and Rafael Repullo (2001), “Why Did the Banks Overbid? An EmpiricalModel of the Fixed Rate Tenders of the European Cental Bank,” Banco deEspana, Working Paper No. 0105.
Balduzzi, Pierluigi, Giuseppe Bertola, Silverio Foresi, and Leora Klapper (1998),“Interest Rate Targeting and the Dynamics of Short-Term Rates,” Journal ofMoney, Credit, and Banking 30, 26-50.
Bennett, Paul, and Spence Hilton (1997) “Falling Reserve Balances and the Federal Funds Rate,”Federal Reserve Bank of New York, Current Issues in Economics and Finance 3:5.
Bennett, Paul, and Stavros Peristiani (2002) “Are U.S. Reserve requirements Still Binding?”Federal Reserve Bank of New York Economic Policy Review 8:1, pp. 53-68.
Bindseil, Ulrich, and Franz Seitz (2001), “The Supply and Demand for Eurosystem Deposits:The First 18 Months,” European Central Bank, Working Paper No. 44.
Bindseil, Ulrich (2002), “Equilibrium Bidding in the Eurosystem’s Open Market Operations,”ECB Working Paper No. 137.
Blenck, Denis, Hasko, H., Hilton, Spence, and K. Masaki (2001), “The Main Features ofthe Monetary Policy Frameworks of the Bank of Japan, the Federal Reserve andthe Eurosystem,” in Comparing Monetary Policy Operating Procedures acrossthe United States, Japan, and the Euro Area, BIS Paper New Series No. 9,December 2001, pp. 23-47.
Borio, Claudio E. V. (1997), “Monetary Policy Operating Procedures in Industrial Countries,” inImplementation and Tactics of Monetary Policy, BIS Conference Papers Vol. 3, Basle,pp. 286-368.
Borio, Claudio E.V. (2001), “A Hundred Ways to Skin a Cat: Comparing MonetaryPolicy Operating Procedures in the United States, Japan and the Euro Area,” inComparing Monetary Policy Operating Procedures across the United States,Japan, and the Euro Area, BIS Paper New Series No. 9, December 2001, pp. 23-47.
30
Brunner, Allan D., and Cara S. Lown (1993), “The Effect of Lower Reserve Requirements onMoney Market Volatility,” American Economic Review, Papers and Proceedings 83,199-205.
Clouse, James A., and James P. Jr. Dow (2002), “A Computational Model of Banks' OptimalReserve Management Policy,” Journal of Economic Dynamics and Control 26, pp. 1787-1814.
Demiralp, Selva, and Oscar Jord< (2002), “The Announcement Effect: Evidence from OpenMarket Desk Data,” Federal Reserve Bank of New York Economic Policy Review 8:1,pp. 29-48.
De Nederlandsche Bank (2001), “A Comparative Study of the Federal Reserve System and theESCB,” Quarterly Bulletin, March, pp. 55-64.
Ejerskov, Steen, Clara Martin Moss, and Livio Stracca (2003), “Demand and Supply in theECB’s Main Refinancing Operations,” European Central Bank, manuscript.
Escriva, J.L., and G.P. Fagan (1966), “Empirical Assessment of Monetary Policy Instrumentsand Procedures in EU Countries,” EMI Staff Papers No. 2, Frankfurt, May.
European Central Bank (1988), The Single Monetary Policy in Stage Three: GeneralDocumentation on ESCB Monetary Policy Instruments and Procedures, Frankfurt,September.
European Central Bank (1999), “The Role of the Operational Framework of the Eurosystem:Description and First Assessment,” in ECB Monthly Bulletin, May.
European Central Bank (1999), “The Institutional Framework of the European System of CentralBanks,” in ECB Monthly Bulletin, July, pp. 55-63.
European Central Bank (2002), “The Liquidity Management the ECB,” in ECB MonthlyBulletin, May, pp. 41-53.
Feinman, Joshua N. (1993), “Estimating the Open Market Desk's Daily Reaction Function,”Journal of Money, Credit, and Banking 25, pp. 231-427.
Gaspar, Vitor, PJrez-Quir\s, Gabriel, and Jorge Sicilia (2001), “The ECB Monetary PolicyStrategy and the Money Market,” International Journal of Finance and Economics 4,325-342.
Hamalainen, Sirkka (2000), “The Operational Framework of the Eurosystem,” address toConference on the Operational Framework of the Eurosystem and the Financial Markets,Frankfurt, 5-6 May 2000.
31
Hamilton, James H. (1996), “The Daily Market for Federal Funds,” Journal of PoliticalEconomy 104, 26-56.
Hartmann, Philipp, Manna, Michele, and AndrJs Manzanares (2001), “The Microstructure of theEuro Money Market,” Journal of International Money and Finance 20, pp. 895-948.
Issing, Otmar, Gaspar, Vitor, Angeloni, Ignazio, and Oreste Tristani, Monetary Policy in theEuro Area, Strategy and Decision-Making at the European Central Bank, Cambridge,Cambridge University Press, 2001.
Mastroeni, Orazio (2000), “The Collateral Framework of the Eurosystem: SomeEvidence in the First Months of the European Monetary Union,” EuropeanCentral Bank.
Nelson, Daniel B. (1991), “Conditional Heteroskedasticity in Asset Returns: A NewApproach,” Econometrica 59, pp. 347-370.
Oechssler, Jörg, and Dieter Nautz (2001), “The Repo Auction of the European Central Bank andthe Vanishing Quota Puzzle,” University of Bonn, Discussion Paper No. 9/2001.
Perez- Quiros, Gabriel, and Hugo Rodriguez-Mendizabal (2000), “The Daily Market for Fundsin Europe: Has Something Changed with EMU?,” ECB working paper No. 67.
Prati, Alessandro, Leonardo Bartolini, and Giuseppe Bertola (2003), “The Overnight InterbankMarket: Evidence from the G-7 and the Euro Zone,” forthcoming, Journal of Bankingand Finance.
Ruckriegel, Karlheinz, and Franz Seitz (2002), “The Euro System and the Federal ReserveSystem Compared: Facts and Challenges,” Working Paper No. B 02, Center for EuropeanIntegration Studies, Bonn.
Würtz, Flemming Reinhardt (2003), “A Comprehensive Model on the Euro Overnight Rate,”ECB Working Paper No. 207.