a taxonomy and business analysis for mobile web applications
TRANSCRIPT

A Taxonomy and Business Analysis for Mobile Web Applications
Kevin Hao Liu
Working Paper CISL# 2009-01
January 2009
Composite Information Systems Laboratory (CISL) Sloan School of Management, Room E53-320
Massachusetts Institute of Technology Cambridge, MA 02142

A Taxonomy and Business Analysis for Mobile Web Applications
By
Kevin Hao Liu Ph.D. Computer Science
Victoria University
Submitted to the System Design and Management Program in Partial Fulfillment of the Requirements for the Degree of
Master of Science in Management and Engineering
At the
Massachusetts Institute of Technology
February 2009 © 2009 Kevin H Liu. All rights reserved
The author hereby grants to MIT permission to reproduce and to distribute publicly paper
and electronic copies of this thesis document in whole or in part in any medium now known or hereafter created.
Signature of Author Kevin H Liu
System Design and Management Program February 2009
Certified by
Stuart E Madnick John Norris Maguire Professor of Information Technology
Sloan School of Management Professor of Engineering Systems
School of Engineering Massachusetts Institute of Technology
Thesis Supervisor Certified by
Patrick Hale Director
System Design & Management Program Massachusetts Institute of Technology

- 1 -
A Taxonomy and Business Analysis for Mobile Web Applications
By Kevin Hao Liu
Submitted to the System Design and Management Program
in February 2009 in Partial Fulfillment of the Requirements for the Degree of Master of Science in Management and Engineering
ABSTRACT
Mobile web applications refer to web applications on mobile devices, aimed at personalizing, integrating, and discovering mobile contents in user contexts. This thesis presents a comprehensive study of mobile web applications by proposing a new taxonomy for mobile web applications, and conducting a business analysis in the field of mobile web applications.
The thesis reviews the current surrounding environment for mobile web applications, namely, web 2.0 and 3.0, wireless communication technology, and Smartphone platform. The recent entry and success of Apple’s iPhone greatly enhanced the public awareness of the Smartphone technology. Google’s release of open-source Android platform and T-Mobile’s deployment of Android-powered “Dream” Smartphone not only intensify the competition among suppliers, but also provide an open-source foundation for mobile web applications. This thesis introduces a new mobile web application taxonomy to systematically study the values and the groupings of the mobile web applications. By introducing features and categories, the taxonomy provides a framework so the related companies and businesses can be comparatively analyzed and summarized. Selected case companies are studied in the light of the taxonomy. The thesis discusses the key issues of mobile web aggregation, namely, mobile application development platform, context modeling, mobile user interface, mobile application logic, and mobile web aggregation strategy.
“System Thinking” is applied to the management of mobile web application business. The market ecosystem, the value proposition, and the revenue model for mobile web application are described. A system dynamic model is constructed to understand the dynamic among the key factors in the mobile web business. Experimental results are reported in the thesis.
Thesis Advisor: Stuart E Madnick John Norris Maguire Professor of Information Technology Sloan School of Management Professor of Engineering Systems School of Engineering Massachusetts Institute of Technology

- 2 -
ACKNOWLEDGEMENTS
I would like to thank Professor Stuart Madnick for his support, insight, and guidance in the course of my research. I would also like to thank Director Patrick Hale for making the SDM program flexible to tailor to individual needs. Finally, I would like to thank my family for love and support during my study at MIT.

- 3 -
This page is intentionally left blank

- 4 -
TABLE OF CONTENTS
1. Introduction ........................................................................................................................................ 9
2. Background Overview ..................................................................................................................... 12 2.1 Web 2.0 – Web as Platform....................................................................................................... 12 2.2 Web 3.0 – Semantic and Intelligent Web .................................................................................. 14 2.3 Traditional Mobile Networks .................................................................................................... 16 2.4 Modern Wireless Technology ................................................................................................... 20
2.4.1 WiFi Hotspot & FON ....................................................................................................... 20 2.4.2 WiMax .............................................................................................................................. 23 2.4.3 Wireless Mesh Networks .................................................................................................. 24
2.5 Rise of Smartphone ................................................................................................................... 27 2.6 Android...................................................................................................................................... 29 2.7 J2ME (Java 2 Micro Edition) .................................................................................................... 32 2.8 Trends of Mobile Phone Platform ............................................................................................. 35
3. Taxonomy of Mobile Web Applications......................................................................................... 38 3.1 Features...................................................................................................................................... 40 3.2 Categories .................................................................................................................................. 43
3.2.1 Feature -- Context ............................................................................................................. 44 3.2.2 Feature -- Ever Present ..................................................................................................... 49 3.2.3 Feature – Mobility ............................................................................................................ 53
3.3 Examples of Existing Mobile Web Applications ...................................................................... 54 3.3.1 Loopt (www.loopt.com) ................................................................................................... 55 3.3.2 Google (www.google.com) Mobile Search ...................................................................... 57 3.3.3 TruTap (www.trutap.com) ................................................................................................ 60 3.3.4 eBuddy (www.ebuddy.com) ............................................................................................. 61 3.3.5 MedApps (www.medapps.net) ......................................................................................... 63
3.4 Mobile Web Applications vs. Native Mobile Applications....................................................... 66 3.5 Mobile Web Applications vs. Mobile Web Aggregation .......................................................... 67
4. Mobile Web Aggregation................................................................................................................. 69 4.1 Mobile Web Aggregation Platform ........................................................................................... 69 4.2 Web Portal API & Mashup........................................................................................................ 72 4.3 Context Modeling...................................................................................................................... 75 4.4 Mobile Application User Interface ............................................................................................ 79 4.5 Mobile Web Application Logic................................................................................................. 81
4.5.1 Mobile Personalization ..................................................................................................... 81 4.5.2 Mobile Web Mining.......................................................................................................... 84
4.6 Mobile Aggregation Strategy .................................................................................................... 85
5. Business Analysis for Mobile Web Applications ........................................................................... 87 5.1 Market Ecosystem Analysis ...................................................................................................... 88 5.2 Value Proposition ...................................................................................................................... 89 5.3 Revenue Model.......................................................................................................................... 91

- 5 -
5.4 Strategy...................................................................................................................................... 93 5.4.1 A System Dynamic Model................................................................................................ 95 5.4.2 Marketing & Sales ............................................................................................................ 95
5.4.2.1 Pricing .......................................................................................................................... 96 5.4.2.2 Partnership, Channels, and Ecosystem....................................................................... 101
5.4.3 Operation ........................................................................................................................ 103 5.4.3.1 Quality and Rework Discovery .................................................................................. 104 5.4.3.2 Staff Level, Experience, and Productivity.................................................................. 106
5.4.4 Finance & Control .......................................................................................................... 107 5.5 Challenges to Mobile Web Application Business ................................................................... 109
6. Conclusion....................................................................................................................................... 111
7. References ....................................................................................................................................... 113

- 6 -
List of Tables Table 1 U.S. Social Networking Market.................................................................................................... 10 Table 2 WiFi Vs. WiMAX......................................................................................................................... 23 Table 3 U.S. and Worldwide PC Market ................................................................................................... 28 Table 4 J2ME Optional Packages .............................................................................................................. 34 Table 5 U.S. and Europe 3G Market......................................................................................................... 37 Table 6 U.S. and Europe 3G Mobile Subscriber Growth .......................................................................... 37 Table 7 U.S. Web Search Market .............................................................................................................. 58 Table 8 Google and Yahoo Mobile Search Revenue Decomposition........................................................ 58 Table 9 List of eBuddy Competitors.......................................................................................................... 63 Table 10 List of Mobile Web Browsers..................................................................................................... 67 Table 11 List of Mobile Web Application Development Platforms .......................................................... 72 Table 12 Leading Web Portal API vs. Mashup ......................................................................................... 74 Table 13 Values of Mobile Web Applications........................................................................................... 91 Table 14 Revenue Model Comparison....................................................................................................... 93

- 7 -
List of Figures
Figure 1 Web 2.0........................................................................................................................................ 14 Figure 2 Web 3.0........................................................................................................................................ 16 Figure 3 Mobile Network Cell Configuration............................................................................................ 17 Figure 4 Handoff........................................................................................................................................ 18 Figure 5 GSM System Architecture........................................................................................................... 19 Figure 6 WiFi............................................................................................................................................. 20 Figure 7 FON FONERO ............................................................................................................................ 21 Figure 8 FON Map..................................................................................................................................... 22 Figure 9 Mobile Networking Technologies Comparison........................................................................... 24 Figure 10 MIT RoofNet ............................................................................................................................. 26 Figure 11 Meraki User Map....................................................................................................................... 27 Figure 12 U.S. Smartphone Market ........................................................................................................... 29 Figure 13 Android System Architecture .................................................................................................... 30 Figure 14 First Commercial Android-Powered Mobile Phone .................................................................. 31 Figure 15 J2ME Stack................................................................................................................................ 32 Figure 16 J2ME Applications .................................................................................................................... 35 Figure 17 N-tier Web Application Architecture ........................................................................................ 39 Figure 18 A Taxonomy for Mobile Web Applications.............................................................................. 40 Figure 19 LBS............................................................................................................................................ 44 Figure 20 GIS Information Processing ...................................................................................................... 45 Figure 21 LBS Taxonomy ......................................................................................................................... 46 Figure 22 U.S. Mobile Internet and Search Users, and Search Revenues ................................................. 47 Figure 23 Mobile Search Taxonomy ......................................................................................................... 48 Figure 24 Mobile Entertainment Taxonomy.............................................................................................. 50 Figure 25 Mobile Entertainment Market ................................................................................................... 50 Figure 26 Mobile Marketing Taxonomy.................................................................................................... 52 Figure 27 Mobile Marketing Revenue Projection...................................................................................... 53 Figure 28 Example Companies for Mobile Web Application Taxonomy ................................................. 54 Figure 29 Loopt.......................................................................................................................................... 55 Figure 30 Comparison of Loopt.com, Dodgeball.com, and Jaiku.com ..................................................... 57 Figure 31 Comparison of Yahoo.com, Google.com, Msn.com, and Ask.com .......................................... 59 Figure 32 Comparison of Trucap.com, Bluepulse.com, and Buzzcity.com............................................... 61 Figure 33 eBuddy.com Application ........................................................................................................... 62 Figure 34 MedApps Applications .............................................................................................................. 64 Figure 35 Mobile Web Aggregation Platform ........................................................................................... 70 Figure 36 Mashup API Marketshare.......................................................................................................... 75 Figure 37 Mobile Context Model............................................................................................................... 77 Figure 38 Example Mobile Context Model at Time A .............................................................................. 78 Figure 39 Example Mobile Context Model at Time B ..............................................................................78 Figure 40 Mobile User Application Interface via Facet Navigation.......................................................... 80 Figure 41 Mobile User Application Interface from TapGlance................................................................. 81 Figure 42 Web Personalization .................................................................................................................. 84 Figure 43 Mobile Web Aggregation Strategy............................................................................................ 86 Figure 44 Market Ecosystem for Mobile Web Applications ..................................................................... 89 Figure 45 Revenue Models for Mobile Web Applications ........................................................................ 90 Figure 46 Mobile Web Business Strategy.................................................................................................. 94 Figure 47 A System Dynamic Model ........................................................................................................ 95

- 8 -
Figure 48 Licenses for Mobile Web Applications ..................................................................................... 98 Figure 49 Business Growth & Software Licenses ..................................................................................... 98 Figure 50 Impact of Pricing on Revenue ................................................................................................... 99 Figure 51 Operation Strategy for Mobile Web Business ......................................................................... 102 Figure 52 Rework Generation for Mobile Web Applications.................................................................. 105 Figure 53 Project Software Quality ......................................................................................................... 105 Figure 54 Impact of Quality on Rework .................................................................................................. 106 Figure 55 Impact of Productivity and Staffing on Project Completion ................................................... 107 Figure 56 Cumulative Net Income........................................................................................................... 108

- 9 -
1. INTRODUCTION The success of the World Wide Web and the Internet has significant impact on people’s daily life. With the open standard of web platform, the advance of wireless communication technology, and the rise of smartphone mobile device platform, mobile web applications lead the next wave of technology innovation.
Social web via a mobile phone is defined as “the superset of life altering functionality conveyed by a functioning mobile phone to that phone’s owner” [1]. Mobile 2.0 refers to the services that integrate the social web with core aspects of mobility – personal, localized, always-on and ever-present [2]. The enablers of the mobile 2.0 include
• Broadband mobile access,
• Affordable mobile web platform not only hardware but also software and applications,
• Open mobile web platform fostering web applications.
The key characters of mobile 2.0 are
• Social web with high mobility,
• Mobile user generated contents owned and controlled by the user himself/herself on public web sites,
• A variety of mashup services and applications aggregating web contents,
• Rich mobile user experiences leveraging the powerful mobile device and the mobile context,
• Personal and local contents on always-on, ever-present devices.
There are a number of businesses and initiatives building innovative mobile web applications. CBS Mobile (cbsmobile.com) and Aggregate Knowledge (aggregateknowledge.com) team up recently to offer news discovery and recommendation technology of mobile web sites to let users see and receive content recommendations based on what is being viewed, clicked and read by mobile users with similar interests at specific locations. Yahoo recently released a set of mobile web aggregation products (mobile.yahoo.com): oneConnect, oneSearch, and onePlace. The oneConnect product integrates the favorite communications tools and services to connect with anyone in the personal network, at anytime, from IM or text, email or social networks. The oneSearch product offers a mobile search platform that integrates web search with location-based services. As discussed in the thesis, the values of mobile web applications include
• Increasing efficiency via reducing idle time

- 10 -
• Increasing efficiency via automation
• Increasing business revenue stream
• Making better decisions utilizing the information
• Effective marketing
• Making better designs utilizing the resources
• Enabling transactions
• Providing continuous availability of context-aware information
• Providing continuous availability of dynamic, realtime seller-buyer connectivity and information
• Ease of deployment
According to Juniper Research, the revenues of mobile web software and related applications will reach $22.4 Billion by 2013, driven by user generated content and social networking [3]. According to eMarketer, the number of U.S. online social network users will continue to increase (see Table 1), and by 2011, half of the Internet users will use social networking. There is a strong correlation between social networking users and mobile web applications. Interestingly, the percentage of social networking teenagers is much higher than other age groups. As these teenagers grow older, more people will use social web and mobile web applications.
Year U.S. Social Network Users (Million Users)
Percentage of U.S. Total Internet Users (%)
U.S. Social Network Users -- age 12-17 (Million Users)
Percentage of U.S. Total Internet Users -- age 12-17 (%)
2006 60.3 33 11.5 61 2007 72.3 48 13.6 70 2008 85.3 44 15.3 77 2009 94.3 47 16.4 81 2010 100.2 49 17.1 83 2011 104.7 50 17.7 84
Table 1 U.S. Social Networking Market (Source: http://www.emarketer.com)
This thesis provides a taxonomy and business analysis for mobile web applications. The thesis is organized as follows. Background overview on the web 2.0 and 3.0, the modern wireless communication technology, and the smartphone platforms are presented in Chapter

- 11 -
2. A mobile web application taxonomy is proposed in Chapter 3 to systematically study the values and the groupings of the mobile web applications. By introducing features and categories, the taxonomy provides a framework so that related companies and businesses can be comparatively analyzed and summarized. Five selected companies are studied in the light of the taxonomy. Mobile web aggregation, a relatively new concept, refers to a special type mobile web application that integrates data from multiple sources, at least one from the web. This thesis provides a definition for mobile web aggregation and highlights the key issues of mobile web aggregation in Chapter 4. System thinking is applied to the management of mobile web application business. The market ecosystem, the value proposition, and the revenue model are discussed in Chapter 5. A system dynamic model is constructed to understand the dynamic among the key factors in the mobile web business. The business challenges to mobile web applications are also summarized. Finally, the thesis is concluded in Chapter 6.

- 12 -
2. BACKGROUND OVERVIEW Mobile web applications are built upon the emergence of the web standard, the advance of the mobile networking technology, and the rise of the smartphone mobile device platform. This chapter overviews the related background as follows
• Web: web 2.0 and web 3.0
• Mobile networking technology: traditional mobile networks and modern wireless technologies
• Smartphone: high end mobile device platform, Android, and J2ME
2.1 WEB 2.0 – WEB AS PLATFORM
Web 2.0 refers to the second generation of web-based communities and hosted services that facilitate collaboration and sharing between Web users. Wiki and Blog are representative applications of Web 2.0. The birth and success of Google, Myspace, Facebook, and YouTube signal the world wide adoption of Web 2.0. Web 1.0 treats web as an information portal, where information can be accessed through standard web protocols and browsers; web 2.0 allows users to participate by allowing them to not only share the data on a public web site but also control and maintain the data themselves. According to [4], the characteristics of web 2.0 can be summarized as following.
• Rich user experiences: social networking enrich web surfer experiences
• User participation: user owns the data on a web site and exercises control over the data
• Dynamic content: new content syndication technology such as RSS and user friendly interface such as Ajar provides dynamic content enabling sophisticate web applications
• Metadata: standard web syntax will have even bigger impact for innovative web applications
• Web standards: web is a system of interlinked hypertext documents available via the Internet. Web, a standard technology, is global, open, and free. Current web standards include DOM scripting, XHTML, and CSS. Open data through API and web services.
• Scalability: Web on top of the Internet has been proven as a scalable solution for billions of user world wide.

- 13 -
In the light of web 2.0, a web business has the following core competencies [5]
• Focusing on services, not traditional software product, with cost-effective scalability
• Controlling unique, hard-to-recreate data sources that get richer as more people use them
• Trusting users as co-developers
• Harnessing collective intelligence by aggregating the best work of millions
• Offering software above the level of a single device, i.e. no longer limited to the PC platform
• Developing lightweight user interfaces, web engineering models, and business models.
Andy Budd (www.andybudd.com) uses Figure 1 to describe “what is web 2.0”. Among the terms associated with Web 2.0, Ajax perhaps is the most significant addition to the web building blocks for creating interactive web applications that can retrieve data from the server asynchronously in the background without interfering with the display and behavior of the existing page. AJAX stands for Asynchronous Javascript and XML. The main part of Ajar is XMLHttpRequest, a server side object usable in Javascript. The processing of web page request was formerly at the server side, e.g. using web services or PHP scripts before the whole web page was sent to the client browser for display. Ajax selectively modifies a part of web page on the browser and updates it without the need to reload the whole web page with all images and/or menus. For instance, using Ajax, some fields of a form can be processed at the client side and the result displayed immediately into the same page.
Other key standards and applications related to Web 2.0 include Web Standards (w3.org), Blogging, Wiki, GTD (Getting Things Done), Tagging, Folksonomy, RSS (Really Simple Syndication), and Mash-up. Blog refers to web contents, maintained by an individual, of commentary, descriptions of events, or other material including image and video. Some blogs are online diaries that combine video, image, text, web links to other webs sites and blogs; other blogs are simply to comment on news, classes, and activities. There are several types of popular blogs in Web 2.0:
• personal blog like ongoing diary,
• micro blog such as Twitter to share thoughts and feelings instantaneously with friends and family in one’s social network,
• corporate blog to enhance the communication and culture of a corporation or externally for marketing, branding, or public relation purposes,
• question blog to answer questions

- 14 -
Wiki (What I Know Is) are web pages designated to enable team work and collaboration by allowing team members to contribute and modify the content via html. Wikipedia, the online collaborative encyclopedia, is one of best-known Wiki. A tag is a non-hierarchical keyword or term assigned to a piece of information such as a document, image, or video. Tag is the metadata that describes an item so that the item can be found through searching or browsing via the tag. On a website where many users tag many item, the collection of tags becomes a folksonomy. RSS is the web feed format to publish updates such as blog entries and news headlines. An RSS document known as Web feed or channel includes full or summarized text and metadata such as author, publishing date, and title. Using RSS, a web application can subscribe timely updates from favored websites and aggregate web feeds from multiple sites to present to the users. GTD is the action management method created by David Allen, which has the principle to move tasks out of the mind by recoding them externally so that the mind can focus on actually performing the tasks. GTD advocates 3 major models for gaining control and perspective: a workflow process, a framework with 6 levels of focus (current actions, current projects, areas of responsibility, yearly goals, 5 year vision, life goals), and a natural planning method. Mash-up is introduced later in this chapter.
Figure 1 Web 2.0 (Source: http://www.andybudd.com)
2.2 WEB 3.0 – SEMANTIC AND INTELLIGENT WEB
Web 3.0 describes an intelligent web in a cloud computing setting. Web applications become more sophisticate and distributed; for users, the web applications run inside a cloud. Web 3.0 is characterized with the following improvements (http://en.wikipedia.org/wiki/Web_3.0):
• A formal semantic web

- 15 -
• More web artificial intelligence such as web mining, natural language processing, machine learning, autonomous agent
• Increases in Internet connection speeds
• Modular web applications
• Advances in computer graphics
Semantic web can be considered as a foundation to web 3.0. The semantic web is centered at a Resource Description Framework (RDF) together with the formal notations including RDF Schema (RDFS) and Web Ontology Language (OWL), and the data exchange formats including RDF/XML, N3, Turtle, and N-Triples. The underlying structure of any expression in RDF is a collection of triples, each consisting of a subject, a predicate, and an object. The assertion of a RDF triple represents some relationships, indicated by the predicate. The subject and the object in the triplet are also known as the node of the triplet. A node may be a URI (Uniform Resource Identifier) reference, a literal, or blank (no separate form of identification); the predicate is always a URI reference. A URI reference is a Unicode string identifying an abstract or physical resource. At its core, the semantic web aims to transform the conventional unstructured text-based web into a structured, distributed database so that querying can be more efficient.
Given the explosive growth and the variety of information sources on the web, it becomes increasingly important and valuable to analyze and track the content and usage patterns on the web. According to [galeas.de], web mining can be classified into web content mining to extract knowledge from the content of documents or their descriptions, web structure mining to infer knowledge from the organization and links between references and referents in the web, and web usage mining (also known as web log mining) to extract interesting patterns in web access logs.
According to Organic INC (www.organic.com), Web 3.0 has 4 key areas of interests: the semantic web, artificial intelligence, personalization, and mobility. Figure 2 shows the web 3.0 key areas together with the leading companies and/or concepts.

- 16 -
Figure 2 Web 3.0 (Source: http://www.organic.com )
2.3 TRADITIONAL MOBILE NETWORKS
A cellular network uses a large number of low-power transmitters to create cells; a cell is the basic geographic service area of a wireless communication system. Figure 3 shows a typical 7-cell configuration in which one cell is adjacent to 6 other cells. There are 7 cells in a cluster, and there is no channel reuse within one cluster. Channel reuse is to assign a group of unique radio channels to each cell within a cluster so that the available radio channels can be used efficiently to carry multiple conversations at a time. In a 7-cell configuration, the frequency reuse factor is 1/7. Based on the subscriber density and demand as well as the landscape of the region, cell size is configured via power levels and can also be changed to accommodate growth. For instance, in a city with high density population and a large number of subscribers, the cell size should be smaller than that of remote region in a country side. Cell splitting is commonly used in the city to address the growth of the user population by changing one cell into a cluster of cells.
As mobile users travel from one cell to another cell, services are handed off seamlessly without interruption. Figure 4 shows handoff during user roaming. When a user leaves one cell and steps into an adjacent cell, the service is intact and the user is not even aware of the handoff but the service changes to a different radio frequency. The switching and provisioning are conducted by the base station and the central switching office.

- 17 -
1
2
3
4
5
6
7
1
2
3
4
5
6
7
1
2
3
4
5
6
7
Cell
Cluster
Figure 3 Mobile Network Cell Configuration
GSM (Global System for Mobile communications) is the most popular standard for mobile phones world wide (although CDMA networks have more subscribers in USA), and it is estimated that 82% of the global mobile market uses GSM. GSM networks operate at one of three frequency bands: 900 MHz, 1800 MHz, and 1900 MHz. Figure 5 shows a typical GSM carrier system architecture. GSM specifications define two open interfaces:
• Air interface - mobile station (MS) to base transceiver station (BTS)
• A interface – mobile switching center (MSC) to base station controller (BSC)
The MS is a combination of terminal equipment, known as Mobile Equipment, and subscriber data, stored in a separate module called SIM (Subscriber Identity Module). GSM divides the network resources into three subsystems
• Network switching subsystem (NSS) – responsible for call control functions, mobility management, security, and service charging. Calls are always connected by and through NSS. NSS includes MSC, Visitor Location Register (VLR), Home Location Register (HLR), Equipment Identity Register (EIR), and Authentication Center (AuC).
• Base station subsystem (BSS) – responsible for radio network control and management, speech transcoding, and signaling towards Air Interface and NSS. Every call is connected through the BSS. BSS includes BSC, BTS, and Transcoder and Submultiplexer (TCSM).

- 18 -
• Network management subsystem (NMS) - responsible for operational and maintenance tasks of the network. In terms of functionality, NMS includes performance management, configuration management, and fault management. NMS is needed for the control of the whole GSM network to deliver quality services to users.
3
2
1
7
Handoff from Base Station 2to Base Station 3
Cellular Switch
Public SwitchedTelephone Network
(PSTN) Trunk Routes
Figure 4 Handoff
(Source: T-Mobile GSM Training)
GPRS (General Packet Radio Service) is a packet oriented mobile data service for GSM networks. GSM (2G) cellular systems combined with GPRS are often described as 2.5G, a technology between the 2G and 3G mobile telephony. GPRS consists of two main components:
• GGSN (Gateway GPRS Support Node) – the gateway between a GPRS wireless data network and other networks such as the public Internet. It converts the GPRS packets coming from the SGSN into the appropriate packet data protocol format and sends them on the corresponding packet data network. For the coming traffic, data packets are converted to the GSM addresses of the destination user.
• SGSN (Serving GPRS Support Node) – the network element responsible for the delivery of data packets from and to the mobile stations within its geographical service area. Its tasks include packet routing and transfer, mobility management, logical link management, and authentication and charging functions.

- 19 -
Figure 5 GSM System Architecture (Source: T-Mobile GSM Training)
Typical GSM services include the following categories:
• Basic Teleservices – provides the full communication capacity by means of terminals and network functions as well as those provided by dedicated centers. Services include Speech Telephony, Speech Emergency, Short Message Services (SMS) – Mobile Terminated (T21), SMS – Mobile Originated (T22), SMS – Cell Broadcast (T23), Group 3 Fax Transmission (T61), and Automatic Group 3 Fax Transmission (T62).
• Basic Bearer Services – provides the data transmission services both synchronous and asynchronous services. GSM network provides the capability of transmitting signals between the originating and terminating access points. Data can use either the transparent service, which has a fixed delay but no guarantee of data integrity, or a non transparent service, which guarantees data integrity through an Automatic Repeat Request (ARQ) mechanism, but with a variable delay. The data rates supported by GSM are 300 bps, 600 bps, 1200 bps, 2400 bps, and 9600 bps.
• Supplementary Services – provided on top of basic teleservices or bearer services. Services include features such as caller identification, call forwarding, call waiting, multiparty conversations, and barring of outgoing (international) calls, among others.
MSC serves as the interface between the GSM mobile access network and the public fixed network. From the fixed network’s point of view, MSC represents a switching node. MSC

- 20 -
needs to know the mobile’s roaming location via HLR and VLR. VLR knows the exact geographical location of a mobile down to the level of location area (LA). One LA normally consists of a number of cells connected to one or several BSC. When mobile terminating call arrives, the mobile is paged through all cells belonging to its current location area. Location updating is initiated by the mobile that notices the location area broadcast is not the same as the one previously stored in the mobile’s memory. An update request and the IMSA (International Mobile Subscriber Identity) or the previous TMSI (Temporary Mobile Subscriber Identity) are sent to the new VLR via the new MSC. A mobile station roaming number (MSRN) is allocated and sent to the mobile’s HLR by the new VLR. HLR sends back the necessary call control parameters and sends a cancel message to the old VLR to free the previous MSRC.
Wireless Access Router
Cable to Internet
Cable to Internet
Figure 6 WiFi
2.4 MODERN WIRELESS TECHNOLOGY
2.4.1 WIFI HOTSPOT & FON
WiFi refers to various IEEE 802.11 technologies used in mobile phones, home networking, and video games. A wireless access router serves as the gateway to the Internet, a packet-based network infrastructure, and uses radio waves to communicate with computer and consumer devices. Via a wireless adapter, the end-user devices translate data into a radio signal and transmit the signal using an antenna. The wireless access router receives the signal and decodes it, and then sends the information to the Internet using a physical, wired Ethernet connection (see Figure 6). WiFi radios transmit at frequencies of 2.4 GHz or 5 GHz, which is considerably higher than the frequencies used for cell phone, walkie-talkies

- 21 -
and televisions. Using higher frequencies, WiFi allows the radio signal to carry more data, i.e. a bigger bandwidth. A drawback of WiFi is packet collision as in Ethernet networks.
WiFi has the following 802.11 networking standards:
• 802.11a – transmits at 5 GHz and can move up to 54 Megabits of data per second. It also uses Orthogonal Frequency-Division Multiplexing (OFDM) to split radio signals into several subsignals before they reach a receiver. Hence, it uses efficient modulation technique to improve efficiency and reduce interference.
• 802.11b – transmits at 2.4 GHz and can bundle up to 11 Megabits per second. It uses Complementary Code Keying (CCK) modulation to improve speeds.
• 802.11g – transmits at the 2.4 GHz and can handle up to 54 Megabits per second. It uses OFDM modulation scheme.
• 802.11n – can provide a bandwidth of 140 Megabits per second. It is the newest standard in the 802.11 series.
Hotspot refers to a place that offers WiFi access to the Internet. There are a number of WiFi devices including laptops, mobile phones, and wireless portable devices. Hotspots are often found at libraries, airports, hotels, hospitals, bookstores, coffee shops, train stations, restaurants, and universities.
Figure 7 FON FONERO
(Source: http://www.fon.com/ )

- 22 -
FON is the largest WiFi community in the world. FON is a Community of people making WiFi universal and free. The vision of FON is to share some of the home Internet connections and provide free access to the Community’s FON Spots worldwide. To offer a FON access point, one must use a 54 Mbps wireless router, and those who belong to the FON community are called “Foneros”. Within the group Foneros, there are 3 basic levels of membership:
• Linuses – members who share their WiFi and in return get free WiFi when using a FON access point
• Aliens – members who do not share their own WiFi but pay a fee to use a Fonero access point
• Bills – members who make money from their WiFi. Linuses earn a percentage of the fees that Aliens pay for FON.
Payments to Foneros are made through PayPal. FON will pay into the member’s PayPal account each time the Fonero has accumulated $30 (or 30 Euros) in earnings.
Figure 8 FON Map
(Source: http://www.fon.com/ )

- 23 -
FON, launched in Feb 2006, is a for-profit company incorporated and registered in the UK. FON was created in Madrid, Spain, and its high-tech investors include Google and Skype. Figure 7 and Figure 8 show the popular FON map that allows a user to find a FON spot worldwide. These figures show the FON spots in the middle town of Manhattan NYC.
FON Cities (cities with FON community) is an initiative to collaborate with various worldwide cities, municipalities, and communities to build citizen-generated WiFi access. So far, the FON cities include Malaga of Spain, Lleida of Spain, Blanquefort of France, Tosca of Italy, Oslo of Norway, and Munich of Germany.
2.4.2 WIMAX
WiMax is a wireless digital communications system via IEEE 802.16, which intends for wireless “metropolitan area networks”. WiMax can be used for wireless networking in much the same way as the WiFi protocol, and provides the last mile broadband wireless access alternative to cable modem service, Telecom Company’s Digital Subscriber Line, or T1/E1 service. Table 2 lists the key differences between WiMAX and WiFi.
WiFi WiMAX Transmission range 100 yards, covers a coffee shop
or a home 6 miles, covers a small city with one base station
Throughput 11 Mbps (802.11b) up to 140 Mbps (802.11n)
72 Mbps
Security Limited, encryption available Multi-level encryption QoS Limited Dynamic bandwidth allocation,
good for voice & video
Table 2 WiFi Vs. WiMAX
Fixed WiMAX offers cost effective point-to-point and point-to-multipoint networking solutions including broadband Internet access, T1/E1 substitute for businesses, VoIP as telecom substitute, IPTV as cable TV substitute, backhaul for WiFi hotspots and cell phone towers, mobile telephone service, mobile data TV, mobile emergency response services, and wireless backhaul as substitute for fiber optic cable.
Figure 9 shows the comparison among the market leading mobile networking technologies. GSM is known as 2G wireless networks. UMTS (Universal Mobile Telecommunications System) is the 3G GSM wireless network technology that utilizes the W-CDMA air interface and the 2G GSM infrastructure. UMTS using W-CDMA supports up to 14 Mbps data transfer rates in theory, where in the deployed networks transferring rate is up to 384 kbps and 7.2 Mbps for download. High speed packet access (HSPA), known as 3.5G, is the collection of mobile phone protocols to extend and improve the performance of existing UMTS protocols. The 2 existing standards of HSPA are HSDPA (High Speed Downlink

- 24 -
Packet Access) and HSUPA (High Speed Uplink Packet Access). HSDPA provides improved theoretical down-link performance of up to 14.4 Mbit/s. Existing deployments provide up to 7.2 Mbit/s in down-link. Up-link performance is a maximum of 384 kbps. HSUPA provides improved up-link performance of up to 5.76 Mbps.
Coverage (where can you go)
Ban
dw
idth
(h
ow
mu
ch
data
per
un
it t
ime
for
Tra
nsm
issi
on
)
WiFi
WiMAX
HSPAUMTS
GSM
low
high
low high
Figure 9 Mobile Networking Technologies Comparison
2.4.3 WIRELESS MESH NETWORKS
Instead of simple wireless point-to-point or broadcast networks, radio nodes can form wireless mesh networks via IEEE 802.11, 802.15, 802.16 technologies. In a mesh network, traffic from one node has multiple paths to travel to another node in the topology, so in case of a path or node failure, the network still provides services to applications. Mesh network is reliable and self-healing. Wireless mesh network has two types of nodes: mesh routers and mesh clients. A mesh router is usually equipped with multiple wireless interfaces built on either the same or different wireless access technologies. Mesh routers are static and form the backbone for mesh clients. Mesh clients can also support routing in mesh networking but the hardware platform and software for mesh clients are much simpler than those for mesh routers. For example, a mesh client only has a single wireless interface and does not support gateway or bridge functions in communication protocols.
The network architecture of wireless mesh networks can be classified into three types:
- 25 -
• Infrastructure/backbone wireless mesh network: mesh routers form a network infrastructure for mesh clients.
• Client wireless mesh network: mesh clients provide peer-to-peer networks among mesh client devices.
• Hybrid wireless mesh network: a combination of the infrastructure wireless mesh and the client wireless mesh networks.
The critical design factors in wireless mesh networks include
• Radio technologies: to increase capacity and flexibility of wireless systems, e.g. directional and smart antennas, multiple input multiple output systems, and multi-radio or multi-channel systems.
• Scalability: to ensure certain performance as the network size increases
• Mesh connectivity: to ensure reliable mesh connectivity. Network self-configuration and topology control algorithms are employed to discover mesh connectivity, and topology-aware MAC and routing protocols are used to enhance the performance of wireless mesh networks.
• Broadband and QoS: to deliver application QoS. In addition to end-to-end transmission delay and fairness, need to consider application-oriented performance metrics such as delay jitter, aggregate and per-node throughput and packet loss ratios.
• Security: to provide security for applications.
• Ease of Use: to provide ease of use. Protocols and network management tools are developed to provide auto-configuration and minimal effort on maintenance.
• Compatibility and Interoperability: to provide backward compatible with conventional client nodes and mesh clients.
One of the earliest wireless mesh networks is MIT CSAIL’s roofnet project (http://pdos.csail.mit.edu/roofnet/doku.php), which previously was funded by MIT’s Project Oxygen and NTT DoCoMo. Roofnet is an experimental IEEE 802.11 b/g wireless mesh network to provide broadband Internet access to users in Cambridge MA. There are around 20 active nodes in the network. Figure 10 shows the Roofnet topology on the Cambridge map. The deployment is bordered with the MIT campus to the south and Cambridge Street to the north. The bottom left corner on the map is Central Square, and NE 43 is the cluster of three nodes in the bottom right corner.

- 26 -
Figure 10 MIT RoofNet
(Source: http://pdos.csail.mit.edu/roofnet/doku.php )
One of the leading commercial companies in the wireless mesh network supplier industry is Meraki (www.meraki.com) that provides internal (e.g. within a building) as well as external (e.g. in a park) mesh routers, and related enabling software systems. The company provides cost-efficient networking solution connecting metropolitan areas and campuses. Figure 11 shows the Meraki effort to bring complete wireless mesh connectivity in the city of San Francisco. Currently, the Meraki network supports 150K users in the city.

- 27 -
Figure 11 Meraki User Map
(Source: http://sf.meraki.com )
2.5 RISE OF SMARTPHONE
In the year of 2007 alone, the worldwide sales of mobile phones to end users surpassed 1.5 Billion units, a 16 percent increase from 2006 sales of 990.9 million [6]. The number of mobile subscribers has exceeded the number of fixed line subscribers for many years. Despite the recent economic slowdown, worldwide mobile phone sales rose nearly 12 present in the 2nd quarter of 2008. In Asian-Pacific regions, sales grew 20.5 percent from the same quarter in 2007. How significant is this number? Right now, there are 1.7 Billion TV sets in use worldwide after decades of deployment and upgrade. Table 3 shows US and worldwide PC sales. The year of 2005’s PC unit sales world wide is about 180 million; by 2010, the worldwide PC in use is 1.35 Billion units. In summary, mobile phone reaches where other media cannot!
Another phenomenon is the popularity of the text messages via mobile phones, especially in developing countries. Worldwide over 350 billion text messages are exchanged across the world’s mobile networks every month.

- 28 -
US and worldwide PC Market
1975 1980 1985 1990 1995 2000 2003 2005 2010
U.S. PC Sales (#M) 0.04 0.76 6.6 9.5 21.4 46.0 48.3 56.6 66.7 U.S. PC Revenues ($B) 0.05 1.5 17.2 24.5 56.8 86.9 78.1 84.5 86.1
U.S. PC Installed Base (#M) 0.04 1.4 19 51 86 177 218 236 290
Worldwide PC Sales (#M) 0.05 1.1 11 24.2 70.1 130 149 181 249
Worldwide PC Revenues ($B) 0.06 3.6 29.5 71.3 155 247 243 270 302
Worldwide Installed Base (#M) 0.05 2.1 33 100 225 523 738 896 1,350
Table 3 U.S. and Worldwide PC Market (Source: http://www.gartner.com)
In developing countries where land is small and density is high, building wire line networking infrastructure is expensive and slow. Mobile technology provides a reliable, cost-efficient alternative. In fact, in some Asian countries, there are far more mobile phone users than the conventional wire line phone users. Some consumers in these countries only have mobile phones but do not have a fixed line phone at home. As the mobile phone technology matures, even in the most developed countries, consumers start to seriously consider the option to use their cell phones replacing home fixed-line phone as the main communication tool. These mobile devices become more powerful with CPU, memory, disk, operating system, and computer and telecommunication networking capability; they are becoming the dominant platform for consumer software and web applications. These phones with PC like functionality are also called “Smartphone”.
The price of Smartphones (such as iPhone, Blackberry, Palm Trio) has dropped significantly in recent years. According to Nielsen Mobile's research, the 4 leading Smartphone suppliers in the USA are RIM, HTC, Palm, and Apple with the market share of 31.1%, 20.6%, 16.9%, and 12.2% in the 2nd quarter 2008. However, Apple and RIM have improved their market share significantly while Palm has dropped its market lead in the recent years (see Figure 12). On June 28, 2007, the 1st day for iPhone public release in the USA, an iPhone with 8 GB storage costs $599; on July 11, 2008, the 1st day for iPhone 3G public release in the USA, an iPhone with 16GB storage costs $299 for same contract length. Also, Google and the Open Handset Alliance (OHA) have revealed the standard features in the Android powered mobile phone, a standard initiative for an open mobile phone platform. Android is an open-source software stack for mobile devices that includes an operating system, middleware and key applications http://code.google.com/android/ . Android Software Development Kit (SDK) provides the tools and APIs to begin developing applications on the Android platform using the Java programming language.

- 29 -
Figure 12 U.S. Smartphone Market
(Source: http://www.nielsenmobile.com )
2.6 ANDROID
On November 5, 2007, the Open Handset Alliance (OHA) www.openhandsetalliance.com, a consortium of 32 companies led by Google, HTC, Intel, Motorola, Qualcomm, T-Mobile, Sprint Nextel, and Nvidia, announced a plan to develop open standards for mobile devices. OHA’s first product, known as Android code.google.com/android/, is a mobile device platform build on the Linux kernel.
The Android platform has the following features: • application framework enabling reuse and replacement of components
• Dalvik virtual machine optimized for mobile devices
• integrated browser based on the open source engine http://webkit.org
• Optimized graphics powered by a custom 2D graphics library; 3D graphics based on the OpenGL ES 1.0 specification (hardware acceleration optional)
• SQLite for structured data storage

- 30 -
• Media support for common audio, video, and still image formats (MPEG4, H.264, MP3, AAC, AMR, JPG, PNG, GIF)
• GSM Telephony (hardware dependent)
• Bluetooth, EDGE, 3G, and WiFi (hardware dependent)
• Camera, GPS, compass, and accelerometer (hardware dependent)
• Rich development environment including a device emulator, tools for debugging, memory and performance profiling, and a plug-in for the Eclipse IDE.
Figure 13 Android System Architecture
(Source: http://code.google.com/android/ )
Figure 13 illustrates the Android platform system architecture, where the functions and modules are grouped into 5 layers.
• Applications: core end-user applications such as email client, SMS program, browser, calendar, maps, and contacts. These applications are written in Java programming language.

- 31 -
• Application Framework: the framework is introduced to reuse the common modules in the platform to support a variety of applications. The core services of the framework includes: activity manager, window manager, content providers, view system, package manager, telephone manager, resource manager, location manager, notification manager
• Libraries: these libraries are exposed to developers through the application framework. Some of the core libraries include libc (system C library), media library (supporting popular audio, video, and image formats), surface manager (2D and #D graphic and subsystem display), OpenGL (3D graphics), SGL (2D graphics), FreeType (bitmap and vector font rendering), SSL, WebKit (web browser), and SQLite (light-weight relational database engine).
• Runtime Libraries: Dalvik virtual machine and core libraries of the Java programming language.
• Linux Kernel: Linux version 2.6; key kernel services include security, memory management, process management, network stack, and driver model.
Figure 14 shows the first commercial, Android-powered mobile phone. The new mobile, named as “Dream”, is manufactured by Taiwanese manufacturer HTC, and is available in the T-Mobile network in the UK in early November 2008. As shown in the figure, the phone not only has the touch screen user interface but also has a slide-out QWERTY keyboard. The phone supports the Google's range of web applications including Gmail, Google Docs and Google Maps, and uses the Google's new web browser, Chrome.
Figure 14 First Commercial Android-Powered Mobile Phone
(Source: http://www.t-mobile.com)
The retail price of the Google’s Android phone is sold for $199 on a 2-year contract. According to the latest market research from Strategy Analytics (http://www.strategyanalytics.com/), the Google Android operating system will account for

- 32 -
4% of all smartphones sold in the U.S. in the 4th quarter 2008, or 10.5 million Android smartphones to be sold in the U.S. in the 4th quarter 2008.
2.7 J2ME (JAVA 2 MICRO EDITION)
J2ME is an edition of the Java platform targeted at small, standalone or connectable consumer and embedded devices. J2ME consists of a resource-constrained virtual machine due to the limited size of the mobile devices and a set of Java APIs suitable for tailored runtime environments for these devices. J2ME is a platform described in the form of two primary kinds of components: configurations and profiles.
Mobile device manufacturers install and prepackage their devices with the JVM and associated APIs. Developers will develop applications targeting these devices.
Figure 15 J2ME Stack (Source: http://today.java.net/pub/a/today/2005/02/09/j2me1.html)
J2ME stack (shown in
Figure 15) has 3 parts:
• A configuration contains a JVM and base class libraries. The popular configurations are Connected Limited Device Configuration (CLDC) and Connected Device
Optional Packages e.g. mobile media API
Profile e.g. MIDP, foundation profile
Configuration e.g. CLDC, CDC
Host Operating System e.g. JVM
Mobile Device Supplier
Mobile Application Supplier

- 33 -
Configuration (CDC). CLDC is for devices with limited configurations, e.g. only 128KB or 512KB memory available on the devices.
• A profile builds on top of the base class libraries providing a useful set of APIs and optional packages. The most popular profile is the Mobile Information Device Profile (MIDC), which provides the basic API used for creating application for mobile devices. MIDC is used for CLDC but not for CDC.
• Optional packages are traditionally not packages by the device manufactures, and application development companies need to package and distribute them with their applications if needed.
A J2ME program or application for a mobile device is called a MIDlet. As other Java programs, MIDlets are “compile once and run anywhere”, and distribute using jar files and jad files. A jad file contains the location and describes the contents of the jar file. There are seven steps in the creation of a MIDlet:
• Design: user interface design is critical on a mobile device
• Code: implementation by extending the abstract MIDlet class in the javax.midroediton.midlet package
• Compile: same as compiling other java programs. One may need to include the classpath for both CLDC and MIDP in the javac command line during compilation.
• Preverify: before deployment, preverification of bytecode is used to ensure the class file is structurally and conceptually correct as per the JVM specification.
• Package: first, create a Manifest file to describe the contents of the jar file; next, create the jar file that packages up the preverified class file and the Manifest file; then, create a file that has an extension of .jad (java application descriptor) pointing to the locations of the MIDlet so that the mobile device can install it; last, determine the size of the application jar file and put that value in the jad file in actual bytes.
• Test: using a wireless toolkit to mimic a real device and test the application in the simulated environment
• Deploy: load the application to the mobile device. This can accomplished via a network connection between your computer and your handset, e.g. a USB cable or Bluetooth wireless connection, or via the Internet.
J2ME applications are still in early stage of development. Entirely new and interesting systems can be developed using J2ME, especially location based applications. Table 4 lists the current optional packages that are available in the J2ME community. These APIs greatly improve the development and product time to market.

- 34 -
Existing J2ME Package/API Category
API Name and Description
Java Specification Request (JSR) Number
Sun Java Wireless Toolkit WTK
--
MicroEmulator -- RIM Emulator “skin” --
J2ME Development Kits
Yospace MIDP emulator
--
J2ME Location-based API J2ME Location API JSR 135 Mobile media API (MMAPI)
JSR 135 J2ME Multimedia API
3G Graphics JSR 184 Wireless Messaging API
JSR 120, JSR 205
SIP API JSR 180
J2ME Phone and Messaging
Security and Trust Service API
JSR 177
JDBC for CDC/Foundation Profile API
JSR 169
J2ME RMI JSR 66 Bluetooth API JSR 82
J2ME Configuration
Web Services API JSR 172
Table 4 J2ME Optional Packages (Source: http://developers.sun.com/mobility/getstart/)
Popular J2ME applications and/or prototypes are so far in the following categories (see Figure 16):
• Navigation: based on GPS information, mobile phone can guide the user with a map and navigate to a given location.
• Shopping: consumers can buy products through a mobile phone shopping platform. The figure shows a J2ME mobile phone shopping application on the Cingular network.
• Entertainment: the entertainment mobile software is related to games, movies, and multimedia applications. The figure shows a free Solitaire game that runs on J2ME mobile phone.
• Safety and emergency: there are a number of safety and emergency mobile applications ranging from assisting senior citizens to health care delivery and monitoring. The figure shows mobile medical system and information base from Pepid (www.pepid.com) for Blackberry platform.

- 35 -
a. Navigation J2ME softwareNokia N95
b. E-Shopping J2ME appliacationCingular Network
c. Truckin”Solitaire for Java Mobile Phone
d. PEPID™ for Blackberry
Figure 16 J2ME Applications
2.8 TRENDS OF MOBILE PHONE PLATFORM
As competition in the mobile phone industry intensifies, not only more players have announced their interests and new products but also the existing product life cycle and the new product development time have significantly shortened. For example, the existing smartphone leaders are RIM’s Blackberry, Apple’s iPhone, and Palm’s Trio and Centro, and the new comers include:
• Sony Ericsson’s Xperia-X1
• Garmin’s Nuviphone
• Google’s Android powered Mobile Phone (e.g. HTC’s Dream phone)
From the mobile phone platform industry perspective, to be competitive, companies need to adapt to the following trends:
• Building Ecosystems: users buy in a platform not only for the features and quality of the device but also applications. To a user, cost is related to the entire ecosystems.
• Removing User Complexity: average users only use a small percentage of the features available on a mobile phone. Companies need to address the complexity in the use of the existing mobile phone features.
• Mobile Devices Increasingly Become Lifestyle Statement: with the popularity of the Apple’s iPhone, companies realized a mobile phone represents its user’s personality and lifestyle.

- 36 -
• High-End Device Platforms Become “Field-Refreshable.": as new products come to market quickly than ever before, companies have to not only manage new products but also support existing products, platforms, and versions. Ideally, these existing platforms need to be upgraded and/or maintained cost-efficiently.
• Leveraging Open Source Platform: no matter how a company views open source initiatives according with its strategy, the open source initiatives attracted attentions and started to gain momentum. Leveraging the open source platform can at least reduce costs of developing new products and R&D. The OHA and Android effort defined the following standard features for next-generation mobile phones:
o Smartphone handset layout
o Storage: in addition to storage available on a mobile device, the device can expand via removable storage
o Connectivity: both computer and telecommunication networking capability
o Messaging
o JVM
o Web browser
o Media support: support multimedia applications
o Development environment: to facilitate third vendor applications, the mobile device needs to support an open development environment, e.g. SDK.
Mobile phone usage shows the following trends:
• Mobile search on the move: Mobile search is gaining in both popularity and frequency of use in the U.S. and Western Europe, according to M:Metrics (www.mmetrics.com). In June 2008, 20.8 million U.S. mobile subscribers and 4.5 million European mobile phone subscribers accessed search, an increase of 68 and 38 percent from June 2007, respectively. Google is the preferred brand for browser-based searches in all countries measured by M:Metrics.
• Mobile phone sharing on the rise: A Nokia survey of consumers in emerging markets reveals a new cell phone trend - phone sharing. More than 50% of respondents in India, Pakistan and nearly 30% in Vietnam said that they share, or would share, their mobile phone with family or friends. In response, Nokia has developed a number of innovative features like the multiple phonebook to support phone sharing, and added technologies like Bluetooth to some models to make transferring images and ringtones easy and affordable.

- 37 -
Percent of Subscribers with 3G devices 3-month average ending June 2008 and June 2007 Source: comScore MobiLens
Penetration June 2007
Penetration June 2008
Point change -- June 07 vs June 08
Germany 15.1% 23.9% 8.1 Spain 22.5% 37.2% 14.7 France 12.6% 17.1% 4.5 Italy 32.1% 38.3% 6.2 United Kingdom 19.9% 27.6% 7.7 European Total (5 countries) 20.3% 28.3% 8.0 United States 16.7% 28.4% 11.7
Table 5 U.S. and Europe 3G Market (Source: http://www.mmetrics.com)
• US surpasses Europe in 3G penetration: Table 5 and Table 6 show the US has caught up with Western Europe in the adoption of 3G with 28.4% of American mobile subscribers having 3G devices versus 28.3% in the largest countries in Europe.
• Communities will the way to build engagement – Generation C: the population that is always in contact with friends and colleagues and trust them more than your branded messages.
Total Subscribers with 3G devices 3-month average ending June 2008 and June 2007 All Mobile Subscribers 13+ Source: comScore MobiLens
Subscribers June 2007
Subscribers June 2008
Growth Y/Y
Germany 7,021 11,732 67.1% Spain 7,207 12,640 75.4% France 5,616 7,958 41.7% Italy 14,462 18,008 24.5% United Kingdom 8,964 13,100 46.1% European Total (5 countries) 43,270 63,437 46.6% United States 35,651 64,207 80.1%
Table 6 U.S. and Europe 3G Mobile Subscriber Growth (Source: http://www.mmetrics.com)

- 38 -
3. TAXONOMY OF MOBILE WEB APPLICATIONS This section presents a systematic study of mobile web applications, which are software applications running on a mobile web platform. In computer terminology, conventional computer systems include computer hardware, system software, and application software. System software refers to the low level software programs that interact with the computer hardware; examples of system software are operating systems, compilers, and software utilities for managing computer hardware resources. Traditional application software refers to the end-user programs such as database programs and word processors. Modern software application architecture has many tiers. Figure 17 shows the n-tier web application architecture:
• Data tier: this is where the data is stored, e.g. a database management system (DBMS). DBMS includes Structure Query Language (SQL), Data Definition Language (DDL), and Data Manipulation Language (DML). Leading DBMS suppliers include Oracle, MS SQL, MS Access, MySql, and IBM DB2.
• Data access tier: the represents an independent data access layer no matter the DBMS used in the data tier. This layer consists of generic data access and manipulation routines independent from the above application and the below DBMS. This tier is stateless, and scalable for database I/O.
• Business tier: this tier codes the business logic of the application. It is the most important tier that implements the key application logic and algorithms. It interacts with database through the database access tier.
• Presentation logic tier: this tier represents the end-user interface to the application on the server side. The tier can be the server side API that transform the business tier results and/or output into something usable and readable by the end user. Proxy object is an object authorized to act for another; this object refers to software program that performs the actions for the client program. The proxy layer acts on behalf of the distributed logic layer or end user to provide access to the business tier. The proxy concept is useful in distributed computing in which communication between the client and remove server can be via its proxy. Examples of proxy tiers are CORBA, SOAP, RMI, and DCOM. The end-user presentation/client interface, e.g. in Windows format, can be connected directly to the business tier.
• Presentation tier: this tier refers to user interface on the client machine, e.g. HTML or Windows forms. Web browser is the most popular client program.

- 39 -
Figure 17 N-tier Web Application Architecture
(Source: http://www.webopedia.com )
A mobile web platform consists of a mobile device, a mobile operating system, a virtual machine, and a web browser. Figure 18 shows the structure of the taxonomy in which mobile web applications are classified based on features and categories/subcategories.
Features are the unique values that mobile web applications can deliver to customers, whereas categories/subcategories are groupings so that companies and businesses can be comparatively analyzed and summarized.

- 40 -
Mobile Web Applications
ContextSpecific
EverPresent Mobility
LocationBased
Service
MobileSearch
MobileSocial
Network
MobileInfra-
Structure Software/
Widget
MobileWallet
MobileMarketing
MobileEntertainment
Data Collection
Safety Emergency
Taxonomy
Features
Categories
Figure 18 A Taxonomy for Mobile Web Applications
3.1 FEATURES
A mobile device such as a mobile phone is often carried by the user, and since the user is in motion, the device is moving from place to place. Current mobile devices usually are loaded with calendars, address books, tasks, and emails. A feature represents the unique value that mobile web applications together with the mobile platform can deliver to a user. Mobile web applications have the following features:
• Context specific: Context refers to interrelated conditions in which something exists or occurs. In computing, context is related to the information used to characterize the situation of an entity, which is a person, place, or object considered relevant to the interaction between a user and an application, including the user and application themselves. Dourish in his 2004 paper on Personal and Ubiquitous Computing suggested that an individual’s experience and history is part of his/her current context [7]. Beale and Lonsdale in their 2004 paper present a hierarchical description of context in that they define context as “a dynamic process with historical dependencies”. The context is further described as “as set of changing relationships that may be shaped by the history of those relationships.” A user’s mobile phone contains the following information:

- 41 -
o Location: a GPS phone can precisely pinpoint the user’s current location
o Social network and status: names and contacts of one’s social network, e.g. via Facebook or Myspace. For status information, these friends can be characterized by their
• Proximity to others
• Social relationships
• Collaborative tasks.
o Address book
o Personal information: age, gender, and language
o Personal property: one may use mobile phone as a PDA (Personal Digital Assistant), which can store information on his/her personal property information, e.g. car online service account
o Emails
o Instant messages
o Tasks
o Calendars
o Time: current time and time zone
o Orientation: the orientation of a user to determine the direction the user is heading in and thus what is in front, behind, and to either side of them.
o Favorite and historical bookmarks of the mobile web browser
o Navigation history: allows the users to see where they have been and what they have seen and done.
o Physical surroundings: mobile devices can be equipped with sensors to detect physical environment information such as temperature, lighting level (direct sunlight level), and noise level.
o Mobile device system property: this describes the mobile device platform as well as bandwidth and the quality of the positioning information such as the GSP coverage.
The above information describes context in 6 aspects:
o Spatial context: where you are?

- 42 -
o Social context: who you are with?
o Personal (interest) context: what are your past, current, and future interests?
o Physical (surroundings) context: what is your environment?
o System context: what is your platform?
o Information context: what resources are nearby?
Mobile web applications of this feature aims at context awareness. The device provides the context, whereas the service delivers feedback. In [9], user context is collected via “5 Ws”:
o Who – the ability of a device to identify not only its owner but also other people and devices in its vicinity within the environment
o What - the ability to interpret user activity and behavior, and using that information to infer what the user wants to do
o Where - the ability to interpret the location of the user and use that to tailor functionality
o When - the ability to understand the passage of time, use it to understand the activities around and to make inferences
o Why - the ability to understand the reasons behind certain user actions
• Ever present: worldwide mobile phone sales have surpassed PC sales for several years. A key reason of the popularity is people carry mobile phone (small but with needed functionality) not PC for their daily life. As mobile phones become more powerful and the wireline/wireless communication infrastructure becomes more wide spread, ubiquitous computing via mobile devices becomes reality. Mobile web applications on a ubiquitous platform need to satisfy these fundamental requirements:
o Availability: a service should be available independent of context, and regardless of changes in user status, needs, and preferences.
o Transparency: ideally, the applications in this space should allow users to perform tasks in non-intrusive way by hiding the underlying technology.
Since users carry mobile phone wherever they go, it is convenient for users to make purchase, watch news, and play games in addition to read emails and voice mails via the mobile phone platform. There are also a number of mobile web infrastructure software developed on the mobile web such as mobile Instant Massager and Widgets. PDA (Personal Digital Assistance) software is also in this category.
- 43 -
• Mobility: Mobile web applications can provide value by leveraging original mobile network characteristics. For instance, parents can use mobile web on their mobile phone to watch real time video and retrieve information on their babies in infant day care center via sensors and webcams. Diabetes patients can use cell phone together with a glucose meter to report blood sugar levels to doctors for regular checkup. mobile networks originally are developed for the following reasons
o Ease of deployment: mobile infrastructure is cheaper and easier to deploy especially in a foreign environment or a remote region
o Use of sensors: cost-efficient to use sensors to collect information and/or provide real time monitoring
o Safety and emergency: provides a unique solution for user emergency and safety
To sum up, given the 3 features of the taxonomy, mobile web applications should focus on the key values of each feature
• Context: Emphasizing context results in intelligent application providing context-awareness.
• Ever-present: applications with this feature are always available, transparent applications providing user convenience.
• Mobility: applications with this feature are easy to deploy, configure, and maintain applications providing cost-efficiency.
3.2 CATEGORIES
In the light of the features introduced in the previous section, mobile web applications can be grouped into categories and sub categories for comparative market analysis. Each feature has multiple categories. A category is a collection of businesses and/or companies that are related in a certain way.

- 44 -
Mobile Devices &Wireless Communication
Geographical Information System/ Spatial Database
Internet &Web
Web GIS Mobile GIS
MobileInternet
LBS
Figure 19 LBS
3.2.1 FEATURE -- CONTEXT
Context related categories include
• Location based services (LBS): LBS are information and entertainment service that are accessible with mobile devices through the mobile network and utilizing the ability to use the geographical position of the mobile device. Figure 19 shows the LBS are the intersection of 3 technologies: mobile devices and wireless communication, Internet and Web, and Geographical Information System (GIS) and spatial database. GIS and LBS have similarities in relation to the handling of data with positional reference and spatial analysis functions. For example, both are interested in answers to these questions: where am I, what is nearby, and how can I go to a specific location. However, GIS and LBS are developed for different user groups and therefore have different requirements. GIS is designed for professional geographic users and requires extensive computing resources, whereas LBS is targeted for mobile web users and operates under the restriction of mobile platform environment like low computational power, small displays, and limited run time battery of the mobile devices.
An important topic of LBS is a spatial information process model that usually contains a model of possible user questions, defines queries of geographic base data

- 45 -
and location information, and specifies possible answers. Figure 20 shows an example of the cartographic information process if a user asks for positions of restaurants close to his/her current position. There are 4 steps in the process: target space to define communication goals, query space to determine spatial grounding, problem space to apply known attributes, and answer space to locate context and answers.
LBS can be a push or pull based service. A push based service acts on an event and is not bound on user interactions. For instance, when a specific area is entered, a user receives a notification or an alert. A push system can be configured through user needs and preferences. A pull based service delivers information directly requested by the user. A pull service can be functional or informational. For example, an information pull service is needed when a user wants to know the closest Japanese restaurant to his current location; a functional pull service is involved when a user needs a taxi in his current location.
Figure 20 GIS Information Processing
(Source: [8])
LBS is one of the most promising, valuable mobile web application categories. There are potentially a wide range of LBS services developed or to be developed across many industry sectors. Figure 21 shows a taxonomy to group LBS according to the categories of navigation, tracking, management, advertising, information, and billing.

- 46 -
Each subcategory may have multiple domains. For example, a navigation LBS service can be used to provide directions, indoor routing, traffic management, and car park guidance. Likewise, a tracking LBS service can be applied to people, product, or vehicle. A management LBS service can be centered at infrastructure, facility, customer relationship, security, fleet scheduling, or environment. A billing LBS service is either road tolling related or location sensitive billing. An information LBS service can be based on traveling, shopping, or yellow page.
Location Based Service(LBS)
NavigationService
AdvertisingService
ManagementService
Direct-ion
IndoorRouting
Car ParkGuidance
Facility
Infra-structure
CustomerRelation-
ship
Environ-mental
Fleet Scheduling
LocationSensitive
Billing
RoadTolling
Taxonomy
TrackingService
BillingService
TrafficManage-
mentPeople
Product
Vehicle
Security(police,Ambul-Ance)
Subcategories
InformationService
Travel YellowPage
Shopping
Domains
Figure 21 LBS Taxonomy
• Mobile search: refers to information retrieval services on a mobile device platform such as mobile phone. Mobile search is not just simply a spatial shift of PC web search to mobile equipment, but it requires innovation from both mobile contents and mobile use interface. According to eMarketer, a leading market research firm, by 2011, mobile search will account for around $715 million, or 15% of that total mobile advertising market worth nearly $4.7 billion (see Figure 22, source: eMarketer). Mobile content refers to any type of media that is viewed or used on mobile phones. Examples of mobile contents include ringtones, graphics, discount offers, games, and movies. Senior Analyst at eMarketer used the following prediction on mobile search, “whoever cracks the consumer and commercial code for delivering and monetizing relevant answers for people on the go will secure a license to print

- 47 -
money, at least for a time.” As the number of mobile search users and mobile Internet users continues to increase in the next few years (see Figure 22), the mobile search ad revenue will increase dramatically.
US Mobile Internet and Search Users, and Search Advertising Revenues
0
100
200
300
400
500
600
700
800
2006 2007 2008 2009 2010 2011Year
Mill
ions
Mobile Internet UsersMobile Search UsersMobile Search Ad Revenues
Figure 22 U.S. Mobile Internet and Search Users, and Search Revenues
(Source: http://www.emarketer.com)
Figure 23 shows the taxonomy of mobile search with the categories of mobile discovery service, mobile directory search, question and answer service, and mobile optimized search engine. Discovery service offers user recommendation on what they should do next. For example, based on the news the user is currently reading in his current location, discovery service will suggest relevant news that the user should read next. Directory search allows users to find local services in the vicinity of their current location, e.g. call a taxi. Mobile question and answer service allow a user to text a question to a server and receive a reply using text, e.g. via SMS messages. Mobile optimized search engines refer to search engines optimized for mobile search and mobile platform, i.e. optimization in relation to network bandwidth, user location, and mobile user interface of limited screen display.

- 48 -
Mobile Search
MobileDiscovery
Service
MobileQuestion &
AnswerService
MobileDirectory Search
Taxonomy
MobileOptimized
SearchEngine
Subcategories
Figure 23 Mobile Search Taxonomy
• Mobile social network: Wikipedia defines a social network as a social structure made of nodes (individuals or organizations) that are tied by one or more specific types of interdependency such as values, visions, ideas, financial exchange, friendship, kinship, dislike, conflict or trade. With Internet, web, and mobile device, social networking has reached a new height. Facebook and MySpace are well known social networking web sites that allow a user to establish and maintain his/her own social networks. Mobile social networks refer to the social network activities on a mobile phone platform. Based on mobile application configuration, there are 2 types of mobile social network:
o On-deck mobile social network: by working with the network carrier, the community via the default start page on the mobile phone browser is distributed to users. An example of this type of business is JuiceCaster.
o Off-deck mobile social network: the most common type of mobile social network. A user can download the mobile web application and sign in to start to create his/her mobile social network. Examples are MocoSpace and Bluepulse.
An example of mobile social network application is, on a Friday night, a user wants to know if any of his friends are in a bar near here.

- 49 -
3.2.2 FEATURE -- EVER PRESENT
Ever present categories include
• Mobile infrastructure software and widgets: infrastructure software and/or application that are built for mobile phone platform to enable valuable services. Mobile widgets are mobile applications that can be installed on mobile phone/device to add functionality to the device. Mobile widgets can easily be downloaded to the mobile phone via the Internet or often times from the Web directly from the mobile device. Many cell phones even come with widgets already installed, ready to customize and begin using them. For instance, eBay offers a mobile widget ticker for all of one’s bids.
o Instant Messenger (IM): IM built for mobile device platform
o Multimedia support: various image, video, audio formats’ coder and decoder on a mobile device platform
o Microblog: a form of blogging that allows users to write brief text (less than 200 characters) and publish the text. Twitter is the most popular microblog and allows text messaging for blog posting via mobile phones.
• Mobile Wallet: mobile wallet is to use a mobile phone as an e-wallet. NTT DoCoMo developed “Osaifu-Keitai”, literally meaning “Wallet Mobile” in Japanese, the de facto standard mobile payment system in Japan. Osaifu-Keitai services include electronic money, identify card, royalty card, fare collection of public transits (including railways, buses, and airplanes), or credit cards. A mobile wallet can be used for 2 purposes:
o Mobile banking: banking via mobile phone. For example, mFoundary, a startup company in the mobile financial service space, offers regular banking needs such as Bill Payments, Fund Transfers, ATM and Branch Locator, Customer Service Support, Integrated Messaging Services (SMS & Alert), Account Information (Account Balance, Status, Transaction Search) via mobile phone. In remote regions of developing countries, people may not have a computer and certainly require lots of training before they can use the computer. However, all these people have access to mobile phones.
o Mobile payment: e-payment via mobile phone. Settling your payment directly using your phone. For instance, one can directly use his mobile phone for subway and train usage charges.
• Mobile Entertainment: entertainment services via mobile phone. Figure 24 shows the taxonomy of mobile entertainment with the categories of gaming, gambling, music and infotainment, mobile TV, and mobile UGC (User Generated Contents).

- 50 -
Mobile Entertainment
Mobile Gaming
Mobile Gambling
Taxonomy
Mobile User GeneratedContents
(UGC)
Subcategories
Music & Infotainment
Mobile TV
Figure 24 Mobile Entertainment Taxonomy
Mobile Entertainment
0
2000
4000
6000
8000
10000
12000
14000
16000
Games
Music
Imag
esVide
o TVAdu
lt
Gambli
ng
Mill
ions
of D
olla
rs
20062011
Figure 25 Mobile Entertainment Market
(Source: http://www.emarketer.com)

- 51 -
Based on the eMarketer projection, the current major categories of mobile entertainment include music, images, video, games, adult, gambling, and TV. By 2011, the three leading categories of mobile entertainment are mobile music, mobile games, and mobile video. The 2006 market of mobile music is $7.4 billion and the 2011 market of mobile music will be $13.6 billion (see Figure 25).
• Mobile Marketing: describes marketing on or with a mobile device. Marketing on a mobile phone has become increasingly popular ever since the rise of SMS (Short Message Service) in the early 2000s in Europe and some parts of Asia. There are several means that marketing messages can reach a mobile device:
o SMS: in fact, SMS marketing has become a legitimate advertising channel in some parts of the world. Network carriers in these countries provision specific channels for marketers so the SMS messages are different from the usage of email messages that are sent over the public Internet. The carriers charge marketers based on usage, e.g. how many SMS messages are sent, how large is the SMS message, and how many times the SMS messages need to be sent.
o MMS (Multimedia Message Service): MMS contains images, text, audio, and video contents. MMS can be considered as multimedia enhancements to SMS.
o Bluetooth: these are offered as hotspot systems that consist of content-management system with Bluetooth distribution function. Once a user registers in a hotspot area via his mobile phone, he will receive emails, SMS, and/or MMS messages from the hotspot content management system.
o Infrared: some European companies offer “shopping window marketing” via free infrared waves.

- 52 -
Mobile Marketing
In-GameMobile
Marketing MobileWeb
Marketing
Taxonomy
MobileViral
Marketing
Subcategories
User ControlledMedia
Figure 26 Mobile Marketing Taxonomy
Figure 26 shows the taxonomy of mobile marketing with the categories of in-game mobile marketing, mobile web marketing, user-controlled media, and mobile viral marketing. As the gaming industry grows in the Internet and mobile web sector, games become more sophisticate and complex such as interactive real-time 3D and massive multi-player games. Brands and businesses can deliver promotional message within mobile games or sponsoring entire games to drive consumer engagement. Advertising on mobile web pages are similar to the advertising on PC web pages except that mobile web advertising need to be aware of mobile properties such as locations and mobile platforms. User controlled media refers to advertising that is initiated by the consumer. Mobile viral marketing relies on consumers to transmit content via mobile devices to other potential consumers in their social network and to animate these contacts to also transmit the content.
According to eMarketer estimation, the world wide general mobile advertising spending is slightly over $4 billion in 2008 and will reach $12 billion in 2011 (see Figure 27).

- 53 -
World Wide Mobile Advertising Spending
0
2000
4000
6000
8000
10000
12000
14000
2006 2007 2008 2009 2010 2011
Year
Bud
get i
n M
illio
ns
General mobile ad spending Mobile Multimedia ad spending
Figure 27 Mobile Marketing Revenue Projection (Source: http://www.emarketer.com)
3.2.3 FEATURE – MOBILITY
A mobile network via mobile devices and sensors can be deployed quickly to achieve a number of objectives. Mobile web application leveraging mobility can greatly enhance operation efficiency as well as improve operation safety.
• Data collection: mobile devices can be used in various industrial engineering projects to improve operation efficiency and reduce operation costs. For example, periodical medical measurements or readings can be collected through mobile phones instead of frequent doctor visits by the patients.
• Real time monitoring: sensors can provide real time monitoring and sampling, and provide feedback for intelligent, automatic management systems. For instance, a traffic mobile web application can provide real time traffic monitoring and congestion report for subscribers.
• Safety and emergency: mobile devices with mobile web applications can provide unique solutions to cope with various safety and emergency situations. For example, after earthquake, wireless communication provides the quickest recovery for the communication infrastructure. Mobile web applications can also be used for logistics coordination during disaster recovery.

- 54 -
3.3 EXAMPLES OF EXISTING MOBILE WEB APPLICATIONS
In the taxonomy, the features emphasize the unique values that the mobile web applications deliver to the customers, and the categories refer to the groupings under each feature. This section goes through example companies in selected categories to highlight their market, product, and their competitive strengths. Figure 28 shows the list of companies in each category; some companies are well-known companies such as Yahoo and Google but others are still in startup stage such MobiLuck.
Taxonomy -Mobile WebApplications
ContextSpecific
Ever Present Mobility
Location Based Service
Mobile Search
MobileIM /
Widget
Mobile Wallet
Data Collection -Health Care
Emergency
MobiLuck.com
NetworksInMotion
.com
Buzzd.com
Loopt.com
mobile.google.com
mInfo.com
mobile.yahoo.com
JumpTap.com
IXI MobileOgo.com
ebuddy.com
Comverse.com
Colibria.com
VodaphoneMobile-As-Credit-Card
MedApps.com
Alivetec.com
Alive HeartMonitor
MIT Media LabDisasterRecovery
MobileMarketing
MobileEntertain-
ment
Handango.com
Makayama.com
Phonature.com
Mobilegamesdb.com
NokiaMosoko
Avalis.chTelemedicine
DoCoMoiMobile
InMotionPromotion
.com
PunchkickInteractive
.com
mobilestorm.com
Categories
Companies
Features
mshopper.net
digby.com
MobileSocial
Networking
trutap.com
BuzzCity.com
myGamma
BluePulse.com
ComVu.com
DiabetesInControl
.comT + Diabetes
Figure 28 Example Companies for Mobile Web Application Taxonomy
Due to the space limitation of the thesis, the following companies are selected for report in the thesis.
• Context Specific
o Location Based Service (LBS): Loopt

- 55 -
o Mobile Search: Google’s mobile search
o Mobile Social Network: Trutap
• Ever Present
o Mobile Infrastructure Software: eBuddy
• Mobility
o Mobile Health Care & Data Collection: MedApps
3.3.1 LOOPT (WWW.LOOPT.COM)
Loopt is a mobile social mapping application company that offers social networking tools via GPS maps. The company is based in Mountain View, California. The Loopt application shows friends on a map in relation to their current location and status such as available or away. The users can request alerts when friends are within a certain distance. The users can also broadcast emails, messages, images, or videos to friends in a specific region, and tag and blog the physical location so that friends can access through the Loopt application.
(a)iPhone
(b)BlackBerry
(c) Loopt blog Figure 29 Loopt
(Source: http://www.loopt.com)

- 56 -
Loopt was founded in 2005, and received seed funding from Y Combinator. The company received $5 million in Series A funding from Sequoia Capital and New Enterprise Associates and launched its service on Boost Mobile networks in September 2007. In August 2007, Loopt started services on selected phones for Sprint, and in June 2008, the company started its service on Verizon networks.
As of October 21, 2008, the Loopt application is available at the networks of Verizon, AT&T, Sprint, Nextel, T-Mobile, Boost Mobile, and MetroPCS over 100 types of phones, most notable RIM’s Blackberry (Pearl, Curve, and World 8830) and Apple’s iPhone (original iPhone and 3G iPhone). Figure 29 shows the Loopt application on 3G iPhone, Blackberry Pearl, and the blog. The Loopt blog provides Journal widgets to allow users share their blogs and multimedia contents with their friends easily.
The main products from Loopt’s geosocial networking services include:
• Mobile web application: provides real-time location updating. Users can use Loopt application to update location, status and share social and location information with friends. For iPhones, in addition to real-time location and status tracking, Loopt also integrated Yelp contents to the iPhone platform. The Loopt application also integrated Twitter status and Facebook status.
• Web portal: Loopt provides a web portal that is synchronized with the mobile version of the Loopt service.
• Facebook application: use Loopt as an application of the Facebook to leverage one’s Facebook social network.
Loopt user requires registration that includes full name, phone number, date of birth, and email address. Through profile settings, a user can choose the receiving of geo-social information and/or alert.
The two main competitors of Loopt are Jaiku and Dodgeball. According to the web site statistics, Loopt has performed well in the past year by increasing the unique number of visitors by 370.5% (see Figure 30). By comparison, its main competitor, Jaiku, only improved 7.4%. Although Jaiku started business early than Loopt, Loopt has been doing well in the past year and attracted more attentions than any of its competitors. However, the data also shows that success can be very transient.

- 57 -
Figure 30 Comparison of Loopt.com, Dodgeball.com, and Jaiku.com
(Source: http://www.compete.com)
Loopt is still an early stage startup company. The company is actively working closely with wireless network carriers to roll out value-added location-based revenue services requiring user subscription. The company’s revenue comes from Loopt service subscription.
3.3.2 GOOGLE (WWW.GOOGLE.COM) MOBILE SEARCH
Google is the leading web search engine in the USA, earning revenues from advertising related to web search, email, on-line mapping, office productivity, social networking, and video sharing. The company is co-founded by Larry Page and Sergey Brin in late 1990s, and the company’s headquarter is located at Mountain View, California. Google became a public company in August 2004 making it a $23 billion dollar company; in Jan 2008, Google had a market cap of over $200 billion US dollars. Google’s main mobile products include
• Mobile search: web search from mobile devices
• SMS: use text messages to get quick information from Google, including local listings, sport scores, weather conditions, and real time flight information
• Mobile Device Calendar: Google calendar on mobile device

- 58 -
• News: keep informed of global and local events at all time with news headlines and articles from your mobile phone
• Other Google web products: run other popular Google products from your mobile device. These products include Google Maps, Gmail, YouTube, Google Blogger, and Picasa Web Albums.
Google’s main competitors include Yahoo, MSN, and ASK. In May 2008, Google’s search accounts for 68% of the search in the US while yahoo is in the distant second, with 20% of the search market (see Table 7 for competitor analysis). Comparing with a year ago, Google improves its lead by 3% while yahoo loses 1% of the US market share. In the UK, Google’s dominance is even bigger. In May 2008, Google has 87% of the UK search market, which represents 12% increase over the year before. The rest of the UK search market is divided as follows: yahoo 4.09%, MSN 3.72%, and ASK 3.07%. In the mobile search area, Google continues its dominance according to Nielsen Mobile. It is estimated that Google has the 61% of the US mobile search market in the first quarter of 2008 (Table 8). Yahoo came in second at 18%, and MSN has around 5% of the mobile search market. According to Compete.com, the number of unique users for Google web search continued to increase by 3.5% while the number of Yahoo’s users decreased by 2.6% (see Figure 31). Ongoing research indicates finding satisfactory results is still a bit of a challenge when it comes to mobile search. Only 44% of Google searchers and 40% of Yahoo searchers rated their experience in the 8-10 range on a scale of 10.
Percentage of U.S. searches among leading search engine providers Domain May 08 Apr 08 May 07 Google.com 68.29% 67.9% 65.13% Search.yahoo.com 19.95% 20.28% 20.89% Search.msn.com 5.89% 6.26% 7.61% Ask.com 4.23% 4.17% 3.92%
Table 7 U.S. Web Search Market (Source: http://www.nielsenmobile.com )
Google Mobile Search Yahoo Mobile Search Information 33% 33% Local Listings 29% 24% Websites/navigation 27% 26% Others 11% 17% Male vs Female User 65% vs. 35% 63% vs. 37%
Table 8 Google and Yahoo Mobile Search Revenue Decomposition (Source: http://www.nielsenmobile.com )

- 59 -
Figure 31 Comparison of Yahoo.com, Google.com, Msn.com, and Ask.com
(Source: http://www.compete.com)
Mobile search revenues come from advertisement that posted by companies and businesses selling products and services. In Google’s 3rd quarter 2008 SEC filing ended September 2008, Google’s advertising revenues from online search (including mobile search) made up 97% of total revenues, over 5.5 Billion US dollars. Google AdWords is an automated online program that enables advertisers to place targeted text-based and display ads on Google web sites and Google Network members’ web sites. Most of AdWords customers pay on a cost-per-click basis, which means that an advertiser pays only when a user clicks on one of its ads. Google AdWords is also offered on a cost-per-impression basis that enables advertisers to pay based on the number of times their ads appear on the web sites and Google Network members’ web sites as specified by the advertiser. Google AdSense refers to the online programs through which Google distributes advertisers’ AdWords ads for display on the web sites of Google Network members as well as programs to deliver audio ads on radio broadcasts, print ads for display in newspapers and magazines, and ads on television broadcasts. The AdSense programs include AdSense for search and AdSense for content. For online AdSense program, Google advertisers pay a fee each time a user clicks on one of advertisers’ ads displayed on the Google Network members’ web sites or, for those advertisers who choose cost-per-impression pricing, as their ads are displayed.
In Google’s SEC yearly report, the company share a portion of the advertise revenues from online search (including mobile search) with Google Network members as traffic acquisition
- 60 -
costs under cost of revenues. Google Network members do not pay any fees associated with the use of AdSense program on their web sites.
3.3.3 TRUTAP (WWW.TRUTAP.COM)
Trutap Limited (Trutap) develops mobile social networking applications to allow users to stay connected to their social lives wherever they go. These applications provide an integrated, social networking mobile platform, which let users to chat friends on their mobile phones, get live updates from friends and meet new people, share and download games, sports, news, horoscopes, and ringtones, and allow users to post blogs and photos all from their mobile phones.
The company was funded in 2007 by Doug Richard and David Whitewood. In September 2007, Trutap received $13 million US dollars in series A funding led by Tudor Group. When asked for Trutap’s market position, Trutap’s CEO, Doug Richard has the following statement:
“We are passionate about building our free service and offering, an easy way for people to stay connected to their social lives. Aimed at 18-24 year olds, Trutap is the first service to combine all the elements of a young person's social life into one. We see huge market demand in our service and this new infusion of capital will enable us to continue broadening our services and accelerate our leadership position in the industry.”
TruTap’s product combines several elements of a young person’s social life into one mobile web application, and offers the ability to IM (MSN, Yahoo!, AIM (AOL), GoogleTalk, Jabber.org, ICQ, Rediff Bol, and Facebook), group message, upload text and pictures to blogs and send pictures via a mobile, specifically
• IM – access all accounts and converse with everyone at the same time
• Blog and Photo Sharing sites – supports Blogger, Blog.com, Livejournal, Flickr, NyOpera, Photobucket, Typepad, Friendster, Xanga, and WordPress so text and pictures can be uploaded
• Messaging – picture messaging, online status and group message with ‘all’ reply functionality
TruTap’s applications are free to download http://trutap.com/?trigger=download, and they are ranked as top recommended applications by Nokia. The major mobile phone platforms supported are Nokia, Sony Ericsson, Motorola, LG, Samsung, and Panasonic smartphones and selected main mobile phone platforms on GSM networks. The application itself does

- 61 -
not require special configuration, and offers a privacy setting that can restrict access and block users. Trutap can also be used via a web browser from a Windows desktop and/or laptop computer.
Figure 32 Comparison of Trucap.com, Bluepulse.com, and Buzzcity.com
(Source: http://www.compete.com)
The main competitors of Trutap include Bluepulse.com and BuzzCity.com. According to Compete.com, the visitors to TruTap in the year of 2008 increased by 454.4% (see Figure 32).
Trutap is still an early stage startup company. Its revenues come from online advertising, a similar business model as Facebook and MySpace.
3.3.4 EBUDDY (WWW.EBUDDY.COM)
EBuddy is a web based instant messaging aggregation service that enables users to chat with their Yahoo, Google Talk, MSN, MySpace, Facebook, ICQ, and AIM buddies. By leveraging the web, the service is not only available via mobile phones but is independent of network carrier or device via WAP or mobile Internet browser. Ebuddy software allows multiple instant messaging networks in one interface.

- 62 -
The company was founded by Paulo Taylor in 2003. The original name of the company was e-messenger. In 2006, e-messenger was renamed to eBuddy.
EBuddy software can be downloaded at http://get.ebuddy.com. It supports these platforms: Blackberry, HTC, LG, Motorola, Palm, iPhone, Nokia, PocketPC, SonyEricsson, Samsung, T-Mobile, Orange, Qtek, Sharp, and Siemens. The service requires the creation of a login ID at eBuddy. The company offers a secure login option. Users can also indicate if they wish to sign on invisibly. The chat client includes a tab mode setting to differentiate chat windows, similar to tabbed web browsing (see Figure 33).
Figure 33 eBuddy.com Application
(Source: http:www.ebuddy.com)
EBuddy’s competitors are listed in Table 9. According to EBuddy web site, the company has active users of 60 millions.

- 63 -
Product/Service Name User count Date
40.3 million peak online (majority in China) May 2008
317.9 million "active" (majority in China) May 2008 Tencent QQ 783 million total accounts “active” (majority in China)
May 2008
Windows Live Messenger 300 million active worldwide November 2007
Yahoo! Messenger
248 million active registered Yahoo global users January 2008
12 million peak online February 2008 Skype
309 million total April 2008
53 million active September 2006 AIM
>100 million total January 2006
eBuddy 60 million total December 2008
IBM Lotus Sametime 17 million total (private, in enterprises) November 2007
ICQ 15 million active July 2006
Xfire 11.5 million total October 2008
Gadu-Gadu 6 million active (majority in Poland) June 2008
Paltalk 3.3 million unique visitors per month August 2006
IMVU 1 million total June 2007
Mail.ru Agent 1 million active (daily) September 2006
Meebo 1 million total October 2006
Table 9 List of eBuddy Competitors (Source: http://en.wikipedia.org/wiki/Instant_messaging)
EBuddy’s revenues come from online advertising. Its software and service are free for end users.
3.3.5 MEDAPPS (WWW.MEDAPPS.NET)
MedApps is a health monitoring product innovation company that offers products and solutions to replace expensive, hard-wired monitoring systems with mobile wireless technology in portable mobile devices. The MedApps solution allows users to use off-the-shelf medical devices to collect their health readings. The company believes that there are

- 64 -
many diseases that can be managed at home by patients in coordination with their health care providers. MedApps’ mobile applications extend these benefits. When patients are compliant and regularly monitored, the benefits are two-fold:
• the patient’s quality of life can be improved through a slower progression of their diseases
• the healthcare costs can decrease as patients are delayed or kept from progressing to costlier disease states, resulting in fewer doctor office visits and hospital stays.
MedApps’s headquarter is located in Scottsdale, Arizona. MedApps’s products are designed to address the challenges of chronic care management, connecting large health care enterprises with their members for efficient, near real-time medical monitoring. The MedApps’s system includes individual technology products for collecting and transmitting patient-monitored information, and software applications used by health care providers to receive, analyze and store the patient information (see Figure 34).
Figure 34 MedApps Applications
(Source: http://www.medaps.net)

- 65 -
Specifically, MedApps’s product lines include
• HealthPAL: Portable hub embedded with Bluetooth and M2M cellular chip, which allows wireless collection and transmission of data from inexpensive, off-the-shelf medical devices.
• HealthPOD: A docking station for HealthPAL that acts as charger. It allows multiple device inputs and transmission of data via phone line.
• HealthLINK: Wireless adapter allows additional, low-cost, off-the-shelf, medical devices to communicate to HealthPAL.
• HealthCOM: Complete server software for online remote patient management and data storage.
• VoicePAL: Provides off-the-shelf medical devices the ability to “speak” readings to patients (audio only / no transmitting functionality).
• MedPAL: Medication storage, reminder, and alert system that communicates through HealthPAL.
MedApps’s products and solution currently has the following market focus:
• Disease Management: offering 3 steps product in disease management
o Recording and transmitting patient monitor readings
o Receiving, storing and analyzing patient-sent data
o Viewing, monitoring and acting upon patient-sent data.
• Corporate Wellness: Preventative health programs, otherwise known as “wellness programs,” are activities that help to prevent chronic conditions. These programs are viewed as a way of proactively reducing healthcare consumption, which results from chronic illnesses, by implementing preventative or self-managed healthcare programs. These programs motivate their participants to engage in fitness programs, maintain balanced diets and encourage other health promoting activities in order to avoid costly chronic conditions in the future.
• Consumer DTC: automatically sending the consumers personal health data to a central repository (e.g., Microsoft HealthVault, Google Health) so that it can be reviewed and/or analyzed at a later stage.
• Implanted Devices: designed to be able to incorporate different configurations to meet the requirements of Implanted Devices, including Loop Recorders, Continuous Glucose Monitors (CGM) and Insulin Pumps.

- 66 -
• PERS (Personal Emergency Response System): the ability to provide both an active and a passive PERS feature.
3.4 MOBILE WEB APPLICATIONS VS. NATIVE MOBILE APPLICATIONS
Native mobile applications are traditional mobile applications for mobile devices whereas mobile web applications are web applications on mobile devices. The key difference is to leverage the web standard in the mobile web applications. As such, mobile web or native mobile applications are implementation issues from the taxonomy perspective, and does not have direct impact on the features and categories in this taxonomy.
Since the birth of PDA (Personal Digital Assistant) and smartphones, there are a number of native mobile applications developed on various mobile phone platforms. For instance, Palm native software application development was very popular a few years ago and the Palm development conference of the year of 2005 attracted over 100,000 people. At one time, it was estimated that there are over 130,000 Palm native mobile application developers worldwide. However, with the strong competition from RIM and HTC and the recent iPhone effort from Apple, the mobile application space has changed dramatically. Leveraging the web and the browser, mobile web application development has several advantages:
• Web browser: supporting mobile applications directly over native mobile phone platforms has been a challenge since their inception. Sometimes, even one product may have several versions, and unfortunately these versions are not backward compatible. From product management perspective, a mobile application software company has to select and manage the set of target market platforms. The web browser plays the roles of a universal client program over all mobile phone platforms. A mobile web application is able to reach a larger market as long as it can run inside a web browser. Table 10 lists the popular mobile browsers by vendor in the current market.

- 67 -
Mobile Phone and/or PDA Vendor Mobile Web Browser(s) Palm Blazer (based on NetFront), iPanel, Handspring
Bluelark RIM Blackberry Proprietary Blackberry Browser Apple iPhone Safari (based on WebKit) Google Chrome – Android platform Microsoft IE Mobile, Deepfish Jataayu Software - Symbian Series 60, Windows Mobile and Linux platforms
jB5 Mobile Browser
Danger, T-Mobile Sidekick Proprietary Danger Browser Infraware Embider Motorola MOTOMAGX (based on WebKit) ACCESS CO NetFront Nokia Nokia Series 40, Web Browser for S60 Obigo AB owned by Teleca AB Obigo Browser Purple Labs Openwave Mobile Browser Opera Software ASA Opera Mobile, Opera Mini Picsel Technologies Picsel Browser Sony PlayStation Portable Web Browser Torch Mobile Iris Browser Digital Airways Wapaka Browser Sun Microsystem Pixo Mozilla Foundation Minimo
Table 10 List of Mobile Web Browsers
• Lower cost: even for mobile application companies that have customers and existing products and platforms, leveraging the web and the browser potentially lowers operation costs. For instance, leveraging the standard web technology and existing web browsers can reduce the complexity in quality assurance testing and product development.
• Business model: most importantly, with the advance of Internet, mobile technology, and the web, the mobile web applications are moving towards the cloud computing business model, i.e. software as a service (SaaS). Instead of mobile application software development, a company may transform to become a web service company to directly reach consumers not only enterprise customers.
3.5 MOBILE WEB APPLICATIONS VS. MOBILE WEB AGGREGATION
Mobile web aggregation is a special type of mobile web application, which requires integrating data from multiple sources, at least one of the data sources from the web. For the features in the taxonomy,

- 68 -
• Context specific: applications providing context specific features are naturally mobile web aggregation applications. Since the applications need to be context aware, the context information must be integrated into the applications.
• Ever present: applications providing ever present features may or may be mobile web aggregation applications. The value of these applications is to provide user convenience. For the categories under this feature in the taxonomy,
o Mobile wallet: mobile web applications in this category are not mobile web aggregation applications.
o Mobile entertainment: mobile web applications in this category are not mobile web aggregation applications.
o Mobile infrastructure software and widgets: usually infrastructure software and widgets enable certain features on mobile platform. Software itself is not a mobile web aggregation application. However, customizing the widget and software to provide user convenience may become a mobile web aggregation application.
o Mobile marketing: the concept and the means to reach the consumer, e.g. SMS, are not mobile web aggregation. However, an effective mobile marketing application may integrate data from multiple sources including web source. Only then, a mobile marketing application becomes a mobile web aggregation application.
• Mobility: applications providing mobility features may or may be mobile web aggregation applications. For the categories under this feature in the taxonomy,
o Data collection: if the application is simply to collect data and forward to a backend server for processing, this application is not mobile web aggregation. However, if the application also processes and integrates data from multiple sources including web source, the application is mobile web aggregation.
o Safety: if the safety application integrates data from multiple sources including web source, this application is mobile web aggregation application.
o Emergency: if the emergency application integrates data from multiple sources including web source, this application is mobile web aggregation application.
A mobility application can be as simply as a sensor data collection application or as comprehensive as a vertical domain application, e.g. a mobile medicare system. As the application logic becomes complex, it should takes advantage of the information available on the Internet. Therefore, complex mobility applications are usually mobile web aggregation applications.

- 69 -
4. MOBILE WEB AGGREGATION Web aggregation refers to web applications that integrate data from multiple information sources. Current examples of web aggregation are mashups. The relationship of mobile web aggregation to web aggregation is similar to that of mobile search to web search. Mobile web aggregation is not simply shifting web aggregation applications to mobile platform. Mobile web aggregation can certainly build on top of web aggregation to leverage web platform and mashup. However, there are a number of issues that mobile web aggregation applications must address: mobile web content in relation to personalization, mining, and discovery, mobile application user interface, mobile context & relevance modeling. In addition, mobile computing is characterized by task dynamism, which is the result of software applications constantly running under the dynamic changes of activities as well as operating environments. The performance of mobile web applications is restricted by battery power, memory and screen size.
Mobile web aggregation is a new concept. As discussed in Section 3.5, not all features in the taxonomy will always produce a mobile web aggregation application. In the rest of this thesis, mobile web aggregation is defined as a mobile web application aiming at integrating contents from multiple sources, at least one from the web, according to specific user context. Therefore, the focus of the mobile web aggregation is on the context-specific mobile web applications in the taxonomy.
The rest of this chapter is organized as follows. The mobile web aggregation platform is presented first; the platform provides an overview of the platform environment supporting mobile web aggregation. Then, the key areas of mobile web aggregation are discussed in the order of context modeling, mobile application user interface, mobile application logic (including web personalization and mining), and mobile aggregation strategy.
4.1 MOBILE WEB AGGREGATION PLATFORM
Mobile web aggregation refers to application software, and mobile web aggregation platform describes the mobile web aggregation environment. Figure 35 shows mobile web aggregation platform. Mobile operating system is the operating system for mobile devices, i.e. the resource manager for native mobile devices. Current mobile operating systems include Windows Mobile, Palm OS, Symbian OS, and Google Android. Mobile infrastructure software refers to infrastructure software running on top of the mobile operating system and enabling key mobile platform functionality. Examples of mobile infrastructure software are mobile web browser, instant messaging, and mobile multimedia drivers and managers. Java virtual machine represents J2ME.
There are a number of leading web portals such as Google, Amazon, and Ebay. These web portals provide web APIs to allow mobile web applications to dynamically query and receive web contents from their clouds (e.g. Google cloud). Through RSS channel, the web application can receive web portal updates via subscription. The three main components in the mobile web aggregation are the context model, the mobile application logic, and the application user interface. The context model describes the context to be used by the

- 70 -
application logic. Application logic is the brain of the aggregation, and in addition to the functions, the application also has a relevance model for filtering and integrating information on behalf of users.
Web Portal API
Mobile WebAggregation
RSS
Mobile Application
Logic
Mobile Device
Mobile Operating System
Mobile Infrastructure Software Java Virtual Machine
MobileApplication
User Interface(adapt to specific
platform)
MobileContextModel
Web Portalse.g. Google Maps
Figure 35 Mobile Web Aggregation Platform
Table 11 comparatively lists the major mobile device application development platforms. The table is edited based on contents from mobile development discussion from Wikipedia. The columns of the table represent the name of mobile device platform, the programming language used in the development platform, the learning curve of the development platform, the debuggers available, the Integrated Development Environment available, the cross platform interoperability, and the cost of the development platform respectively. Among the alternatives, J2ME and Android are Java based development platform, iPhone and BREW are C based platform, and Palm, Symbian, and Pocket PC are C++ based platform.

- 71 -
Platform Name
Program Language
Learning Curve
Debuggers available
Emulator available
Integrated Development Environment
available
Cross-Platform Deploy-
ment
Develop- ment
Tool Cost
Android Java Average
Debugger integrated in Eclipse, Standalone debugging monitor
Free Emulator
Eclipse, Android (Plugin for Netbeans)
Average Free
iPhone C, Objective C Difficult Average Free Mac OS X 10.5
IDE only available on Mac OS X 10.5
Compile per target; Mac OS only
Free; need approval if want to sell through Apple Store
J2ME Java Average Excellent
Free Emulator, Sun Java Wireless Toolkit, mpowerplayer
Eclipse,LMA NetBeans Mobility Pack
Average (many VM implementations have device specific bugs)
Free
Palm OS C, C++ Excellent Average
OS 1.0 - 4.1: Free Emulator provided by PalmSource (Access); OS 5.0: - 5.4 Device-specific Simulators provided by Palm (palmOne)
Palm OS Development System (Eclipse), CodeWarrior
Palm OS handhelds, or Windows Mobile with StyleTap emulator
Free (POSE or GCC for Palm OS), or commercial (CodeWarrior), or various commercial rapid-development frameworks
Symbian C++ Difficult Good on latest version.
Free Emulator Many choices Compile per
target
Varies (free tools available)
.NET Compact
Framework C#, VB.NET Average Excellent Bundled with
IDE Visual Studio 2005, 2003
only Windows Mobile
Free (but only basic tools)
Python Python Excellent Average Add-on to Nokia Emulator
Several, including plugins for Eclipse
Interpreted language available natively only on Nokia Series60; there are ports to other mobile platforms, including PalmOS
Free
Pocket PC C, C++ Average (excellent for Win32
Excellent Bundled with IDE
Visual Studio 2005
only Windows Mobile
Requires Visual Studio
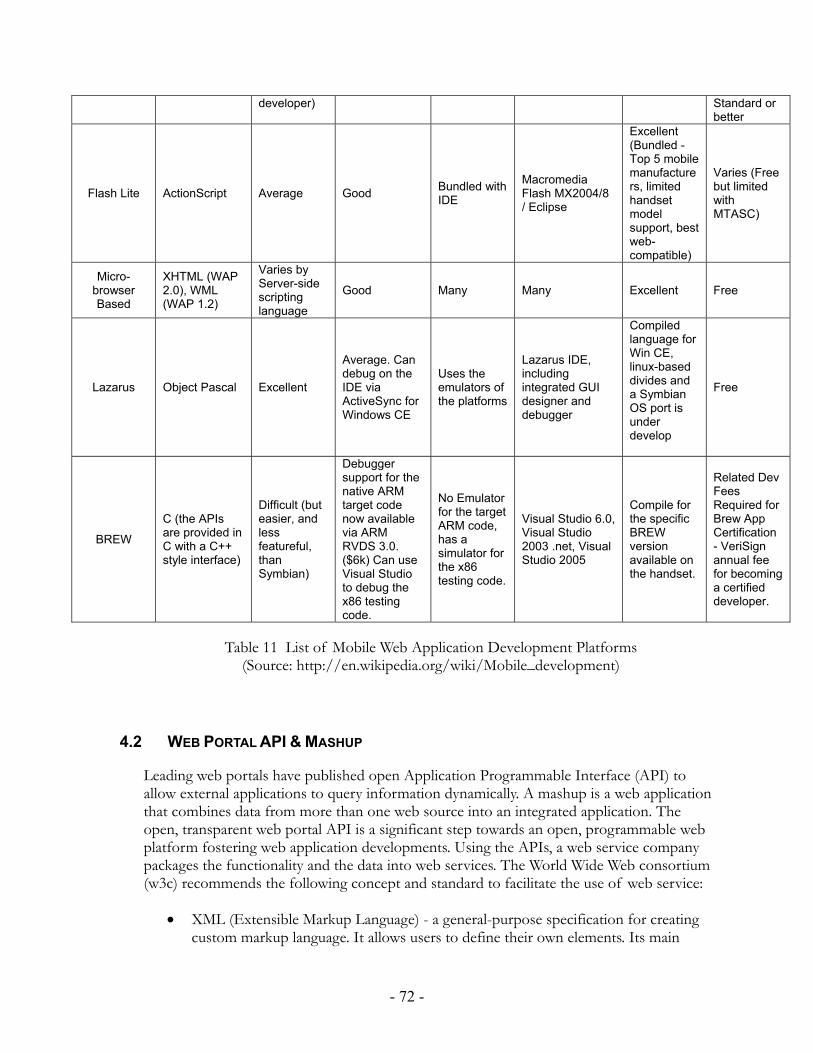
- 72 -
developer) Standard or better
Flash Lite ActionScript Average Good Bundled with IDE
Macromedia Flash MX2004/8 / Eclipse
Excellent (Bundled - Top 5 mobile manufacturers, limited handset model support, best web-compatible)
Varies (Free but limited with MTASC)
Micro-browser Based
XHTML (WAP 2.0), WML (WAP 1.2)
Varies by Server-side scripting language
Good Many Many Excellent Free
Lazarus Object Pascal Excellent
Average. Can debug on the IDE via ActiveSync for Windows CE
Uses the emulators of the platforms
Lazarus IDE, including integrated GUI designer and debugger
Compiled language for Win CE, linux-based divides and a Symbian OS port is under develop
Free
BREW
C (the APIs are provided in C with a C++ style interface)
Difficult (but easier, and less featureful, than Symbian)
Debugger support for the native ARM target code now available via ARM RVDS 3.0. ($6k) Can use Visual Studio to debug the x86 testing code.
No Emulator for the target ARM code, has a simulator for the x86 testing code.
Visual Studio 6.0, Visual Studio 2003 .net, Visual Studio 2005
Compile for the specific BREW version available on the handset.
Related Dev Fees Required for Brew App Certification - VeriSign annual fee for becoming a certified developer.
Table 11 List of Mobile Web Application Development Platforms (Source: http://en.wikipedia.org/wiki/Mobile_development)
4.2 WEB PORTAL API & MASHUP
Leading web portals have published open Application Programmable Interface (API) to allow external applications to query information dynamically. A mashup is a web application that combines data from more than one web source into an integrated application. The open, transparent web portal API is a significant step towards an open, programmable web platform fostering web application developments. Using the APIs, a web service company packages the functionality and the data into web services. The World Wide Web consortium (w3c) recommends the following concept and standard to facilitate the use of web service:
• XML (Extensible Markup Language) - a general-purpose specification for creating custom markup language. It allows users to define their own elements. Its main

- 73 -
purposes are twofold: to help information systems share structured data via the Internet, and to encode documents and serialize data.
• SOAP (Simple Object Access Protocol) - a protocol for exchanging XML based messages in the Internet normally using HTTP/HTTPS. SOAP is the foundation layer of the web service protocol stack providing a basic messaging framework upon which abstract layers can be built. SOAP is platform and language independent; unlike CORBA and DCOM, SOAP is allowed by the firewalls.
• WSDL (Web Service Description Language) – an XML based language that provides a model for describing and locating web services. The WSDL defines services as collections of operations, known as ports. Other major elements in WSDL include messages, data types, and binding. The binding element defines the message format and protocol for each port. The abstract definition of ports and messages is separated from their concrete use, which allows the reuse of these definitions. A port is defined by associating a network address with a reusable binding, and a collection of ports define a service. Messages are abstract descriptions of the data being exchanged, and port types are abstract collections of supported operations. The concrete protocol and data format specifications for a particular port type constitutes a reusable binding, where the operations and messages are then bound to a concrete network protocol and message format.
Web service defines the component framework so that third-party applications can use services transparently over the web. A web service company usually publishes a set of external API representing its web services. Mashup is the web aggregation framework constructed upon the web services and open API.
Table 12 shows the top 25 Web Portal API (as September 4, 2008). The “Mashup” column represents the number of mashup applications developed using the corresponding web API.
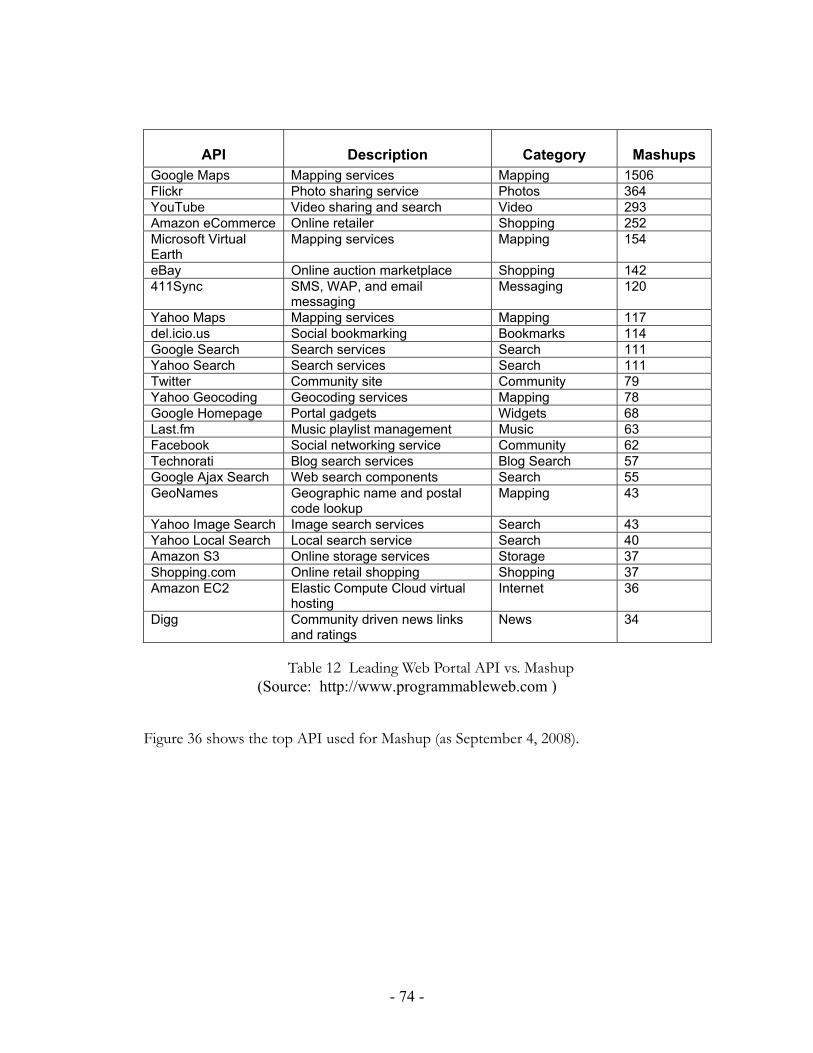
- 74 -
API Description Category Mashups Google Maps Mapping services Mapping 1506 Flickr Photo sharing service Photos 364 YouTube Video sharing and search Video 293 Amazon eCommerce Online retailer Shopping 252 Microsoft Virtual Earth
Mapping services Mapping 154
eBay Online auction marketplace Shopping 142 411Sync SMS, WAP, and email
messaging Messaging 120
Yahoo Maps Mapping services Mapping 117 del.icio.us Social bookmarking Bookmarks 114 Google Search Search services Search 111 Yahoo Search Search services Search 111 Twitter Community site Community 79 Yahoo Geocoding Geocoding services Mapping 78 Google Homepage Portal gadgets Widgets 68 Last.fm Music playlist management Music 63 Facebook Social networking service Community 62 Technorati Blog search services Blog Search 57 Google Ajax Search Web search components Search 55 GeoNames Geographic name and postal
code lookup Mapping 43
Yahoo Image Search Image search services Search 43 Yahoo Local Search Local search service Search 40 Amazon S3 Online storage services Storage 37 Shopping.com Online retail shopping Shopping 37 Amazon EC2 Elastic Compute Cloud virtual
hosting Internet 36
Digg Community driven news links and ratings
News 34
Table 12 Leading Web Portal API vs. Mashup (Source: http://www.programmableweb.com )
Figure 36 shows the top API used for Mashup (as September 4, 2008).

- 75 -
Figure 36 Mashup API Marketshare (Source: http://www.programmableweb.com )
4.3 CONTEXT MODELING
The context in mobile web applications can be described in 6 aspects:
• Spatial context: location and orientation
• Social context: social network and status
• Personal context: personal interests
• Physical (surrounding) context: time and environment
• System context: mobile platform and communication channels
• Information context: external available resources
The context information in mobile applications changes frequently and unexpectedly. When the element of context information changes, the mobile web application must react and adapt to the change. For instance, before a user enters a museum, his phone service is turned on. After he enters the museum, the mobile web application can switch down the ring tone of the mobile phone and accept the museum directory service for library catalogue search.
Conceptual Graph (CG) can be used to model the mobile context and context changes [50, 51, 52, 53]. A CG is bipartite labeled graph where one class of nodes represents context objects and the other represents relationships between context objects. In the field of Artificial Intelligence, these labeled graphs are called “semantic networks”. CG is a formal knowledge representation model. CG is equipped with reasoning operations with respect to deduction in the first order logics. The CG basic concept is described below.

- 76 -
• All objects (including facts, queries, rules, and constraints) are labeled graphs.
• The reasoning operation, projection, is a graph morphism between graphs. Assuming F is an asserted fact and Q is a query, every project from Q to F is an answer to the query. Projection between CGs is equivalent to deduction.
Three kinds of graphs are used.
• A simple graph represents a fact or a query
• A rule consists of a hypothesis and a conclusion. It is used to add new knowledge.
• A constraint gives the conditions that a simple graph is valid.
The ontological information of a mobile environment is stored into a support describing available concepts and relation types ordered by a specialization relation. Context information is represented by simple graphs. Reference [50] encodes entities in a mobile environment such as mobile services in an ontological base, i.e. the support base. Each fact is related to a simple graph, which is attached with rules and constraints. Changes to the system result in additions or deletions of the facts. The system keeps a current state of the context information. Rules and constraints are used to determine the state of the current context information. The context operations are two levels, the support level and the task level. At the support level, the application deals with the management of the system operating environment especially the addition and deletion of context objects. At the task level, the application monitors the user’s current tasks, any request of new services, any addition and cancellation of services. In CG framework terminology [52], given a piece of knowledge K and a simple graph Q, ask if Q can be deducted from K. This implies to query the support space and find out what tasks are available to the user at the task level.
One of the mobile context model implementation uses the following architecture (see Figure 37) [50]. The device monitor constantly observes the system status and produces a simple graph of the current mobile context. The device monitor invokes the rule checker by applying the rules and constraints to the current context. Feedbacks are then forwarded back from the rule checker to the device monitor.

- 77 -
Device MonitorMobile ContextModel
Context A
Rule Checker
Current MobileContext
ViaSimple Graph
(in XML)
Rules &Constraints
(in XML)
Context B
Figure 37 Mobile Context Model
(Source: [50] )
When the user walks into Context region B from Context region A (Figure 37), the available service also changes accordingly. Figure 38 shows the Simple Graph that describes the current mobile context. For example, the Context B refers to a museum. When the user enters the museum, the mobile web application asks for user agreement and acceptance. Once the user signs on, the museum has three services available anywhere within the museum. The three services are printing service, directory service, and exhibition service.
Figure 39 shows, at time B, the user starts to use one service provided by the museum in context B. After the user logs on the system, the user receives chat messages from a friend and he needs to print out the message to help out the friend to find the information that his friend is seeking. The figure shows the Simple Graph at time B in context B.

- 78 -
User System
Service 1e.g. printing
Service 2e.g. directory
Service 3e.g. exhibition
has has has
sign on
A Simple GraphOf Context Bat Time A
Figure 38 Example Mobile Context Model at Time A
(Source: [50] )
User System
Service 1e.g. printing
Service 2e.g. directory
Service 3e.g. exhibition
has has has
sign on
A Simple Graph Of Context B at Time B
useuse
Chat
Figure 39 Example Mobile Context Model at Time B
(Source: [50] )

- 79 -
4.4 MOBILE APPLICATION USER INTERFACE
The challenges of conventional mobile application user interface include small screen size, slow network speed, and limited battery power. Some of the current mobile phone applications have adopted user interface elements from the desktop experiences, e.g. scrollbars, long lists, arrays of check-boxes, and tiny fonts. Also, in conventional mobile phones, network carriers have nearly full control of the mobile phone user interface. As mobile phones become more powerful and mobile software components become open and standardized, users have more options on how their phone user interface look like as well as on the selection of third-party mobile web applications. However, giving the plurality of capabilities among available applications and operating systems, users have to spend time to master the interfaces, a jumble of different interaction styles and visual presentations.
Microsoft researcher Daniel Robbins suggested a unified visualization and interaction paradigm called “TapGlance” to guide mobile application user interface design. The approach is motivated by previous product and research in three areas: spatial data navigation, faceted search and, most recently, glanceable information displays.
The objective of a user interface design framework is to allow users easily navigate from application to application and within each application via a small set of shared interactions. To adapt to the mobile environment, these interactions need to leverage spatial memory and accommodate themselves to the amount of attentions a user has to devote at any one time. According to TapGlance, the user interface design goals are
• Design for emerging markets: the interface optimized for medium resolution (320x240) color displays but it still scales to low resolution (128x96) gray-scale devices. The interface works in icons are substituted for text. Speech input is an alternative method for selecting options, and voice output is an alternative for on-screen information.
• Simplify visual presentation: be glanceable, e.g. from serially interrogate multiple items in order to confidently make a choice. Serial interrogation hovering over individual items or tab based selection is cumbersome in a mobile environment since it forces the user to rely on short-term memory to make comparisons.
• Use a consistent interface metaphor: use a base set of operations that users engage in across multiple application types to avoid user learning during switching application
• Require minimal user attention: a mobile interface should only require a “loose feedback loop”, i.e. a user should be able to initiate a command, give limited attention to the device, and look away from the device while still understands what is going on. Mobile web applications can not assume that users give the application their full attentions.

- 80 -
• Use facets to reunite search and browse: a browsing task should be able to specify criteria to describe a data need, which may evolve during search. Figure 40a shows the user changes the active Facet Navigation region by pressing the directional keypad arrows, causing the border to animate to the adjacent region. The figure shows the root of the facet tree, from which we see Yellow Pages listing can be described according to business category, relative distance from both predefined and realtime locations, absolute location, hours of operation, price classification, and consumer ratings. When the user presses the absolute location, the interface is shown in Figure 40b [55] to help further on the search.
Figure 40 Mobile User Application Interface via Facet Navigation
(Source: [55])
Figure 41 shows a set of interfaces from TapGlance as experiments to support the above mobile web application user interface design. As a user finishes his current appointment and checks his mobile phone for the next appointment at 11am, he finds out the location of the meeting, Building 34/3042. He then opens up the map for directions from current location.

- 81 -
Figure 41 Mobile User Application Interface from TapGlance
(Source: [55])
4.5 MOBILE WEB APPLICATION LOGIC
Application logic functions as the brain of the application. Application taxonomy introduced features, which represent the unique values of the application. For specific feature and category, application logic details how the values are delivered in functions or routines in the application.
4.5.1 MOBILE PERSONALIZATION
Wikipedia defines web personalization as personalizing web pages based on the interests of the individuals. Anand defines web personalization as any set of actions that can tailor the web experience to a particular user or a set of users [56]. The experience can be as casual as browsing a web site or as significant as tracking stocks or purchasing a car; the actions range from making the web presentation more pleasing for certain customers to anticipating the

- 82 -
needs of the users and providing customized and relevant information. From customer or consumer perspective, personalization has these values:
• Money saving: prevent redundant work by eliminating service components unnecessary to a customer, e.g. there may exist solutions that address the problem this customer is facing
• Time saving: offer efficiency through eliminating repeat tasks
• Valuable information: filter non relevant information to a customer and provide information specific that person’s environment.
In addition, personalization provides the company an opportunity to
• attempt to persuade buyers to make decisions
• implant messages to reach potential customers
• draw attention to a company and its product and services.
From mobile web applications perspective, personalization can be implemented via the following two approaches:
• User customization: the application provides user profiling via selecting check boxes indicating interests. The keyword-based user-customization systems build a profile consisting of a number of keywords, indicating the type of content that this user would like to receive.
• Adaptive personalization: this approach uses artificial intelligence or statistical techniques to automatically construct a profile of the user interests. The adaptive system learns from a small number of examples and adapts quickly to changing user interests. There are three approaches to create profile for making recommendation for users:
o Collaborative filtering: this approach monitors the behavior of all users and tries to find users with similar interests. For example, FireFly and NetPerceptions use collaborative filtering to recommend CDs, movies, and books. Some of the location based services related to mass audience are good candidates for collaborative filtering, e.g. restaurant recommendations at certain location.
o Content based filtering: this approach creates a statistical profile of the user interests in (English) words and phrases that distinguish interests from other items. For instance, news recommendation is a good candidate for content based filtering.

- 83 -
o Decision rule-based recommendation: this approach periodically surveys users to obtain user demographics or static profiles and then instruct web sites to build corresponding rules based on the survey. The web system delivers the appropriate contents to a particular user according to the current rules.
Tam performed an interesting study for the effectiveness of personalization [59]. Using a music download web site and two study groups of users, personalized group (142 people) and control group (40 people), the study shows the people receiving personalized offers downloaded music files more frequently than those in the control group. Figure 42(a) shows the outcomes from the study: file download, inept browsing (browsed through a number of pages before downloading), browsing to download ratio, and song rating. However, the study also revealed that the effectiveness of personalization varies from web contents to contents. Figure 42(b) shows the survey result of personalization of various products: books, event or movie, music CD, DVD or video CD, computers, cosmetics or skin care products, and financial products. The survey clearly indicates that personalizing books for users are more appealing than personalizing financial products.
(a)

- 84 -
(b) Figure 42 Web Personalization
(Source: [59] )
In recent years, mobile web based social networking has become such a phenomenon that it is likely the next generation of the citizen can not live without. Given the popular online social networks such as MySpace, Facebook, and LinkedIn, and the open web API to dynamically query social network information, a new dimension of web personalization is born. Any news, events, and discussions in one’s social network are certainly his/her interests. For instance, although one might not be actively looking for new job opportunities, he/she is interested in knowing that his/her friend’s company has an open, very well paid position.
4.5.2 MOBILE WEB MINING
Wikipedia defines web mining as applying data mining techniques to discover patterns from the web. Data mining refers to exploring through large amounts of data set and extracting relevant information. Data mining is not simple data analysis but knowledge discovery and prediction and forecasting via sophisticated algorithms and statistical rules and heuristics. One example of data mining is looking for seasonal travel patterns via historical airline reservation data sets. According to the target of the analysis, the web mining has three types:
• Web content mining: applies data mining techniques to contents published on the Internet, e.g. in HTML, plain text, or XML.
• Web usage mining: analyzes the interaction between users and web servers, e.g. through web server logs, click streams, and database transactions of the back-end server.
- 85 -
• Web structure mining: analyzes through the web page hyperlink structures to obtain information on a page’s ranking and authoritativeness and therefore enhance the search results from filtering. The introduction of the semantic web significantly enhances the capability of web structure mining.
The above web mining is also applicable to mobile web applications. In addition, mobile devices can also work as a data collection station, a sensor, and/or a location tracking device. As such, data mining can be applied in the following areas:
• Social setting mining: based on your social and personal network, apply data mining techniques to social setting environment. For instance, your social network not only reveals your potential interests but also your likely behaviors in the near future. Based on user’s consent, mobile web application or the mobile phone carrier can collect your personal information (such as the place you have visited in the past year) for your personal health mining. However, this may pose security concerns.
• Feedback loop based mining: using mobile phone as a sensor or data collector, pattern discovery or forecast is likely more accurate. The discovery algorithm and forecast model should be adaptive to the real time sensor feedback to form a closed-loop mining.
4.6 MOBILE AGGREGATION STRATEGY
This section so far presented the mobile aggregation platform (including the web API), the application logic, the mobile user interface, and the context modeling. Depending on the application, a remaining issue how the aggregation will be performed and where the aggregation is performed.
Figure 43 shows a taxonomy of mobile aggregation strategy. Centralized aggregation performs the aggregation at a single site, e.g. a mobile device or a backend server. Centralized client aggregation is designated for simple aggregation task and does not require a lot of CPU computing cycles. The aggregation is done at the mobile device. For instance, an application displays an integrated, condensed information summary based on the address book of the mobile phone. Centralized server aggregation performs aggregation on the backend server. This represents a common scenario in cloud computing. Once the task completes, the aggregation result is forwarded to the mobile device for display. An example is a web mining application that processes a large number of historical data sets of travelers, determines travel patterns and costs, and then suggests destinations to application users. As smartphones become popular and the power of mobile platforms continues to increase, sometimes a query for one smartphone requires the involvement of several other phones and multiple clouds (in cloud computing). For instance, in social networking, one might want to do a survey to decide where and when to meet on the weekend. This requires querying on each device in his social network to determine his current location and preferred meeting time and location.

- 86 -
In distributed aggregation, aggregation can be done in parallel at each mobile phone or cloud, and only the aggregation result is forwarded to the querying mobile phone/cloud for a union operation. This is known as parallel aggregation. For complex aggregation applications, aggregation can be done in phases; the querying cloud breaks the aggregation tasks into phases, forwards the query to mobile phones or clouds for each phase, and coordinates and consolidates the results at the local cloud. This is phase-based aggregation.
Mobile phones can be used as sensors to collect data, e.g. a mobile phone to collect personal health data. A medical doctor may require an aggregated report. To complete such a report, tasks can be performed by aggregation proxies. These proxies can be either location or function based. The location proxy aggregation collects data in the local region and sends the aggregated report. The function proxy aggregation assigns aggregation proxy by functions. For instance, blood pressure data is collected at one aggregation proxy while heart beat
Aggregation
CentralizedAggregation
DistributedAggregation
CentralizedClient
Aggregation
CentralizedServer
Aggregation
Proxy-basedAggregation
Phase-basedAggregation
ParallelAggregation
LocationProxy
Aggregation
FunctionProxy
Aggregation
Figure 43 Mobile Web Aggregation Strategy

- 87 -
5. BUSINESS ANALYSIS FOR MOBILE WEB APPLICATIONS One central theme of the MIT System Design and Management program is System Thinking, which views systems from a broad perspective including seeing overall structures, patterns and cycles in systems rather than seeing only specific events in the system. A system is simply an organized collection of parts and/or subsystems that are highly integrated to accomplish certain goals. A system has various inputs, which go through certain processes to produce certain outputs, which together accomplish the overall desired goals for the system. System Thinking is centered at the context, the interfaces and emergent behaviors – the interstitial elements around and within the system. The “whole” view of the system can help a business to quickly identify the real causes of issues in their organizations and know where to work to address the issues.
Peter Senge in his book, The Fifth Discipline, described the discipline of System Thinking as a major leap in the way people are used to thinking. He introduces the concept of a learning organization, an entity which individuals “would truly like to work within and which can thrive in a world of increasing interdependency and change” [60]. Senge summarized the System Thinking in relation to the learning organization as:
“At the heart of a learning organization is a shift of mind --from seeing ourselves as separate from the world to connected to the world, from seeing problems as caused by someone or something 'out there' to seeing how our own actions create the problems we experience. A learning organization is a place where people are continually discovering how they create their reality. And how they can change it”
This section adopts system thinking into building a sustainable business model for mobile web applications. Wikipedia defines a business model as a profit producing system that has important degree of independence from other systems in the enterprise. Osterwalder proposes a business model design framework that uses 9 building blocks to describe a formal, comprehensive business model: core capabilities, partner network, value configuration, value proposition, customer relationship, distribution channel, target customer, cost structure, and revenue steams [63]. A comprehensive business model (under System Thinking) for mobile web applications can be summarized in the following perspectives:
• Market and Customer
o Customer segment: the target customers
o Customer relationship
o Product distribution channel: the channel to bring the product to the target customers

- 88 -
• Product Offering: the value proposition of what is offered to the target customers
• Operation/Production
o Resources and Activities: the core activities to organize the resources to add the proposed value by converting the raw material to the delivered product
o Partner Network: the supplier networks, partners, and collaborators
• Business Finance
o Cost: the raw material cost, the operating/production cost (including labor, marketing, sales, R&D), the distribution cost (including transportation)
o Revenue: the revenue of the business
5.1 MARKET ECOSYSTEM ANALYSIS
An ecosystem is a system formed by the interaction of a community of organisms with their environment (definition from Random House Dictionary). The term of business ecosystem is originated by James Moore in Harvard Business Review in 1993. A business ecosystem is an economic community producing goods and services of value to consumers. The members in such an ecosystem include consumers/customers, suppliers, producers, competitors, and other stakeholders (such as regulators and governments). Over time, the members may play different roles in the ecosystem to co-evolve around a new innovation, and they work cooperatively and competitively to support new products, satisfy customer needs, and eventually incorporate the next round of innovation [61].
Figure 44 shows the ecosystem for mobile web aggregation. The end users are the mobile subscribers, e.g. end consumers using the mobile phone. Hardware suppliers include semiconductor, system component, system, network, and handset manufacturers. Operators include wireless and wireline network carriers such as AT&T and Verizon. Software providers represent the traditional software vendors and/or solution providers, e.g. Palm OS and web browsers. Content providers create the contents, e.g. New York Times producing news. Service providers are the essential part of the cloud computing; an example of a very successfully company is Google, who provides searching for web surfers. Government provides the spectrum as well as the regulations. There are two relatively new role players in the ecosystem:
• Application life cycle management providers: in cloud computing and web service era, application deployment and life cycle management ensures a new application or a new version of the application integrates seamlessly into the cloud context as well as manages applications’ life cycle.
• Mobile web aggregation: these applications are placed on top of the infrastructure software and services, and the multimedia contents and web. An example of these

- 89 -
applications is user agent programs to integrate and/or filter information on behalf of the user.
ApplicationLifecycle
MgtProviders
Mobile Network & Cloud Infrastructure Providers
Mobile Phone Manufacturers
ServiceProviders
Mobile Subscribers
Component Infrastructure Providers
SoftwareProviders
ContentProviders
Wireless/Wireline Network Operators
Semiconductor Suppliers
Mobile Web Applications
Gov
ernm
ent &
Reg
ulat
ion
Figure 44 Market Ecosystem for Mobile Web Applications
5.2 VALUE PROPOSITION
The value quadrants in the mobile software business are listed in Figure 45. Traditional businesses in this space have focused on Handset Software and Tools and Platforms. The left side of the figure represents conventional software business model in which revenues come from the software and the platform per unit or developer. However, the trend is clearly moving towards Service and Content delivery as well as directly to User Data. The right side of the figure represents the software service model in which revenues come from services. The service can be charged per user upon service delivery or even more granular to each transaction.

- 90 -
OperatingSystem
Software($$$ per unit)
Tools & Platforms($$$ per developer)
User Data($$$ per transaction/use)
Delivery($$$ per user)
Java VirtualMachine
WebBrowser
UserInterface Middleware
ApplicationFramework
SoftwareDevelopment
Platform
DevelopmentInterface
ServiceDevelopment
Platform
ContentCreation
InfrastructureBundledSoftware
Services
CustomizedInterface
ApplicationDevelopment
Platform
SolutionFramework
ContentDeliveryContents
ServiceCreation
ServiceDelvery
Messages
Photos
Video
Profiles
Preference
Figure 45 Revenue Models for Mobile Web Applications
Table 13 lists the values per mobile web application class. There are 7 mobile web application classes in the table. Time utilization applications are used to increase work efficiency via reducing idle time. For example, a company administrator can access emails and calendars on the road so that he can perform multi-tasking. Time sensitive applications are used to minimize loss of opportunity. For instance, product buying and sales related communication can be facilitated via these applications to ensure that proper responses are delivered in desired time frame. Decision support applications aim at processing raw data and analyzing trends or patterns so that users can make better decisions. Information discovery applications suggest the contents for users based on historical information. Collaborative applications are to take advantage of the network and ubiquitous mobile devices to allow people working remotely and collaboratively on a single task. For example, creative designers can work on a project remotely through collaborative mobile web applications.
Supporting mobile transactions can be a competitive strategy. For instance, if one bank offers mobile payment through cell phones, other banks are likely to follow the lead to work with network carriers for a secure, reliable mobile payment system. Micro financing started its implementation in some countries including China and India in recent years [62]; a mobile payment system is a key enabling mechanism for micro financing in development countries. Location-based applications leverage the continuous availability of the mobile phone together with the GPS information to provide the intelligent, context aware information for decision making and/or inventory management. An example is a trucking company to use location-based applications for shipping scheduling and truck/employee tracking.

- 91 -
One of the main reasons for promoting mobile networks is ease of deployment. Mobile networks and applications can be used to provide the unique solution for emergency and safety. Non-relationship commerce refers to business opportunities not directly related to relationship. For instance, a hotel can invest in information infrastructure so that it provides quote, billing, and checkout to mobile phones. When a customer enters into the region looking for accommodation, the customer can get a quote automatically based on information provided, e.g. the check in and out date, number of rooms, via mobile phone. After the customer compares the quotes and selects a hotel, the hotel takes the customer identification, e.g. credit card number, makes the reservation, and even facilitates the check in and out of the hotel. Mobile phones can be used as a data collector or sensor to collect and aggregate information. For instance, a mobile diabetic system uses cell phones to periodically collect patient’s blood sugar levels.
Mobile Web Application Class
Values Consequences without the Application
Time Utilization Increase efficiency via reducing idle time
Lower productivity, lower operating margins
Time Sensitive Increase business revenue stream
Loss opportunities
Decision Support (including Mining)
Make better decisions utilizing the information
Inferior/poor decisions
Information Discovery Effective marketing Loss revenue Collaborative Make better design utilizing the
resources Inferior/poor design
Transactional Enable transactions Customer dissatisfaction Location based Continuous availability of
context-aware information Higher cost
Emergency (including Safety)
Ease of deployment Higher cost, slower/impossible deployment
Non-relationship Commerce
Continuous availability of dynamic, realtime seller-buyer connectivity and information
Lost revenue
Data Collection and Aggregation
Increase efficiency via automation
Lower productivity, lower operating margins
Table 13 Values of Mobile Web Applications
5.3 REVENUE MODEL
Mobile web applications have these revenue models
• Software revenue model: sell applications as a software product, and charge customers for software licenses as well as yearly maintenance and update fees. In the 1980s and early 1990s, software maintain fees are usually 10% to 15% of the original purchasing price; in the current years, maintenance fees ranges from 15% to 22% of

- 92 -
the software purchase price. The software license is charged per handset. Additional revenues in this category come from the following category:
o Product customization: tailor the product for specific customer environment.
o Integration related implementation: integration with legacy systems and data migration from legacy systems.
o Professional services: product related/unrelated consultation.
• Platform and tool model: sell applications as a software development platform and/or tool. This model is to charge customers per developer, and can also request a royalty on each application that developed on the platform and sold to the customer.
• Open source revenue model: develop mobile web applications as open source software. Hecker has a comprehensive summary on open source software revenue models http://hecker.org/writings/setting-up-shop [63]. The mobile web application revenues in this category can be gained through the following sources:
o Support Sellers: revenues come from media distribution, branding, training, consultation, customer development and post-sale support.
o Loss Leader: although the open source product generates little or no revenue, providing the product makes the customer more likely to buy other products that are sold using the traditional software business model and service business model.
o Widget Frosting: under this model, the revenues come from selling hardware (“widgets”) but the system uses open-source software (“frosting”) for enabling mechanisms/components/interfaces.
o Service Enabler: the company develops and distributes open-source software primarily to support access to revenue-generating on-line services. For instance, a client program can be open source, and when the program launched from the mobile phone, the program will automatically access web services that are charged via subscription.
o Sell It, Free It: under this model, a company will develop software and sell the software via traditional software licenses initially, and then convert to open-source products when the product reaches an appropriate point in the product life cycle. For example, both Solaris OS and Windows OS are well-known proprietary operating system solutions. As the Linux market continues to grow, SUN decides to make the Solaris OS open source.
o Brand Licensing: this model makes the software product itself open source but retains the rights to its product trademarks and related intellectual property. The model charges other companies for the right to use trademarks and/or brands for creating derivative products.

- 93 -
o Software Franchising: this is a franchise concept just as 7-11 for the convenient store market. The software franchisor not only licenses brands and tradeworks but also provides franchisees with training and services. The revenues come from sale of franchises and loyalties. Training includes building and running open-source development environment while services include centralized marketing, advertisement and procurement.
• Service revenue model: develop the software, run the software as service, and charge customers for services. The introduction of web services has made this model attractive. Table 14 lists the alternatives of service revenue model. In a service subscription model, users pay a subscription fee per user group/per user for a period of time. For example, ladder.com offers job search services that are free for companies and require monthly subscription from job hunters. Advertising service model charges business for web advertisement. A well-known example is Google charging companies selling their products using web advertisement during user web search. Under a metering service model, users can be charged per user group, per user, or per transaction. For instance, Juniper.com charges users for each of its market report per transaction. The users have several delivery options, e.g. via web in pdf format, via CD, or via hard copy through regular mail. A marketing service model is to gather consumer information and aggregate and sell the consumer information in bulk to companies that want to sell consumers their products.
Who is the Customer How to Charge Subscription Service Model
End Users Per User Group, or Per User, for a period of time
Advertising Service Model
Enterprise, Companies, and Business who want to sell products
Web page advertising
Metering Service Model
End Users Per User Group, Per User, Per Transaction
Marketing Service Model
Enterprise, Companies, and Business who want to sell products
Aggregate consumer information per bulk or at a period time (e.g. month)
Table 14 Revenue Model Comparison
5.4 STRATEGY
Whether explicit or implicit, every business has a competitive strategy. This strategy can be developed explicitly through planning or implicitly through ongoing business activities. Porter summarizes the process of formulating a competitive strategy as following [64]:
• Step 1: What is the business doing right now? The first step of forming a strategy is to identify explicit or implicit current strategies as well as to articulate the implied assumptions behind the current strategies. These assumptions include the trend of

- 94 -
the business, the competitors, the strengths and weakness, and the relative position of the company to the industry.
• Step 2: What is happening in the environment and what is the context? The second step of forming a strategy is to perform industry, competitor, and societal analysis to determine the key factors for competitive success in the sector, the strengths and weakness of each competitor, and the environmental, social, political, and governmental impacts on the business and the industry. This step is applicable to both current environmental conditions and future forecast.
• Step 3: What should the business be doing? The last step is to evaluate the current strategy in step 1 via environmental and context analysis of step 2. Then, look for alternative strategies and select the best strategy among the alternatives for a business going forward.
This section describes strategy for mobile web applications using System Thinking. For a mobile web software business, three main areas of the business for strategy consideration include marketing and sales, production, operation, and execution, and finance and control (see Figure 46). A system dynamic model is introduced in this section. Strategy is described in each of the 3 areas of the business using a system dynamic model. Experimentation is conducted to study the impacts of the key parameters in the system model.
Marketing & Sales
Production, Operation,& Execution
Finance& Control
Competitive Strategy• Profitability• Growth• Market share• Social responsiveness
Figure 46 Mobile Web Business Strategy

- 95 -
5.4.1 A SYSTEM DYNAMIC MODEL
Figure 47 describes a system dynamic model for a mobile web software business environment. The 3 main areas of business are Marketing and Sales, Production and Operations, Finance and Control. All 3 areas are discussed in details in the below sections and the focus of the discussion within each area is on the key factors contributing the business strategy. The system dynamic model is used as an illustration purpose to connect the key factors to show the relationships and impacts among the key factors. The discussions have more comprehensive coverage of the issues than the system dynamic model.
Figure 47 A System Dynamic Model
(Note: the quality and rework part of the model is based on MIT ESD.36J System Project Management’s homeworks)
5.4.2 MARKETING & SALES
For corporate marketing and sales, the key factors impacting companies’ success are

- 96 -
• Current market share: the company’s current market share. The current market share is related to the number of software licenses that the company has sold.
• Potential market share: the company’s near future market share. The potential market share will influence the number of new licenses that the company can sell.
• Market share rate change: market share rate change from current market share to potential near-future market share. The market share rate change is calculated as
o Innovation level * Software Quality * Potential Work Rate
• Innovation level: the company’s innovation level in ratios in relation to competitors. A value of greater than 1 means the company can produce more innovative products than competitions. The company’s innovation level has impacts on the company’s potential market share. A higher innovation level implies a higher potential market share. The innovation level is modeled as
o Creativity Ratio * Risk
• Software Quality: the quality of the application software. This can be derived from
o Normal Quality * Effect of Prior Quality on Quality
• Potential work rate: the true work rate. This is modeled as the number of staff multiplying the productivity ratio
o Staff * Productivity
• Current licenses: the number of active current licenses in this quarter
• New licenses: the number of new licenses in this quarter
• Existing licenses: the number of existing licenses in this quarter
• Expired licenses: the number of licenses to be expired in this quarter
• Average license price: the average license price
• Existing maintenance charge: the license maintenance revenue in this quarter
5.4.2.1 PRICING
Pricing plays a key role in the marketing in which the foundation of the marketing consists of
• Identifying a product meeting the needs of the customers
- 97 -
• Developing an information program clearly conveying the values of the product to the customers
• Developing a distribution program making the product available to the customers.
A complete mobile web application software/tools pricing program has many components
• One time software license charge
o Including product name, version number, and platform supported, e.g. Windows, Unix, or Apple OS
• Accompanying terms and conditions specified
o When the payment is due and what is the payment method
o Discounts for current customer
o Discounts for further upgrade
o What is the shipping method and whether price includes shipping
o Whether price includes training or qualify the customer for discount training
• Technical support/maintenance contract
o Whether the customer is interested in technical support service, renewed yearly from the date of purchase
• Customization and/or professional service contract
o If charged for the period of the time for customization, quote is provided per hour and per headcount; if charged for the project, quote is provided to complete the project.
o Assumptions and prerequisites for the customization development.
Figure 48 shows the relationship of the current licenses in the system dynamic model. Calculated per quarter, the current licenses are the summation of the existing licenses, the expired licenses, and the new licenses. Figure 49 shows the experimentation results for different types of growth as well as various existing software licenses. New licenses and expired licenses have their own change rate coded in tables in the model. A higher rate for new licenses indicates growth, but a higher rate for expired licenses shows shrinking customer base. The existing license, a constant, reflects the current customer base. The figure shows when the existing license is fixed, a higher rate on new licenses and a lower rate

- 98 -
on expired license result in the licenses’ increases. When the sales growth (in relation to the number of licenses) outperforms the industry growth, the current market share of the company increases.
Figure 48 Licenses for Mobile Web Applications
Figure 49 Business Growth & Software Licenses

- 99 -
Figure 50 shows the revenue comparison when the average license sale price and the yearly maintenance charge changes. A high sale is crucial for revenue growth. The sale revenue is related to the number of existing licenses, the license maintenance charge, the number of new licenses, and the average license price. When the new license charge is much higher than the maintenance charge, the number of new license sales dominates the total revenue. As the number of licenses increase, the maintenance revenue becomes significant to the total revenue.
Figure 50 Impact of Pricing on Revenue
A complete mobile web application service pricing program also has several components
• Service subscription charge for end users
o Service definition and scope
o How the service is delivered
o When the service starts and ends
o When the payment is due

- 100 -
o Any bundling packages or applicable discounts
• Advertisement charge for business selling products and/or services to the end users
o What advertising packages available
o When the payment is due
• Per transaction based charges
o One time per transaction charge
o How the service is delivered
There are two primary factors to price a product and service:
• Market: pricing should be driven primarily by the value to the customer. For the target markets, it is crucial to understand how important price is in the customer decision making process. There are several related issues:
o Competition: it is not difficult for a customer to collect a product pricing comparison for a specific market. Some of the key questions for the customer decision-makers are whether there are unique values from a specific product, how easy to switch suppliers or products from customer perspectives, whether there is a “reference-price” (fair price established in the market) for the product or product category, and how about the quality to cost relationship.
o Customer value assessment: One way to assess the economic value of the product to a customer uses the following formula:
Product Economic Value = Cost of the (Best) Alternative + Value of Performance Differential
Customer survey is another way to directly obtain pricing feedback from the customer. For instance, a customer survey can ask for a customer how much he/she is will to pay for this product, at what price the customer is definitely buy this product, and at which price difference the customer is likely to switch from product A to product B.
o Price and value customization: it is likely for the same concept products, some customers are able to pay more than other customers. For example, the mobile navigation software is available in different platforms, ranging from dedicated and wide-screen portable hardware to a simple mobile web application on a mobile phone. The former high end product sells for $400 whereas the latter low end product sells for only $50.

- 101 -
• Cost: any sustainable business needs to make profits through products/services offering. This can be translated as
o Profits = (Price – Cost) * Number of Licenses Sold
There are several types of costs in a mobile software business
o Fixed costs: equipment, office related renting and expenses
o Labor costs: employee related costs including salary and benefits
o Marketing program and sales related expenses
o Other software/service operating costs: this includes third-party software, copyright, and development platform license costs, technical training costs.
5.4.2.2 PARTNERSHIP, CHANNELS, AND ECOSYSTEM
Today’s mobile software business emphasizes the business ecosystem. In fact, a key strategy for the leading platforms in the sector is to build a robust, efficient, and creative business ecosystem. For instance, some of the early iPhone users are teenagers who love the iPod and the associated multimedia applications on Apple platform. Palm has a group of loyal users and developers who love the Palm Operating Systems. One of primary reasons for some mobile device users switching to Microsoft Windows platform is these users are used to the Desktop Windows platform and applications such as MS Office and Outlook. Android, an open-source mobile operating system, is gaining momentum recently as an attractive mobile OS platform for application development. Mobile web applications need to select and form an ecosystem.
The first step to select an ecosystem is to assess the existing ecosystem’s health, which can be described in three measurements.
• Productivity: given certain technology and raw materials of innovation, the ecosystem needs to convert the input into new products at lower cost. Historical data reveals software business model is on average more productive than that of the service/Internet business model. Iansiti reported in his study that while the return on invested capital in the software ecosystems did not vary much between 1994 and 2002, the corresponding return in the service/Internet ecosystems plummeted between 1996 and 1997 but recovered in recent years [66]. On average between 1994 and 2002, the software ecosystem has 50% productivity edge over the service/Internet business ecosystem.
• Robustness: the preferred business ecosystem must be capable of surviving disruptions and unforeseen technological changes. The simplest measure of robustness of the ecosystem is the survival rates of ecosystem members over time or relative to comparable ecosystems.

- 102 -
• Niche creation: the third yet important measure of the ecosystem health is innovation, in ecosystem terminology, the capacity to increase meaningful diversity through the creation of valuable new functions or niches.
Some businesses especially new companies select the most healthy business ecosystem among the alternatives to become a part of that ecosystem. Most businesses have to develop strategy matching to their current environment. Figure 51 shows the strategy to position a business in its ecosystem.
• A business can be a niche player in the ecosystem. The business faces constant changes and focuses its resources on niche markets. The company usually adopts an agile software development strategy. This strategy is widely adopted by new comers into the ecosystem.
• A business can develop into a keystone of the ecosystem if the business is at the center of the complex network of asset sharing relationships and operates in a turbulent environment. The business not necessarily wants to become the biggest player in size but definitely the most active player in the ecosystem by frequently interacting with other players in the ecosystem.
• For a business needs a complex network of external assets but operates in a mature industry, the business develops strategy to become the physical dominator in the ecosystem. Company in this category often acquires partner companies for growth opportunities. Ultimately, the company may become its own ecosystem absorbing complex interferences existing between distinct organizations.
Complexity of Relationships
Level ofTurbulenceandInnovation
NichePlayer
KeystoneSpecies
PhysicalDominator
Low
Low High
High
Strategy to position a Business in itsEcosystem
Figure 51 Operation Strategy for Mobile Web Business

- 103 -
5.4.3 OPERATION
In relation to operation strategy, the key factors impacting companies’ success are
• Staffing Level: in software business, an important part of the overall operating cost goes to salary and benefits for employees. In addition to engineering staffing level, the sale force is critical to bring in revenues and execute the marketing plan. How to manage the human resources to avoid overstaffing yet have sufficient work forces to complete sales and engineering target on time poses challenges to the management team.
• Quality: for mobile web applications, quality issues come from several categories
o Software bugs: given the available requirements, a software bug is an error or defect in a software program that prevents the software program from behaving as intended. Most bugs come from mistakes and errors made by engineers in either a program’s source code or its design, and a few are caused by compilers producing incorrect code.
o Low fault-tolerance: due to the limitations of software specification and testing, the fault-tolerance level of a software product might be unknown or is discovered at a customer site to be insufficient. Fault-tolerance refers to system continuously operating in the event of the failure of some of the system components.
o Poor scalability: due to the limitations of software specification and quality testing, scalability is usually considered as a “performance” issue. Scalability refers to the system ability to either handle growing amounts of work in a graceful manner or to be readily enlarged.
o Insufficient documentation: sufficient and up-to-date documentation not only helps the company internal knowledge sharing and transfer but also clarifies the product values and functions for customers and the sale force and presents a good quality image to the customers and/or end users.
• Rework: rework in mobile web business is inevitable. Rework comes from two major sources
o Quality issue as discussed early
o Requirement changes: a key measure of strengths in a mobile web product organization is the product time-to-market. In web era, new products need to be developed in weeks or months but definitely not years. Given the relative short period of time, the available requirements may be limited. In addition, the pace of innovation is much faster and the competition is fierce nowadays. This means the requirements may require amendments to adapt to the

- 104 -
changing environment. Requirement changes usually result in more work, either expected as planned or unexpected as discovered.
• Productivity: productivity describes work efficiency, measured as a ratio of output to input per labor-hour. Software productivity can be measured in several ways
o Lines of source code
o Revenue per employee
o For IT service (no direct customer sale) department, increased revenue in the supported business per dollar spent by the IT organization
• Staff Experience: the experience level of the engineers
5.4.3.1 QUALITY AND REWORK DISCOVERY
Quality and rework discovery are connected. Figure 52 shows the model of rework generation in the system dynamic model. Rework generation is related to the software quality and the feasible work rate. Good software quality results in less rework. However, the relationship is not linear. Software Quality and Average Work Quality are closely related in the sense that Average Work Quality representing prior work quality impacts the Software Quality. The higher Average Work Quality results in higher Software Quality (see Figure 53). The figure also shows at the beginning of the project, the software quality is low due to staff experiences, and as the project continues, the quality of the software increases. In fact, when software development projects starts, there is always a learning curve for team members to get familiar with the project and the development environment. Consequently, the software quality dips at the beginning of the project.

- 105 -
Figure 52 Rework Generation for Mobile Web Applications
Figure 53 Project Software Quality

- 106 -
Undiscovered Rework performance during experimentation is displayed in Figure 54. Undiscovered Rework is derived through subtracting the Rework Generation from the Rework Discovery, and is initialized to zero during simulation. Rework Discovery is modeled as Undiscovered Rework divided by the Time to Discover Rework. When Rework Generation is high, the amount of Undiscovered Rework will also be high; when Rework Generation is low, the amount of Undiscovered Rework will also be low. This shows the strong correlation between rework and software quality.
Figure 54 Impact of Quality on Rework
5.4.3.2 STAFF LEVEL, EXPERIENCE, AND PRODUCTIVITY
Hiring more people in the company not necessarily imply low or high work productivity. As employees have more experiences on what they do, the work productivity will increase accordingly. Relevant training at certain costs will increase work productivity. In software business, the quality of the employee and therefore hiring is critical for higher work productivity and the company strategy execution.
Higher productivity certainly results in higher Work Accomplishment, so the assigned tasks/jobs are completed in comparatively less amount of time. The other option to shorten the project length is to increase the staff level with the assumption of the new staff can perform the same as the existing staff. In reality, this is rarely the case. New staff needs

- 107 -
time and training before they can contribute to the project. In addition, additional personal requires more coordination and communication so it brings in more overhead. Figure 55 shows the corresponding software product readiness, which is simply the cumulative effect of the Work Accomplishment. A higher productivity ensures project completion on time or ahead of time. Overall, the experiments show
• Higher productivity is always desirable as it shortens the project duration without increasing costs.
• Adding staff to a project may shorten the project duration depending on the staffs’ experience and/or productivity. In fact, adding staff to a delayed project may further delay the project. Adding staff certainly increases project costs and hence lowers revenues.
Figure 55 Impact of Productivity and Staffing on Project Completion
5.4.4 FINANCE & CONTROL
The key factors impacting companies’ success are
• Revenue: company sales revenue
• Total Cost: cost of operations, employee salaries, fixed costs.

- 108 -
• Net income & margins: company net income is derived from sales revenue subtracting total cost; operating margin is calculated by dividing the net income by the sales revenue.
• Staff level: people costs
• Fixed cost
• Discovered rework
Finance and control present an overall competitive image of the company to any investor. Investors are looking for successful companies with high revenue growths as well as high operating margins. Figure 56 shows the simulation results for various cost and revenues settings. Higher productivity and lower discounts on the licenses and the maintenance fees increase revenues and net income. Higher costs lower the net income. Increasing staffing level may increase the company net income assuming there are sufficient amount of work ahead and the people and communication/administration overheads can be compensated through additional sales.
Figure 56 Cumulative Net Income

- 109 -
5.5 CHALLENGES TO MOBILE WEB APPLICATION BUSINESS
Mobile web application is an emerging industry. Some of the challenges in the sector are
• Absence of product and technological standardization: there are still several platforms, and the leading platforms such as RIM Blackberry and Apple iPhone are proprietary platforms. As such, the cost for an application across these mobile platforms is high.
• Customer confusion: mobile web application is an exciting field, but majority of the existing applications are simply technology-oriented prototypes. There are many competing technologies in the market from communication technologies to software functionalities. Customers are confused what some of the applications aim to do or what values they intend to provide. In addition, there are various platforms even from the same supplier and same product line. Some of the vendor neutral solution such as J2ME is not mature yet, so applications have to be ported from one mobile platform to another.
• Erratic product quality: with various wireless technologies such as GSM and CDMA and mobile device platforms such as Nokia and Motorola, the network coverage and communication bandwidth is different from location to location. For a specific hardware platform such as Blackberry 8830, a carrier has to support several versions in its networks. For mobile web application providers, it is nearly impossible to test all field operating scenarios in its lab environment for the supported platforms and versions. As a result, the quality perception on some mobile web applications is poor.
• Lack creditability with the financial industry: financial analysts and investors care less on the technology but are more interested in the sustainable business revenue models for mobile web applications.
• Need a more prepared response to criticisms from threatened entities: mobile web applications can improve work efficiency as well as create automation. Consequently, some people’s job or environment will be impacted. These people may challenge whether the computerized application can replace their position. An interesting example is a health care mobile web application to collect patient’s data via a mobile phone and provide intelligent monitoring and analysis at a central web server. Lawsuit and complains are common in medical industry when patients are dissatisfied with medical services. Misdiagnosis could lead to serious health conditions.
Business managers in mobile web application industry can consider the following strategy directions
• Shaping industry structure: as discussed in the thesis, mobile web applications can focus on different values and belong to various categories. Some of the mobile web applications are not only a software solution but can be easily ported to a GPS device. Since this is an emerging sector, the roles of players in the ecosystem are not well defined. A supplier may also play the role of distributor. In cloud computing,

- 110 -
the application deployment and application life cycle management could be a new sector.
• Timing entry and securing first mover advantage: getting into an area first certainly has the first mover advantage. A good product first into the market not only has the customers buy-in but also locks in the customers data. However, too early entering the market may have to wait for customer acceptance and sale opportunities, and may later lost the momentum. A startup company has limited resources so it definitely needs a good timing entry.
• Acquisition: with available resources, relationships, and creditability, a company may consider acquisition to enter this sector. For example, a mobile web application business may consider merging GPS business or map application.
• Vertical integration: a vertical domain solution implemented using mobile web application is very attractive given the advance of the mobile web computing technology and the value to be delivered for customers in that domain.

- 111 -
6. CONCLUSION This thesis presented a comprehensive study of mobile web applications including a new taxonomy, selected case studies, and a detail business strategy analysis. The thesis presented a definition of mobile web aggregation and described key issues of mobile web aggregation.
The thesis reviewed the surrounding environment for mobile web applications, namely web 2.0, web 3.0, conventional and modern wireless communication technologies, Smartphone platform, Android, J2ME, and the trends for mobile device platform. The review summarized the technology background and the market conditions for mobile web applications. Wireless network technologies ranging from cellular networks and WiFi to WiMAX and Wireless Mesh Networks become widely available, and standardization of the emerging wireless technologies make the wireless solution cost-efficient. The Smartphone has been identified as a key growth area in the telecommunication and electronic consumer market. Traditional mobile phone suppliers include Nokia, RIM, Palm, and Motorola, and the recent entry and success of Apple’s iPhone greatly enhanced the public awareness of Smartphone technology and mobile device functionality. Google’s release of open-source Android platform and T-Mobile’s deployment of Android powered “Dream” Smartphone in production network not only increase the competition among mobile device platforms and lower the mobile device sale prices, but also provide an open-source foundation for mobile web applications.
The thesis introduced a mobile web application taxonomy to systematically study the values and the groupings of the mobile web applications. By introducing features, categories, and subcategories, the taxonomy provides a framework so the related companies and businesses can be comparatively analyzed and summarized. The difference between mobile web applications and conventional native mobile applications is described. Mobile web aggregation is relatively a new concept to integrate data from multiple sources, at least one from the web. Mobile web aggregation in relation to the taxonomy is provided at the end of taxonomy discussion. In the light of the taxonomy, 5 case studies using Loopt, Google Mobile Search, TruTap, eBuddy, and MedApps are presented. Furthermore, the thesis provided a definition for mobile web aggregation, and highlighted the key issues of mobile web aggregation such as mobile web application development platform, context modeling, mobile application user interface, mobile web application logic (such as personalization and mining), and mobile web aggregation strategy.
System Thinking is applied to the management of mobile web application business. The market ecosystem, the value proposition, and the revenue model for mobile web application are discussed in the thesis. A system dynamic model is constructed to understand the dynamic among the key factors in the mobile web business strategy. The three areas of focus are marketing and sales, operations, and finance. Simulation is conducted using the system dynamic model. Experimental results show a strong correlation among innovation level, software product quality, discovered rework, market share rate change, and financial revenues.

- 112 -
The challenges facing the mobile web application industry are summarized as the absence of product and technological standardization, the customer confusion for the wide variety of products, the erratic product quality for insufficient lab testing, the lack creditability with the financial industry, and the need for more prepared responses to criticisms from threatened entities as a result of automation. Among the challenges, the key for a successful mobile web business is still to have a sustainable revenue model and a solid financial balance sheet.

- 113 -
7. REFERENCES
1) O. Starr, Mobile 2.0 Is Not Web 2.0, http://mobhappy.com/blog1/2006/02/06/mobile-20-is-not-web-20, Feb 6, 2006. 2) Mobile 2.0, http://en.wikipedia.org/wiki/Mobile_2.0. 3) Juniper Research Press Release on Mobile Web 2.0 Revenue, May 14, 2008, http://www.juniperresearch.com/shop/viewpressrelease.php?pr=91. 4) Web 2.0, Wikipedia, http://en.wikipedia.org/wiki/Web_2.0 5) What is Web 2.0 http://www.oreillynet.com/pub/a/oreilly/tim/news/2005/09/30/what-is-web-20.html 6) TV sets in use worldwide, http://www.businessweek.com/magazine/content/05_06/b3919124_mz063.htm 7) P. Dourish, “What we talk about when we talk about context,” Personal and Ubiquitous Computing Journal, Vol 8, No 1, pp 19-30, 2001 8) Heidmann, F., 1999. Aufgaben- und nutzerorientierte Unterstützung kartographischer Kommunikationsprozesse durch Arbeitsgraphik: Konzeptionen, Modellbildung und experimentelle Untersuchungen.Herdecke: GCA-Verlag. 9) Gregory D. Abowd and Elizabeth D. Mynatt. Charting past, present, and future research in ubiquitous computing. ACM Trans. Computer-Human Interaction, 7(1):29–58, 2000. 10) A. K. Dey, “Understand and Using Context,” Personal and Ubiquitous Computing Journal, Vol 5, No 1, pp 4-7, 2001. 11) Beale, R., & Lonsdale, P. (2004). Mobile context aware systems: The intelligence to support tasks and effectively utilise resources. Lecture Notes in Computer Science No. 3160 Springer-Verlag, 240-251. 12) Mobile Terminal Market Share - Gartner Says Worldwide Mobile Phone Sales Increased 16 Percent in 2007, Gartner Inc, http://www.gartner.com/it/page.jsp?id=612207, Feb 27, 2008. 13) C. Christensen, The Innovator’s Dilemma, HarperCollins, 2000. 14) C. Christensen, The Innovator’s Solution, HBS, 2003. 15) J. Utterbeck, Mastering the Dynamics of Innovation, Harvard Business School Press, 1996. 16) K. Ulrich and S. Eppinger, Product Design and Development, 3rd edition, McGraw Hill, 2004. 17) S. Madnick and M. Siegel, “Seizing the opportunity: exploring web aggregation,” MISO Executive, Vol 1, No 1, March 2002, pp 35-46. 18) M. Hansen, S. Madnick and M. Siegel, “Process aggregation using web services,” Proceedings of the Workshop on Web Services, e-Business, and the Semantic Web: Foundations, Models, Architecture, Engineering and Applications, (WseBT’02, Toronto, Canada), May 2002. 19) H. Fujii, T. Okano, S. Madnick and M. Siegel, “E-Aggregation: The Present and Future of Online Financial Services in Asia-Pacific,” Proceedings of the Sixth Pacific Asia Conference on Information Systems (PACIS-2002), Tokyo, Japan, September 3-4, 2002. 20) B. Libai, Marketing Management, MIT Sloan Course Reader of 15.840, Spring 2007. 21) Afuah, and C. Tucci, Internet Business Models and Strategies, 2nd edition, Irwin/McGraw-Hill, 2003.

- 114 -
22) R. Lai, P. Weill, & T. Malone, Do Business Models Matter, MIT Sloan Technical Report, http://seeit.mit.edu/Publications/DoBMsMatter7.pdf, 2006. 23) Y. Hu, Essays on Internet Markets and Information Goods, MIT Sloan PhD Thesis, 2005. 24) J. Magretta, “Why business models matter,” Harvard Business Review, pp86-92, Vol. 80, No 5, May 2002. 25) G. Moore, “Strategy and your stronger hand,” Harvard Business Review, pp62-72, Vol. 83, No 12, Dec 2005. 26) Matsuki, The Paradigm Shift in Wireless Platforms: from Traffic Business to Transaction Business, MIT Sloan MBA Thesis, 2005. 27) J. Sun, Market and Strategic Analysis of Opinion Aggregators, MIT SDM Thesis, 2008 28) J. Hu, Business Models of Information Aggregators, MIT SDM Thesis, 2007. 29) E. Crawley, Lecture Notes of MIT ESD 34 System Architecture, Fall 2007. 30) J2ME Official Website: http://java.sun.com/javame/index.jsp 31) Wireless Toolkit: http://java.sun.com/products/sjwtoolkit/ 32) S. Li and J. Knudsen, Beginning J2ME: From Novice to Professional, 3rd edition, Apress, 2005. 33) W3 Mobile Web Initiative, http://www.w3.org/Mobile/ 34) Marketing Virtual Library http://www.knowthis.com 35) D. Ikeda, Benefit from Web Services in the Mobile Internet Industry, MIT ESD SM TPP Thesis, 2004. 36) J. Ross, P. Weill, and D. Robertson, Enterprise Architecture as Strategy: Creating a Foundation for Business Execution, Harvard Business School Press, 2006. 37) P. Weill, IT Governance: How Top Performers Manage IT Decision Rights for Superior Results, Harvard Business School Press, 2004. 38) J. Ross and P. Weill, “All roads lead to the SEO,” Wall Street Journal, June 16, 2007. 39) T. Breene, P. Nunes, and W. Shill, “The Chief Strategy Officer,” Harvard Business Review, October 2007. 40) C. Beath and J. Ross, Information and Transformation at Swiss Re: Maximizing Economic Value, MIT Sloan CISR Working Paper No. 373, December 2007. 41) J. Ross and C. Lentz, IT Governance at USAA: Implementing Enterprise-wide Synergies, MIT Sloan CISR Working Paper No. 339, January 2004. 42) T. Steinert-Threlkeld, “Case 193 A Dissection: Nestle Pieces IT Together,” Baseline, January 2006. 43) Ian. F. Akyildiz and Xudong Wang, “A survey on wireless mesh networks,” IEEE Communications Magazine, vol. 43, no. 9, s23-s30, Sept. 2005 44) D. Norton and R. Kaplan, “Having trouble with your strategy? Then map it” Harvard Business Review, September 2000. 45) J. Ross and P. Weill, Who Owns Strategy Execution in Your Company, MIT Sloan CISR Research Briefing, July 2007. 46) D. Collis and M. Rukstad, “Can you say what your strategy is?” Harvard Business Review, April 2008. 47) J. Hagel and J. Brown, “Your next IT strategy,” Harvard Business Review, October 2001. 48) N Eagle and A. Pentland, “Mobile matchmaking: proximity sensing and curing,” IEEE Pervasive Computing, Special Issue: The Smart Phone, April 2005. 49) Pentland, “Socially aware computation and communication,” IEEE Computer, Vol.38, No.1, pp. 30-44, Jan 2005

- 115 -
50) S. Lei and K. Zhang, “Mobile context modeling using conceptual graphs,” Proceeedings of the IEEE International Conference on Wireless and Mobile Computing, Networking and Communications, Vol.4, pp131-138, Aug 2005. 51) T. Strang, and C. Linnhoff-Popien. “A Context Modelling Survey,” Workshop on Advanced Context Modelling, Reasoning and Management as part of UbiComp 2004, Nottingham/England, Sep. 2004 52) J. Baget and M. Mugnier. “Extensions of Simple Conceptual Graphs: the Complexity of Rules and Constraints”, J. Artificial Intelligence, Res. (JAIR) 16, 2002, pp. 425-465. 53) J. F. Sowa, Knowledge Representation: Logical, Philosophical, and Computational Foundations, Brooks Cole Publishing Co., Pacific Grove, CA, 2000. 54) D. Robbins, B. Lee, and R. Fernandez, “TapGlance: designing a unified smartphone interface,” Proceedings of the 7th ACM conference on Designing Interactive Systems, pp 386-394, Cape Town, South Africa, 2008. 55) A. Karlson, G. Robertson, D. Robbins, M. Czerwinski, and G. Smith, “FaThumb: a facet-based interface for mobile search,” Proceedings of the ACM SIGCHI, April 2006. 56) S. Anand and B. Mobasher, “Introduction to intelligent techniques for web personalization,” ACM Transactions of Internet Technology, Vol. 7 No. 4, Oct 2007. 57) S. Ha, “Helping online customers decide through web personalization,” IEEE Intelligent Systems, vol 17, no. 6, pp34-43, 2002. 58) S. Ha, “Digital content recommender on the Internet,” IEEE Intelligent Systems, vol 21, no. 2, pp70-77, 2006. 59) K. Tam and S. Ho, “Web personalization: is it effective,” IT Professional, Vol 5 No 5, pp 53-57, 2003. 60) P. Senge, The Fifth Discipline: The Art & Practice of The Learning Organization, Currency Doubleday Press, 1990. 61) James Moore, “Predators and Prey,” Harvard Business Review, May-June 1993. 62) J. Ledgerwood, Microfinance Handbook: an Institutional and Financial Perspective, Washington DC, The World Bank, 2000. 63) A. Osterwalder, The Business Model Ontology – A Proposition in A Design Science Approach, Thesis, 2004 64) F. Hecker, Setting Up Shop: The Business of Open-Source Software, http://hecker.org/writings/setting-up-shop 65) M. Porter, Competitive Strategy: Techniques for Analyzing Industries and Competitors, The Free Press, 1998 66) M. Iansiti and R. Levien, “Strategy as ecology,” Harvard Business Review, March 2004.