a technical and economic study of separate … · a technical and economic study of separate...
TRANSCRIPT

A technical and economic study of separate biowaste collection - Synthesis | PAGE 1
A TECHNICAL AND ECONOMIC STUDY OF SEPARATE BIOWASTE COLLECTION
SYNTHESIS

A technical and economic study of separate biowaste collection - Synthesis | PAGE 2
ACKNOWLEDGEMENTS
This study could not have been made without the major contribution brought by local authorities who agreed
to share their experience and answered the numerous questions asked.
CITATION OF THIS SYNTHESIS
AJBD, Adeline SEROUSSI, Céline GODOY. CITEXIA, Sylvie COURBET. ADEME, Olga KERGARAVAT,
Alexandra GENTRIC. Janvier 2018. Synthèse Etude technico-économique de la collecte séparée des
biodéchets. 12 pages.
This report is available online at www.ademe.fr/mediatheque
Any complete or partial representation or reproduction carried out without the consent of the author or his successors in title or assignees is prohibited according to the French Intellectual Property Code (art. L122-4) and constitutes an infringement punishable by the Criminal Code. Only (art. 122-5). Copies or reproductions strictly reserved for the copyist's private usage and not intended for collective usage are authorized, as well as analyses and quotations of short passages that are justified by the critical, educational or informational nature of the work in which they are incorporated, subject, nevertheless, to compliance with articles L 122-10 to L 122-12 of the same Code, as relates to reprographic reproduction.
This document is published by ADEME
20, avenue du Grésillé
BP 90406 | 49004 Angers Cedex 01
Contract’s number : 16MAR000270
Study carried out on behalf of ADEME by : AJBD and CITEXIA
Pilot and editorial committee - ADEME : Olga KERGARAVAT,
Alexandra GENTRIC, Chloé MAHE – Circular Economy and
Waste Division/Waste Identification and Management Service

A technical and economic study of separate biowaste collection - Synthesis | PAGE 3
Table of contents INTRODUCTION .......................................................................................... 1
OVERVIEW OF THE LOCAL AUTHORITIES ENGAGED IN SEPARATE BIOWASTE
COLLECTION AS OF JANUARY 1ST 2016. ....................................................... 1
What is the level of deployment of separate biowaste collection in France as of January 1st 2016? ................................................................................................................................. 1
What kind of organisation has been chosen by local authorities engaged in separate biowaste collection? ........................................................................................................... 2
What are the stages of implementing a separate biowaste collection? ............................... 4
Why have some local authorities given up separate biowaste collection? .......................... 4
TECHNICAL AND ECONOMIC REVIEW OF SEPARATE BIOWASTE COLLECTION ....... 4
How much biowaste is collected? ....................................................................................... 4
How does a separate biowaste collection impact technical performances of waste management public services? ............................................................................................ 5
How can a separate biowaste collection complement with a “pay-as-you-throw” system? .. 6
What is the cost of a separate biowaste collection? ........................................................... 7
What is the economic impact of separate biowaste collection on waste management public service’s costs? .................................................................................................................. 8
What is the technical and economic impact of implementing a separate biowaste collection? .......................................................................................................................... 9
What are the performances of separate biowaste collection for professionals? .................. 9
HOW CAN A SEPARATE BIOWASTE COLLECTION COMPLEMENT WITH A LOCALLY-BASED MANAGEMENT OF BIOWASTE? ........................................................... 9
REVIEW AND RECOMMENDATIONS ............................................................. 11

A technical and economic study of separate biowaste collection - Synthesis | PAGE 1
Introduction
Separate biowaste collection constitutes a major challenge for the public waste management:
Biowaste make up to 31 % of the residual waste on a national level1: therefore, a separate biowaste collection is truly relevant environmentally speaking.
The French law on energy and climate change passed on 17th August 2015 (Loi relative à la transition énergétique pour la croissance verte - LTECV) stipulates that source separation of biowaste must be widespread and accessible to all waste producers before 2025. It is up to local authorities to define the technical solutions that will be used for locally-based composting and separate collection, as well as an appropriate pace for implementation on their territory ».
In order to promote the development of separate biowaste collection, the French environment and
energy management agency (ADEME) has conducted a study to provide an overview of local authorities
that have already implemented such collection, success factors, watch-points and economic impacts of
a separate collection. The study draws upon data provided by the local authorities engaged in separate
biowaste collection as of January 1st 2016. The study also shows the conditions in which biowaste
collection and locally-based composting can complement.
Overview of the local authorities engaged in separate biowaste collection as of January 1st 2016.
WHAT IS THE LEVEL OF DEPLOYMENT OF SEPARATE BIOWASTE COLLECTION IN FRANCE AS OF
JANUARY 1ST 2016?
On January 1st 2016, 125 local authorities in France are engaged in separate biowaste collection:
24 local authorities offer separate collection to professional users only
101 local authorities offer separate collection to both households and professional users. 5.7% of the French population, i.e. 3.26 million inhabitants have at their disposal a separate biowaste collection.
Figure 1 : geographical distribution of biowaste separate collection in France
Very often, separate biowaste collections implemented by local authorities only serve part of their
territory. In terms of population served, Lille’s Metropolis is the biggest French local authority that has
deployed separate biowaste collection; more than 500 000 inhabitants are covered by this scheme.
1 National waste characterisation study called “MODECOM” realized in 2007
More than 350 000

A technical and economic study of separate biowaste collection - Synthesis | PAGE 2
Figure 2 : Share of the population covered by separate collection within a local authority based on housing typology
50 local authorities collect only food waste. Garden waste (such as grass clippings, leaves,
branches…) are prohibited in sorting guidance. Faded flowers, newspapers, mineral litter can be
tolerated. 51 local authorities collect both food scraps and garden waste in the same wheeled
bin.
Biowaste collections have spread progressively since the beginning of the 1990’s. Separate collections
of food waste only started to develop in the mid-2000’s.
Most of the local authorities engaged in separate biowaste collection are with different king of housing
typology. Few rural territories and « touristic zones » are engaged in this kind of collection.
Figure 3 : Type of collection based on housing typology
WHAT KIND OF ORGANISATION HAS BEEN CHOSEN BY LOCAL AUTHORITIES ENGAGED IN
SEPARATE BIOWASTE COLLECTION?
Almost all of local authorities have chosen a kerbside collection system. Two local authorities have
chosen different organisations: drop-off collection for “Communauté de communes Essor du Rhin” (68)
(a semi-underground container with access control system called « Tube® ») and collection in gathering
points for municipalities belonging to former “Communauté de communes d’Hirsingue” (residual waste,
packaging and papers, biowaste are collected in the same wheeled bin, in coloured coded-bags).
Most of the local authorities (63%) collect biowaste and residual waste weekly. Collection
frequency for biowaste vary from once every two weeks to twice a week. They vary little according to
seasonality effects. Despite the fact that separate biowaste collection requires an additional kerbside
collection, only 10 local authorities have decreased their frequency for residual waste to once every two
weeks.
Num
ber
of
local auth
orities

A technical and economic study of separate biowaste collection - Synthesis | PAGE 3
Figure 4 : Collection frequencies for biowaste and residual waste
Local authorities have underlined the importance of choosing the appropriate pre-collection
equipment in order to encourage involvement and facilitate sorting habits for the users:
98% of local authorities collecting biowaste separately provide a kitchen caddy (mainly from 7 to 10L). Nearly half of these local authorities combine it with bags and a container. Aerated kitchen caddies are still poorly developed (13% of local authorities use it or choose it when renewing their pool of containers) but there is a unanimous agreement that aerated kitchen caddies with help reduce inconveniences for users.
54% of local authorities offer caddy liners (compostable bags) to users.
The majority of local authorities use a wheeled bin; only 21% of them collect the kitchen caddy directly (they are consequently bigger, between 30 and 40L). Container’s sizes vary from 35L (“modulo” container) to 240L, 120 and 240L being the most used ones. Containers with a reductive tank are 120L containers of which the effective volume has been reduced to 40L. They are not widely used but provide an interesting solution for an increasing number of local authorities; indeed, their size helps preventing garden waste deposits while respecting R437 recommendations2 for waste collectors.
All local authorities Collection of food waste only Collection of food waste and
garden waste
Kitchen caddies only 16% 8% 23%
Kitchen caddies + bags 3% 6% 0%
Kitchen caddies + bags + individual bins 23% 30% 16%
Kitchen caddies + individual bins 14% 12% 16%
Bags + individual bins 3% 0% 6%
Individual bins only 19% 2% 35%
Kitchen caddies + bags in multiple compartments bins (Sydeme) 13% 24% 2%
Kitchen caddies + bags + gathering points/drop-off system 7% 16% 0%
No data 2% 2% 2%
Table 1: Pre-collection equipment used for biowaste
70 % of local authorities choose to compost biowaste. Generally speaking methanation is more often
used by bigger local authorities; the process is indeed more complex and requires significant
investments.
Treatment methods for residual waste among local authorities engaged in separate biowaste collection
are similar to that of other French local authorities (landfilling and/or incineration).
2 Recommendations regarding waste collection issued by the national Health Insurance Fund for Employees called CNAMTS

A technical and economic study of separate biowaste collection - Synthesis | PAGE 4
WHAT ARE THE STAGES OF IMPLEMENTING A SEPARATE BIOWASTE COLLECTION?
70% of local authorities carry out feasibility studies before implementing separate biowaste collection.
Nearly half of local authorities starts with a trial phase on a specific area of the territory. The trial can
last between 2 months to a year. It allows for an adjustment of the area covered by separate collection,
the housing typology targeted and the suitability of the pre-collection equipment.
Following the implementation of separate collection, adjustments can be made :
Adaptation of the pre-collection equipment: aerated kitchen caddy, reducing the size of wheeled bins or using wheeled bins with a reductive tank,
Adaptation of sorting instructions, for example to prevent garden waste deposits. However, feedbacks show it is more efficient to forbid garden waste from the beginning; removing them later from the instructions might be considered as a step backwards in the service provided.
Reduction of collection frequency for residual waste
Adjustment of the areas covered by separate collection (from suburban individual housing to more complex housing such as city centres and high-rise blocks and flats).
WHY HAVE SOME LOCAL AUTHORITIES GIVEN UP SEPARATE BIOWASTE COLLECTION?
23 local authorities have been identified as having dropped separate biowaste collection. Feedback
from these local authorities lead to the following conclusions:
Background: they started collecting biowaste in the late 1990s- early 2000s and stopped between 2010 and 2015. Garden waste were tolerated from the start.
Reasons why they stopped collecting biowaste:
An important proportion of garden and undesirable waste. Sorting instructions were not respected (unsuitable volume of wheeled bins, lack of follow-up, lack of communication…). Recovering biowaste thus became problematic: recovery performances deteriorated because of a lack of fermentation and costs increased because local authorities had to deal with additional undesirable waste.
Some of these local authorities’ territories have evolved: they decided to stop this additional collection rather than expand it to the whole area.
Technical and economic review of separate biowaste collection
HOW MUCH BIOWASTE IS COLLECTED?
Preliminary remark: food waste only and food and garden waste ratios are calculated and expressed in kg per
inhabitant (areas covered by separate biowaste collection).
The average biowaste ratio on a national level is 63 kg per inhabitant having at their disposal biowaste
collection. The housing typology does not influence this ratio. However, sorting instructions affect the
amount of biowaste collected:
An average ratio of 46 kg per inhabitant having food waste collection
An average ratio of 99 kg per inhabitant having food and garden waste collection.
Figure 5 : Dispersion of biowaste ratios
Kg
per
inh
ab
itan
t h
av
ing
bio
wa
ste
co
llec
tio
n

A technical and economic study of separate biowaste collection - Synthesis | PAGE 5
There are several reasons that can explain performance disparities among food waste collections :
Sorting instructions are not respected and garden waste are found in the wheeled bins: available characterisations show a varying proportion of garden waste, from 5% to over 50%. Local authorities that do not provide information on small garden waste (grass clippings, leaves) usually tolerate small amount of it.
Food waste produced by professionals can also artificially inflate ratios, when there is no dedicated waste routing for professional and households. When there is a dedicated waste routing for professionals, we see that professionals account for 2 to 15% of the overall biowaste amount (representing up to 8kg per inhabitant served).
Organisation factors impacting and improving performances are :
Using kitchen caddies. Aerated kitchen caddies stimulate the evaporation, and thus artificially reduce the amount of biowaste collected.
Targeting a specific area for separate biowaste collection.
Accepting paper and cardboard in sorting instructions for local authorities collecting food waste only
A smaller volume for wheeled bins helps prevent people from depositing garden waste.
Waste operators often visually check sorting quality of the bins. They can refuse to collect bins if there
spot too many errors. Few local authorities carry out biowaste characterisations. The rate of undesirable
waste is not a problem (less than 5%), with only a few exceptions. The composition of undesirable waste
varies depending on the location (plastics, residual waste, glass, sanitary towels, and papers-
cardboards).
HOW DOES A SEPARATE BIOWASTE COLLECTION IMPACT TECHNICAL PERFORMANCES OF
WASTE MANAGEMENT PUBLIC SERVICES?
Preliminary remark: this section provides analysis only on local authorities offering separate biowaste collection to
more than 90% of their population. The sample includes 37 local authorities collecting food waste only and 18 local
authorities collecting both food and garden waste.
Local authorities engaged in separate biowaste collection show:
A lower residual waste ratio than the national average: 154 kg of residual waste per inhabitant when food waste collection is implemented; 226 kg per inhabitant when food and garden waste collection is implemented, compared to 262 kg per inhabitant on a national level (i.e. 41% and 26% less respectively). Rural and mixed housing typologies engaged in separate biowaste collection have better results, with more than 90% of local authorities producing less than 200kg residual waste per inhabitant.
Figure 6: Residual waste ratios collected depending on housing typology and sorting instructions for biowaste
A recyclable waste ratio 20% higher than the national average (packaging, papers). Implementing a separate biowaste collection seems to encourage people to improve recyclable dry packaging waste and glass sorting.

A technical and economic study of separate biowaste collection - Synthesis | PAGE 6
Local authorities take the new collection as an opportunity to increase communication on other waste streams and thus usually notice a knock-off effect on other separate collections.
Observations on the residual + biowaste ratio :
For local authorities collecting food waste only, this ratio is lower than the average residual waste ratio on a national level (199 kg per inhabitant v. 262 kg per inhabitant). We see further confirmation of this trend for every housing typology. Similarly, separate food waste collection only seems to have a positive impact on household and similar waste production3: household and similar waste ratios are 8% lower than the national average.
For local authorities collecting both food and garden waste, this ratio is higher than the national average ratio of residual waste. Household and similar waste ratios are 12% higher than the national average. Indeed, these local authorities collect garden waste that were until then locally composted or brought to household waste recycling centre (HWRC).
The fermentable portion of residual waste is successfully diverted towards separate collection.
Characterisations carried out on a national level by the ADEME agency in 2007 show that fermentable
waste make up 31% of residual waste. 26 local authorities have carried out specific characterisations:
fermentable waste make up between 21% of residual waste in case of food waste collection (i.e. 35kg
per inhabitant) and 23% in case of food and garden waste collection (i.e. 52kg per inhabitant).
Fermentable portion in residual waste is above 20% for 9 of these local authorities and above 30% for
5 of them.
Local authorities engaged in separate waste collection have a higher global recovery rate4 (both material
and organic recovery) than the national average (between 48 and 50% depending on the collection’s
type, while the average recovery rate is 33%). Organic recovery rate of local authorities engaged in
separate biowaste collection is 24% (15% on a national level). These recovery rates have almost
reached the recovery goal set by the 2015 French law on energy and climate change (LTECV) which is
55% in 2020 and 65% in 2025 for non-hazardous and non-inert waste.
Figure 7: Recovery rates’ average depending on biowaste collection’s type and national average
HOW CAN A SEPARATE BIOWASTE COLLECTION COMPLEMENT WITH A “PAY-AS-YOU-THROW”
SYSTEM ?
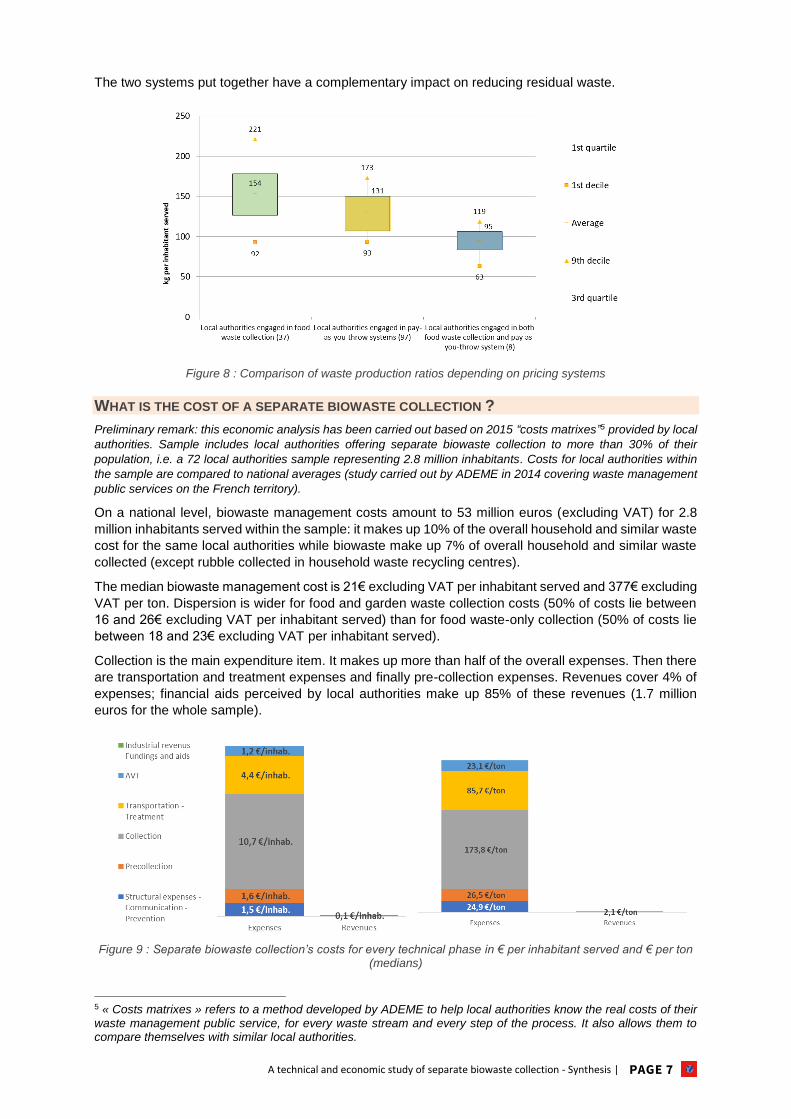
Ten local authorities engaged in separate biowaste collection have implemented a “pay-as-you-throw”
system. Except for one, they all collect food waste only. It must be noted that four of them have a
fortnightly residual waste collection.
Their average residual waste ratio (95kg per inhabitant) is lower than that of local authorities engaged
in food waste collection (154kg per inhabitant) and the average ratio for local authorities engaged in
pay-as-you-throw systems (131kg per inhabitant).
3 Household and similar waste are made of every type of waste produced by households (residual and recyclable waste, biowaste, waste deposited in HWRC…) and waste produced by small professional entities that are collected with households’ waste by the public service. 4 Recovery rates presented in this paragraph are based on waste “sent to” recovering facilities: it takes into account the initial waste destination but not its actual recovery.
A technical and economic study of separate biowaste collection - Synthesis | PAGE 7
The two systems put together have a complementary impact on reducing residual waste.
Figure 8 : Comparison of waste production ratios depending on pricing systems
WHAT IS THE COST OF A SEPARATE BIOWASTE COLLECTION ?
Preliminary remark: this economic analysis has been carried out based on 2015 “costs matrixes”5 provided by local
authorities. Sample includes local authorities offering separate biowaste collection to more than 30% of their
population, i.e. a 72 local authorities sample representing 2.8 million inhabitants. Costs for local authorities within
the sample are compared to national averages (study carried out by ADEME in 2014 covering waste management
public services on the French territory).
On a national level, biowaste management costs amount to 53 million euros (excluding VAT) for 2.8
million inhabitants served within the sample: it makes up 10% of the overall household and similar waste
cost for the same local authorities while biowaste make up 7% of overall household and similar waste
collected (except rubble collected in household waste recycling centres).
The median biowaste management cost is 21€ excluding VAT per inhabitant served and 377€ excluding
VAT per ton. Dispersion is wider for food and garden waste collection costs (50% of costs lie between
16 and 26€ excluding VAT per inhabitant served) than for food waste-only collection (50% of costs lie
between 18 and 23€ excluding VAT per inhabitant served).
Collection is the main expenditure item. It makes up more than half of the overall expenses. Then there
are transportation and treatment expenses and finally pre-collection expenses. Revenues cover 4% of
expenses; financial aids perceived by local authorities make up 85% of these revenues (1.7 million
euros for the whole sample).
Figure 9 : Separate biowaste collection’s costs for every technical phase in € per inhabitant served and € per ton (medians)
5 « Costs matrixes » refers to a method developed by ADEME to help local authorities know the real costs of their waste management public service, for every waste stream and every step of the process. It also allows them to compare themselves with similar local authorities.

A technical and economic study of separate biowaste collection - Synthesis | PAGE 8
WHAT IS THE ECONOMIC IMPACT OF SEPARATE BIOWASTE COLLECTION ON WASTE
MANAGEMENT PUBLIC SERVICE’S COSTS ?
A majority of local authorities within the sample (52 out of 72) notice that their household and similar
waste management cost is higher than that of local authorities with a similar housing typology. It is
higher by 11.3€ excluding VAT per inhabitant (median value):
Residual waste management cost is lower than that of local authorities with a similar housing typology: 24% lower for local authorities engaged in food waste collection and 6% lower for local authorities engaged in both food and garden waste collection. The residual waste cost decline can be linked to a reduction the amount of residual waste collected.
Figure 10 : Residual waste cost (in € excluding VAT per inhabitant) according to housing typology and sorting instructions
Residual + biowaste management cost is mostly higher (from 18%) than the average value for local authorities with a similar housing typology. A lower residual waste management cost does not offset the additional cost for biowaste management:
This gap is noticeable regardless of the biowaste sorting instructions: biowaste management cost (calculated for every inhabitant, served or not) is higher for food waste collections (20€ per inhabitant) than for food and garden waste collections (13€ per inhabitant). The main explanation is that food and garden waste collections often cover only part of the overall population. That extra cost is offset by a lower residual waste management cost for local authorities collecting food waste only.
The cost for both residual and biowaste is mainly linked to the amount of residual waste produced. As a consequence, the least expensive local authorities within the sample have at least one of the three following features: a lower residual waste ratio, a pay-as-you-throw system, a fortnightly residual waste collection.
The biowaste ratio does not have any impact on the cost of [residual + biowaste]
Figure 11 : Residual and biowaste cost (in € excluding VAT per inhabitant) according to housing typology and
sorting instructions
Packaging and papers management cost is higher for local authorities within the sample, because of particularities that are not linked to separate biowaste collection (a more expensive sorting phase).
Household waste recycling centres and glass management cost is similar to other local authorities on a national level.

A technical and economic study of separate biowaste collection - Synthesis | PAGE 9
WHAT IS THE TECHNICAL AND ECONOMIC IMPACT OF IMPLEMENTING A SEPARATE BIOWASTE
COLLECTION ?
Preliminary remark: this analysis covers local authorities that have implemented a separate biowaste collection
after 2009 and serve more than 80% of the population, i.e. a 19 local authorities sample covering 600.000
inhabitants.
Within that sample, implementing a separate biowaste collection has had a positive impact on:
Technical performances: residual waste ratios have decreased from 45% on average and residual+biowaste ratios have decreased from 30% compared to initial residual waste ratios. However, nuance can be brought to this assessment, considering that residual waste ratios tend to decrease on a national level. Household and similar waste also decrease following the implementation of separate biowaste collection, but at a lesser extent (13% on average).
Residual waste management costs (in € per inhabitant): they have decreased from 30% on average. Reducing residual waste amount has allowed local authorities to make some savings on collection and treatment costs.
Comparison of residual + biowaste costs shows that it is on average 5% higher than the cost of residual
waste only, before separate biowaste collection was implemented. This trend varies depending on local
authorities: half of them has seen their cost decrease, while the other half has seen them increase.
Local authorities whose residual + biowaste ratio has decreased from more than 80kg per inhabitant
have seen their residual + biowaste cost stabilise compared to residual waste cost prior to the
implementation.
WHAT ARE THE PERFORMANCES OF SEPARATE BIOWASTE COLLECTION FOR
PROFESSIONALS?
In 2016, 24 local authorities (mostly rural ones) offered a separate biowaste collection for professionals
only. That type of collection has first been implemented in the 2000s and has rapidly increased between
2010 and 2011; this development could be linked to the “Grenelle II” law which made separate biowaste
collection and recovery mandatory for large producers.
On average, these collections make up 1% of household and similar waste amount and 1.5% of their
management costs, for around 30 professional users covered. The impact of such collections on
performances and costs is low. Professional biowaste management cost varies from 0.2 to 3.4€ per
inhabitant, with an overall average of 1.5€ per inhabitant.
How can a separate biowaste collection complement with a locally-based management of biowaste?
Local authorities engaged in separate biowaste collection have chosen two main paths:
Complementarity between biowaste local management and separate collection: it allowed them to focus on a specific housing type (in order to collect only rural areas, or on the other side to promote collective composting in collective housing), widen the scope of recovered food waste (meat waste accepted in separate biowaste collection, garden waste better recovered through composting) or to adapt to constraints and users’ needs.
Competition between biowaste local management and separate collection: some local authorities chose not to promote locally-based composting in order to have bigger biowaste amount to collect and send to treatment facilities (they are often relatively sparse local authorities running their own treatment facilities).
We have contacted 17 driving local authorities engaged in local food waste management, among which
six have also implemented a separate biowaste collection. Here are their recommendations:
It is difficult to quantify the amount of food waste diverted thanks to locally-based composting. Henceforth, local authorities’ estimates are heterogenous: between 1 and 158kg per household for individual composting and between 14 and 100kg per household for collective composting systems. Their estimates do not allow us to make a precise assessment of these practices’ performances.

A technical and economic study of separate biowaste collection - Synthesis | PAGE 10
Important human means are required for implementation and follow-up. Personnel expenses make up 50% on average of the overall costs of local biowaste management. Feedbacks regarding collective composting sites show the need for one full-time agent for 170 sites (compost brewing, turning and removal, feeding it with shred, dealing with the various issues that may occur).
Shared composters follow-up requires technical skills and regular maintenance. Having a referring user does not necessarily guarantee the composter durability (removal, disengagement). Therefore, this person must be assisted by an additional organisation (association, local authority…).
Local authorities struggle to measure the impact of these actions on the amount of fermentable waste
that is being diverted from residual waste. It could hinder these local management actions’
enhancement; indeed, the lack of performance indicator makes it difficult for local authorities to justify
more human and financial resources for these actions. However, locally-based composting acts as
social link in collective housing and neighbourhoods. A quantitative assessment of biowaste diverted
from residual waste must not be seen as the only performance indicator. Indicators about citizen
involvement and quality of life improvement would help assess the social impact of such practices
beyond an entirely waste-oriented perspective.

A technical and economic study of separate biowaste collection - Synthesis | PAGE 11
Review and Recommendations
The exhaustive evaluation of local authorities’ feedbacks about separate biowaste collection allows us
to give an overall positive assessment: collection, which covers 5.7% of the French population on
January 1st 2016, is appreciated by the users. It has a positive impact on reducing the amount of residual
waste, regardless of the sorting instructions. It has a knock-on effect on other waste streams collected
separately; it is complementary with a pay-as-you-throw system (by helping to reduce waste and keep
cost under control).
Collecting food waste only allows for better results in diverting the organic part of residual waste.
Appropriate equipment exists: aerated kitchen caddies are unanimously appreciated, wheeled bins with
a reductive tank help respect CNAMTS recommendation while limiting the effective volume and
preventing too much garden waste. Several organisations can be set-up and offer an adequate solution
for every background: kerbside collection, gathering points, drop-off system, bin shelters. Setting-up a
separate collection does not pose any particular difficulties. Communication is nevertheless vital and
must be maintained over time.
The chart below shows a well-working scheme for separate collection. It is not the only scheme that
exists and it must be adapted to each territory (tourism nature, densely populated area…).
Figure 12: Standard pattern of a separate biowaste collection system
We were able to list the following watch points, based on feedbacks from local authorities that are or
were engaged in separate collection:
Ahead of the separate collection, local authorities need to:
Make sure they have a strong political backing.
Decide what their strategy will be regarding garden waste and forbid them when possible.
Think about the complementarity between separate collection and local management of biowaste.
Test the collection scheme before generalising it.
Conducting an in-depth study of the territory and the waste management public service will help keep costs under control. This study will ensure a better scaling of the new service: most appropriate areas to develop a separate collection, type of users covered, pre-collection equipment adapted to different types of housing, collection equipment, anticipating impacts of this new collection on the overall service (collection frequencies, expected gains due to reduced amounts of waste on collection and treatment costs), proximity of the treatment facility.
Define measurable indicators before and after separate collection to quantify the impact of this new collection (participation rate, quality of sorting habits, monitoring the proportion of fermentable waste in residual waste with local characterisations…).
Communicate on a regular basis in order to ensure a satisfactory sorting and an important part of kitchen waste.

A technical and economic study of separate biowaste collection - Synthesis | PAGE 12
Even with separate biowaste collection, waste management public services still have room for
improvement: reduce residual waste collection frequencies, keep adapting pre-collection equipment
(aerated kitchen caddies, wheeled bins with reductive tank). Some collection systems seem to struggle
and tend to turn into garden waste collection. They need to be revitalised, with political backing and
communication actions. Several local authorities’ territories have changed as a consequence of a new
French legislation (law NOTRe 6 ), and the separate collection now only covers part of their new
population; these local authorities will have to decide whether they extend separate collection, leave it
unchanged or put an end to it.
Recommendations vary according to the housing typology but generally speaking, separate biowaste
collection is complementary with local management of biowaste. In widely dispersed areas, where
an additional collection may be costly, it is recommended to encourage a local management of biowaste,
along with reduced collection frequencies for residual waste. In rural areas with a city, separate biowaste
collection can be set up in the densest areas. In touristic areas, separate collection is still
underdeveloped. Local authorities that have implemented separate give positive feedbacks, provided
that communication actions are carried out and target residents and tourists, especially during the tourist
season. In urban areas, separate collection can be implemented. In collective housings, investments
have to be foreseen for collection equipment (bin shelters). Local authorities should closely monitor
waste sorting quality of and ensure human resources are available to provide that control.
Finally, one must keep in mind that preventing waste must remain the top priority in application of the
general waste hierarchy. Furthermore, the study showed that local authorities need tools to monitor the
impact of waste prevention action and local management actions, quantify them and thereby justify the
need for long-term Waste Prevention Officer jobs to their local elected officials.
6 Loi portant Nouvelle Organisation Territoriale de la REpublique
A technical and economic study of separate biowaste collection - Synthesis | PAGE 13
ABOUT ADEME The French Environment and Energy Management Agency (ADEME) is active in the implementation of public policy in the areas of the environment, energy and sustainable development. The Agency provides expertise and advisory services to businesses, local authorities and communities, government bodies and the public at large, to enable them to establish and consolidate their environmental action. As part of this work ADEME helps finance projects, from research to implementation, in the areas of waste management, soil conservation, energy efficiency and renewable energy, raw materials savings, air quality, noise abatement, circular energy transition and food wastage abatement. ADEME is a public agency under the joint authority of the Ministry for an Ecological and Solidary Transition and the Ministry for Higher Education, Research and Innovation.

A technical and economic study of separate biowaste collection - Synthesis | PAGE 14
www.ademe.fr
A TECHNICAL AND
ECONOMIC STUDY OF
SEPARATE BIOWASTE
COLLECTION This study provides an overview of local
authorities that have implemented separate
biowaste collection as of January 1st 2016, in
order to determine success factors, watch points
and technical and economic impacts on the
waste management public service. It also aims at
determining success factors and watch points to
have in mind when reorganising a waste
management public service.
This study describes technical schemes chosen
by local authorities engaged in separate
biowaste collection (pre-collection equipment
as well as collection conditions). It provides
information about costs and performances
depending on technical schemes chosen by local
authorities and their context (including housing
typologies).
Local authorities that have dropped separate
biowaste collection have also been interviewed
in order to know the reasons.
Several organisations can be set-up and offer an adequate solution for every territory. Communication is nevertheless vital for citizens to get involved in this kind of collection. Finally, the study shows that separate biowaste collection can increase overall waste management costs; therefore, local authorities should be careful to size this new service appropriately and in general to improve the existing service in order to keep costs under control.