a technique for drawing directed graphs -...
TRANSCRIPT
by Emden R. Gansner, Eleftherios Koutsofios,Stephen C. North, Keim-Phong Vo
A Technique for Drawing Directed
Graphs
Jiwon HahnECE238
May 13, 2003

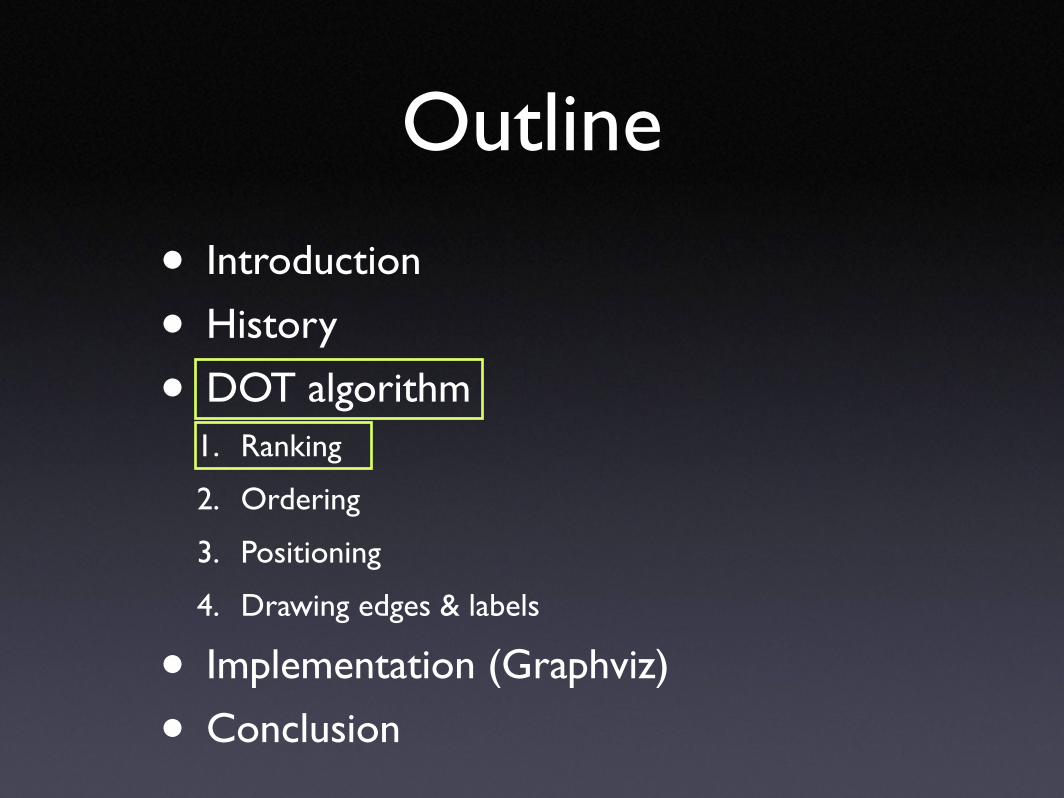
• Introduction
• History
• DOT algorithm1. Ranking
2. Ordering
3. Positioning
4. Drawing edges & labels
• Implementation (Graphviz)
• Conclusion
Outline

• Successful Techniques
• Planarization
• Layering (Hierarchical approach)
• Physical Simulation
Drawing Graph
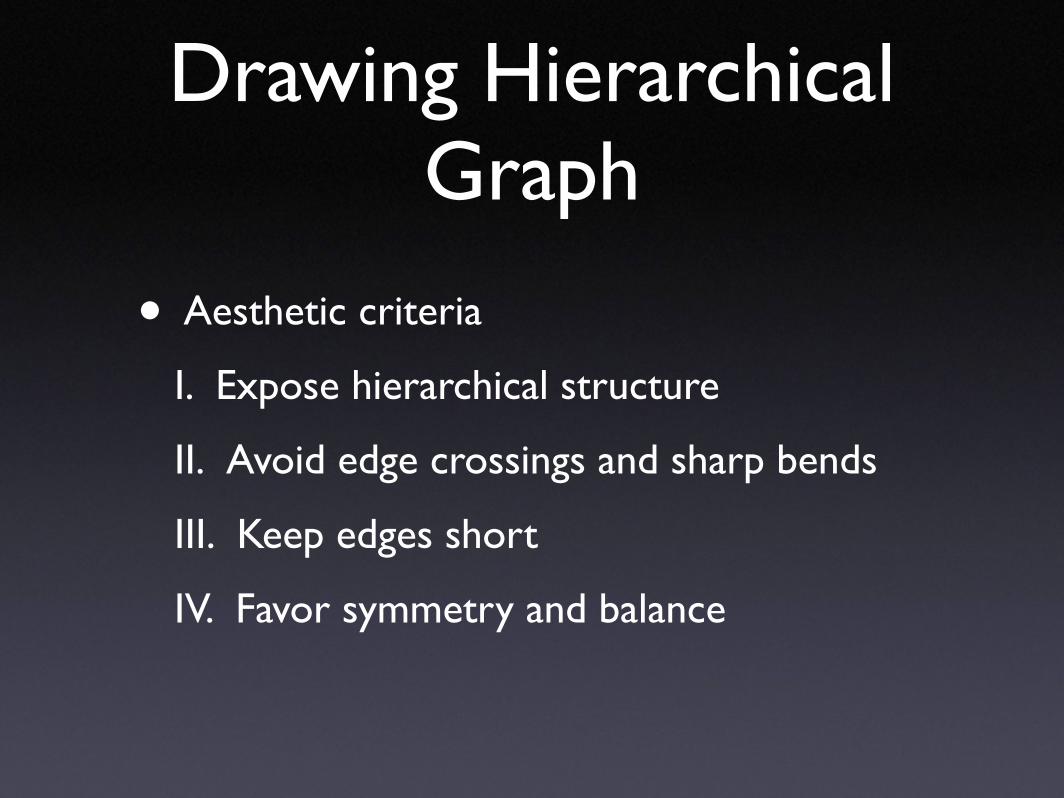
• Aesthetic criteria
I. Expose hierarchical structure
II. Avoid edge crossings and sharp bends
III. Keep edges short
IV. Favor symmetry and balance
Drawing Hierarchical Graph

• Aesthetic criteria
I. Expose hierarchical structure(edges in same direction)
Drawing Hierarchical Graph
VS.
(o) (x)
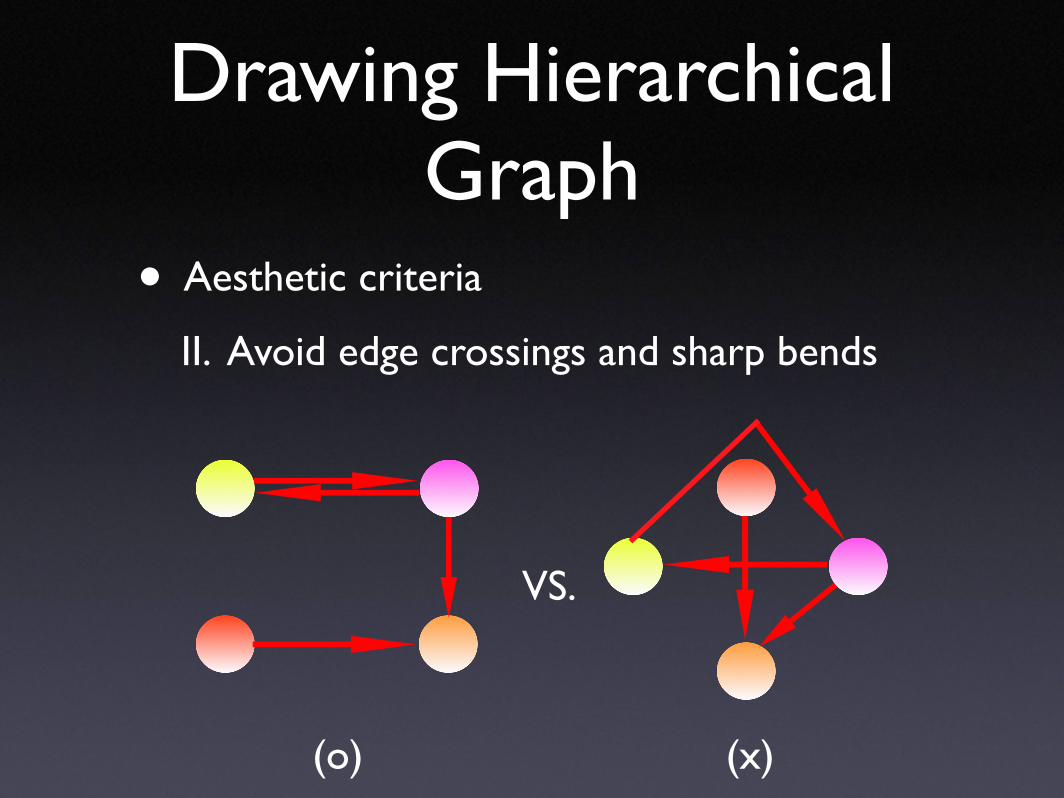
• Aesthetic criteria
II. Avoid edge crossings and sharp bends
Drawing Hierarchical Graph
VS.
(o) (x)

• Aesthetic criteria
III. Keep edges short
Drawing Hierarchical Graph
VS.
(o) (x)

• Aesthetic criteria
IV. Favor symmetry and balance
Drawing Hierarchical Graph
VS.
(o) (x)

DOT algorithm
DOT algorithmG (V, E)
Impossible to optimize aesthetics I~IV simulataneouly!
Therefore, DOT relies on heuristics that run quickly and make good layouts in common cases
xsize(v), ysize(v),
nodesep(G),ranksep(G),
w(e)

• Introduction
• History
• DOT algorithm1. Ranking
2. Ordering
3. Positioning
4. Drawing edges & labels
• Implementation (Graphviz)
• Conclusion
Outline

• 1977: Warfield
• 1980: Carpano
• 1981: Sugiyama et al.
• 1988: DAG
• 1993: DOT This work
History of Hierachical Visualization
Same basic approachGreatly improved algorithms

• 1993~ : DOT and DAG applied to various applications
• Visualizing event streams in 2D
• Drawing UML diagram
• Drawing Automata Layouts
• Visualizing Protein Interaction Pathways
History of Hierachical Visualization(cont.)

• Introduction
• History
• DOT algorithm1. Ranking
2. Ordering
3. Positioning
4. Drawing edges & labels
• Implementation (Graphviz)
• Conclusion
Outline

1. procedure draw_graph()2. begin3. rank();4. ordering();5. position();6. make_splines();7. end
DOT algorithm
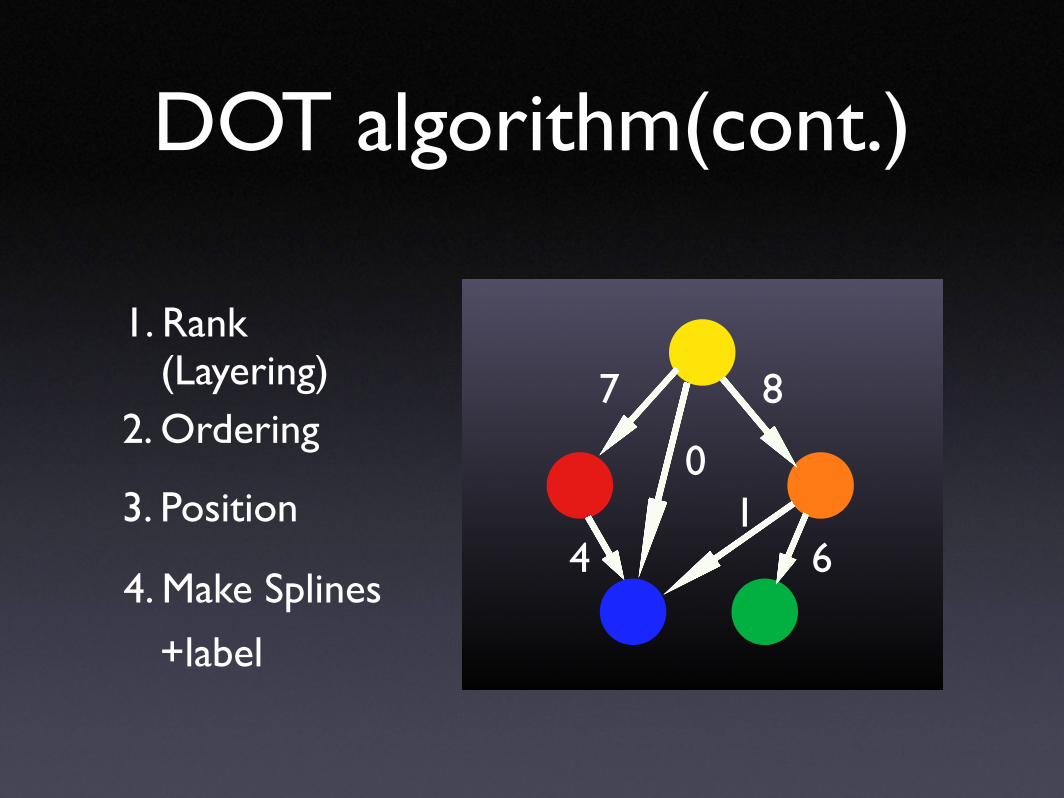
DOT algorithm(cont.)
2. Ordering
3. Position
4. Make Splines
1. Rank (Layering)
+label
7 8
0
41
6
• Introduction
• History
• DOT algorithm1. Ranking
2. Ordering
3. Positioning
4. Drawing edges & labels
• Implementation (Graphviz)
• Conclusion
Outline

• Preprocessing: Make the graph Acyclic
• DFS heuristic
• Among non-tree edges (Forward/Cross/Back edges), reverse the backward edges
• Restore the reversed edges before drawing
• More stable and informative drawings than other approaches
Step 1. Ranking
BC
F

• Assign each node to an integer rank
• Integer program for optimal ranking:
••• How to solve this?
Network Simplex Algorithm (NSA)
• not proven polynomial, but fast in practice
• easy to program
Step 1. Ranking (cont.)
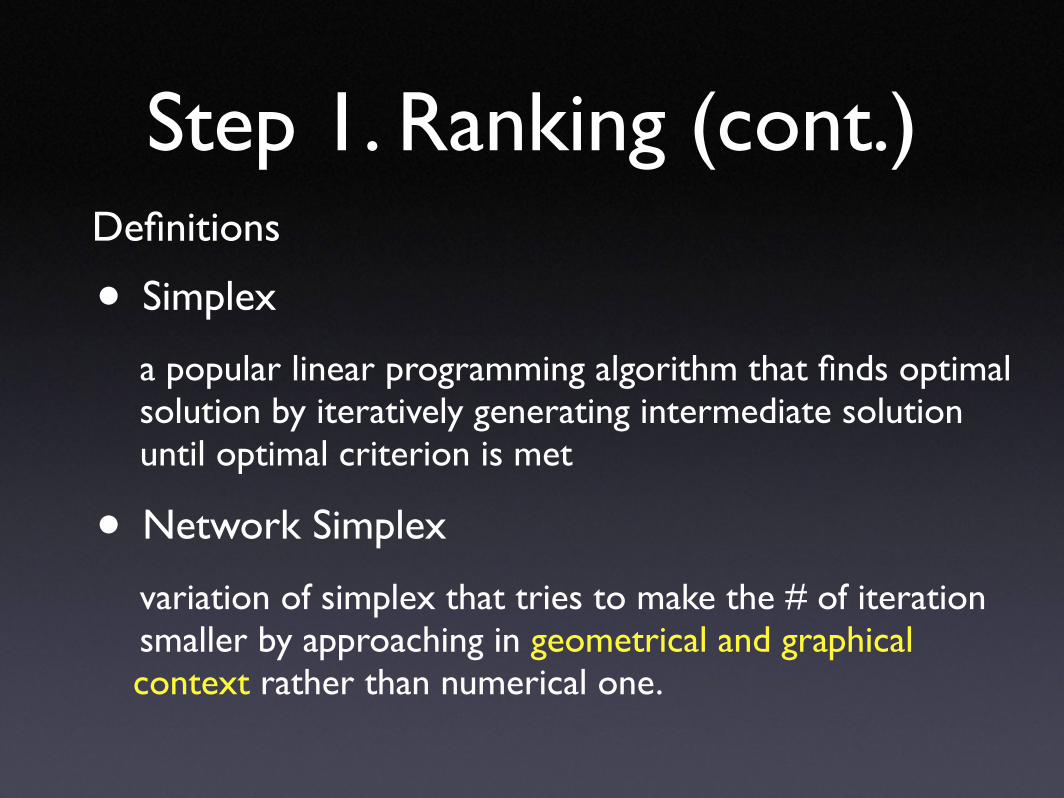
• Simplex
a popular linear programming algorithm that finds optimal solution by iteratively generating intermediate solution until optimal criterion is met
• Network Simplex
variation of simplex that tries to make the # of iteration smaller by approaching in geometrical and graphical context rather than numerical one.
Step 1. Ranking (cont.)Definitions

tail component
head component
• Spanning treea tree with |V|-1 edges that connects all the vertices of the Graph
• Feasible spanning treea spanning tree that induces feasible ranking
• Cut value(sum of outgoing edges) - (sum of incoming edges) at the viewpoint of tail component
Step 1. Ranking (cont.)Definitions
cut value=1-2= -1a
b

• Applying Network Simplex Algorithm to this problem:
• Optimal solution is found when the cut values of each tree edge of a feasible spanning tree are non-negative
• Typically, lengthening and replacing the tree edge w/ negative cut value helps
Step 1. Ranking (cont.)

1. Construct a feasible spanning tree
2. While there exists a tree edge with negative cut, exchange it with non tree edge
3. Normalize (set least rank to zero)
4. Balance
Step 1. Ranking (cont.)
Network Simplex Algorithm:

Step 1. Ranking (cont.)
Example process ofNetwork Simplex
Algorithm

Implementation issues:
• Reduce the cost of cut value calculation
• by using local edge info.
• by indexing the tree according to postorder traversal
• Choose the best negative edge to replace
• by searching cyclically
Step 1. Ranking (cont.)

• Introduction
• History
• DOT algorithm1. Ranking
2. Ordering
3. Positioning
4. Drawing edges & labels
• Implementation (Graphviz)
• Conclusion
Outline

• Preprocessing: replace the edges between nodes more than one rank apart with chains of virtual nodes
Step 2. Ordering
0
1 3
0
3
1
(later)0
3
1

• Order vertices in the way that minimizes edge crossings (NP-complete)
• Edge crossing minimization heuristic:
• suggested by Warfield in 1977
• throughout iterations, improve ordering by iteratively assigning weight relative to previous rank and re-ordering based on weight
Step 2. Ordering(cont.)
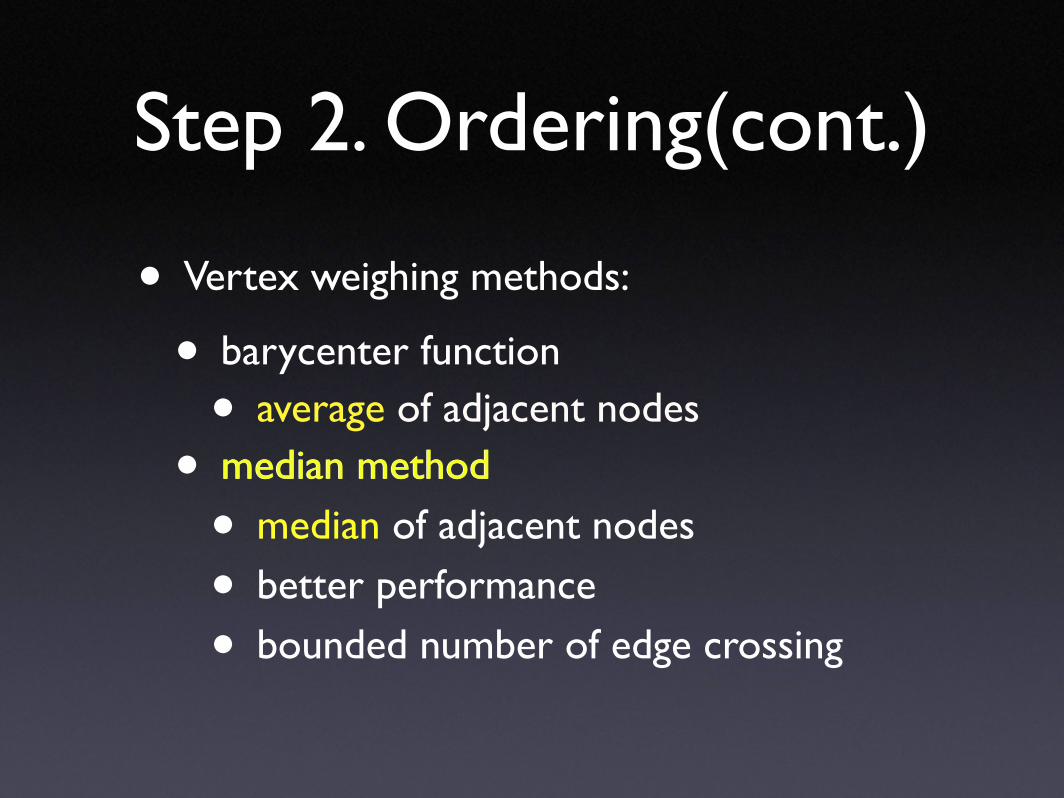
• Vertex weighing methods:
• barycenter function
• average of adjacent nodes
• median method
• median of adjacent nodes
• better performance
• bounded number of edge crossing
Step 2. Ordering(cont.)
median method

• Improved median by interpolation biased the closely packed vertices (at even nodes)
Step 2. Ordering(cont.)
1 2 3 4 6 8
average
original median:choose among two
improved: 3x(8-4)+4x(3-1)
(8-4)+(3-1)= 3.3

• Ordering Algorithm
1. Initial ordering
2. While iteration:
a. re-order the nodes based on improved median weighing method
b. perform local transposition
c. keep the best result
Step 2. Ordering(cont.)

• Introduction
• History
• DOT algorithm1. Ranking
2. Ordering
3. Positioning
4. Drawing edges & labels
• Implementation (Graphviz)
• Conclusion
Outline
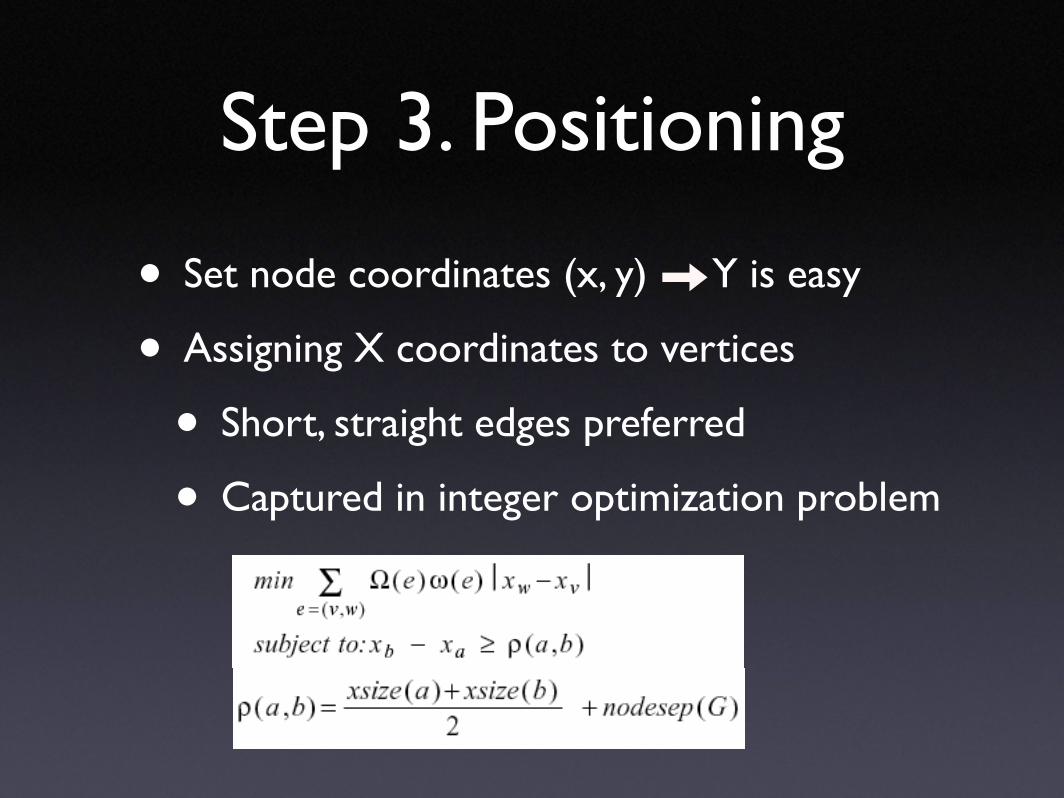
• Set node coordinates (x, y) Y is easy
• Assigning X coordinates to vertices
• Short, straight edges preferred
• Captured in integer optimization problem
Step 3. Positioning
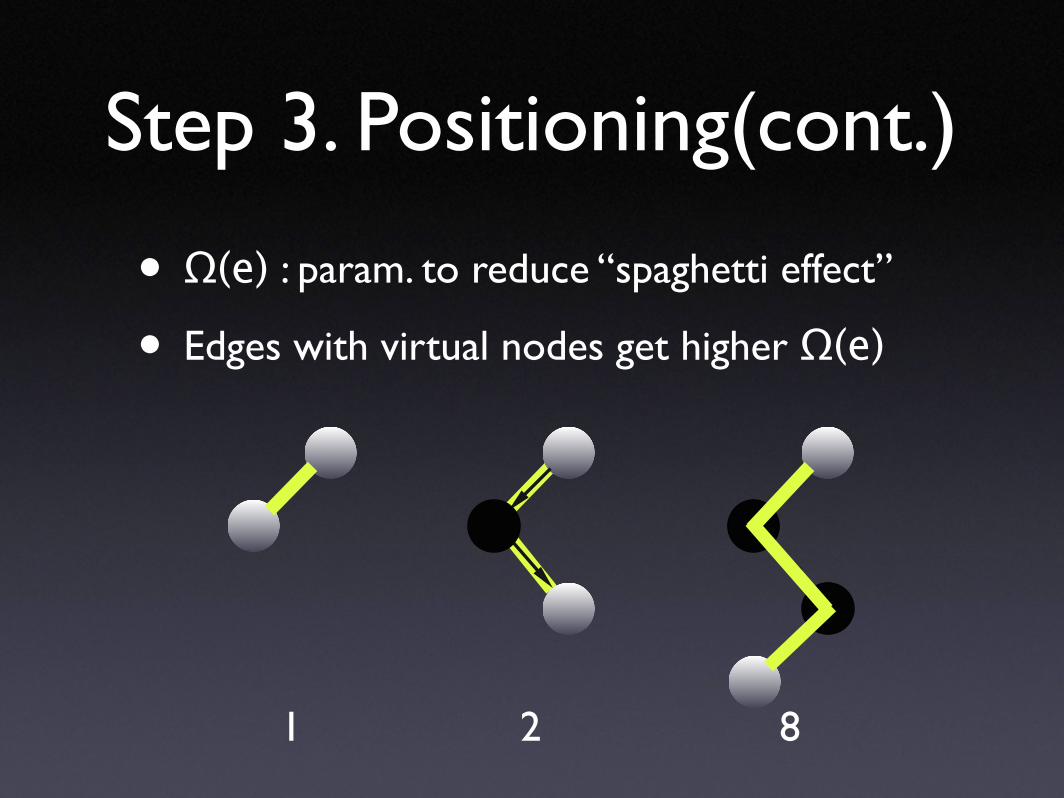
• Ω(e) : param. to reduce “spaghetti effect”
• Edges with virtual nodes get higher Ω(e)
Step 3. Positioning(cont.)
1 2 8

• Heuristic Approach
• In each iter., a collection of heuristics applied
• make good layout quickly
• complicated to program
• results are sometimes noticeably imperfect
• not flexible (changes might result heuristics interfering with each other)
Step 3. Positioning(cont.)

• Optimal node placement
• G G’ (auxiliary graph)
Apply Network Simplex Algorithm to G’
• repeatedly exchange negative-cut tree edge with non-tree edge
• use x value instead of rank.
Step 3. Positioning(cont.)

• Constructing Auxiliary graph G’
••••••• Encodes cost of original edges including Ω(e) • Separates nodes in the same rank
• Enables specification of node ports
• Requires optimized implementation due to increased nodes and edges
Step 3. Positioning(cont.)
G G’
• Introduction
• History
• DOT algorithm1. Ranking
2. Ordering
3. Positioning
4. Drawing edges & labels
• Implementation (Graphviz)
• Conclusion
Outline

• Without overlapping other nodes & edges, draw the smoothest curve between two points
• Use splines rather than line segments
• Two parts:
1. Define region for edge layout
2. Compute the best spline within the region
Step 4. Drawing edges

Step 4. Drawing edges(cont.)
inter-rankboxes
head & tail port boxes
virtual node boxes w/
extra space

• Setting the size of a box:
• ignore horizontal virtual nodes connecting to edges within two ranks
• Long vertical section:
• current region terminates and draw vertical line segment
• Common termination point:
• subdivide the inter-rank space
Step 4. Drawing edges(cont.)
1. Finding the Region

Step 4. Drawing edges(cont.)
2. Computing Splines
i. get L[ ]
iii. compute s[ ]
iv. compute BB[ ]
ii. compute p[ ]
s
o. start with B[ ]

• edge labels on inter-rank represented as virtual nodes
• double the ranks when virtual nodes are created twice as expensive
Step 4. Drawing edges(cont.)
Edge Labels

• Introduction
• History
• DOT algorithm1. Ranking
2. Ordering
3. Positioning
4. Drawing edges & labels
• Implementation (Graphviz)
• Conclusion
Outline

• An open source program
• Available @ ATT homepage (http://www.research.att.com)
• Includes:
• Algoritms: dot, neato, twopi
• Programs: dot, dotty(tool-kit), grappa
Graphviz Package

Dotty: editing tool
a. Loading the Graph file
b. Inserting nodes and edgesc. Changing attributes
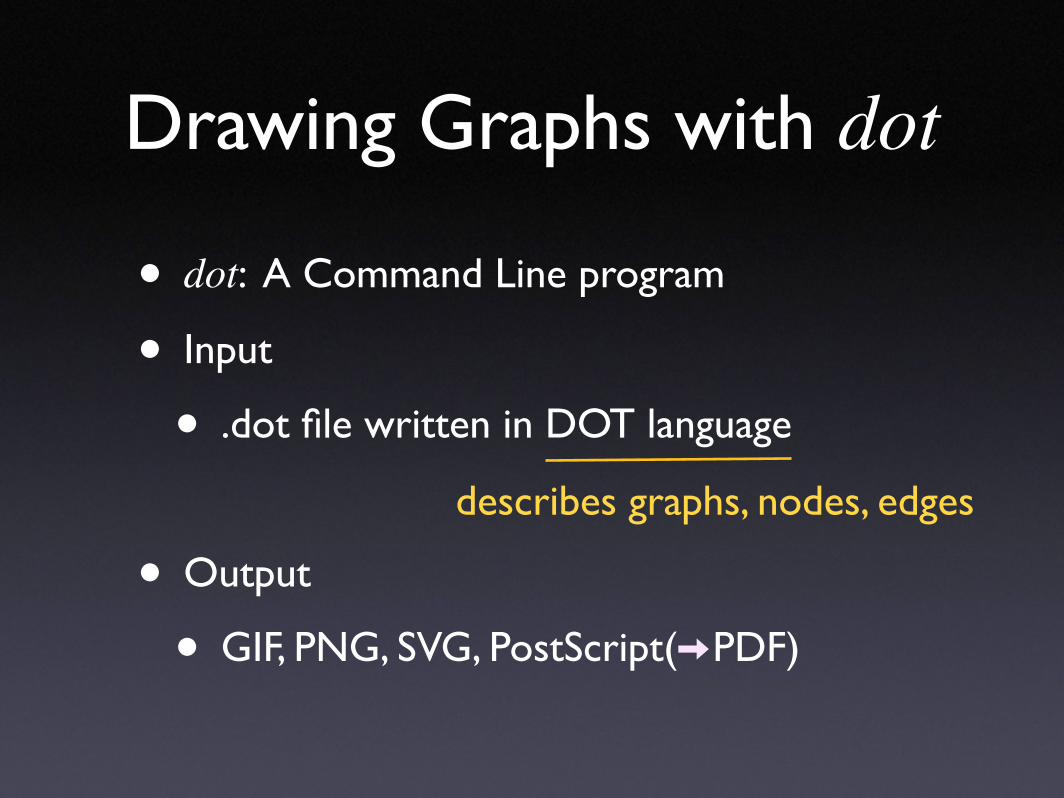
• dot: A Command Line program
• Input
• .dot file written in DOT language
• Output
• GIF, PNG, SVG, PostScript( PDF)
Drawing Graphs with dot
describes graphs, nodes, edges

1. digraph shells{
2. size="4,5";
3. node [fontsize=10, shape=box, color=royalblue];
4. 1 -> 2 -> 3;
5. 1 [label="TOP"];
6. node [fontsize=10, shape=circle, color=orange];
7. 1 -> 4 -> 5;
8. {rank=same; 2 4;}
9. {rank=same; 3 5;}
10. }
Drawing Graphs with dot
% dot -Tjpg -o output.jpg ex.dot
ex.dot output.jpg

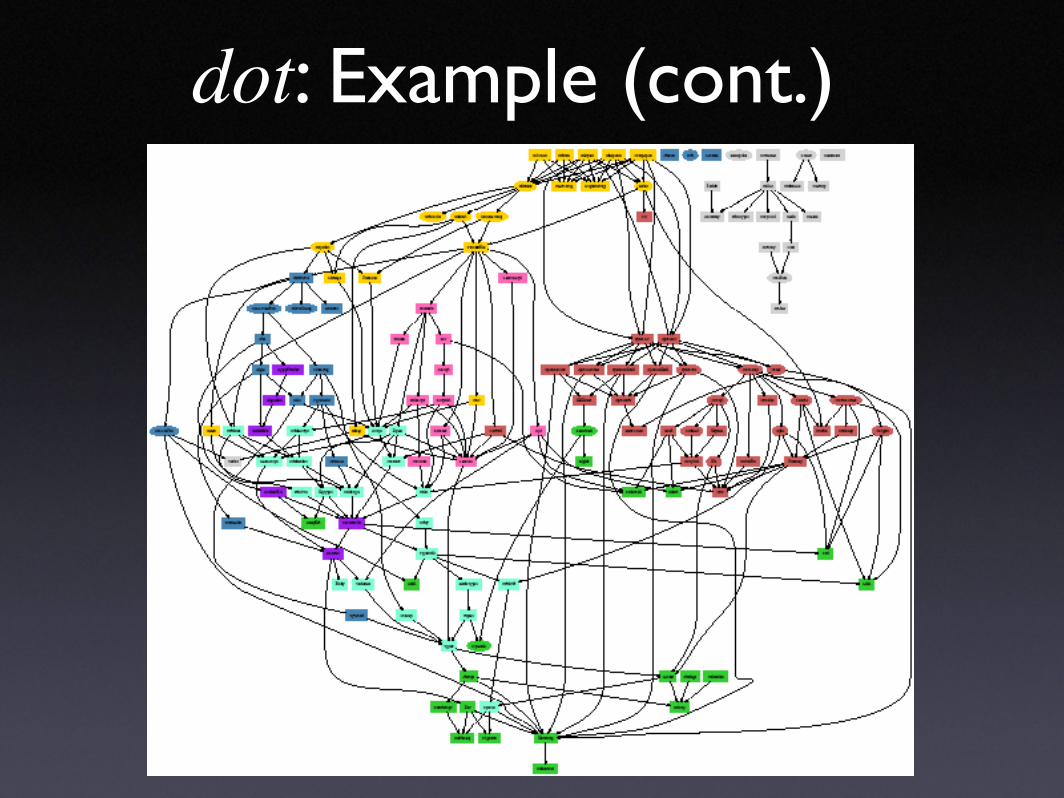
dot: Examples
Simple graph Fancy graph

dot: Examples (cont.)
Polygonal Node Shapes

dot: Examples (cont.)
Hash Table
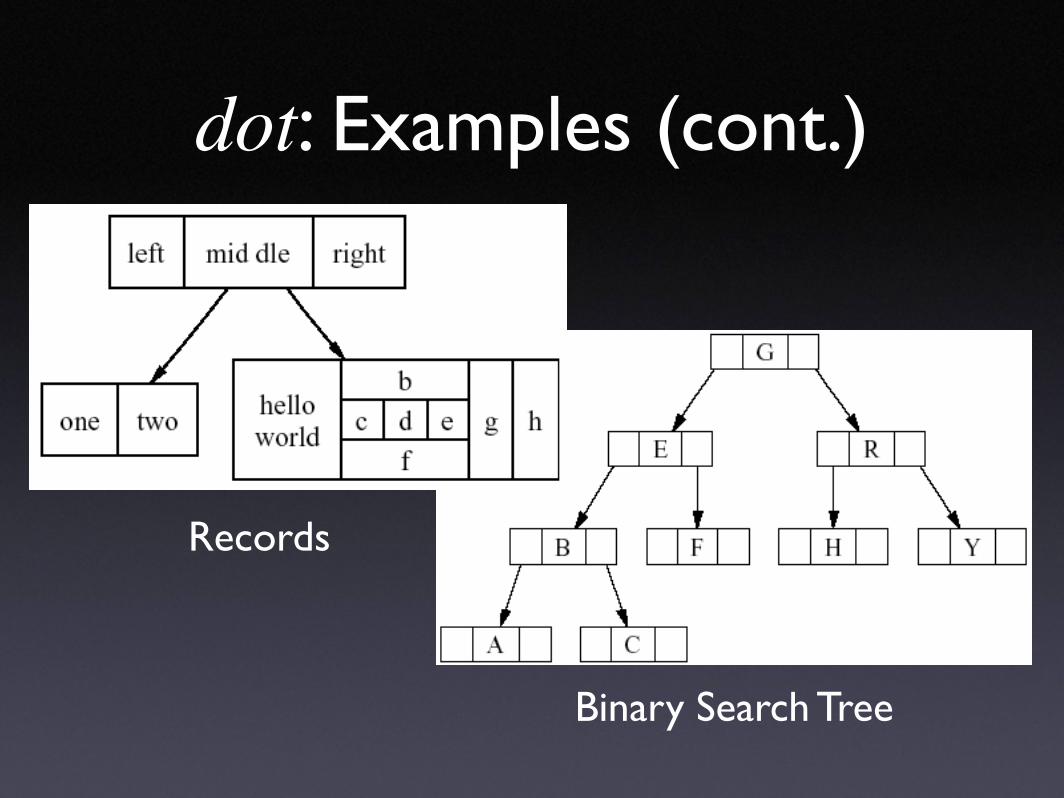
dot: Examples (cont.)
Records
Binary Search Tree

dot: Examples (cont.)
Process Diagram with clusters

dot: My examples

dot: My examples(cont.)
100 nodes1.30 sec. user time
on a 700MHz PowerPC

• User time measured on PowerPC700
• Larger graphs representable
• Graph starts to look blurry at 200 nodes
Trying Large Number of Nodes
100 200 300 4000
3.8
7.5
11.3
15.0
execution time(sec)
• Introduction
• History
• DOT algorithm1. Ranking
2. Ordering
3. Positioning
4. Drawing edges & labels
• Implementation (Graphviz)
• Conclusion
Outline

• dot’s major contributions are:
• application of network simplex for ranking and positioning
• improved heuristic (median interpolation & local transposition) for reducing edge crossing
• a method for making edge splines
• dot is...
• straightforward to program (applied in many applications by now)
• run fast, giving neat layout
Summary

• DAG A Program that Draws Directed Graphs (1989): 50
• Application of Graph Visualization (1994): 26
• Drawing graphs with dot (2002): 39
• Drawing graphs with Graphviz(2003)
• R. Tamissa. Graph Drawing(1997)
• S. Haines, R. Kennaway, R. Sleep. Visualisation techniques for Event Stream Analysis
• L. Wong. A Protein Interaction Extraction System(2000)
References

Drawing Graphs
dot: Example (cont.)

Dotty

Node ports