a technique to measure fuel oil viscosity in a fuel power
TRANSCRIPT
ISA Transactions 60 (2016) 303–311
Contents lists available at ScienceDirect
ISA Transactions
http://d0019-05
n CorrE-m
pibar@i
journal homepage: www.elsevier.com/locate/isatrans
A technique to measure fuel oil viscosity in a fuel power plant
Miguel Angel Delgadillo, Pablo H. Ibargüengoytia n, Uriel A. GarcíaInstituto de Investigaciones Eléctricas, Av. Reforma 113, Cuernavaca, Morelos 62490, Mexico
a r t i c l e i n f o
Article history:Received 2 March 2015Received in revised form6 October 2015Accepted 2 November 2015Available online 30 November 2015This paper was recommended for publica-tion by Dr. Brent Young
Keywords:Fuel oil viscosityCombustionEnergy balancePower plants
x.doi.org/10.1016/j.isatra.2015.11.00178/& 2015 ISA. Published by Elsevier Ltd. All
esponding author.ail addresses: [email protected] (M.Aie.org.mx (P.H. Ibargüengoytia), uriel.garcia@ii
a b s t r a c t
The viscosity measurement and control of fuel oil in power plants is very important for a proper com-bustion. However, the conventional viscometers are only reliable for a short period of time. This paperproposes an on-line analytic viscosity evaluation based on energy balance applied to a piece of tubeentering the fuel oil main heater and a new control strategy for temperature control. This analyticevaluation utilizes a set of temperature versus viscosity graphs were defined during years of analysis offuel oil in Mexican power plants. Also the temperature set-point for the fuel oil main heater output isobtained by interpolating in the corresponding graph. Validation tests of the proposed analytic equationswere carried out in the Tuxpan power plant in Veracruz, Mexico.
& 2015 ISA. Published by Elsevier Ltd. All rights reserved.
1. Introduction
There are several ways to produce electric power. However, theuse of fossil fuel is still the most popular in the world. For example,in Mexico 51% of the generation of electric power is based on fossilfuel (including gas and combustoleum) [3]. Specifically, 30.2% ofthe generation is steam based using fuel oil. Other installationsalso generate power using fuel oil, like Pemex (Mexican PetroleumCompany) refineries, platforms, and other petrochemicalindustries.
In a traditional thermoelectric power plant, fuel oil is burned atthe steam generators or boilers to produce steam that transfers itscalorific energy to the rotation of the steam turbine and therefore,to the electric power generator. Fig. 1 shows the basic process thatfollows the fuel oil from the daily storage tank to the boiler. Thefuel oil is heated by the suction and the main heaters in order toreach the required temperature at approximately 120–140 °C, tobe properly burned. Once heated, the fuel oil is atomized bymixing the fuel oil with steam and it is burned combined with airin the combustion chamber. The circles in Fig. 1 correspond tospecial instrumentation or local control loops. For example, thereare two pairs of temperature transmitter (TT) and temperaturecontroller (TC). The red TT and TC circles of Fig. 1 represent theconventional temperature controller of the main heater that
rights reserved.
. Delgadillo),e.org.mx (U.A. García).
provides the fuel oil with the appropriate temperature for a cor-rect atomization. This produces the proper combustion.
The correct atomization depends on the size of the dropletproduced. One of the main characteristics of the fuel oil for gooddroplet spreading inside the furnace is the fuel oil viscosity.Viscosity is inversely related to the fuel oil temperature, so that ingeneral, cold liquids flow slower than hot liquids. Then, when theburners in a boiler receive a fuel oil with high viscosity, atomiza-tion results in larger drops. In contrast, if the fuel arrives at theburners with low viscosity, the atomization results in smallerdroplets. With larger oil droplets, an incomplete combustionreaction takes place, and so part of the fuel is expelled to theatmosphere as contamination. Besides, the combustion efficiencyis reduced. If the droplet is smaller than the optimal size, then sidereactions may take place and the combustion heat of the fuel maybe degraded. This also produces a reduction of the combustionefficiency.
Traditionally the fuel oil viscosity control is done indirectlythrough the outlet fuel oil temperature of the main heater, as thecontrolled variable in a temperature control loop. This paperproposes an alternative control strategy in which the temperaturecontrol of the main heater is done by changing the steam transferarea, moving the level of condensate water inside of the tubes bymeans of the control drain valve. Fig. 2 shows a schematic diagramof the main heater construction.
This paper is organized as follows. The next section describesan alternative control strategy using the analytic viscosity eva-luation. Section 3 reviews the related work that has been done toestimate the viscosity in power plants. Section 4 describes the

Fig. 1. Fuel heating in a conventional power plant. (For interpretation of the references to color in this figure, the reader is referred to the web version of this paper.)
Fig. 2. Schematic diagram of the main heater.
M.A. Delgadillo et al. / ISA Transactions 60 (2016) 303–311304
analytical development proposed in this paper for the estimationof viscosity. Next, Section 5 describes the representation of thecharacteristics of viscosity versus temperature of the analysismade of hundreds of fuel oil types. These curves allow a mappingbetween the evaluated viscosity and the optimal fuel oil tem-perature that will produce the optimal combustion. Section 6describes the experiments conducted in the laboratory and in theplant, with a discussion of the results obtained. Lastly, Section 7concludes the paper and discusses future research.
2. Alternative control strategy
The proposed alternative includes the construction of an ana-lytic viscosity evaluation and a temperature set-point evaluationfor the control temperature of the main heater. This is shown inFig. 3. The red squares represent the modules proposed in thispaper: first, the viscosity estimation and the temperature evalua-tion that will be used in the temperature control of the mainheater. Fig. 4 is a photograph of the studied heater in Tuxpan,Mexico.
The fuel temperature for a good droplet spreading is approxi-mately 120–140 °C. Usually, viscometers must carry out the mea-surement around this temperature range. The viscosity setpoint
value normally is fixed by the burner's manufacturer. However, thefuel oil viscosity is usually controlled at a temperature setpointwhich depends on the fuel oil composition. Frequently, the fuel oilviscosity is found by a laboratory analysis that is made when a newoil shipment arrives. Laboratory analyses of viscosity are per-formed at standard temperatures (50 °C and 82.2 °C).
Baert [1] demonstrated a relation between droplet size,asphaltene fraction, and coke residue formation. Kobayasi [9]studied the burning of heavy fuel oil with frothing and splashing ofa burned viscous residue that produces secondary splashes thatsolidify into carbon particles, producing a change in the droplets'diameters associated with the combustion's being so complex.García-Rodríguez [7] pointed out that a fuel droplet in a fossil fuelboiler can be pyrolysed (molecular dissociation due to heat)because some regions of the boiler may lack oxygen. Also, partialburning or partial decomposition produces a variety of hydro-carbon compounds as well as oxides of sulfur, oxides of nitrogen,and carbon monoxide that are harmful for the environmentalatmosphere and health.
The project described in this paper is based on previous projectcarried out at the same institution. The fuel viscosities of morethan 400 fuel oil samples from historical data of different oilcompositions were obtained from plant and laboratory records,and arranged so that all available oil compositions were

Fig. 3. Fuel oil viscosity and temperature setpoint evaluation for an oil temperature control in the main heater of a power plant. (For interpretation of the references to colorin this figure, the reader is referred to the web version of this paper.)
Fig. 4. The main heater of unit 2 of the Tuxpan Power Plant in Mexico.
M.A. Delgadillo et al. / ISA Transactions 60 (2016) 303–311 305
represented in a set of graphs as seen in Fig. 6. Then the actual oilviscosity–temperature values were interpolated within this set ofgraphs, as seen in Fig. 7. Once the corresponding curve that mat-ches the values of the viscosity–temperature is found, the tem-perature setpoint is obtained using this curve by introducing theviscosity recommended by the burner's manufacturer.
3. Related work on viscosity measurement
Commercial viscosity meters for fuel oils are expensive andthey need periodic maintenance due to the high viscosity of thefuel oils. The instrument has to be calibrated and cleaned peri-odically. Due to their mechanical complexity, commercial visc-ometers are inherently subject to failure; therefore measuring theoil temperature is normally used to determine the fuel oil visc-osity. In [6] several control strategies to control the fuel oil
viscosity are developed that take into account the measurement ofthe fuel oil viscosity and the oil temperature.
Rothrock [13] explains the basic oil measurements for a liquidhydrocarbon where direct methods require temperature mea-surement and constant fuel oil flow through the viscometer.Indirect methods do not use a temperature control system, in thiscase a temperature–viscosity (kinematic viscosity) is used toevaluate the oil viscosity and referred to the reference tempera-ture. However the constants of the equation are unique to thatsample of oil. A multi-curve method, with four curves, is alsodemonstrated in the same reference. In the same paper, there isalso exhibited a dual viscometer system with a heat exchanger inorder to reduce measurement errors. However, all these methodsare based on commercial viscometers.
There are a variety of devices to measure oil viscosity. Daviset al. [5] present a survey, including the five most common types.However, several of them have a significant time lag in
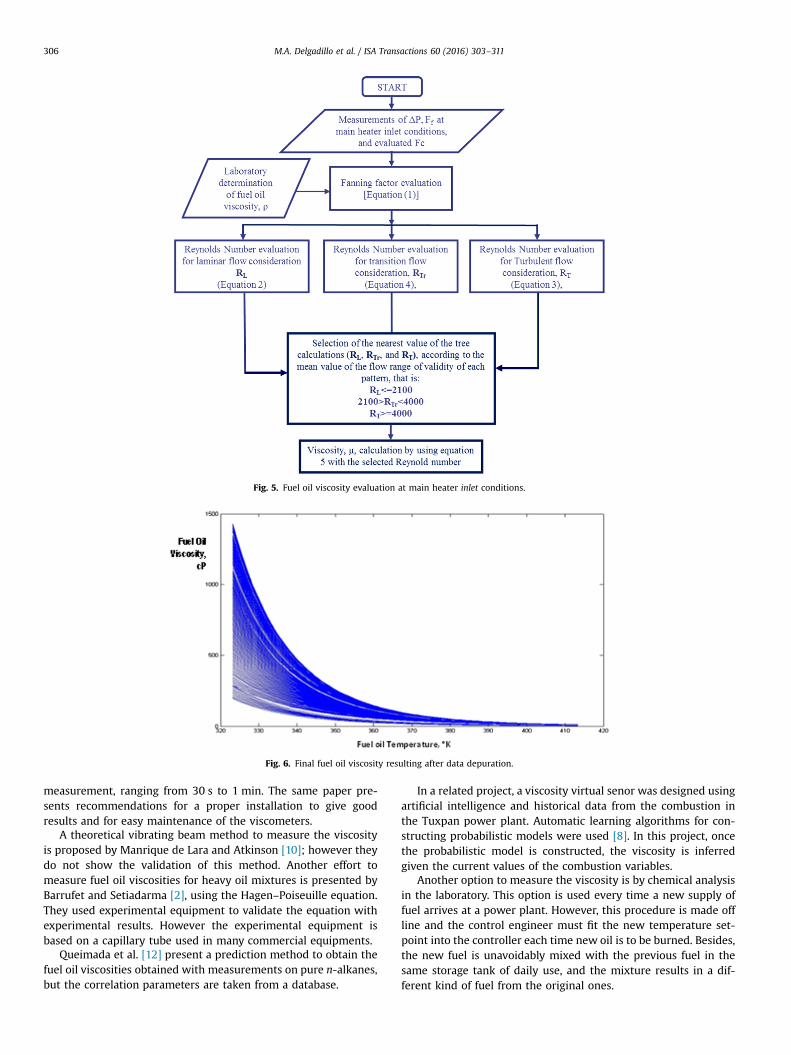
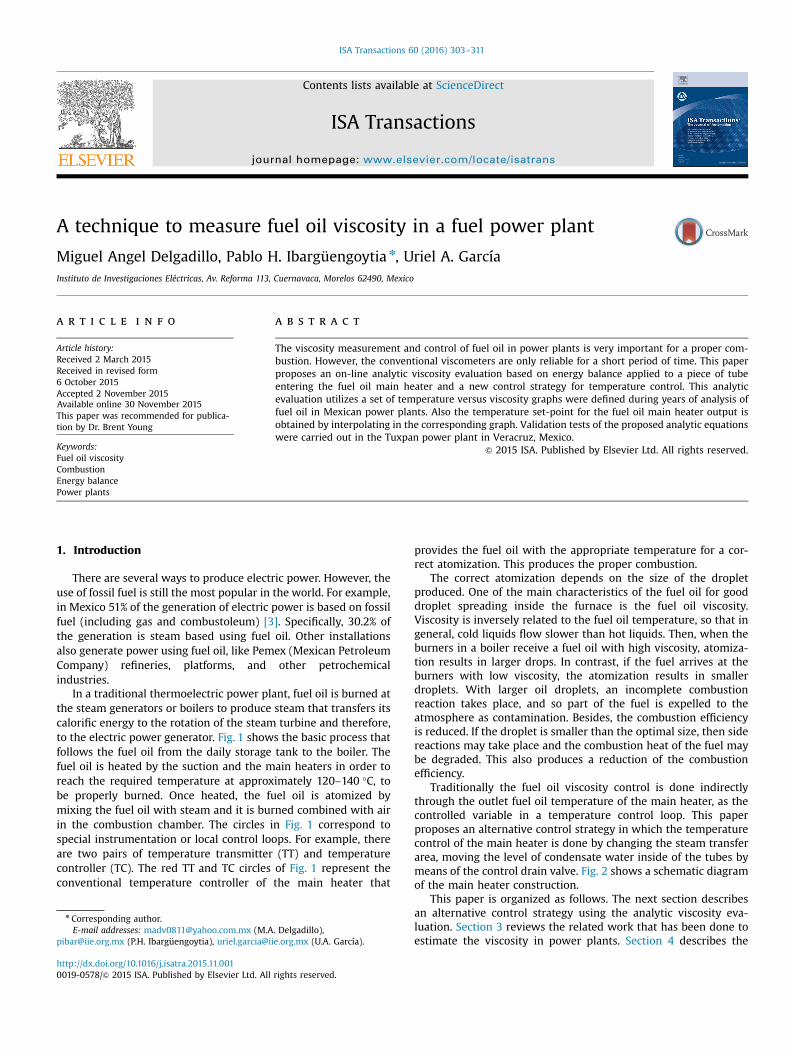
Fig. 5. Fuel oil viscosity evaluation at main heater inlet conditions.
Fig. 6. Final fuel oil viscosity resulting after data depuration.
M.A. Delgadillo et al. / ISA Transactions 60 (2016) 303–311306
measurement, ranging from 30 s to 1 min. The same paper pre-sents recommendations for a proper installation to give goodresults and for easy maintenance of the viscometers.
A theoretical vibrating beam method to measure the viscosityis proposed by Manrique de Lara and Atkinson [10]; however theydo not show the validation of this method. Another effort tomeasure fuel oil viscosities for heavy oil mixtures is presented byBarrufet and Setiadarma [2], using the Hagen–Poiseuille equation.They used experimental equipment to validate the equation withexperimental results. However the experimental equipment isbased on a capillary tube used in many commercial equipments.
Queimada et al. [12] present a prediction method to obtain thefuel oil viscosities obtained with measurements on pure n-alkanes,but the correlation parameters are taken from a database.
In a related project, a viscosity virtual senor was designed usingartificial intelligence and historical data from the combustion inthe Tuxpan power plant. Automatic learning algorithms for con-structing probabilistic models were used [8]. In this project, oncethe probabilistic model is constructed, the viscosity is inferredgiven the current values of the combustion variables.
Another option to measure the viscosity is by chemical analysisin the laboratory. This option is used every time a new supply offuel arrives at a power plant. However, this procedure is made offline and the control engineer must fit the new temperature set-point into the controller each time new oil is to be burned. Besides,the new fuel is unavoidably mixed with the previous fuel in thesame storage tank of daily use, and the mixture results in a dif-ferent kind of fuel from the original ones.
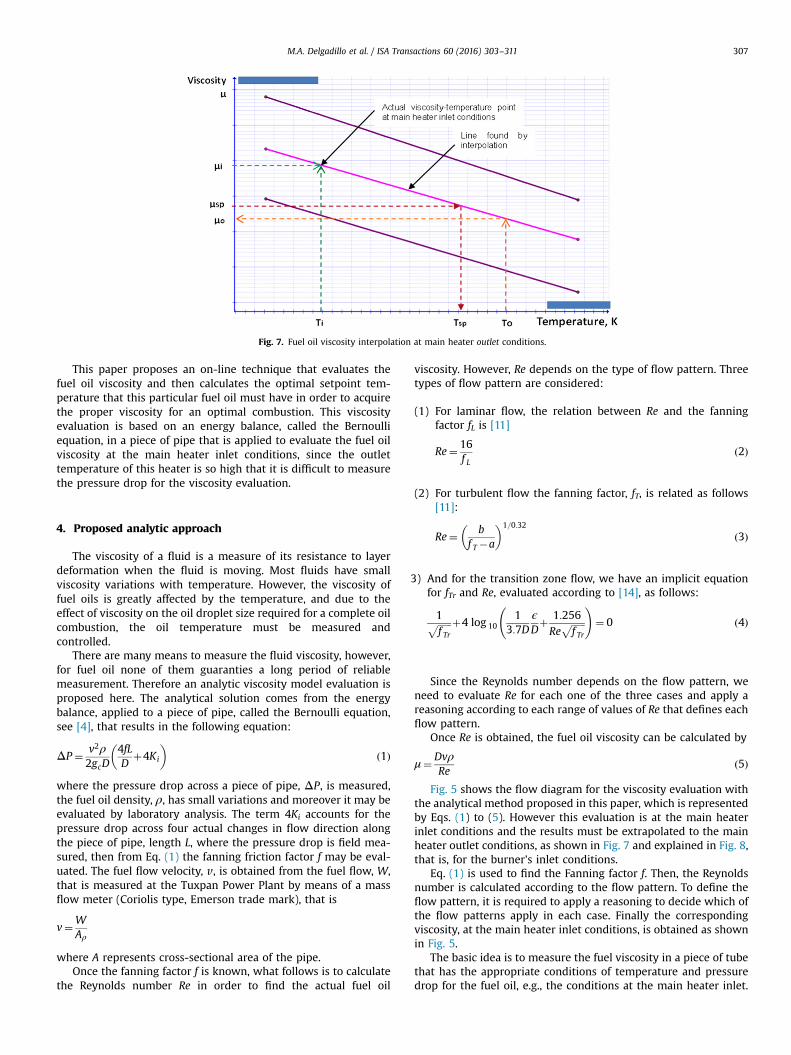
Fig. 7. Fuel oil viscosity interpolation at main heater outlet conditions.
M.A. Delgadillo et al. / ISA Transactions 60 (2016) 303–311 307
This paper proposes an on-line technique that evaluates thefuel oil viscosity and then calculates the optimal setpoint tem-perature that this particular fuel oil must have in order to acquirethe proper viscosity for an optimal combustion. This viscosityevaluation is based on an energy balance, called the Bernoulliequation, in a piece of pipe that is applied to evaluate the fuel oilviscosity at the main heater inlet conditions, since the outlettemperature of this heater is so high that it is difficult to measurethe pressure drop for the viscosity evaluation.
3
4. Proposed analytic approach
The viscosity of a fluid is a measure of its resistance to layerdeformation when the fluid is moving. Most fluids have smallviscosity variations with temperature. However, the viscosity offuel oils is greatly affected by the temperature, and due to theeffect of viscosity on the oil droplet size required for a complete oilcombustion, the oil temperature must be measured andcontrolled.
There are many means to measure the fluid viscosity, however,for fuel oil none of them guaranties a long period of reliablemeasurement. Therefore an analytic viscosity model evaluation isproposed here. The analytical solution comes from the energybalance, applied to a piece of pipe, called the Bernoulli equation,see [4], that results in the following equation:
ΔP ¼ v2ρ2gcD
4fLD
þ4Ki
� �ð1Þ
where the pressure drop across a piece of pipe, ΔP, is measured,the fuel oil density, ρ, has small variations and moreover it may beevaluated by laboratory analysis. The term 4Ki accounts for thepressure drop across four actual changes in flow direction alongthe piece of pipe, length L, where the pressure drop is field mea-sured, then from Eq. (1) the fanning friction factor f may be eval-uated. The fuel flow velocity, v, is obtained from the fuel flow, W,that is measured at the Tuxpan Power Plant by means of a massflow meter (Coriolis type, Emerson trade mark), that is
v¼WAρ
where A represents cross-sectional area of the pipe.Once the fanning factor f is known, what follows is to calculate
the Reynolds number Re in order to find the actual fuel oil
viscosity. However, Re depends on the type of flow pattern. Threetypes of flow pattern are considered:
(1) For laminar flow, the relation between Re and the fanningfactor fL is [11]
Re¼ 16f L
ð2Þ
(2) For turbulent flow the fanning factor, fT, is related as follows[11]:
Re¼ bf T �a
� �1=0:32
ð3Þ
) And for the transition zone flow, we have an implicit equationfor fTr and Re, evaluated according to [14], as follows:
1ffiffiffiffiffiffif Tr
p þ4 log 101
3:7DϵDþ 1:256Re
ffiffiffiffiffiffif Tr
p !
¼ 0 ð4Þ
Since the Reynolds number depends on the flow pattern, weneed to evaluate Re for each one of the three cases and apply areasoning according to each range of values of Re that defines eachflow pattern.
Once Re is obtained, the fuel oil viscosity can be calculated by
μ¼DvρRe
ð5Þ
Fig. 5 shows the flow diagram for the viscosity evaluation withthe analytical method proposed in this paper, which is representedby Eqs. (1) to (5). However this evaluation is at the main heaterinlet conditions and the results must be extrapolated to the mainheater outlet conditions, as shown in Fig. 7 and explained in Fig. 8,that is, for the burner's inlet conditions.
Eq. (1) is used to find the Fanning factor f. Then, the Reynoldsnumber is calculated according to the flow pattern. To define theflow pattern, it is required to apply a reasoning to decide which ofthe flow patterns apply in each case. Finally the correspondingviscosity, at the main heater inlet conditions, is obtained as shownin Fig. 5.
The basic idea is to measure the fuel viscosity in a piece of tubethat has the appropriate conditions of temperature and pressuredrop for the fuel oil, e.g., the conditions at the main heater inlet.

Fig. 8. Block diagram of temperature setpoint and actual fuel oil viscosity evaluation.
M.A. Delgadillo et al. / ISA Transactions 60 (2016) 303–311308
Since the fuel temperature at the main heater outlet is high (about120–140 °C), a very long pipe is needed for a reasonable pressuredrop measurement. Therefore, for the evaluation of the fuel oilviscosity, the main heater inlet was selected for the location of themeasurements of the pressure drop and the temperature. Fig. 5shows the flow chart used to calculate the actual fuel oil viscosityunder the main heater inlet conditions. However, the purpose is toevaluate the fuel oil viscosity at the input of the burner, and so weuse a set of fuel oil graphs to extend the main heater inlet viscosityto the burner's outlet conditions, as shown in Fig. 7.
5. Viscosity–temperature curves from laboratory data
For the fuel oil viscosity graphs, hundreds of fuel oil samplesused by the Federal Commission of Electricity (the CFE accordingto the initials in Spanish) in all the power plants in Mexico wereanalyzed at the laboratory . Other data were taken from fuel oilanalysis records of the Electrical Research Institute laboratory ofMexico. A total of 458 data from sample analyses were employedto draw the reference graphs. Each graph was drawn from twotemperature–viscosity points obtained from laboratory tests. Theconstants x and B in Eqs. (6) and (7) were obtained by solvingsimultaneously the two equations resulting from the substitutionof the temperature–viscosity points into the Guzman–Andradeequation form.
The samples were originated from the Pajaritos and CiudadMadero Tamaulipas refineries as well as samples of fuel oil fromHouston, Texas. Fig. 6 shows the final depuration graphs, leavingonly 138 curves remaining after the depuration, where crossinglines between curves were avoided by joining them into a unique
line. Also, it is considered that the line slope (on semi-logarithmicpaper) is similar for closer lines. This assumption facilitated theinterpolation. All the graphs of Fig. 6 were extended to 413 °K(140 °C) by using the Guzman–Andrade equation, [14]:
μ¼ xeB=T ð6Þwhere B is a constant depending the fuel oil type. It follows thenthat
ln μ¼ xþ BT1
ð7Þ
5.1. Interpolation and extrapolation procedure
Once the fuel oil viscosity, at the inlet conditions of the mainheater, is evaluated, and since the corresponding inlet temperatureis known from the measured temperature, the temperature–visc-osity point is located in the set of graphs of Fig. 6 and by means ofan interpolating algorithm the corresponding operating curve isfound, as is shown in a semi-logarithmic scale graph like in Fig. 7.This operating curve for the actual fuel is then used to find theactual fuel oil viscosity at the main heater outlet temperature.
5.2. Temperature control setpoint
Since the common practice is to control the fuel oil viscosity bycontrolling its temperature at the main heater outlet, the actualoperating curve is also used to find the temperature correspondingto the ideal reference viscosity given by the burner's builder forthe steam generator, that is, the setpoint temperature for the main

Table 1Fuel oil viscosity μ validation by using Eq. (8) to evaluate pressure drop.
ΔP (DPT501)(in H2O)
Fuel oilflow (m3/h)
Reynoldsnumber
Fuel oil heaterinput temp.(°C)
Fuel oil heateroutput temp.(°C)
Adjust. fac-tor Fc
Evaluated inputviscosity
Extended μ hea-ter output temp.
Lab. μ at50 °C (Cp)
Lab μ extend.heater outlettemp. (Cp)
Error %
3.50389 30.75 67.245219 48.285 110.888 38.0646 351.540 29.00 321.26 22.77 �15.33.23329 31.76 59.236407 47.28 132.164 32.6026 370.234 12.404 321.26 10.89 �3.79.52682 40.97 70.40732 42.885 117.879 147.264 468.048 5.9041998 321.26 17.71 29.016.5647 51.15 84.835226 47.55 108.697 204.269 641.793 31.443738 555.39 30.5 �2.316.5631 52.61 79.419948 46.08 122.048 179.862 700.797 17.720529 555.39 17.78 0.114.4350 57.16 146.48526 56.655 110.886 230.889 379.766 31.082729 555.39 27.85 �7.916.5647 91.8 152.63407 46.575 103.795 274.89 384.932 36.878691 321.26 29.67 �17.716.5631 98.19 151.54365 46.5299 114.018 275.876 385.074 24.203742 321.26 20.32 �9.516.5663 99.74 152.21625 46.4999 121.823 274.751 385.743 17.750982 321.26 15.43 �5.7
Average factor Fc in Eq. (8)¼184.2743766
Fig. 9. Comparison of results of Eq. (8) versus laboratory results indicated in Table 1.
M.A. Delgadillo et al. / ISA Transactions 60 (2016) 303–311 309
heater control loop. Fig. 7 shows the finding of the temperaturesetpoint Tsp from the viscosity setpoint given by the burner'smanufacturer.
6. Validation of the analytic viscosity evaluation
The method of measuring the fuel oil viscosity here proposed,as is graphically explained in Figs. 5 and 8, was validated by ver-ifying the viscosity of the plant runs against laboratory viscositymeasurements of the actual fuel oil. Tables 1 and 2 summarize theruns' results.
Fig. 5 shows the flow diagram to calculate the fuel oil viscosityby the analytical method using Eqs. (1)–(5). The method hereproposed to evaluate the fuel oil viscosity is at the main heaterinlet conditions and it must be extrapolated to the main heateroutlet temperature condition by means of the set of graphs ofFig. 6 by using a programmed algorithm.
6.1. Laboratory analysis
A laboratory analysis of the actual fuel oil is carried out atstandard laboratory conditions (at 50 °C and 82.2 °C), then, afterthese values are located in the set of graphs of Fig. 6, they areextended in the corresponding graph to the heater outlet tem-perature in order to obtain the actual oil viscosity. Then bothviscosities, the evaluated one and that obtained by laboratorytests, are compared in order to validate the analytical evaluation.
6.2. Corrective factor Fc
Eq. (1) is used to find the Fanning factor f. Then the Reynoldsnumber is calculated according to the flow pattern. Lastly, the
corresponding viscosity is obtained. In order to fit the analyticalviscosity with that obtained by laboratory means, Eq. (1) is cor-rected with a factor Fc in two forms as follows:
ΔP ¼ 2v2ρgc
fLDþ4Ki
� �þFc ð8Þ
ΔP ¼ 2v2ρgc
fLDþ4Ki
� �Fc ð9Þ
Table 1presents the results of calculations using Eq. (8), sortedin accordance with the flow of the fuel oil. Each calculation gives aFanning factor to give the 0% in the error calculation, however theaverage factor of Fc¼184.2743766 gives the error indicated in thelast column. Fig. 9 presents a graph of these results.
Table 2 shows the results of calculations using Eq. (9), sorted inaccordance with the flow of the fuel oil. Each calculation gives aFanning factor to give the 0% in the error calculation, however theaverage factor of Fc¼2.33582955 gives the error indicated in thelast column. Fig. 10 shows the graph of these results.
In Tables 1 and 2, the error shown in the last column wasevaluated as
Error ¼ μoil�μoil0
Roil� 100 ð10Þ
where μoil is the viscosity measured in the laboratory (tenth col-umn in the tables) and μoil0 is the analytic estimated viscosity(eighth column in the tables), and Roil is the viscosity transmitterrange calibration, i.e., the maximum value of viscometer(52.484993 cp) minus the minimum value (11.754997 cp).
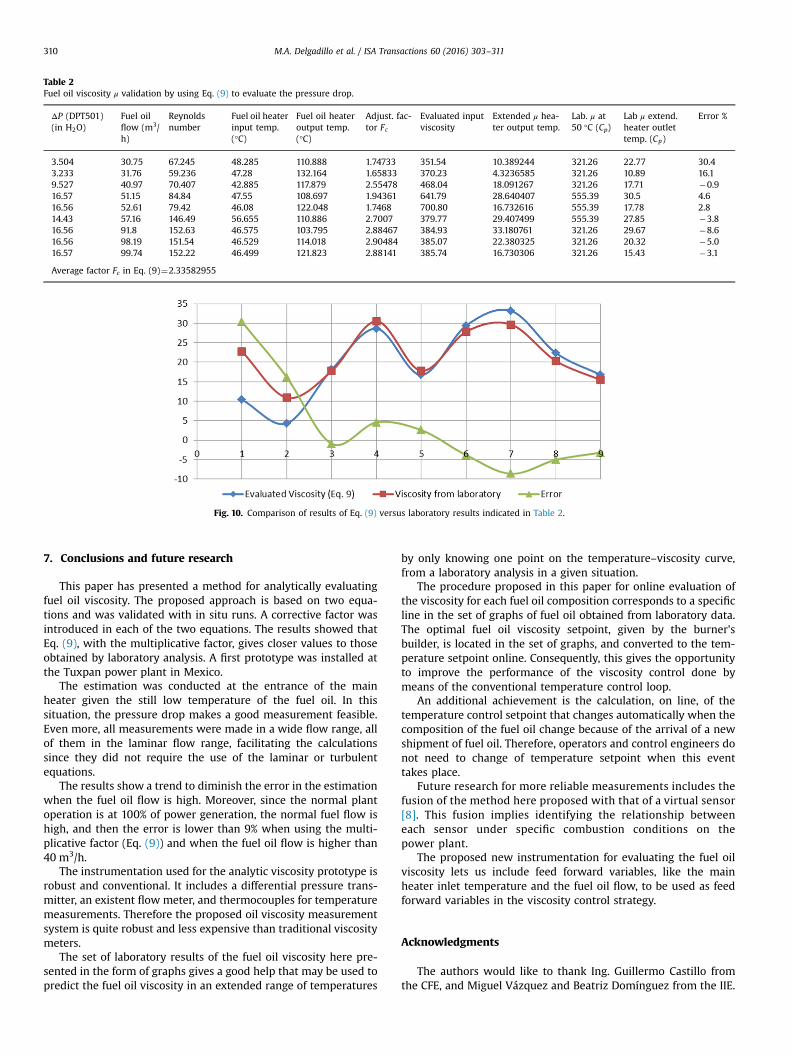
Table 2Fuel oil viscosity μ validation by using Eq. (9) to evaluate the pressure drop.
ΔP (DPT501)(in H2O)
Fuel oilflow (m3/h)
Reynoldsnumber
Fuel oil heaterinput temp.(°C)
Fuel oil heateroutput temp.(°C)
Adjust. fac-tor Fc
Evaluated inputviscosity
Extended μ hea-ter output temp.
Lab. μ at50 °C (Cp)
Lab μ extend.heater outlettemp. (Cp)
Error %
3.504 30.75 67.245 48.285 110.888 1.74733 351.54 10.389244 321.26 22.77 30.43.233 31.76 59.236 47.28 132.164 1.65833 370.23 4.3236585 321.26 10.89 16.19.527 40.97 70.407 42.885 117.879 2.55478 468.04 18.091267 321.26 17.71 �0.916.57 51.15 84.84 47.55 108.697 1.94361 641.79 28.640407 555.39 30.5 4.616.56 52.61 79.42 46.08 122.048 1.7468 700.80 16.732616 555.39 17.78 2.814.43 57.16 146.49 56.655 110.886 2.7007 379.77 29.407499 555.39 27.85 �3.816.56 91.8 152.63 46.575 103.795 2.88467 384.93 33.180761 321.26 29.67 �8.616.56 98.19 151.54 46.529 114.018 2.90484 385.07 22.380325 321.26 20.32 �5.016.57 99.74 152.22 46.499 121.823 2.88141 385.74 16.730306 321.26 15.43 �3.1
Average factor Fc in Eq. (9)¼2.33582955
Fig. 10. Comparison of results of Eq. (9) versus laboratory results indicated in Table 2.
M.A. Delgadillo et al. / ISA Transactions 60 (2016) 303–311310
7. Conclusions and future research
This paper has presented a method for analytically evaluatingfuel oil viscosity. The proposed approach is based on two equa-tions and was validated with in situ runs. A corrective factor wasintroduced in each of the two equations. The results showed thatEq. (9), with the multiplicative factor, gives closer values to thoseobtained by laboratory analysis. A first prototype was installed atthe Tuxpan power plant in Mexico.
The estimation was conducted at the entrance of the mainheater given the still low temperature of the fuel oil. In thissituation, the pressure drop makes a good measurement feasible.Even more, all measurements were made in a wide flow range, allof them in the laminar flow range, facilitating the calculationssince they did not require the use of the laminar or turbulentequations.
The results show a trend to diminish the error in the estimationwhen the fuel oil flow is high. Moreover, since the normal plantoperation is at 100% of power generation, the normal fuel flow ishigh, and then the error is lower than 9% when using the multi-plicative factor (Eq. (9)) and when the fuel oil flow is higher than40 m3/h.
The instrumentation used for the analytic viscosity prototype isrobust and conventional. It includes a differential pressure trans-mitter, an existent flow meter, and thermocouples for temperaturemeasurements. Therefore the proposed oil viscosity measurementsystem is quite robust and less expensive than traditional viscositymeters.
The set of laboratory results of the fuel oil viscosity here pre-sented in the form of graphs gives a good help that may be used topredict the fuel oil viscosity in an extended range of temperatures
by only knowing one point on the temperature–viscosity curve,from a laboratory analysis in a given situation.
The procedure proposed in this paper for online evaluation ofthe viscosity for each fuel oil composition corresponds to a specificline in the set of graphs of fuel oil obtained from laboratory data.The optimal fuel oil viscosity setpoint, given by the burner'sbuilder, is located in the set of graphs, and converted to the tem-perature setpoint online. Consequently, this gives the opportunityto improve the performance of the viscosity control done bymeans of the conventional temperature control loop.
An additional achievement is the calculation, on line, of thetemperature control setpoint that changes automatically when thecomposition of the fuel oil change because of the arrival of a newshipment of fuel oil. Therefore, operators and control engineers donot need to change of temperature setpoint when this eventtakes place.
Future research for more reliable measurements includes thefusion of the method here proposed with that of a virtual sensor[8]. This fusion implies identifying the relationship betweeneach sensor under specific combustion conditions on thepower plant.
The proposed new instrumentation for evaluating the fuel oilviscosity lets us include feed forward variables, like the mainheater inlet temperature and the fuel oil flow, to be used as feedforward variables in the viscosity control strategy.
Acknowledgments
The authors would like to thank Ing. Guillermo Castillo fromthe CFE, and Miguel Vázquez and Beatriz Domínguez from the IIE.

M.A. Delgadillo et al. / ISA Transactions 60 (2016) 303–311 311
This research work was supported by Grant 89104 from theCONACYT-CFE Sectorial Found, and Project 13665 from the IIE.
References
[1] Baert R. A mathematical model for the heavy fuel droplet vaporization andpyrolysis in a high temperature inert gas. Combust Sci Technol 1993;90:874–7.
[2] Barrufet MA, Setiadarma A. Experimental viscosities of heavy oil mixtures upto 450 k and high pressures using a mercury capillary viscometer. J Pet Sci Eng2003;40(1–2):17–26.
[3] Comisión Federal de Electricidad. Informe anual 2012. Technical report,Secretaría de Energía, México; 2012 [in Spanish].
[4] Crane J. Flow of fluids through valves, fittings, and pipe. Stamford, Connecticut,USA: Crane Co.; 1957.
[5] Davis TP, Good E, Smith CA. Evaluation of process viscometers for fuel oilviscosity measurement and control. In: Instrumentation in the power indus-try, Houston, TX, USA, 1975. p. 1–5.
[6] Davis TP, Smith CA. Control strategies for fuel oil heating. Instrum Technol1977;24:49–54.
[7] García-Rodríguez JF. Asphaltane content effect on the combustion of Mexicanheavy fuel oil droplets [Ph.D. thesis]. Salford, UK: University of Salford; 1997.
[8] Ibargüengoytia PH, Delgadillo MA, García UA, Reyes A. Viscosity virtual sensorto control combustion in fossil fuel power plants. Eng Appl Artif Intell2013;29:2153–63.
[9] Kobayasi K. An experimental study on the combustion of a fuel droplet. In:Fifth international symposium on combustion, Massachusetts, USA, 1954. p.141–8.
[10] Manrique de Lara M, Atkinson C. Theoretical model on the interaction of avibrating beam and the surrounding viscous fluid with applications to densityand viscosity sensors. In: Sensors, 2004. Proceedings of IEEE. London, UK:Department of Mathematics, Imperial College; 2004. p. 828–31.
[11] Perry JH. Chemical engineers' handbook. fourth ed. New York, USA: McGraw-Hill Book Company; 1963.
[12] Queimada A, Rolo L, Caço A, Marrucho I, Stenby E, Coutinho J. Prediction ofviscosities and surface tensions of fuels using a new corresponding statesmodel. Fuel 2006;85:874–7.
[13] Rothrock G. Viscosity and its application in liquid hydrocarbon measurement.In: Proceedings of the annual ISA analysis division symposium, vol. 444, 2003.p. 173–82.
[14] Thomas P. Simulation of industrial processes for control engineers. Oxford,UK: Butterworth Heinemann; 1999.