a theory of perceived risk and attractiveness -...
TRANSCRIPT

ORGANIZATIONAL BEHAVIOR AND HUMAN DECISION PROCESSES 52, 492-523 (1992)
A Theory of Perceived Risk and Attractiveness
ELKE U. WEBER
Center for Decision Research, Graduate School of Business, University of Chicago
CAROLYN J. ANDERSON
University of Illinois at Urbana-Champaign
AND
MICHAEL H. BIRNBAUM
California State University at Fullerton and Irvine Research Unit in Mathematical Behavioral Science
People judged both the attractiveness and risk of lotteries to win or lose money. The lotteries were designed to test whether risk and attractiveness judgments show systematic deviations from the simple sum of probability-by- utility-products analogous to (S)EU theory. Our results led to an alternative combination rule for probability and outcome information, with a relative weight averaging component and a configural (i.e., sign- or rank-dependent) probability weighting component. Ratings of risk and attractiveness were neg- atively correlated, but the two tasks showed systematic differences in the rank order of judgments. Both judgments could be tit by the same configural rela- tive weight averaging model, but with different parameters (especially the sign-dependent probability weighting functions). Risk judgments were more sensitive to the probability of losses and zero outcomes compared to attrac- tiveness judgments, which were more sensitive to the probability of gains. There were individual differences on the extent of this difference in probability weights between risk and attractiveness judgments. 8 1992 Academic press, II-C.
INTRODUCTION There is a long-standing interest in risk as a distinct attribute of decision
alternatives. Decisions among courses of action with probabilistic out-
This work was supported by National Science Foundation Grant SES 86-06750 and a James S. Kemper Foundation Research grant to the first author, by a predoctoral trainee- ship by the Quantitative Methods Program of the Department of Psychology, University of Illinois at Urbana-Champaign (funded by ADAHMA, National Research Service Award MH14257) to the second author, and facilitated by National Science Foundation Grant SES 89-21880 to the third author. We thank Jerry Busemeyer, Linda Hynan, Robin Keller, Rakesh Satin, and Paul Schoemaker for useful comments on an earlier version of the manuscript. Requests for reprints should be addressed to Elke U. Weber, Center for De- cision Research, Graduate School of Business, University of Chicago, 1101 East 58th Street, Chicago, IL 60637.
492 0749-5978192 $5.00 Copyright Q 1992 by Academic Press, Inc. All rights of reproduction in any form reserved.

THEORY OF RISK AND ATTRACTIVENESS 493
comes are known as “risky choices.” Webster’s dictionary defines “risk” as “the chance of injury, damage, or loss,” and, in an insurance context, as “the chance of loss, degree or probability of loss, or the amount of possible loss.” Expected utility (EU) theory uses the term “risk aversion” to label the phenomenon that people typically prefer a sure win over a gamble with equal or even greater expected value. How- ever, such definitions are imprecise, and they may or may not character- ize how people perceive and evaluate risk.
Nygren (1977) noted that development of an explicit theory of “risk” has been historically precluded by the prominence of EU theory, begin- ning with its axiomatization by von Neumann and Morgenstem (1947). However, as evidence mounted that EU theory had difficulty explaining human preferences (e.g., Edwards, 1962; Kahneman & Tversky, 1979; Schoemaker, 1982; Slavic & Lichtenstein, 1983), researchers sought ad- ditional variables to explain preference. One promising approach was to expand the concept and role of risk. Coombs’ portfolio theory (1969, 1975), for example, models preference as a joint function of the objective expected value and the perceived riskiness of choice alternatives. In Coombs’ conceptualization, risk became a perceptual variable that could be measured by human judgments, a marked departure from the concep- tualization of risk in prescriptive (e.g., financial) decision models where risk had been operationally defined as a characteristic of the choice al- ternative (e.g., the variance of outcomes) (Markowitz, 1959).
Despite extensive theoretical and empirical investigation (Coombs & Bowen, 1971; Coombs & Huang, 1970; Coombs & Lehner, 1984; Keller, Sarin, & M. Weber, 1986; Lute, 1980, 1981; Nygren, 1977; Pollatsek & Tversky, 1970; Weber, 1984, 1988; Weber & Bottom, 1989, 1990), risk remains an elusive and controversial psychological construct. When sub- jects are instructed to judge “attractiveness,” the order of attractiveness judgments can be defined by (and compared to) choice behavior. Unfor- tunately, subjects who are instructed to assign higher attractiveness or pricing judgments to gambles that they would prefer, often actually choose the gamble with the lesser judgment (Tversky, Slavic, & Kahne- man, 1990; Mellers, Ordotiez, & Birnbaum, 1992). Nevertheless, the task at least seems clearer than in the case of risk. When instructed to judge “risk,” there exists no comparable behavioral standard against which to compare the judgment. Instead, risk seems to fall into the category of other abstract concepts (e.g.,“beauty”) that elude precise definition, yet which people are willing to judge. The well-known statement of a supreme court justice about pornography (“I don’t know whether I can define pornography, but I know it when I see it”) could just as well have been made in reference to risk.

494 WEBER, ANDERSON, AND BIRNBAUM
Given the prevalence of “risk-aversion,” it has often been suggested that risk judgments might just be “inverted” attractiveness judgments. The present study addresses the question of whether risk and attractive- ness are two psychologically distinct constructs. If “risk” and “attrac- tiveness” are just different names for the same underlying construct, then there might be no advantage to include both in any theory of behavior. Nygren (1977) addressed this question with the help of multidimensional scaling. He found large individual differences in the perceptions of both the risk and attractiveness of lotteries. Multidimensional scaling revealed two dimensions underlying risk judgments (i.e., variance of outcomes and a complex dimension that separated lotteries with no negative outcomes from those with mixed outcomes as well as separating mixed gambles by expected value). Those same two dimensions as well as a third dimension (simple expected value) were found to underlie attractiveness judgments, suggesting that the two types of judgment are similar but not redundant and that judgments of risk may enter into judgments of attractiveness. Nygren concluded that these results fit well into the framework of Coombs’ (1969) portfolio theory of preference.
Theories of Risk and Attractiveness
The present study was designed to investigate the connections between judgments of the attractiveness of lotteries and the riskiness of the same lotteries using a different approach from that of Nygren (1977) and a wider range of stimuli, in order to test precise theories of the two types of judgment. Figure 1 presents a conceptualization of three possible rela-
Stimuli Psychological Constructs
Responses
Probabilities
x Zact iverwss Outcomes - - Preference
Probabllitles
Outcomes
/ Risk Rating
L Attractiveness Rating
Prcbabilltles - Risk
22
- Risk Rating
Outcomes Attractiveness - Attractiveness Rating
FIG. 1. Schematic representations of risk and attractiveness judgments.

THEORY OF RISK AND ATTRACTIVENESS 495
tionships between risk and attractiveness. The upper diagram represents the viewpoint that risk and attractiveness are both latent constructs that combine to determine preference order. In this viewpoint, risk and at- tractiveness may be inaccessible to the subject, except as inferred con- structs postulated to account for preference.
The center section of Fig. 1 depicts the possibility that subjects asked to judge risk and attractiveness are reporting the same internal mediating construct, but perhaps with different response transformations and inde- pendent random errors. This model implies that, except for noise, judg- ments of attractiveness and riskiness will be monotonically related.
The lower diagram in Fig. 1 represents the idea that risk and attrac- tiveness are distinct concepts that are both accessible to the subject. Metaphorically, one could think of a person looking at a choice altema- tive through rose-colored glasses when judging attractiveness but looking through ‘grey’-colored glasses when judging risk. The same features of the environment (probabilities and outcomes) might be perceived or com- bined differently under the two perspectives. Elaborations of the ways in which the attractiveness and risk constructs could differ are shown in Fig. 2.
In Fig. 2, the subscripts A and R refer to attractiveness and riskiness; P and X represent the vectors of probabilities, P = (p,, . . . , pi), and corresponding outcomes, X = (xi, . . . , Xi), of the lotteries; u*(X) and u&X) are vector-valued functions that convert the objective values of outcomes into subjective scale values for attractiveness and risk, respec- tively; s,(P) and sR(P) are the corresponding vector-valued functions for probability; CA and CR are the functions by which subjective probabilities and outcomes combine to produce *‘A and *n, scalar impressions of attractiveness and risk, respectively; JA and JR are the strictly monotonic
Stimuli Psychological Constructs
Responses
JA -A
FIG. 2. Theoretical loci for differences in the psychology of risk and attractiveness.

496 WEBER, ANDERSON, AND BIRNBAUM
judgment functions that convert psychological impressions into the overt responses, A and R. We also assume that the overt responses, A and R, are composed of JA(?*) and &(*a), respectively, plus random error, so that the expectation of the overt responses provides an unbiased estimate of JA(‘I’A) and J&Pa). If U*(X) = u#), sA(Z’) = +(P), and C, = C,, then the rank order of attractiveness and risk judgments will be the same (except for direction and random error), because JA and JR are assumed to be strictly monotonic functions.
There are three loci in Fig. 2 that could cause differences in the rank order of attractiveness and risk: the subjective probability scales (sA and sR), the subjective monetary outcome scales (UA and un), and the com- bination functions (C, and C,). Since each of these could be the same or different for attractiveness and risk judgments, there are eight distinct classes of theories. A major purpose of the present study is to investigate specific theories of the combination functions, CA and C,, in order to determine which of these cases best accounts for the data.
Issues in the Evaluation of Lotteries
Research on the evaluation of gambles has examined variants of sub- jective expected utility theory (Edwards, 1962; Schoemaker, 1982; Kah- neman & Tversky, 1979). Subjective expected utility (SEU) of a gamble G, with outcome components xi and probability components pi, can be expressed as follows,
SEU(G) = lieu, (1)
where S(pi) and U(Xi) are defined as above, and the summation is across all mutually exclusive and exhaustive outcomes of the gamble.
Expectation models like Eq. (1) have been proposed for both attrac- tiveness (Slavic & Lichtenstein, 1968) and risk (Coombs & Lehner, 1984; Huang, 1971). Therefore, it will be useful to consider and test the impli- cations of this class of theories against those of rival theories.
Equation (1) represents the overall value of a gamble as the sum of products of functions of probability and of outcomes. This representation implies that subjective probability and utility combine multiplicatively, an implication that has proven a good approximation in previous studies (Komorita, 1964; Lynch, 1979; Shanteau, 1974; Tversky, 1967).
The model also implies that the effect of a given outcome should be independent of the values of other outcomes in the gamble. Empirical evidence suggests that this assumption of independence of outcomes may be wrong, and configural weight theories (e.g., Birnbaum & Stegner, 1979; Birnbaum, Coffey, Mellers, & Weiss, 1992; Bimbaum & Sutton, 1992) have been proposed to accommodate these phenomena. The class of nonexpected utility models reviewed by Machina (1987) and M. Weber
THEORY OF RISK AND ATTRACTIVENESS 497
and Camerer (1987) are all examples of configural weight theories. These theories, which allow for dependencies between people’s evaluation of utility and probability weights, include the rank-dependent utility models of Lute (1988, 1991) and Yaari (1987), anticipated utility (Quiggin, 1982), the dual-bilinear model (Lute & Narens, 1985), as well as weighted utility (Chew, 1983; Fishburn, 1983), and cumulative prospect theory (Tversky & Kahneman, in press). Lottery-dependent utility (Becker & Sarin, 1987) was also proposed to accommodate such findings.
Additive models like Eq. (1) also imply that the contribution of a “branch,” i.e., a probability-outcome combination, should be indepen- dent of the number, value, and probability distribution of the other out- comes. However, configural weight theories allow for violations of branch independence. Models with a relative weight averaging compo- nent imply a simple pattern of violations (e.g., Birnbaum & Stegner, 1979; Chew, 1983; Fishburn, 1983; Lynch, 1979).
The present experiment was designed to test the independence assump- tions implicit in Eq. (1) against the pattern of responses expected on the basis of the following alternative model, a configural relative weight av- eraging (CRW) combination function,
CRW(G) = ~~[S(X,Pi~U(~i)~iS(X,Pi)l~ (2)
where CRW(G) represents the overall value of gamble G (analogous to q in Fig. 2). The weight of outcome Xi, S(X,pJ, depends on probability pi with which the outcome occurs as well as on the position of that outcome relative to the distribution of other outcomes, X, within the gamble. This model allows the weight of an outcome Xi to be different depending on whether, for example, xi is the highest or the lowest outcome within the gamble.
The model also has the relative weight averaging property that the s(X,p,) weights are normalized by the sum of weights, Z,s(X,p,), which implies that the weight of a given outcome will be inversely related to factors that affect the weight of other outcomes (see Bimbaum & Stegner, 1979).
Equations (1) and (2) are candidates for the CA and CR combination functions of Fig. 2. While there is evidence that SEU-type combination functions are inadequate to account for subjective value judgments or pair-wise preference (e.g., Lynch, 1979), it is not clear that configural combination functions like Eq. (2) are also necessary to model other types of judgment (e.g., risk) made about lotteries. In other words, the exis- tence of dependencies between probability and outcome evaluation could be specific to utility judgments, or it could be a more general psycholog- ical phenomenon that holds whenever risky choice alternatives are eval- uated. Previous research on risk judgments, in particular, has found vio-

498 WEBER, ANDERSON, AND BIRNBAUM
lations of additive expectancy-value models for perceived risk judgments that parallel those observed in choice (Keller et al., 1986; Weber & Bot- tom, 1990), but the experimental designs were not rich enough to compare SEU-type combination functions against configural theories. The present experiment simultaneously investigates both risk and attractiveness judg- ments for a broad range of lotteries designed to test implications of dif- ferent C, and CR combination functions, as well as to determine the loci of differences in the utility and probability weighting functions between the two types of judgments.
METHOD
Subjects rated the attractiveness and riskiness of lotteries, which were described by probability distributions over monetary outcomes.
Stimuli
A different lottery was presented on each trial. Outcomes were printed in ascending order from left to right, with their corresponding probabili- ties, as shown in the following example:
.32 .64 .04 -$72 +$36 +$144’
The instructions stated that this lottery represented a “32% chance of losing $72, a 64% chance of winning $36, and a 4% chance of winning $144,” and noted that wins and losses were indicated by positive and negative dollar amounts, respectively.
Instructions
The lotteries were described, in part, as follows: “Each lottery is a type of gamble in which you can win money, lose money, or come out even. Imagine a hat with 100 slips of paper in it. Each piece of paper has an amount of money to win or an amount to lose printed on it. Imagine that these slips of paper will be mixed and that one will be chosen at random. You will win or lose the amount of money that is written on that slip of paper.” Probabilities thus were described as the number of slips (out of 100) with a given outcome.
Attractiveness was described to subjects as the degree to which they would like or dislike to play a lottery. The attractiveness ratings were made on a scale from - 100 to + 100, with category labels as follows: - 100, wouldn’t play it for anything; - 80, very very unattractive; - 60, very unattractive; - 40, unattractive; -20, slightly unattractive; 0, neu- tral, don’t care whether I play it or not; +20, slightly attractive; -t-40, attractive; +60, very attractive; +80, very very attractive; + 100,

THEORY OF RISK AND ATTRACTIVENESS 499
wouldn’t miss playing it for anything. Risk ratings were to be made on a scale from 500 to 600, with category labels as follows: 500, no risk at all; 510, very very small risk; 520, very small risk; 530, small risk; 540, slightly small risk; 550, medium risk; 560, slightly high risk; 570, high risk; 580, very high risk; 590, very very high risk; 600, maximum risk.
Subjects were instructed to use integers between - 100 and + 100 for attractiveness and between 500 and 600 for risk, and to write their ratings in appropriately labeled spaces provided adjacent to each lottery. The purpose of using different scales for risk and attractiveness judgments was to help subjects distinguish between the two tasks, and to help the experimenters to determine that subjects were performing both instructed tasks. Usage of different scales was not expected to affect responses, since rating scales with more than nine categories, as in this study, are typically linearly related in a given context (e.g., Parducci & Perrett, 1971).
Design
The experiment consisted of 328 lotteries, generated from the union of eight subdesigns described below. This overall design allowed us to test a variety of differential predictions made by Eqs. (1) vs. (2) in the most economical way, while permitting sufficient constraints to estimate model parameters as well as test assumptions about the invariance of these parameters across subjects or types of judgment.
One-outcome design. A total of 11 trials consisted of outcomes (wins or losses) of either + $144, +$72, + $36, +$18, +$9, $0, -$9, -$18, - $36, -$72, or -$144, with probability 1.0.
Two-outcome design. A total of 12 trials were composed of a 2 x 6 factorial combination of Probability of Outcome-l (P,) by Value of Out- come-l (0,). In this design, the Value of Outcome-2 (0,) was fixed to $0, which occurred with probability P, = (1 - P,). The two levels of P, were .04 and .32; the levels of 0, were + $144, + $36, + $9, - $9, - $36, and - $144.
Three-outcome designs. The 233 three-outcome lotteries were gener- ated from the union of the following subdesigns as shown in Table 1.
(P, x Or x Pz x 0,). There were 144 trials in this 2 x 4 x 3 x 6 factorial combination of P,, O,, Pz, and O,, with O3 fixed to $0 and P, = 1 - P, - P,. The levels of the variables are shown in Table 1.
(Replicate). A subset of 16 trials (see Table 1) from the P, x 0, x P, x 0, design were repeated to obtain information about the rating reliability.
(0, x 0, Triangular). This design consisted of the 45 possible combi- nations of the 10 levels of 0, and 02, with probabilities PI and P, both fixed to .32. Again, O3 was fixed to $0 with P, = 1 - P, - P,. Some trials

500 WEBER, ANDERSON, AND BIRNBAUM
TABLE 1 THREE-OUTCOME SUBDESIGNS
Design name p,
Stimulus values No. of trials
0, p2 02 03 Total New
P, x 0, x Pz x 0, .oa +$72 .04 .32 +$18 .32
-$18 .64 - $72
Replicate .08 +$18 .04 .32 -$18 .64
0, x O2 Triangular .32 all” .32 P, x 0, x Pz .04 +$18 .04
.08 - $72 .08
.16 .16
.32 .32
.64 .64 0, x Pz x 0, x 0, .32 +$72 .04
-$72 .64
+$144 $0 144 144 + $36
+$9 -$9
- $36 -$144 +$144 $0 16 16 -$144
all” $0 45 21 +$144 $0 48 36
+$144 + $36 24 16 -$144 $0
- $36
’ -$I‘% -$72, -$36, -$18, -$9, +$9, +$18, +$36, +$72, +$144.
in this design were shared with the P, X 0, x P, x O2 design; only 21 additional trials were required.
(PI x 0, x PJ As shown in Table 1, this design was a 5 x 2 x 5 factorial with two exceptions. To prevent the total probability from ex- ceeding 1.0, the two trials with P, = P, = 64 were omitted. Therefore, there were 48 trials, of which 36 were unique to this design.
(0, x P2 x 0, x 0,). In this 2 x 2 X 2 X 3 factorial, the levels of O3 were varied. There were 24 trials, only 16 of which were unique.
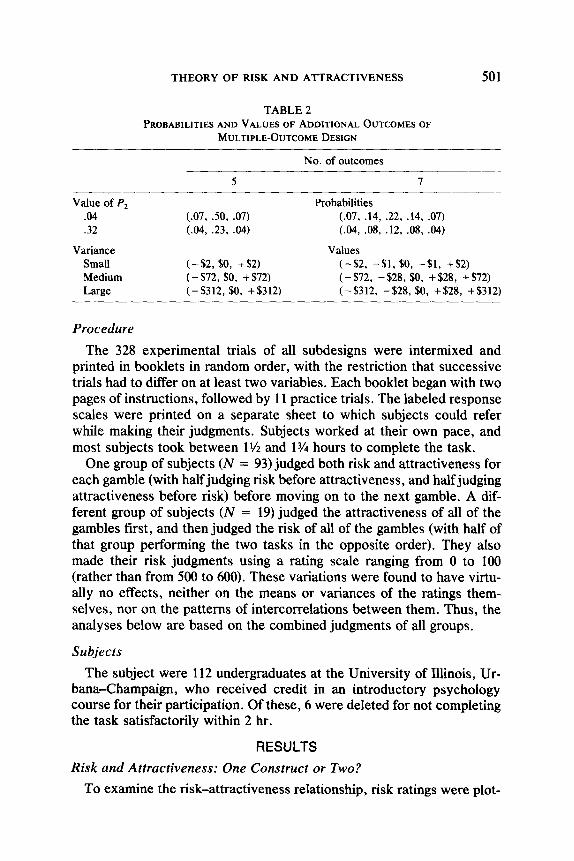
Multiple-outcome design. In this design, 0, and 0, were combined with distributions of additional outcomes that varied in number and variance, as shown in Table 2. In all cases, the values of P, and Oi were fixed to .32 and + $18, respectively. There were 72 trials, generated from a 2 x 6 x
2 x 3 {P2 x O2 X (Number of Outcomes) X (Variance of Outcomes)} factorial. The two levels of P2 were .04 and .32; the six levels of 0, were +$144, +$36, +$9, -$9, -$36, -$144. The probability 1 - P, - P,, which takes the values .36 or 64, was distributed over either three or five additional outcomes. The distributions of component probabilities are shown in the upper portion of Table 2. To create distributions with low, medium, or high variance, the values of the outcomes corresponding to these component probabilities were varied as shown in the lower portion of Table 2.
THEORY OF RISK AND ATTRACTIVENESS 501
TABLE 2 PROBABILITIES AND VALUES OF ADDITIONAL OUTCOMES OF
MULTIPLE-OUTCOME DESIGN
No. of outcomes
5 7
Value of P, .04 .32
Variance Small Medium Large
(.07, so, .07) (.04, .23, 44)
t--.%2, $0, +$2) (- $72, $0, + $72) (-$312, $0, +$312)
Probabilities (.07, .14, .22, -14, .07) (44, .08, .12, .08, .04)
Values (-$2, -$l, $0, +$l, +$2) (-$72, -$28, $0, +$28, +$72) (-$312, -$28, $0, +$28, +$312)
Procedure
The 328 experimental trials of all subdesigns were intermixed and printed in booklets in random order, with the restriction that successive trials had to differ on at least two variables. Each booklet began with two pages of instructions, followed by 11 practice trials. The labeled response scales were printed on a separate sheet to which subjects could refer while making their judgments. Subjects worked at their own pace, and most subjects took between 1% and 1% hours to complete the task.
One group of subjects (N = 93) judged both risk and attractiveness for each gamble (with half judging risk before attractiveness, and half judging attractiveness before risk) before moving on to the next gamble. A dif- ferent group of subjects (N = 19) judged the attractiveness of all of the gambles first, and then judged the risk of all of the gambles (with half of that group performing the two tasks in the opposite order). They also made their risk judgments using a rating scale ranging from 0 to 100 (rather than from 500 to 600). These variations were found to have virtu- ally no effects, neither on the means or variances of the ratings them- selves, nor on the patterns of intercorrelations between them. Thus, the analyses below are based on the combined judgments of all groups.
Subjects
The subject were 112 undergraduates at the University of Illinois, Ur- banaxhampaign, who received credit in an introductory psychology course for their participation. Of these, 6 were deleted for not completing the task satisfactorily within 2 hr.
RESULTS Risk and Attractiveness: One Construct or Two?
To examine the risk-attractiveness relationship, risk ratings were plot-

502 WEBER, ANDERSON, AND BIRNBAUM
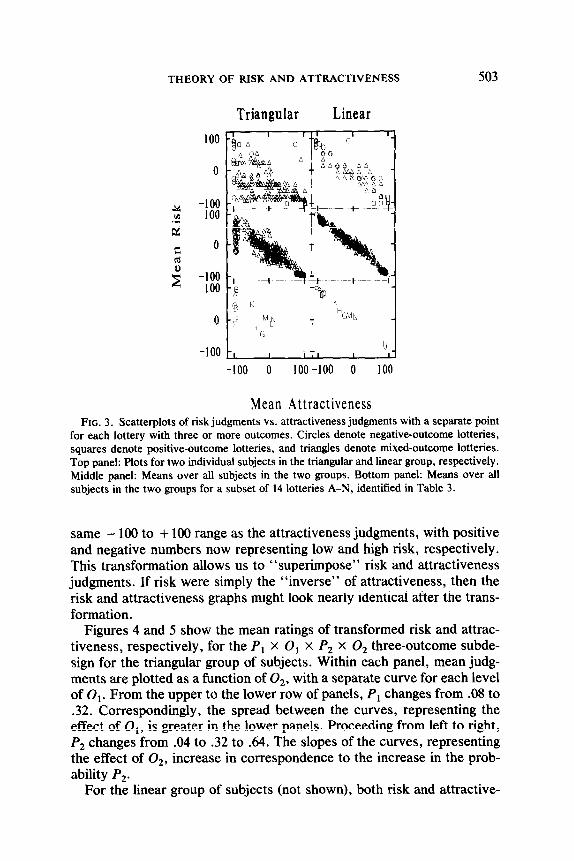
ted against attractiveness ratings with a separate point for each lottery with three or more outcomes.’ This plot was drawn for each subject individually. For some subjects, the relationship between risk and attrac- tiveness appeared to be roughly monotonic, decreasing, and nearly linear. For other subjects, the scatter-plots showed a negative correlation, but risk and attractiveness no longer appeared to be monotonically related, showing the following triangular pattern of points: Lotteries that were judged to be low in attractiveness varied considerably in their ratings of risk, whereas lotteries judged to be high in attractiveness were consis- tently rated to be low in risk. On the basis of these scatter-plots, subjects were sorted into two categories, “linear” (48 subjects) or “triangular” (41 subjects), for which data and results are presented separately in subse- quent analyses. (The risk vs. attractiveness scatter-plots for 17 other sub- jects showed patterns that were either intermediate between the “linear” and “triangular” patterns or were otherwise hard to categorize.) Corre- lations between risk and attractiveness judgments computed over all 328 trials were significantly different for the two categories of subjects. The mean correlation between attractiveness and risk was - .81 for the group of linear subjects and - .67 for the group of triangular subjects, a differ- ence that is statistically significant (t,? = -3.81; p < .OOl).
Scatter-plots for two individual subjects exemplifying the triangular and linear patterns are shown in the top row of Fig. 3. Mean judgments for the two groups are shown in the middle row. The bottom row further illus- trates the difference in judgments between the two groups of subjects by identifying 14 of the lotteries with letters defined in Table 3. Note that the negative-outcome lotteries A-F (which are judged as unattractive by both groups of subjects) are all judged as high in risk by the linear group of subjects, whereas the risk judgments of the triangular group of subjects vary with the probability of a loss. A similar contrast between the two groups can be found in the judgment of risk of the mixed lotteries.
To facilitate comparison between attractiveness and risk judgments in subsequent analyses, risk judgments were linearly transformed to the
’ Judgments of risk and attractiveness were highly reliable. For example, the 16 trials of the replicate design (see Table 1) were correlated for each subject, yielding mean reliabilities of 90 for both risk and attractiveness. Reliability correlations ranged from .33 to .99 for risk and from 60 to 1 .O for attractiveness. Reliability coefftcients for risk and attractiveness judgments did not differ from each other significantly across subjects, by sign test. Four subjects were eliminated from further analyses because of the low reliabilities of their judgments. The mean correlation between risk and attractiveness judgments for these same trials was - .79, ranging from + .13 to - 99. Although these correlations might seem “high” for variables that are hypothesized to represent different constructs, the correlation coefft- cient can be insensitive to important qualitative patterns that have theoretical significance (Bimbaum, 1973, 1974a,b).
THEORY OF RISK AND ATTRACTIVENESS 503
0
0
Triangular Linear
-100 0 100-100 0 100
Mean Attractiveness FIG. 3. Scatterplots of risk judgments vs. attractiveness judgments with a separate point
for each lottery with three or more outcomes. Circles denote negative-outcome lotteries, squares denote positive-outcome lotteries, and triangles denote mixed-outcome lotteries. Top panel: Plots for two individual subjects in the triangular and linear group, respectively. Middle panel: Means over all subjects in the two groups. Bottom panel: Means over all subjects in the two groups for a subset of 14 lotteries A-N, identified in Table 3.
same - 100 to + 100 range as the attractiveness judgments, with positive and negative numbers now representing low and high risk, respectively. This transformation allows us to “superimpose” risk and attractiveness judgments. If risk were simply the “inverse” of attractiveness, then the risk and attractiveness graphs might look nearly identical after the trans- formation.
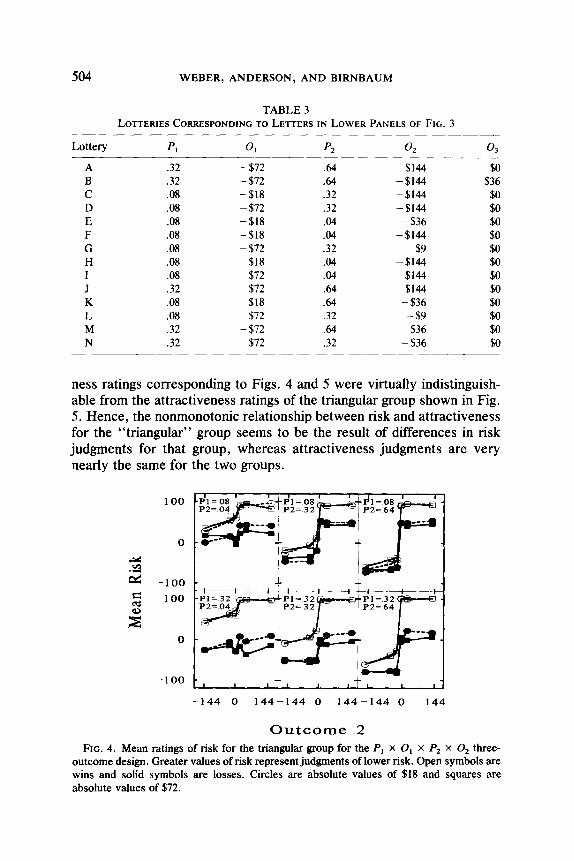
Figures 4 and 5 show the mean ratings of transformed risk and attrac- tiveness, respectively, for the Pi x 0, x P, x O2 three-outcome subde- sign for the triangular group of subjects. Within each panel, mean judg- ments are plotted as a function of O,, with a separate curve for each level of Oi. From the upper to the lower row of panels, P, changes from .08 to .32. Correspondingly, the spread between the curves, representing the effect of 0,, is greater in the lower panels. Proceeding from left to right, P, changes from .04 to .32 to .64. The slopes of the curves, representing the effect of 02, increase in correspondence to the increase in the prob- ability P,.
For the linear group of subjects (not shown), both risk and attractive-
504 WEBER, ANDERSON, AND BIRNBAUM
TABLE 3 LOTTERIES CORRESPONDING TO LETTERS IN LOWER PANELS OF FIG. 3
Lottery p, 01 p2 02 03 -- .--. A .32 - 572 .64 -$144 50 B .32 - 572 .64 -$144 536 C .08 -$18 .32 -$144 50 D .08 -572 .32 -$144 50 E .08 -$I8 .04 - $36 50 F .08 -$18 .04 -$I44 50 G .08 - 572 .32 59 50 H .08 518 .04 -$144 50 I .08 572 .04 $144 50 J .32 572 54 5144 50 K .08 518 .64 -$36 50 L .08 572 .32 -59 50 M .32 - 572 .64 536 50 N .32 572 .32 -$36 50
ness ratings corresponding to Figs. 4 and 5 were virtually indistinguish- able from the attractiveness ratings of the triangular group shown in Fig. 5. Hence, the nonmonotonic relationship between risk and attractiveness for the “triangular” group seems to be the result of differences in risk judgments for that group, whereas attractiveness judgments are very nearly the same for the two groups.
100
Outcome 2 FIG. 4. Mean ratings of risk for the triangular group for the P, X O1 X Pz X 0, three-
outcome design. Greater values of risk represent judgments of lower risk. Open symbols are wins and solid symbols are losses. Circles are absolute values of $18 and squares are absolute values of 572.
THEORY OF RISK AND ATTRACTIVENESS 505
-100
-144 0 144-144 0 144-144 0 144
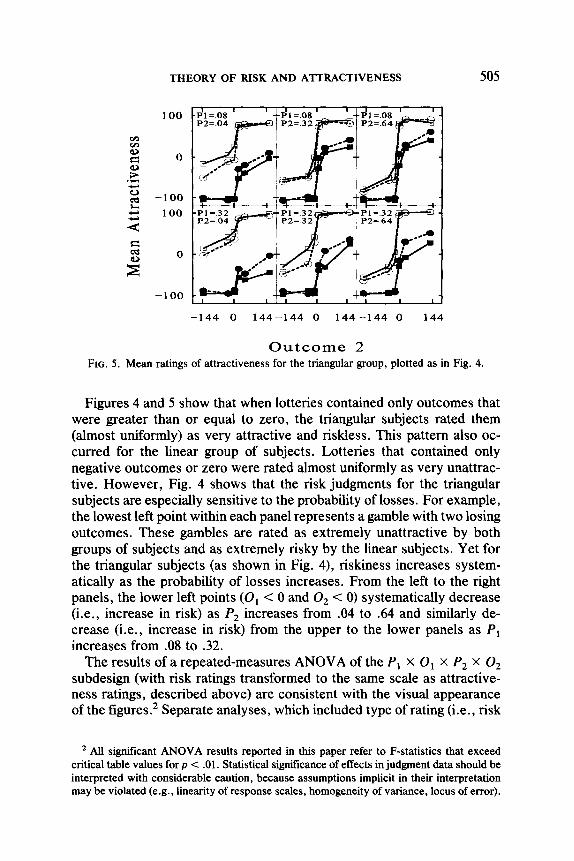
Outcome 2 FIG. 5. Mean ratings of attractiveness for the triangular group, plotted as in Fig. 4.
Figures 4 and 5 show that when lotteries contained only outcomes that were greater than or equal to zero, the triangular subjects rated them (almost uniformly) as very attractive and riskless. This pattern also oc- curred for the linear group of subjects. Lotteries that contained only negative outcomes or zero were rated almost uniformly as very unattrac- tive. However, Fig. 4 shows that the risk judgments for the triangular subjects are especially sensitive to the probability of losses. For example, the lowest left point within each panel represents a gamble with two losing outcomes. These gambles are rated as extremely unattractive by both groups of subjects and as extremely risky by the linear subjects. Yet for the triangular subjects (as shown in Fig. 4), riskiness increases system- atically as the probability of losses increases. From the left to the right panels, the lower left points (0, < 0 and 0, < 0) systematically decrease (i.e., increase in risk) as P, increases from .04 to .64 and similarly de- crease (i.e., increase in risk) from the upper to the lower panels as P, increases from .08 to .32.
The results of a repeated-measures ANOVA of the PI x 0, X P, X O2 subdesign (with risk ratings transformed to the same scale as attractive- ness ratings, described above) are consistent with the visual appearance of the figures.* Separate analyses, which included type of rating (i.e., risk
’ All significant ANOVA results reported in this paper refer to F-statistics that exceed critical table values for p < .Ol. Statistical significance of effects in judgment data should be interpreted with considerable caution, because assumptions implicit in their interpretation may be violated (e.g., linearity of response scales, homogeneity of variance, locus of error).

506 WEBER, ANDERSON, AND BIRNBAUM
vs. attractiveness) in addition to the four design factors, were conducted for the data of the linear and the triangular group of subjects. Only the triangular group of subjects showed significant main effects for type of rating (7) as well as for P, and P2, whereas 0, and 0, were significant for both groups of subjects. Furthermore, all of the six interactions of task and probability (two T-by-P, and four T-by-Pi-by-O, interactions (i = 1, 2)) were significant for the triangular group of subjects, but only one of these six was significant for the linear group of subjects, consistent with the visual impression that risk and attractiveness ratings differ for the triangular group of subjects and that this difference is partly attributable to the different effect of probability information in the two types of rat- ings.
Another contrast between risk and attractiveness can be seen by com- paring Figs. 4 and 5 for the mixed outcome gambles, containing one positive and one negative outcome. Risk ratings (Fig. 4) vary consider- ably with the magnitude of the negative outcome but only minimally with the magnitude of the positive outcome. In contrast, attractiveness ratings (Fig. 5) show clear variation as a function of the magnitude of both pos- itive and negative outcomes. For example, for mixed lotteries with pos- itive outcome 0,, the risk ratings in Fig. 4 are virtually flat in each panel, whereas the corresponding attractiveness ratings in Fig. 5 have a steeper positive slope as a function of the other outcome.
Risk and attractiveness ratings are further contrasted in Fig. 6, which shows mean judgments of risk (upper panels) and attractiveness (lower panels) for both the triangular (left panels) and linear (right panels) group of subjects for the mixed-outcome gambles of the 0, x 0, design, plotted as a function of the amount to win with a separate curve for each level of the amount to lose. For both groups of subjects, the slopes (effect of amount to win) and the vertical spreads between the curves (effect of amount to lose) are smaller for risk (upper panels) than for attractiveness ratings (lower panels); however, the slopes and spreads are smallest for the risk judgments by the triangular group (upper left panel). Consistent with these visual impressions, the main effects as well as interaction of 0, and 0, were significant for both groups of subjects, as were the two task by outcome interactions.
Figure 7 shows the mean judgments of risk and attractiveness for the two groups of subjects for the mixed-outcome gambles of the P, x P,
ANOVAs computed on judgments that were first transformed by the inverse of the logistic response transformation functions shown in Eqs. (5a) and (5b) had basically the same results as the reported ones on the untransformed judgment data. Unless otherwise noted, all effects described as trends apparent in the figures are statistically significant at the .Ol level.
THEORY OF RISK AND ATTRACTIVENESS 507
Triangular Group Linear Group
Outcome 2: 0 -9 A -18
9 12 144 9 12 144
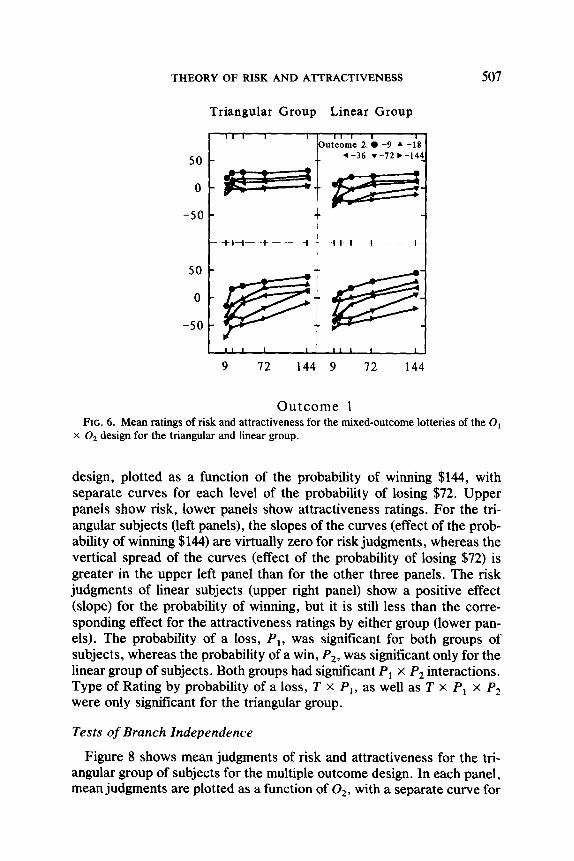
Outcome 1 FIG. 6. Mean ratings of risk and attractiveness for the mixed-outcome lotteries of the 0,
x O2 design for the triangular and linear group.
design, plotted as a function of the probability of winning $144, with separate curves for each level of the probability of losing $72. Upper panels show risk, lower panels show attractiveness ratings. For the tri- angular subjects (left panels), the slopes of the curves (effect of the prob- ability of winning $144) are virtually zero for risk judgments, whereas the vertical spread of the curves (effect of the probability of losing $72) is greater in the upper left panel than for the other three panels. The risk judgments of linear subjects (upper right panel) show a positive effect (slope) for the probability of winning, but it is still less than the corre- sponding effect for the attractiveness ratings by either group (lower pan- els). The probability of a loss, P,, was significant for both groups of subjects, whereas the probability of a win, P,, was significant only for the linear group of subjects. Both groups had significant P, x P2 interactions. Type of Rating by probability of a loss, T x P,, as well as T x P, x P2 were only significant for the triangular group.
Tests of Branch Independence
Figure 8 shows mean judgments of risk and attractiveness for the tri- angular group of subjects for the multiple outcome design. In each panel, mean judgments are plotted as a function of 02, with a separate curve for
508 WEBER, ANDERSON, AND BIRNBAUM
Triangular Group Linear Group
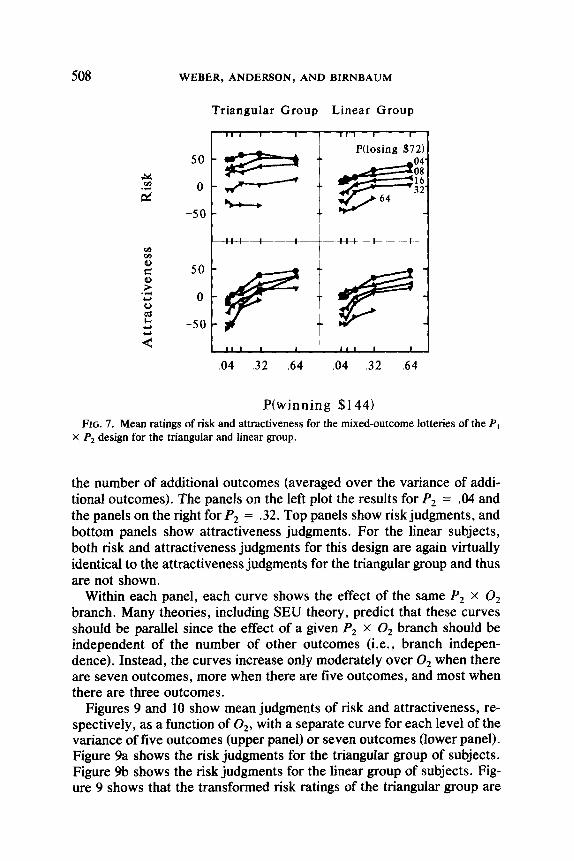
P(winning $144) FIG. 7. Mean ratings of risk and attractiveness for the mixed-outcome lotteries of the PI
X. P2 design for the triangular and linear group.
the number of additional outcomes (averaged over the variance of addi- tional outcomes). The panels on the left plot the results for P2 = .04 and the panels on the right for P, = .32. Top panels show risk judgments, and bottom panels show attractiveness judgments. For the linear subjects, both risk and attractiveness judgments for this design are again virtually identical to the attractiveness judgments for the triangular group and thus are not shown.
Within each panel, each curve shows the effect of the same P, x O2 branch. Many theories, including SEU theory, predict that these curves should be parallel since the effect of a given Pz x 0, branch should be independent of the number of other outcomes (i.e., branch indepen- dence). Instead, the curves increase only moderately over 0, when there are seven outcomes, more when there are five outcomes, and most when there are three outcomes.
Figures 9 and 10 show mean judgments of risk and attractiveness, re- spectively, as a function of O,, with a separate curve for each level of the variance of five outcomes (upper panel) or seven outcomes (lower panel). Figure 9a shows the risk judgments for the triangular group of subjects. Figure 9b shows the risk judgments for the linear group of subjects. Fig- ure 9 shows that the transformed risk ratings of the triangular group are

THEORY OF RISK AND ATTRACTIVENESS 509
2 -100
Ptoutcome 2)=.04 P(outcome 2)=.32
I ’ I II I I , 8 I ,I I I 1
-144 -36 36 144 -144 -36 36 144
Outcome 2 FIG. 8. Effect of number of lottery outcomes (averaged over variance levels) on the effect
of 0, for risk and attractiveness for the triangular group. 0, is $18 and P, is .32. Squares denote three outcomes, triangles denote five outcomes, and circles denote seven outcomes.
higher (i.e., lower judgments of risk), which is alsc apparent in Fig. 6. Figure 10 shows the attractiveness judgments for the triangular group; the attractiveness judgments for the linear group were virtually identical to those of the triangular group.
As evident in all figures (i.e., for both tasks and both groups of sub- jects), the greater the variance (V) of the other outcomes, the lower the slopes, another violation of branch independence. According to SEU- type models [Eq. (l)], the slope of the curves (representing the effect of the P, x O2 branch) should be independent of the number and variance of the other outcomes within the gamble. However, Figs. 8 to 10 show that these slopes are reduced as either the number (N) or variance (V) of the other outcomes is increased. The V X O2 and iV x O2 interactions were statistically significant for both groups of subjects. For the triangular group of subjects, the three-way interactions T x V x O2 and T x N x 0, were also significant, indicating that the violations of branch indepen- dence were more extreme for the attractiveness judgments than for the risk judgments.
These violations of branch independence are predicted by Eq. (2), if s(p) > p for small values of p (thus accounting for the effect of the number

510 WEBER, ANDERSON, AND BIRNBAUM
4 3 d E
zi
a P(outcome 2)=.04 P(outcome 2)=.32
t t 4
-100 CII -144 -36 36 144 -144 -36 36 144
Outcome 2
b P(outcome 2)=.04 P(outcome 2)=.32
100 F’ I I, I I I I I, I I
0
0
-100 I,, I I I I I, I I
-144 -36 36 144 -144 -36 36 144
Outcome 2 FIG. 9. Effect of variance of lottery outcomes on the effect of 0, for risk for the triangular
(a) and linear (b) group.

THEORY OF RISK AND ATTRACTIVENESS 511
100
0
0
P(outcome 2)=.04 P(outcome 2)=.32
I I ,I I I --I I I, I I _
:s:7F N=5
-100 CI I II I I I I ,I I I
-144 -36 36 144 -144 -36 36 144
Outcome 2 FIG. 10. Effect of variance of lottery outcomes on the effect of 0, for attractiveness for
the triangular group.
of outcomes) and if negative values of xi receive greater configural weight (thus accounting for the effect of the variance of outcomes). The observed violations of branch independence indicate that Eq. (2) provides a better explanation than Eq. (1) for both attractiveness and risk judgments.
Furthermore, Eq. (1) implies that there should be no interactions be- tween the effect of any one outcome and the probability of any of the other outcomes. However, in the P, X Ot X P, X O2 three-outcome design, the effect of a given P, x O1 branch was inversely related to the level of P, and the effect of a given P2 X O2 branch was inversely related to the level of P,. This effect is analogous to the phenomenon reported by Birnbaum (1976), Bimbaum and Stegner (1979), Bimbaum and Mellers (1983), and Bimbaum, Wong, and Wong (1976) in the context of source credibility, that the effect of the information provided by any given source is inversely related to the credibility or diagnosticity of other sources of information. The relative weight averaging component of Eq. (2) can account for this pattern of judgments since increasing any one of the S(X,pi) will result in a larger denominator, I;,s(X,p,), thus dimishing the effect of other branches. Thus, differences in the nature of the risk judg- ments between the two groups have the result of effectively reducing the average perceived risk for the triangular group.

512 WEBER, ANDERSON, AND BIRNBAUM
Representation of Judgments
The following version of Eq. (2) was fit to the risk and attractiveness judgments of both groups of subjects,
where T\I and VA are the subjective impressions of risk and attractive- ness as in Fig. 2, u,(x) and U*(X) are the psychophysical functions for monetary outcomes, and sR(X,p) and sA(X,p) are the configural weighting functions that depend on both the probabilities and the distribution of outcomes within each gamble as follows:
so+ for xi > 0
sR(x&‘) = sR”@) for Xi = 0
sR-(p) for Xi < 0 and W)
S*+(p) for Xi > 0
sA(x#) = SA’(p) for Xi = 0 (W SA-@) for Xi < 0 .
This function utilizes sign-dependence, which for this experiment can- not be well-distinguished from rank-dependence because subjects seemed to attend to the magnitude of gains or losses primarily when judging mixed-outcome lotteries. Therefore, a negative outcome was typically also the worst outcome. Lotteries that had only positive outcomes dif- fered very little in attractiveness or riskiness and lotteries that had only negative outcomes were all rated low in attractiveness; even risk ratings by triangular subjects differed only as a function of the probability of losing.
Because of this flatness of ratings at the upper and lower end of the response scales, a logistic response transformation function, J, was used to model both risk and attractiveness judgments,
JA = {aA/[l + eXp( - ‘PA)]}+ b, (W JR = {ad1 + exP( - WI) + h, (5b)
where aA, bA, aR, and bR are parameters that are allowed to differ for attractiveness and risk judgments. The logistic response functions, J, which were free to vary for both groups of subjects and types of judg- ment, showed some differences for the two types of judgments (i.e., somewhat steeper for risk than for attractiveness judgments), but were very similar for the two groups of subjects.

THEORY OF RISK AND ATTRACTIVENESS 513
To reduce the number of parameters estimated, the utility functions were approximated as two-piece power functions of the objective mone- tary wins and losses, as follows,
uA(x) =
uR(x) =
(64
(6b)
where cd, dAi, cni, and dRi(i = + , -) are power function parameters that are allowed to differ for risk and attractiveness judgments. The subjective probability functions were constrained to be monotonically increasing with objective probability, but were otherwise free.
The model was fit to the 289 mean judgments of risk and the 289 mean judgments of attractiveness for each of the two groups of subjects. A specially written FORTRAN program estimated the parameters of the J, s, and u functions so as to minimize the total sum of squared deviations between model predictions and judgments across all 1156 cells [289(lot- teries) x 2(types of judgments) x 2(types of subjects) = 11561. Chan- dler’s (1969) subroutine, STEPIT, was used to accomplish the function minimization.
Special cases of the general theory were fit by imposing the following constraints on Eqs. (3) to (6). In the most general version (Configural Full, Model IV), different UR and uA, ~a and sA, as well as JR and JA functions were estimated for the triangular and the linear groups of subjects. The most constrained version (Configural Reduced, Model I, representing a “one-construct” hypothesis) allowed only the JR and JA functions to differ, but required the u and the s functions to be the same for both types of judgments and for both groups of subjects. Model II restricted u func- tions to be the same, but allowed for different s functions, whereas Model III restricted the s functions to be the same but allowed the u functions to differ. To assess the relative importance of the configural aspect of the model [Eq. (4)], we also fit a Non-Configural, relative weight averaging, full version of the model (Model V). This Non-Configural Full model was identical to Model IV, except that its s functions were independent of rank and/or sign (i.e., s+ = so = s -). The number of parameters and index of fit are shown in Table 4.
The Contigural Full model (IV) with 136 estimated parameters has the lowest overall Root Mean Square Error (RMSE) of all the models esti- mated. Model II (which restricts u functions to be the same, i.e., uA(x) = u&x) for risk and attractiveness and for both groups of subjects) but

514 WEBER, ANDERSON, AND BIRNBAUM
TABLE 4 INDEX OF FIT AND No. OF ESTIMATED PARAMETERS FOR MODELS I TO V
-- No. of Parameters
Root Mean Model N” Nb Square Error
I Confgural Reduced 40 21 15.35 II Configural: Same u functions 124 48 12.26 III Configural: Same s functions 52 33 14.87 IV Configural Full 136 60 12.15 V Non-Configural Full 108 36 20.83
a For s functions constrained to be monotonic as a function of objective probability (as for reported tits).
b Ifs functions had been approximated by quadratic polynomial of objective probability.
allows the configural weighting functions to differ) tits almost as well. Restricting the weighting functions to be the same has a more detrimental effect on model fit (Model IV vs. III) than restricting the utility functions to be the same (Model IV vs. II).
The predictive success of Models II and IV is not merely a function of their number of free parameters. Model V, the non-configural version of the full model, with 108 estimated parameters has the worst fit of all the models considered (RMSE = 20.83), even worse than that of Model I (RMSE = 15.35) with only 40 parameters. Summarizing Table 4, it ap- pears that sign-dependence of probability weights is the key to the supe- rior fit of Models II and IV.
The large number of parameters (Table 4) results from allowing the weighting functions to be as free as possible (constrained only to be monotonic). Approximation of these weights by quadratic polynomials reduces the number of model parameters markedly (see Table 4) but does not change the relative tit of the five models.
Conflgural Model II seems to provide the best fit for its number of parameters. In this model, the subjective probability functions (but not the utility functions) were estimated separately for each judgment task and for each group. For both groups of subjects, the correlations between model predictions and attractiveness and risk judgments were .97 and .98, respectively.
Figure 11 shows the best-fitting (two-piece power) utility function that was used to approximate the attractiveness and risk judgments for both groups of subjects in Model II. The utility functions estimated separately for the two groups and two types of judgment for the full configural model (IV) were not significantly different from the common function shown in Fig. 11. Consistent with the value function of prospect theory (Kahneman

THEORY OF RISK AND ATTRACTIVENESS
10 -
6 0 - s
5 -10 - P .4 c 0 -
.z -20
s IA -30 -
-40 - I 8 III,, I I
-312 -144-72 0 72 144 312
Objective Outcomes
515
FIG. 11. Utility function (Model II): Power functions estimated separately for positive and negative outcomes.
& Tversky, 1979; Tversky & Kahneman, in press), the function is steeper in the domain of losses than in the domain of gains.
Figure 12 displays the probability weighting functions, estimated for the configural relative weight averaging model (II). The functions are quite different in the three panels, showing that probability weights differ de-
.64
.16
t
01 Losses j Zero i i Gains
I
.04 .32 .64 .Q4 .32 .64 .92.04 .32 .64
Objective Probability FIG. 12. Contigural probability functions (Model II) for risk (solid symbols) and attrac-
tiveness (open symbols) for triangular (circles) and linear (squares) groups.

516 WEBER, ANDERSON, AND BIRNBAUM
pending on whether the probability is associated with a loss, gain, or zero outcome. Observed differences in the risk judgments made by the linear and triangular groups can be explained by differences in their probability weighting functions: the triangular group (solid circles) has a steeper slope than the linear group (solid squares) in their probability weighting func- tion for losses and (especially) for zero outcomes, but a shallower slope in their probability weighting function for gains. Similarly, observed differ- ences between risk (solid circles) and attractiveness judgments (open cir- cles) made by the triangular group can be explained by differences in all three probability weighting functions: steeper for the probability of losses and zero outcomes, but shallower for gains. For the linear group, whose risk and attractiveness judgments were similar, there are minimal differ- ences (solid and open squares). Nevertheless, differences are in the same direction for both groups.
Weights for zero outcomes add to the denominator of the combination function in Eq. (3), and thus when weights are greater (as seen in Fig. 12 for risk in the triangular group) the effects of non-zero outcomes are reduced.
Weights combine multiplicatively with the utilities shown in Fig. 11. Given the shape of the utility function, the effect of a loss of a particular size on judgments of attractiveness and risk will be greater than the effect of an equivalent gain, even though the probability weighting functions are similar. Because ratings for positive-only lotteries were nearly equal, as were those for negative-only outcome lotteries, it is not well-determined in this experiment whether the greater effect of negative outcomes should be attributed to differences in probability weights or in utilities for posi- tive vs. negative outcomes.
DISCUSSION
Theories of Risk and Attractiveness
In this study, people reliably and consistently judged the attractiveness and riskiness of lotteries, but showed qualitative differences between these two evaluations. These results appear to rule out the common- mediator hypothesis depicted in the middle panel of Fig. 1, which implies that judgments of risk and attractiveness should be monotonically related. They suggest instead that risk and attractiveness are distinct and acces- sible psychological constructs (*a # q,J. With respect to Fig. 2, both types of judgments could be tit by the same model (i.e., C, = CA), a relative weight averaging model with rank- and/or sign-dependent prob- ability weights. In this model, the subjective values of outcomes were the same for both tasks (i.e., un = u,). The two types of judgment differed in their probability weights (i.e., sn # sA). Returning to the metaphor in the
THEORY OF RISK AND ATTRACTIVENESS 517
introduction, it appears that people wear different-colored ‘glasses’ when judging risk vs. attractiveness, and that these ‘glasses’ mainly affect the relative weights of different outcomes.
Modeling risk and attractiveness as distinct constructs that differ pri- marily in their configural weights is consistent with the results of previous studies that compared the two judgment tasks. In their investigation of expectation principle violations in risk judgments similar to those of the Allais (1953) paradox, Weber and Bottom (1989) found that violations were different for risk and attractiveness judgments (i.e., they occurred for different gambles). Weber and Bottom (1990) found that such viola- tions were the result of violations of probability accounting assumptions (rather than of violations of the monotonicity assumption per se) and suggested that the conjoint expected risk model for risk judgments (Lute & Weber, 1986) be modified to allow for configurality between probability and outcome evaluation. Given the qualitative differences in Allais-type violations between risk and attractiveness judgments, Weber and Bottom (1989) speculated that the configurality of the weighting functions may depend on the judgment task, a hypothesis corroborated by the results of the present study.
Nygren’s (1977) multidimensional scaling analysis of risk and attrac- tiveness judgments also found similarities as well as differences between the two tasks. Consistent with his results, the present study found that perceived risk is a distinct, measurable, and meaningful construct, subject to individual differences.
Both risk and attractiveness judgments showed effects that are incon- sistent with SEU-type combination functions. Table 5 summarizes these effects as well as the model features by which they can be explained. For example, main effects and interactions involving types of judgment (i.e., attractiveness vs risk) can be explained by assuming that people have different probability weighting functions or utility functions when evalu- ating risk as opposed to attractiveness. Other effects are explained by relative weight averaging, for example, violations of branch independence as a function of the number of outcomes (Fig. 8) or the interaction be- tween probability levels (Pi x P2) shown in Fig. 7. Still other phenomena are explained by the sign-dependence of the probability weighting func- tions, for example, violations of branch independence as a function of the variance of outcomes (Figs. 9 and 10) or the interaction between different outcome levels (0, X 0,) shown in Fig. 6. The configural, relative weight averaging model [Eqs. (3) to (6)] described all aspects of the data and thus provides a better representation than an SEU-type combination rule.
It may be possible for other combination rules and judgment functions to describe the observed set of data. A main objective of this study was to contrast Eq. (1) (which assumes additive combination of lottery

518 WEBER, ANDERSON, AND BIRNBAUM
TABLE 5 SLJMMARYOFEXPERIMENTALEFFECTSANDOFMODEL FEATURES NECESSARY TO
ACCOUNTFORTHEM
Model features
Effects
Different risk and
Relative weight Contiiural attractiveness
averaging s function s functions u functions
0, x 02 X p, x p2 X (Type) x P, x P2 X X P, x 0, x P2 X P, x 0, x P, X Violations of branch independence:
No. of outcomes X Variance of outcomes X
Rank order differences for risk and attractiveness: Type X X (Type) x Pi X (Type) X Oi X (Type) x Pi X Oi X X
branches) against Eq. 2 (which implies a particular non-additive combi- nation). Equation (2) was found to provide a far superior fit. Our data showed flatness in both risk and attractiveness judgments for homoge- neous lotteries (i.e., lotteries with only positive or only negative out- comes, respectively), which results in near parallelism of the probability by outcome interactions on either side of zero in Figs. 4 and 5. This flatness was fit by a non-linear (logistic) response function. Alternatively, it is possible for combination rules other than Eq. (2) to produce the observed pattern of results. Simple conjunctive or disjunctive rules in combination with within- and between-subject changes in type of rule and/or changes in cutoff levels as, for example, suggested by Goldstein and Busemeyer (1992) could give rise to such discontinuities.
Similarly, the near-parallelism on either side of zero might be indicative of an additive combination of probabilities and outcomes, as suggested by Mellers et al. (1992). Even though previous studies (Komorita, 1964; Lynch, 1979; Shanteau, 1974; Tversky, 1967) have inferred multiplicative (rather than additive) combination of probability and outcome informa- tion, Mellers et al. (1992) theorized that, under certain conditions, sub- jects may combine probability and outcome information additively, rather than multiplicatively. They found that people combine probability and outcome information multiplicatively when they judge prices of lotteries,

THEORY OF RISK AND ATTRACTIVENESS 519
but sometimes additively for ratings of attractiveness. To assume a purely additive combination of probability weights and outcomes for the results of our study, however, would not explain the violations of branch inde- pendence and other phenomena listed in Table 5 that rule out an SEU- type integration rule in favor of contigural weighting.
Configural Weighting of Outcomes
Configural weighting models were proposed initially to explain devia- tions from additivity in social judgments, for example, in personality im- pressions (Birnbaum, 1974b) and in morality judgments (Bimbaum, 1973). In those contexts, source credibility or relative importance were weighted configurally, that is, depended on other characteristics of the judgment situation. Deviations of risky choice behavior from predictions of SEU models led to the development of rank- and/or sign-dependent configural utility theories. The results of this study suggest that configural non- expected utility evaluations may be equally applicable to pairwise pref- erences (Lopes, 1987, 1990; Tversky & Kahneman, in press) and judg- ments about risky prospects (Birnbaum & Sutton, 1992; Birnbaum et al., 1992). The present results favor those non-expected utility expressions with relative weight averaging (e.g., Chew, 1983; Fishbum, 1983).
The estimated weights for negative outcomes (which in this study usu- ally also were the lowest in rank) were different functions of probability than the weights for zero and for positive outcomes. Such results provide empirical motivation for recent axiomatic work in this area (Lute, 1990; Lute & Fishburn, 1991; Tversky & Kahneman, in press). The combina- tion function fit to the results of this study resembles these axiomatic rank- and/or sign-dependent theories in its departure from non-configural SEU formulations. The present formulation, however, also differs from these axiomatic theories in introducing a probability weighting function for zero outcomes. Having different probability weights for zero out- comes than for non-zero outcomes can predict violations of dominance.
Conj?gural Weighting, Task, and the Judge’s Point of View
A series of studies (Birnbaum et al., 1992; Birnbaum & Sutton, 1992; Mellers, Weiss, & Bimbaum, 1992) explain violations of dominance in selling prices for lotteries with a configural weight model that assigns lower weights to low-probability zero-valued outcomes than to compara- ble positive or negative outcomes, consistent with the weighting functions estimated for the attractiveness judgments in this study. As shown in Fig. 12, probability weights for zero outcomes are lower (close to zero) than those for non-zero outcomes when judging attractiveness. However, the opposite is true for the weighting functions underlying judgments of risk. Apparently, contigural weights depend on the task.
520 WEBER, ANDERSON, AND BIRNBAUM
In the studies by Bimbaum and Stegner (1979) and Birnbaum et al. (1992), for example, people were asked to judge the value of either a hypothetical used car or a money lottery from either a buyer’s, a seller’s, or a neutral point of view. Both studies found that the rank-dependent configural weights given to lower vs. higher values in the distribution of possible prices varied systematically with the judges’ point of view, i.e., the specific judgment task.
Bimbaum and Stegner (1981) related differences in judgments of IQ to individual differences in contigural weighting. To the extent that config- Ural weighting represents taking a particular “point of view,” individuals may differ in the viewpoints they take, particularly for tasks that are open to interpretation, such as the judgment of perceived riskiness. Consistent with this interpretation, the two groups of subjects identified in this study differed in their judgments of risk but not of attractiveness. For “linear” subjects, the probability weights were similar for risk and for attractive- ness judgments. For “triangular” subjects, probability weights (or “points of view”) were very different for the two tasks, However, Fig. 12 shows that the differences in weighting functions for risk and attractive- ness were qualitatively similar for the two groups, Unclassified subjects seemed to occupy an in-between position on the difference continuum. Lopes (1987, 1990) also suggested that individuals may differ in the rela- tive weight given to outcomes at the low end of the distribution of possible outcomes (Security) vs. at the high end (Potential), analogous to Bim- baum and Stegner’s (1979) rank-dependent configural weighting as a func- tion of point of view.
In summary, the present data fit into a larger mosaic of results in which otherwise perplexing characteristics of human judgment and decision making can be attributed to configural weighting. In these studies, it appears that attractiveness and risk are closely related but distinct phe- nomena that are governed by the same combination function, the same utility scale for monetary outcomes, but different weighting functions for outcomes that depend on the probability, rank and/or sign of the out- comes, the task, and the individual.
REFERENCES Allais, M. (1953). Le comportement de I’homme rationel devant le risque: Critique des
postulats et axiomes de I’ecole americaine. Econometricn, 21, 503-546. Becker, J. L., & Grin, R. K. (1987). Lottery dependent utility. Management Science, 33,
1367-1382. Birnbaum, M. H. (1973). The devil rides again: Correlation as an index of tit. Psychological
Bulletin, 79, 239-242. Bimbaum, M. H. (1974a). Reply to the devil’s adovates: Don’t confound model testing and
measurement. Psychological Bulletin, 80, 854-859. Bimbaum, M. H. (1974b). The nonadditivity of personality impressions. Journal of Exper-
imental Psychology, 102, 543-561.
THEORY OF RISK AND ATTRACTIVENESS 521
Bimbaum, M. H. (1976). Intuitive numerical prediction. American Journal ofPsychology, 89,417-429.
Bimbaum, M. H., Coffey, G., Mellers, B. A., & Weiss, R. (1992). Utility measurement: Conligural-weight theory and the judge’s point of view. Journal of Experimental Psy- chology: Human Perception and Performance, 18, 331-346.
Bimbaum, M. H., & Mellers, B. A. (1983). Bayesian inference: Combining base rates with opinions of sources who vary in credibility. Journal of Personality and Social Psychol- ogy, 45, 792-804.
Bimbaum, M. H., & Stegner, S. E. (1979). Source credibility: Bias, expertise, and the judge’s point of view. Journal of Personality and Social Psychology, 31, 48-74.
Bimbaum, M. H., & Stegner, S. E. (1981). Measuring the importance of cues in judgment for individuals. Journal of Experimental Social Psychology, 17, 159-182.
Bimbaum, M. H., & Sutton, S. E. (1992). Scale convergence and utility measurement. Organizational Behavior and Human Decision Processes, 52, 183-215.
Bimbaum, M. H., Wong, R., & Wong, L. (1976). Combining information from sources that vary in credibility. Memory and Cognition, 4, 330-336.
Chandler, J. P. (1969). STEPIT-Finds local minima of a smooth function of several pa- rameters. Behavioral Science, 14, 81-82.
Chew, S. H. (1983). A generalization of the quasilinear mean with applications to the mea- surement of income inequality and decision theory resolving the Allais paradox. Econo- metrica, 51, 1065-1092.
Coombs, C. H. (1969). Portfolio theory: A theory of risky decision making. La Decision. Paris: Centre National de la Recherche Scientifique.
Coombs, C. H. (1975). Portfolio theory and the measurement of risk. In M. F. Kaplan & S. Schwartz (Eds.), Human judgment and decision (pp. 63-68). New York: Academic Press.
Coombs, C. H., & Bowen, J. N. (1971). A test of VE-theories of risk and the effect of the central limit theorem. Acta Psychologica, 35, 15-28.
Coombs, C. H., & Huang, L. (1970). Polynomial psychophysics of risk. Journal of Math- ematical Psychology, 7, 317-338.
Coombs, C. H., & Lehner, P. E. (1984). Conjoint design and analysis of the bilinear model: An application to judgments of risk. Journal of Mathematical Psychology, 38, l-42.
Edwards, W. (1962). Subjective probabilities inferred from decisions. Psychological Re- view, 69, 109-135.
Fishbum, P. (1983). Transitive measurable utility. Journal of Economic Theory, 31, 293- 317.
Goldstein, W. M., & Busemeyer, J. M. (1992). The effect of ‘irrelevant’ variables on deci- sion making: Criterion shifts in preferential choice. Organizational Behavior and Hu- man Decision Processes, 52, 425-454.
Heath, C., & Tversky, A. (1991). Preference and belief: Ambiguity and competence in choice under uncertainty. Journal of Risk and Uncertainty, 4, 5-28.
Huang, L. C. (1971). The expected risk function. Michigan Mathematical Psychology Pro- gram Report 71-6.
Kahneman, D., & Tversky, A. (1979). Prospect theory: An analysis of decision under risk. Econometrika, 47, 263-291.
Karmarkar, U. S. (1978). Subjectively weighted utility: A descriptive extension of the ex- pected utility model. Organizational Behavior and Human Performance, 21, 61-72.
Keller, L. R., Sarin, R. K., & Weber, M. (1986). Empirical investigation of some properties of the perceived riskiness of gambles. Organizational Behavior and Human Decision Processes, 38, 114-130.

522 WEBER, ANDERSON, AND BIRNBAUM
Komorita, S. S. (1964). A model for decision-making under risk. American Journal of Psy- chology, 77, 42W36.
Lopes, L. (1984). Risk and distributional inequality. Journal of Experimental Psychology: Human Perception and Performance, IO, 465485.
Lopes, L. L. (1987). Between hope and fear: The psychology of risk. Advances in Exper- imental Social Psychology, 20, 255-295.
Lopes, L. L. (1990). Re-modeling risk aversion: A comparison of Bemoullian and rank dependent value approaches. In G. M. von Fuerstenberg (Ed.), Acting under uncer- tainty: Multidisciplinary conceptions. Boston, MA: Kluwer.
Lute, R. D. (1980). Several possible measures of risk. Theory and Decision, 12, 217-228. Lute, R. D. (1981). Correction to ‘Several possible measures of risk.’ Theory and Decision,
13, 381. Lute, R. D. (1988). Rank-dependent, subjective expected-utility representations. Journal of
Risk and Uncertainty, 1, 305-332. Lute, R. D. (1991). Rank- and sign-dependent linear utility models for binary gambles.
Journal of Economic Theory, 53, 75-100. Lute, R. D., & Fishbum, P. C. (1991). Rank- and sign-dependent linear utility models for
finite first-order gambles. Journal of Risk and Uncertainty, 4, 29-59. Lute, R. D., & Narens, L. (1985). Classification of concatenation measurement structures
according to scale type. Journal of Mathematical Psychology, 29, 1-72. Lute, R. D., & Weber, E. U. (1986). An axiomatic theory of conjoint, expected risk. Jour-
nal of Mathematical Psychology, 30, 188-205. Lynch, J. G. (1979). Why additive utility models fail as descriptions of choice behavior.
Journal of Experimental Social Psychology, 15, 397-417. Machina, M. J. (1987) Decision making in the presence of risk. Science, 236, 537-543. Markowitz, H. (1959). Portfolio selection. New York: Wiley. Mellers, B. A., OrdoAez, L. D., & Birnbaum, M. H. (1992). A change of process theory for
contextual effects and preference reversals in risky decision making. Organizational Behavior and Human Decision Processes, 52, 331-369.
Mellers, B. A., Weiss, R., & Bimbaum, M. H. (1992). Violations of dominance in pricing judgments. Journal of Risk and Uncertainty, 5, 73-90.
Nygren, T. E. (1977). The relationship between perceived risk and attractiveness of gam- bles: A multidimensional analysis. Applied Psychological Measurement, 1, 565-579.
Parducci, A., & Perrett, L. (1971). Category rating scales: Effects of relative spacing and frequency of stimulus values. Journal of Experimental Psychology, 89, 427-452.
Pollatsek, A., & Tversky, A. (1970). A theory of risk. Journal of Mathematical Psychology, 7, 540-553.
Quiggin, J. (1982). A theory of anticipated utility. Journal of Economic Behavior and Or- ganization, 3, 323-343.
Schoemaker, P. J. H. (1982). The expected utility model: Its variants, purposes, evidence, and limitations. Journal of Economic Literature, 20, 529-563.
Shanteau, J. (1974). Component processes in risky decision making. Journal of Experimen- tal Psychology, 103, 680-691.
Slavic, P. (1967). The relative influence of probabilities and payoffs upon perceived risk of a gamble. Psychonomic Science, 9, 223-224.
Slavic, P., & Lichtenstein, S. (1968). Relative importance of probabilities and payoffs in risk taking. Journal of Experimental Psychology, 78, 1-18.
Slavic, P., & Lichtenstein, S. (1983). Preference reversals: A broader perspective. Ameri- can Economic Review, 73, 596-605.
Tversky, A. (1967). Additivity, utility and subjective probability. Journal of Mathematical Psychology, 4, 175-202.
THEORY OF RISK AND ATTRACTIVENESS 523
Tversky, A., 8~ Kahneman, D. (in press). Advances in prospect theory: Cumulative repre- sentation of uncertainty. Journal of Risk and Uncertainty.
Tversky, A., Slavic, P., & Kahneman, D. (1990). The causes of preference reversal. Amer- ican Economic Review, 80, 204-217.
von Neumann, J., & Morgenstem, 0. (1947). Theory of games and economic behavior (2nd ed.). Princeton: Princeton Univ. Press.
Weber, E. U. (1984). Combine and conquer: A joint application of conjoint and functional approaches to the problem of risk measurement. Journal of Experimental Psychology: Human Perception and Performance, 10, 179-194.
Weber, E. U. (1988). A descriptive measure of risk. Acta Psychologica, 69, 185-203. Weber, E. U., & Bottom, W. P. (1989). Axiomatic measures of perceived risk: Some tests
and extensions. Journal of Behavioral Decision Making, 2, 113-131. Weber, E. U., & Bottom, W. P. (1990). An empirical evaluation of the transitivity, mono-
tonicity, accounting, and conjoint axioms for perceived risk. Organizational Behavior and Human Decision Making, 45, 253-275.
Weber, M., & Camerer, C. (1987). Recent developments in modelling preference under risk. OR Spectrum, 9, 129-151.
Yaari, M. E. (1987). The dual theory of choice under risk. Econometrica, 55, 95-115.
RECEIVED: June 18, 1991