a toolkit of principles and evidence - gsma€¦ · · 2014-02-22a toolkit of principles and...
TRANSCRIPT

Mobile taxes and fees A toolkit of principles and evidence
februAry 2014
3
Mobile taxes and fees – a tool Kit of PRinCiPles and eVidenCe
ExEcutivE Summary 4 1 introduction 9 2 Policy contExt 102.1 Taxes and fees burden on mobile services 112.2 Differences in tax treatment across sectors 182.3 Differences in tax treatment within the mobile services sector 21
3 taxES and fEES: EmPirical imPlicationS 233.1 The negative economic effects from high mobile tax 243.2 Impacts arising from the structure of the taxes and fees burden 30
4 PrioritiES and PracticalitiES of mobilE taxation rEform 364.1 Priority areas for reform 374.2 Transitioning to a more effective system of taxation 42
aPPEndix aGeneral principles of taxation 52
aPPEndix bModelling approach 56
Contents
Mobile taxes and fees – a tool Kit of PRinCiPles and eVidenCe
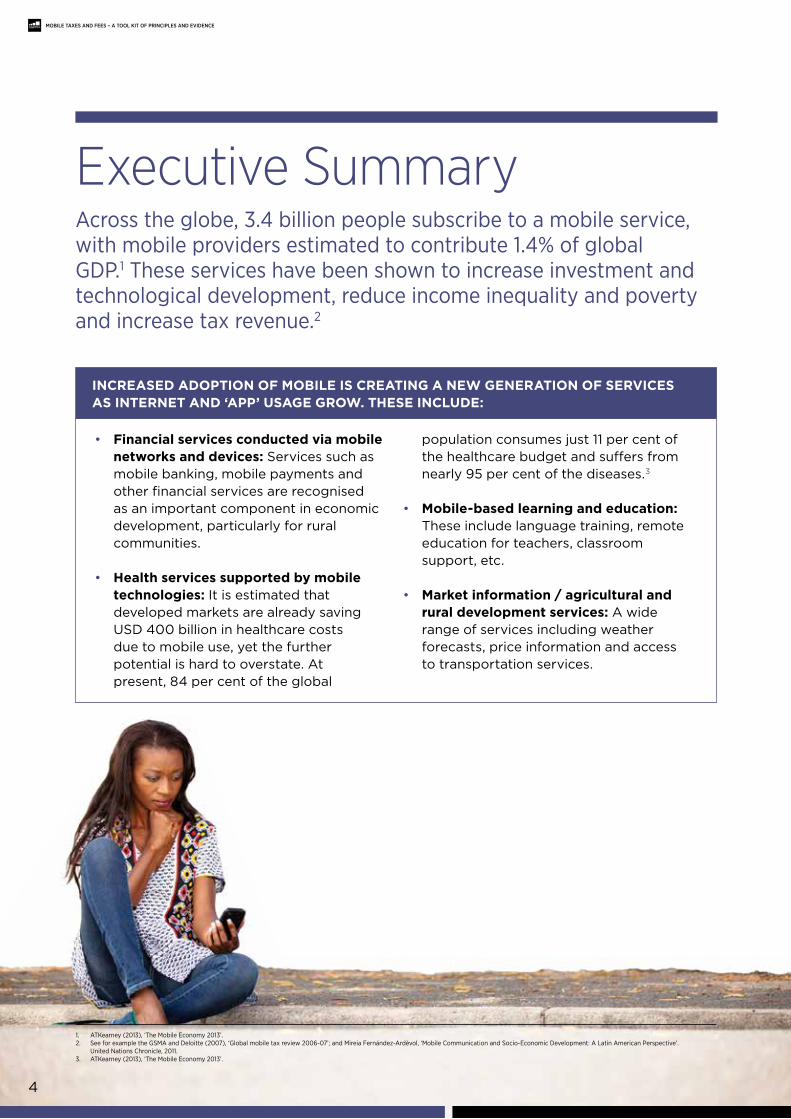
Executive SummaryAcross the globe, 3.4 billion people subscribe to a mobile service, with mobile providers estimated to contribute 1.4% of global GDP.1 These services have been shown to increase investment and technological development, reduce income inequality and poverty and increase tax revenue.2
• Financial services conducted via mobile networks and devices: Services such as mobile banking, mobile payments and other financial services are recognised as an important component in economic development, particularly for rural communities.
• Health services supported by mobile technologies: It is estimated that developed markets are already saving USD 400 billion in healthcare costs due to mobile use, yet the further potential is hard to overstate. At present, 84 per cent of the global
population consumes just 11 per cent of the healthcare budget and suffers from nearly 95 per cent of the diseases.3
• Mobile-based learning and education: These include language training, remote education for teachers, classroom support, etc.
• Market information / agricultural and rural development services: A wide range of services including weather forecasts, price information and access to transportation services.
Increased adoptIon oF MobIle Is creatIng a new generatIon oF servIces as Internet and ‘app’ usage grow. tHese Include:
1. ATKearney (2013), ‘The Mobile economy 2013’.2. See for example the GSMA and Deloitte (2007), ‘Global mobile tax review 2006-07’; and Mireia fernández-Ardèvol, ‘Mobile Communication and Socio-economic Development: A Latin American Perspective’.
united Nations Chronicle, 2011.3. ATKearney (2013), ‘The Mobile economy 2013’.
4
5
Mobile taxes and fees – a tool Kit of PRinCiPles and eVidenCe
Despite the widespread growth of mobile, affordability remains a significant barrier to further adoption of the mobile technology required for these services, particularly in developing markets.
Taxation of mobile services remains a significant policy issue. Across a sample of 19 countries studied for this report, over USD 3 in every USD 10 of mobile revenue was transferred to the government in the form of taxes, regulatory fees or other charges.
As the analysis and case studies in this report show, high taxes on mobile restrict
the growth of the sector and the use of networks. Conversely in markets that have (at least partially) reformed taxation such as Uruguay and Kenya, a more balanced taxation structure can encourage the growth of the sector, supporting vital economic activity and social objectives such as digital inclusion.
This report therefore considers current taxation practices for mobile and the extent to which they are consistent with established best practice. The impacts of the current taxation structures are considered and recommendations for reform are identified.
This study extends and complements a number of previous reports looking at the taxation of mobile services.
4. IMf (2001), ‘Tax policy for developing countries’.5. Ibid.6. for a longer discussion see section 3.
establIsHed prIncIples oF taXatIon
Taxation is a complex area and, in developing markets the establishment of an effective tax policy has to contend with numerous practical difficulties including widespread informal activity, limited institutional capabilities and political pressure to avoid taxing special interests.4 Consequently tax policy frequently has to sit somewhere between the theoretically correct response and the one that recognises the practicalities of taxation in a market.5
There are however a number of principles that are generally recognised as contributing to an effective tax system:
• In general, taxation should be broad-based: Taxation alters incentives for production and consumption, and so economic distortions will generally be minimised where the burden of taxation is spread evenly across the economy. In practice this equates to adopting broadly defined bases for taxation, rate variations that are limited and effective enforcement of tax compliance.
• taxes should account for sector and product externalities. The case for taxation to address negative externalities such as those arising from tobacco consumption is well recognised. However, the same logic also applies in the case of sectors and products with positive externalities. Taxation policy should encourage sectors, such as mobile, that create positive externalities in the wider economy.
• the tax and regulatory system should be simple, easily understandable and enforced: A lack of transparency over taxation systems and liabilities may deter investors and is also likely to increase enforcement costs for government.
• different taxes have different economic properties: There is a general consensus that, for most products, a broad-based consumption tax will be less distorting than taxation on income or profits.6
Current taxation on mobile
6
Mobile taxes and fees – a tool Kit of PRinCiPles and eVidenCe
This report considers the consistency of mobile taxation with these established principles by examining the actual transfers to governments as a share of revenue. The report identifies four important themes that, taken together, provide clear evidence that current taxation of mobile is not consistent with recognised best practice:
• High burden of taxation on mobile: Taxation on mobile services is more than 30 per cent of mobile sector revenues in more than half of the 19 countries studied.
• Mobile also faces high burden relative to other sectors: Nearly half the burden of taxation on mobile came from taxes and fees levied specifically on the mobile sector. The review identified two additional exacerbating factors arising from this:
• Much of the mobile specific burden is in the form of regulatory fees which are typically narrowly defined and may disincentivise investment.
• A high-level review of the technical design of the taxation suggests that many of these mobile specific taxes would not apply to other operators providing competing services such as Voice over Internet Protocol (VoIP). The potential for this to create competitive distortions makes this particularly problematic.
• externalities not properly accounted for in taxation policy: World Bank research suggests that most markets have significant extra capacity to levy additional taxes on economic ‘bads’. However, when considering corporation taxes and other broad based levies, there is evidence that mobile is making a disproportionate contribution.
• upward trend with a growing proportional tax burden on mobile: The majority of markets studied showed an increased mobile tax burden over time. In general this burden of taxation is also increasing faster than the general tax burden. This implies that the gap in the burden between mobile and the rest of the economy is widening.
From a policy perspective, these findings on mobile taxation are concerning. The mobile sector makes a major contribution to economic growth and the affordability of services is a recognised constraint on more widespread usage, particularly in developing markets.
It is estimated that a one percentage point reduction in the tax burden on mobile broadband would result in up to a 1.8 percentage point increase in penetration and an up to 0.7 percentage point increase in GDP over five years.7
High taxation will also affect the decisions of mobile operators, changing their incentives to invest and altering their ability to raise capital to finance it. A review of over 400 different studies found that, on average, a 1 per cent increase in the rate of tax on capital led to a 4 per cent decrease in the level of Foreign Direct Investment (“FDI”).8
To underline the importance of this issue, World Bank research finds that lack of investment in telephony and other utilities is reducing growth by two per cent in sub-Saharan Africa, and productivity by as much as 40 per cent.9
High taxation on mobile has a number of evident problems, yet governments need to raise revenue if they are to continue to finance public expenditure.
Across the 19 countries studied in this report, the governments raised in excess of USD 13.5 billion in taxes and fees from mobile operators.10 This suggests both a significant policy challenge and an opportunity for economic benefit through tax reform. Reducing the taxation on mobile will require governments to raise significant revenue from elsewhere, but it equally offers the potential to significantly enhance economic growth.
Based on the analysis conducted as part of this study, the following priority areas for reform have been identified:
Policy implications and priorities for reform
7. The GSMA (2012), ‘The Impact of Taxation on the Development of the Mobile broadband Sector’.8. Mooij and ederveen (2005), ‘explaining the Variation in empirical estimates of Tax elasticities of foreign Direct Investment’.9. World bank (2009), ‘Transforming Africa’s infrastructure’.10. As discussed later in this study, this estimate may still understate the burden on mobile operators as it may not capture the full range of taxes and fees they are subjected to.
7
Mobile taxes and fees – a tool Kit of PRinCiPles and eVidenCe
11. for bangladesh see Tax-News (2013), ‘bangladesh Cuts Mobile Telecom Taxes’, May 21.12. See for example edmiston (2004), ‘Tax uncertainty and Investment: A Cross-Country empirical examination’.13. International finance Group (2009), ‘A handbook for tax simplification’.
• reduce specific taxation of the mobile sector: Nearly 40 per cent of the tax revenues raised from the mobile sector came in the form of mobile specific taxation. In some countries it was considerably above this – between 70 and 90 per cent in Sri Lanka, Turkey, Thailand and Bangladesh.
While some of these charges will relate to regulatory instruments designed to replicate competitive market forces, the scale of the charges goes beyond these into revenue raising measures.
Sector specific charges on this scale are problematic as they distort production and consumption behaviour and reduce the ability of mobile operators to finance future investment.
In this context it should be acknowledged that some progress is already being made. For example, Bangladesh recently announced planned reductions to levies on new mobile subscriptions and Thailand is in the process of transitioning to a new regulatory framework that is expected to reduce the tax/fees burden and increase regulatory certainty.11
The issues around mobile specific taxation are particularly acute where the taxes give rise to competitive distortions by applying differently to providers of equivalent services. This issue has been highlighted as a particular concern in relation to the taxation of VOIP providers and other firms that use mobile technology to provide services in competition with the host network.
• reduce complexity and uncertainty of mobile taxation: Empirical research has identified a negative relationship between uncertainty over future taxation and investment.12 The risk of future tax rises is priced into investment decisions and can therefore be expected to reduce both Foreign direct investment (FDI) and domestic investment in the medium-term. This concern was manifest in a number of the markets examined as part of this study.
The structural features of the tax system in some markets also contribute to ambiguity and lack of certainty around taxation liabilities. This acts as a further disincentive to investment.13
• carefully consider taxation of new and emerging services: The growth of mobile data opens up the possibility for the sector to increase its economic value through a whole new generation of products and services ranging from health care services to education and finance.
However these services are typically very price sensitive, particularly as they first emerge, meaning that taxation may seriously delay and possibly prevent their benefits being achieved.
Within a framework that seeks to rebalance the system towards harmonised and broad-based taxation, it may be beneficial to consider transitional arrangements to enable the effective growth of these services, provided that competitive distortions are not created in the process.
For example, governments may wish to introduce a policy that favours innovative products, and adjust this gradually towards the general level of taxes and fees as the product matures.
• reduce taxation on access: Taxes and fees levied on consumer access to mobile services are common practice, although vary in level and nature across markets. These include taxes on subscription, activation, SIM and/or connection taxes and fees, as well as handset taxes and fees.
Increasing the cost of network access is widely recognised as having important negative effects because of the network externalities arising from additional users on a network and because of the externalities and productivity increases generated by the services.
8
Mobile taxes and fees – a tool Kit of PRinCiPles and eVidenCe
1. prioritise harmonisation of taxation with other sectors: High taxation of the mobile sector creates long-term fiscal damage and there are significant economic benefits from early reforms. A focus on rapidly addressing the most damaging aspects of taxation will also limit the immediate fiscal cost and maximise the economic opportunity.
An equally important reason for early reform is that as the value of the services grows over time, the fiscal cost of reform will be bigger and more difficult to manage.
2. phased reductions of taxes on established services: Phased reductions of taxes and fees offer governments the opportunity to benefit from the economic contribution from mobile whilst limiting short-term fiscal costs. The mobile broadband case study on Brazil shows that simple tax reduction can be revenue generative.
3. consider alternatives: Compared to other industries, the mobile sector pays an above average amount to governments. Early reform and phased reductions of high taxes help governments to manage the fiscal costs while benefiting from the mobile driven growth.
Where compensating tax rises are needed, governments have a range of options available to them.
Taxation of economic ‘bads’ offer governments the opportunity to raise revenue whilst improving economic welfare. Typical examples of economic ‘bads’ include tobacco, alcohol and environmental pollution.
Greater use of general taxation, particularly on consumption, also offers an opportunity to raise revenue without negatively distorting economic activity. It is often argued that broad-based consumption taxes are preferable to other forms of taxes.
The shadow economy is estimated to average 39 per cent of GDP across the 19 markets studied in this report. While addressing this will be challenging, the findings suggest that in the long-run governments have a considerable opportunity to increase tax revenue through expansion of the tax base.
Addressing these taxation problems will impose a short-term fiscal cost on government. It is difficult to generalise about policy solutions to overcome this, as different countries face different pressures, policy priorities and challenges. However the findings in this report point to three broad options for governments to consider:
However the GSM Association (GSMA) and its members are concerned with the current level and structure of taxes and fees that have a harmful impact on the adoption of mobile services. It has therefore commissioned this study to assess how these different structures and levels of tax and fees impact the activity in the sector across countries.
The empirical insights within this study focus on a selection of 19 countries namely: Bangladesh, Brazil, Cameroon, Chad, Colombia, Croatia, Egypt, Gabon, Ghana, Hungary, Jordan, Kenya, Mexico, Nigeria, South Africa, Sri Lanka, Thailand, Tunisia and Turkey.15 This selection provides a wide range of economies at different stages of development and with varying structures and level of taxes and fees burden.
The study also draws upon research by academics and international organisations on considerations in taxation design to formulate a set of recommendations that build a framework for future taxation of mobile services. The remainder of the report is structured as follows:
• Section 2 sets the policy context through a review of the level, structure and trends in taxation and fees across the 19 countries;
• Section 3 considers empirical evidence on the impacts of the taxes and fees levied on mobile services; and
• Section 4 uses these findings to identify three priorities for reform of mobile taxation.
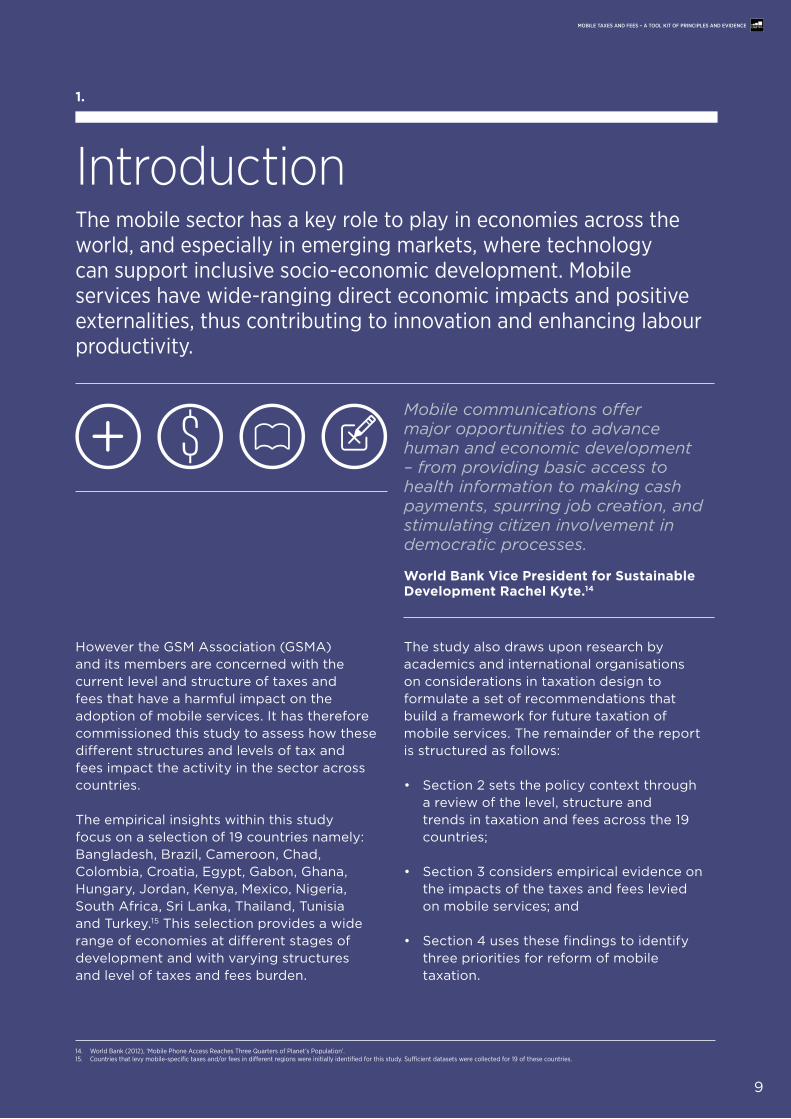
IntroductionThe mobile sector has a key role to play in economies across the world, and especially in emerging markets, where technology can support inclusive socio-economic development. Mobile services have wide-ranging direct economic impacts and positive externalities, thus contributing to innovation and enhancing labour productivity.
1.
Mobile communications offer major opportunities to advance human and economic development – from providing basic access to health information to making cash payments, spurring job creation, and stimulating citizen involvement in democratic processes.
world bank vice president for sustainable development rachel Kyte.14
14. World bank (2012), ‘Mobile Phone Access reaches Three Quarters of Planet’s Population’.15. Countries that levy mobile-specific taxes and/or fees in different regions were initially identified for this study. Sufficient datasets were collected for 19 of these countries.
9
Mobile taxes and fees – a tool Kit of PRinCiPles and eVidenCe

10
Mobile taxes and fees – a tool Kit of PRinCiPles and eVidenCe
Policy contextThis chapter reviews the level and structure of taxes and fees levied on mobile services across time, markets and sectors. It is structured in three sections covering:
• Taxesandfeesburdenonmobileservicesacrosscountriesandtime, including estimates of the effective burden across the selected markets, and trends on the burden across time for a subset of the markets, highlighting some underlying drivers;
• Differencesintaxtreatmentbetweenthetelecommunicationssector, information and communications technology (ICT) players, and other economic sectors; and
• Differencesintaxtreatmentofplayerswithintelecommunications, particularly between traditional and non-traditional service providers, such as over-the-top (OTT) operators.
2.
• The tax burden on mobile services is greater than 30 per cent of gross revenues for more than half of the 19 countries and has generally increased over time.
• On average, 40 per cent of the total taxes and fees burden on mobile services are sector-specific.
• In a number of markets it appears that these sector-specific taxes would not apply to over-the-top operators.
• Mobile operators appear to face a higher burden than other sectors for broad-based taxes, such as corporation tax.
KeY Messages
Based on data provided by operators for the sample markets:
11
Mobile taxes and fees – a tool Kit of PRinCiPles and eVidenCe
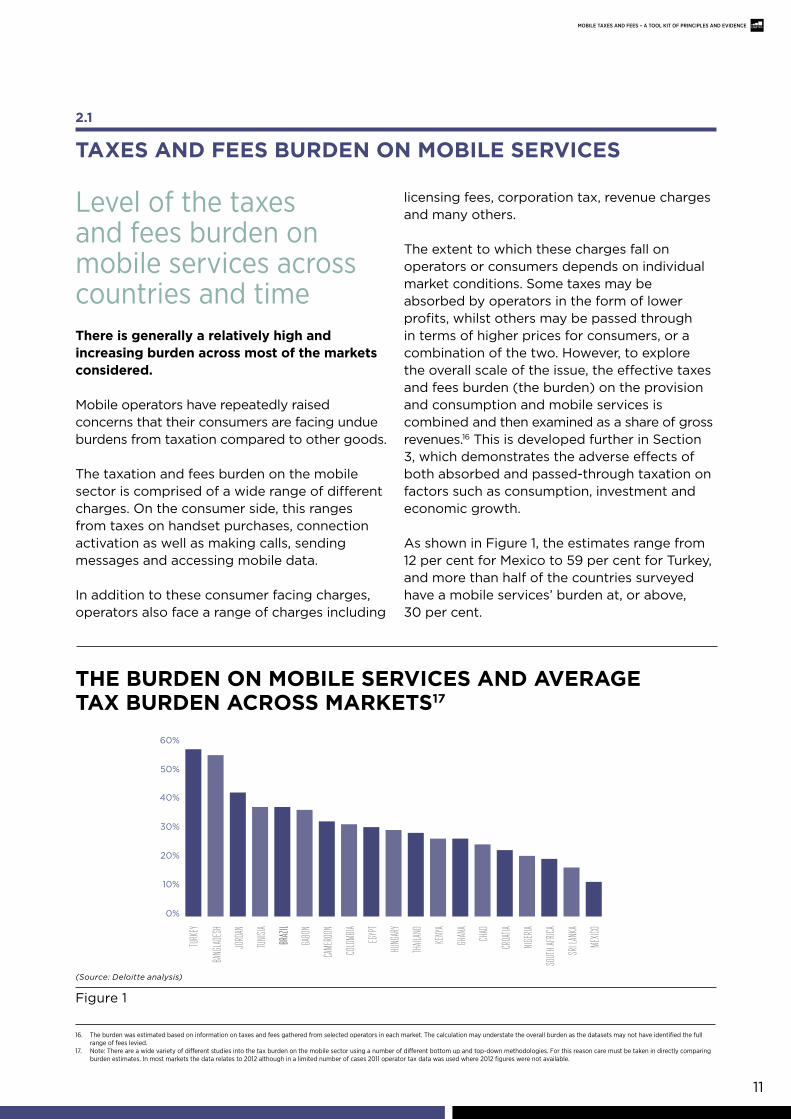
there is generally a relatively high and increasing burden across most of the marketsconsidered.
Mobile operators have repeatedly raised concerns that their consumers are facing undue burdens from taxation compared to other goods.
The taxation and fees burden on the mobile sector is comprised of a wide range of different charges. On the consumer side, this ranges from taxes on handset purchases, connection activation as well as making calls, sending messages and accessing mobile data.
In addition to these consumer facing charges, operators also face a range of charges including
licensing fees, corporation tax, revenue charges and many others.
The extent to which these charges fall on operators or consumers depends on individual market conditions. Some taxes may be absorbed by operators in the form of lower profits, whilst others may be passed through in terms of higher prices for consumers, or a combination of the two. However, to explore the overall scale of the issue, the effective taxes and fees burden (the burden) on the provision and consumption and mobile services is combined and then examined as a share of gross revenues.16 This is developed further in Section 3, which demonstrates the adverse effects of both absorbed and passed-through taxation on factors such as consumption, investment and economic growth.
As shown in Figure 1, the estimates range from 12 per cent for Mexico to 59 per cent for Turkey, and more than half of the countries surveyed have a mobile services’ burden at, or above, 30 per cent.
2.1
taXes and Fees burden on MobIle servIces
Level of the taxes and fees burden on mobile services across countries and time
0%
10%
20%
30%
40%
50%
60%
TURK
EY
BANG
LADE
SH
TUNIS
IA
JORD
AN
GABO
N
CAME
ROON
COLO
MBIA
EGYP
T
HUNG
ARY
THAIL
AND
KENY
A
GHAN
A
CHAD
CROA
TIA
NIGER
IA
SOUT
H AFR
ICA
SRI L
ANKA
MEXIC
O
BRAZ
ILBR
AZIL
(Source: Deloitte analysis)
Figure 1
16. The burden was estimated based on information on taxes and fees gathered from selected operators in each market. The calculation may understate the overall burden as the datasets may not have identified the full range of fees levied.
17. Note: There are a wide variety of different studies into the tax burden on the mobile sector using a number of different bottom up and top-down methodologies. for this reason care must be taken in directly comparing burden estimates. In most markets the data relates to 2012 although in a limited number of cases 2011 operator tax data was used where 2012 figures were not available.
tHe burden on MobIle servIces and average taX burden across MarKets17
tHe burden across tIMe
(Source: Deloitte analysis18)
Figure 2
0%
10%
20%
30%
40%
50%
60%
70%
80%
20122011201020092008
TURKEYBANGLADESHJORDANBRAZILSAMPLE AVERAGEHUNGARYEGYPTCOLOMBIACAMEROONTHAILANDKENYACROATIA
0%
10%
20%
30%
40%
50%
60%
70%
80%
20122011201020092008
TURKEYBANGLADESHJORDANBRAZILSAMPLE AVERAGEHUNGARYEGYPTCOLOMBIACAMEROONTHAILANDKENYACROATIA
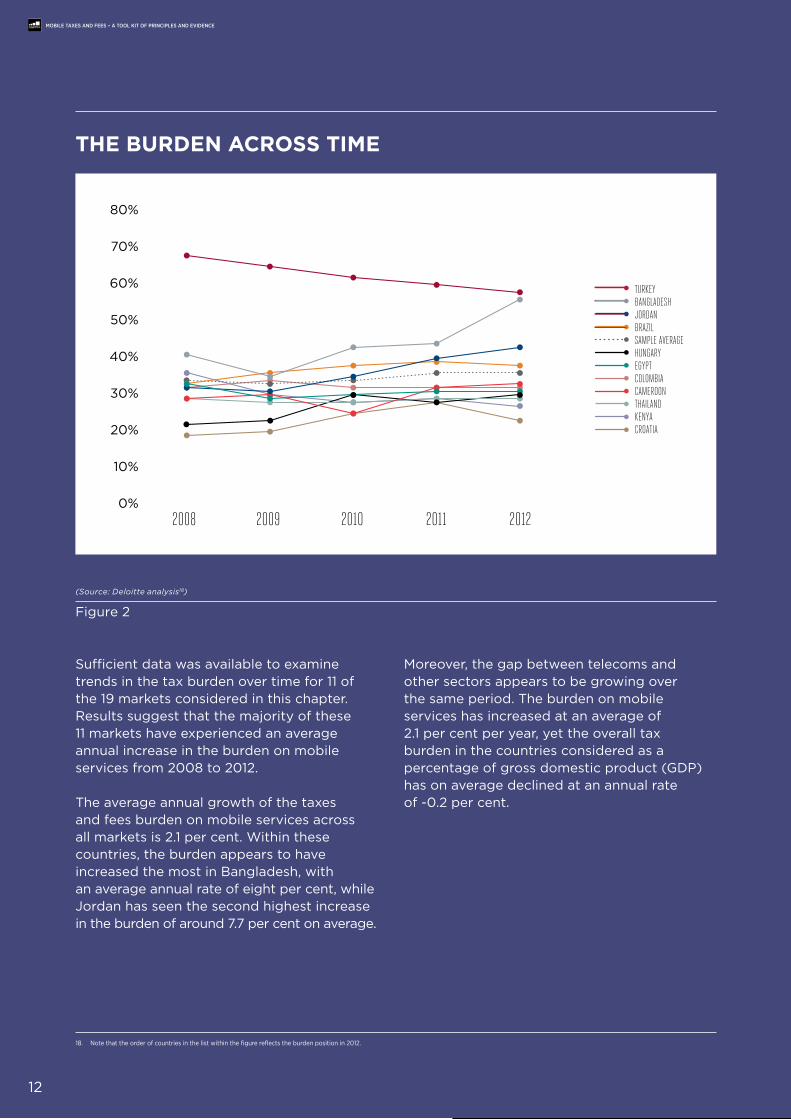
Sufficient data was available to examine trends in the tax burden over time for 11 of the 19 markets considered in this chapter. Results suggest that the majority of these 11 markets have experienced an average annual increase in the burden on mobile services from 2008 to 2012.
The average annual growth of the taxes and fees burden on mobile services across all markets is 2.1 per cent. Within these countries, the burden appears to have increased the most in Bangladesh, with an average annual rate of eight per cent, while Jordan has seen the second highest increase in the burden of around 7.7 per cent on average.
Moreover, the gap between telecoms and other sectors appears to be growing over the same period. The burden on mobile services has increased at an average of 2.1 per cent per year, yet the overall tax burden in the countries considered as a percentage of gross domestic product (GDP) has on average declined at an annual rate of -0.2 per cent.
18. Note that the order of countries in the list within the figure reflects the burden position in 2012.
12
Mobile taxes and fees – a tool Kit of PRinCiPles and eVidenCe
13
Mobile taxes and fees – a tool Kit of PRinCiPles and eVidenCe
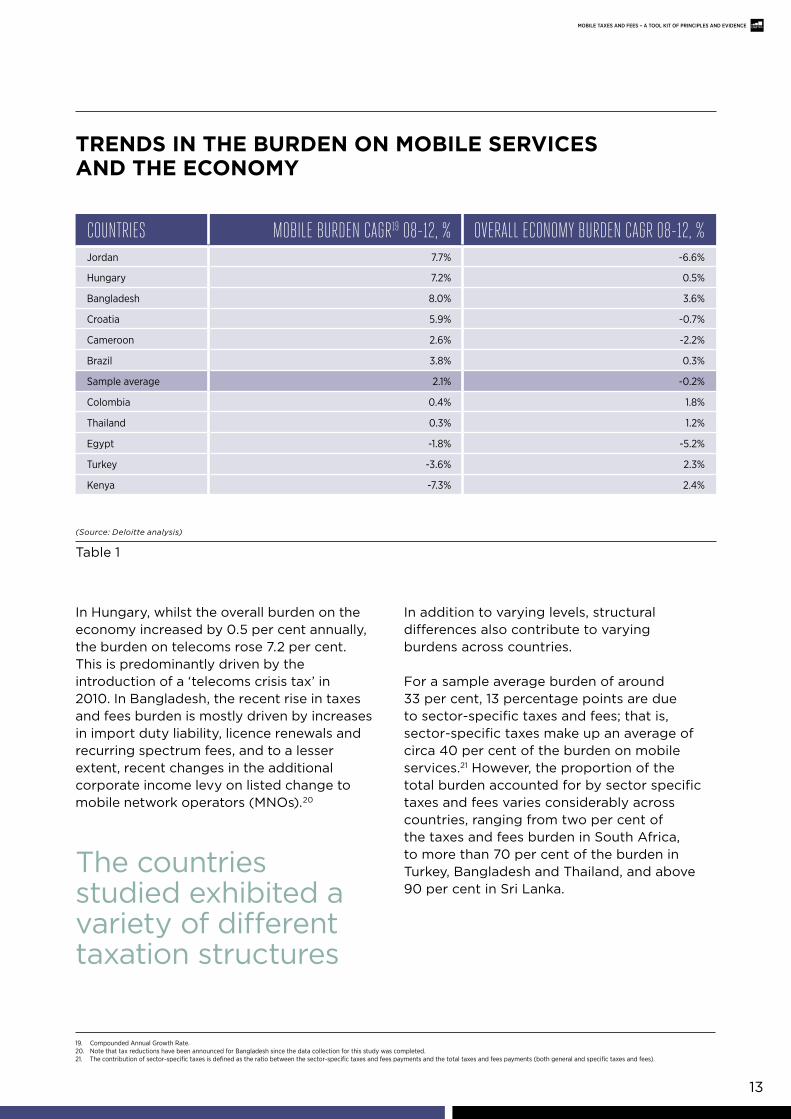
In Hungary, whilst the overall burden on the economy increased by 0.5 per cent annually, the burden on telecoms rose 7.2 per cent. This is predominantly driven by the introduction of a ‘telecoms crisis tax’ in 2010. In Bangladesh, the recent rise in taxes and fees burden is mostly driven by increases in import duty liability, licence renewals and recurring spectrum fees, and to a lesser extent, recent changes in the additional corporate income levy on listed change to mobile network operators (MNOs).20
The countries studied exhibited a variety of different taxation structures
In addition to varying levels, structural differences also contribute to varying burdens across countries.
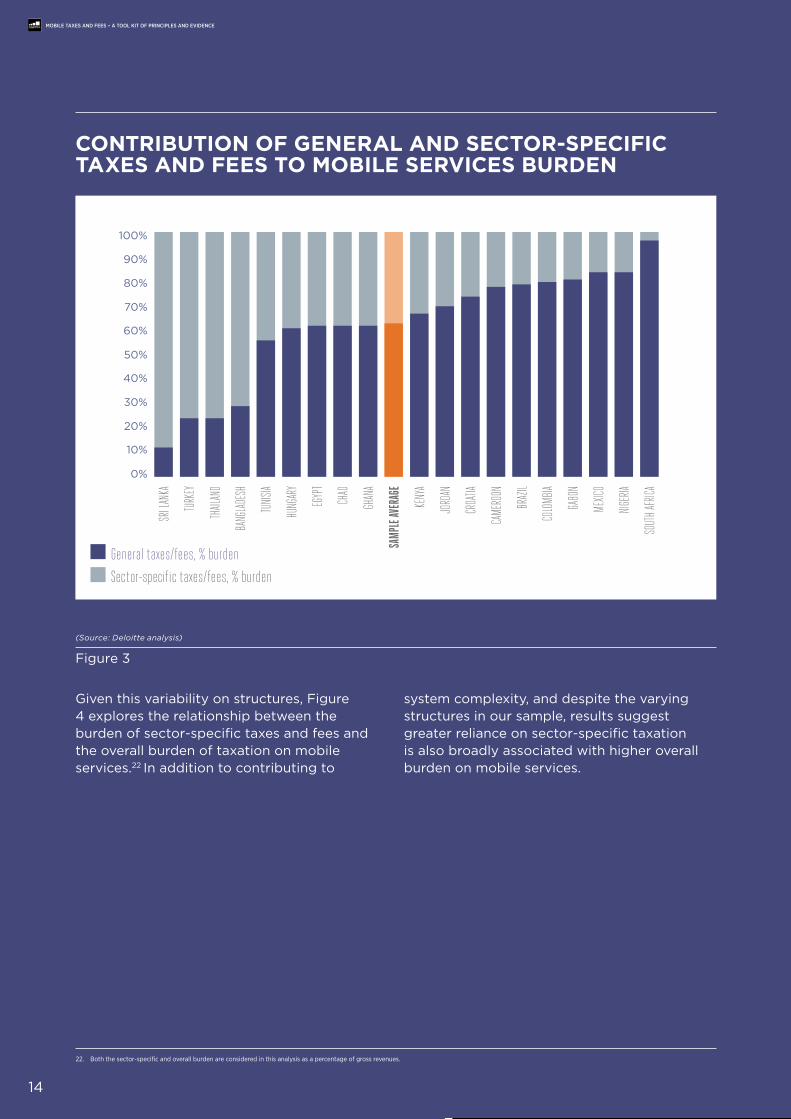
For a sample average burden of around 33 per cent, 13 percentage points are due to sector-specific taxes and fees; that is, sector-specific taxes make up an average of circa 40 per cent of the burden on mobile services.21 However, the proportion of the total burden accounted for by sector specific taxes and fees varies considerably across countries, ranging from two per cent of the taxes and fees burden in South Africa, to more than 70 per cent of the burden in Turkey, Bangladesh and Thailand, and above 90 per cent in Sri Lanka.
trends In tHe burden on MobIle servIces and tHe econoMY
(Source: Deloitte analysis)
Table 1
19. Compounded Annual Growth rate.20. Note that tax reductions have been announced for bangladesh since the data collection for this study was completed.21. The contribution of sector-specific taxes is defined as the ratio between the sector-specific taxes and fees payments and the total taxes and fees payments (both general and specific taxes and fees).
Countries Mobile burden CAGr19 08-12, % overAll eConoMy burden CAGr 08-12, %Jordan 7.7% -6.6%
Hungary 7.2% 0.5%
bangladesh 8.0% 3.6%
Croatia 5.9% -0.7%
Cameroon 2.6% -2.2%
brazil 3.8% 0.3%
Sample average 2.1% -0.2%
Colombia 0.4% 1.8%
Thailand 0.3% 1.2%
egypt -1.8% -5.2%
Turkey -3.6% 2.3%
Kenya -7.3% 2.4%
14
Mobile taxes and fees – a tool Kit of PRinCiPles and eVidenCe
(Source: Deloitte analysis)
contrIbutIon oF general and sector-specIFIc taXes and Fees to MobIle servIces burden
Figure 3
SRI L
ANKA
TURK
EY
THAIL
AND
BANG
LADE
SH
TUNIS
IA
HUNG
ARY
EGYP
T
CHAD
GHAN
A
SAMP
LE AV
ERAG
E
KENY
A
JORD
AN
CROA
TIA
CAME
ROON
BRAZ
IL
COLO
MBIA
GABO
N
MEXIC
O
NIGER
IA
SOUT
H AFR
ICA
0%
10%
20%
30%
40%
50%
60%
70%
80%
90%
100%
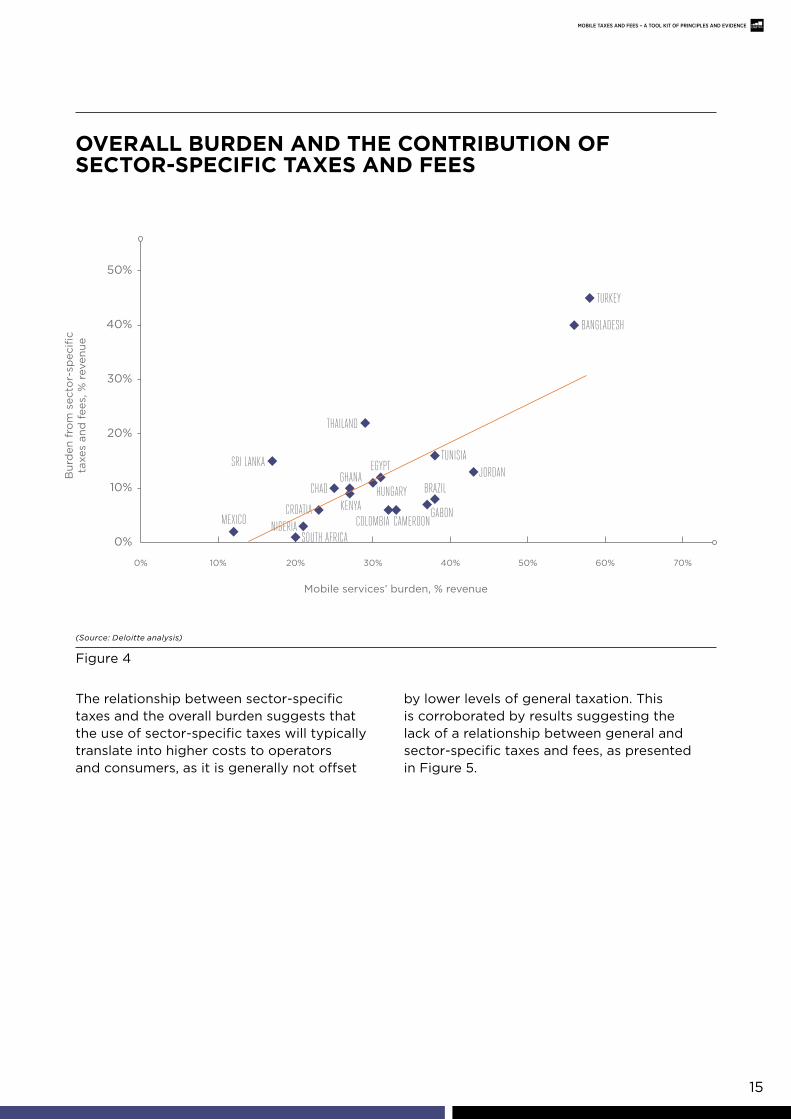
Given this variability on structures, Figure 4 explores the relationship between the burden of sector-specific taxes and fees and the overall burden of taxation on mobile services.22 In addition to contributing to
system complexity, and despite the varying structures in our sample, results suggest greater reliance on sector-specific taxation is also broadly associated with higher overall burden on mobile services.
22. both the sector-specific and overall burden are considered in this analysis as a percentage of gross revenues.
14
Mobile taxes and fees – a tool Kit of PRinCiPles and eVidenCe
General taxes/fees, % burden
sector-specific taxes/fees, % burden
15
Mobile taxes and fees – a tool Kit of PRinCiPles and eVidenCe
(Source: Deloitte analysis)
overall burden and tHe contrIbutIon oF sector-specIFIc taXes and Fees
Figure 4
BANGLADESH
CHAD
COLOMBIAKENYA
CAMEROONNIGERIAMEXICO
SRI LANKAGHANA
TURKEY
EGYPT
HUNGARYCROATIA
SOUTH AFRICA
BRAZIL
GABON
JORDANTUNISIA
THAILAND
0% 10% 20% 30% 40% 50% 60% 70%
0%
10%
20%
30%
40%
50%
The relationship between sector-specific taxes and the overall burden suggests that the use of sector-specific taxes will typically translate into higher costs to operators and consumers, as it is generally not offset
by lower levels of general taxation. This is corroborated by results suggesting the lack of a relationship between general and sector-specific taxes and fees, as presented in Figure 5.
Bur
den
fro
m s
ecto
r-sp
ecifi
cta
xes
and
fee
s, %
rev
enue
Mobile services’ burden, % revenue

16
Mobile taxes and fees – a tool Kit of PRinCiPles and eVidenCe
tHe relatIonsHIp between general and sector-specIFIc burden
(Source: Deloitte analysis)
Figure 5
BANGLADESH
CHAD
COLOMBIAKENYA
CAMEROONNIGERIAMEXICO
SRI LANKA
GHANA
TURKEY
EGYPTHUNGARY
CROATIA
SOUTH AFRICA
BRAZIL
GABON
JORDAN
TUNISIA
THAILAND
0% 5% 10% 15% 20% 25% 30% 35%0%
5%
10%
15%
20%
25%
30%
35%
40%
45%
50%
General and sector-specific taxes and fees can be further decomposed into smaller categories, for example:
• Expenditure-based taxation, including value added tax (VAT), and other consumer and operator expenditure taxes and fees;
• Income-based taxation levied on the company, including corporate taxes, social contributions by employers, and other non-regulatory taxes and fees which may be directly based on corporate income;
• Regulatory taxes and fees, including licence and spectrum fees, as well as other revenue-based levies, also impacting corporate income; and
• Customs or import duties on goods and services required for the provision and use of mobile services in a particular market.
On average, around 45 per cent of the burden is due to expenditure taxes and fees, 51 per cent is due to income and regulatory taxes and fees, which ultimately also impact corporate income, and four per cent is due to customs duties.
Burden from general taxes and fees, % revenue
Bur
den
fro
m s
ecto
r-sp
ecifi
cta
xes
and
fee
s, %
rev
enue
This is explored on a country-by-country basis in the following figure.
17
coMposItIon oF taXes and Fees burden23
(Source: Deloitte analysis)
Figure 6
0%
10%
20%
30%
40%
50%
60%
70%
80%
90%
100%
HUNG
ARY
TURK
EY
BRAZ
IL
GHAN
A
MEXIC
O
COLO
MBIA
KENY
A
JORD
AN
CHAD
EGYP
T
TUNIS
IA
BANG
LADE
SH
SAMP
LE AV
ERAG
E
CROA
TIA
GABO
N
CAME
ROON
NIGER
IA
SRI L
ANKA
THAIL
AND
ExpenditureRegulatoryIncomeCustoms
expenditure
regulatory
income
Customs
23. It is worth noting that the income-based and expenditure-based taxation are broadly defined. for example in Hungary, this figure suggests the income tax burden is about six per cent whereas the effective tax rate referenced in section 2.2 is two per cent. This is because for this analysis the income-based taxes include income tax, national insurance, corporate tax and other various other charges on the income of mobile operators.
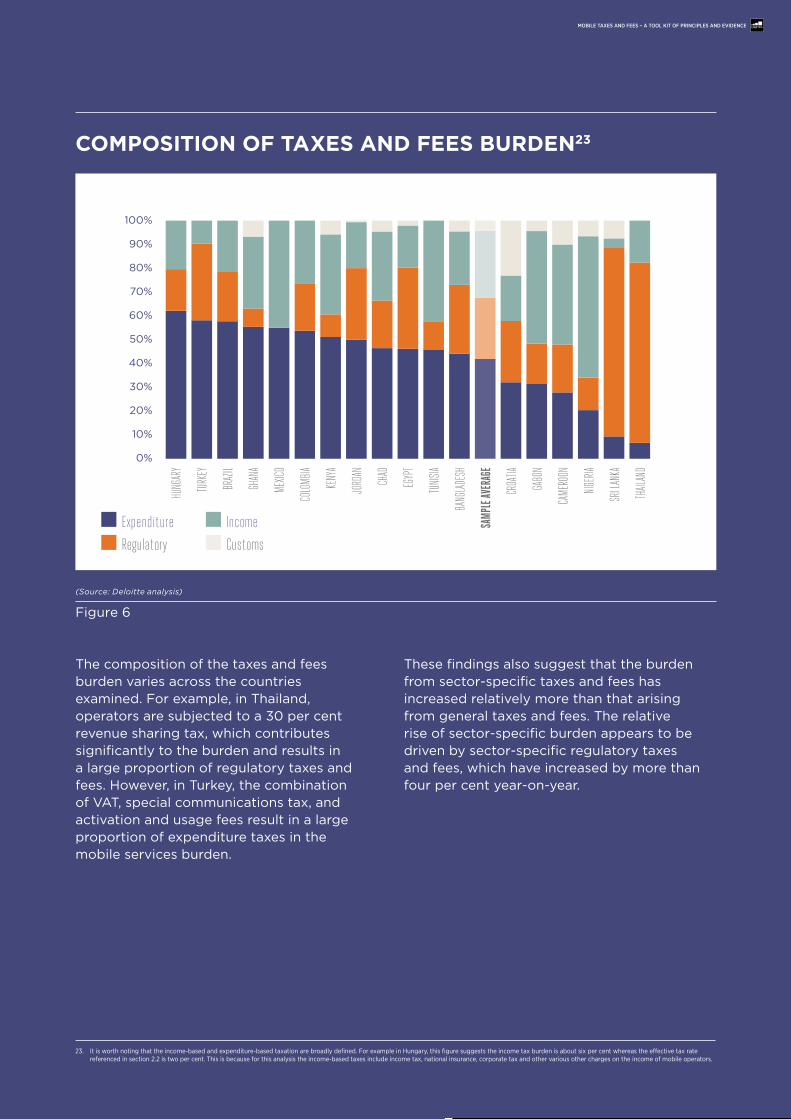
The composition of the taxes and fees burden varies across the countries examined. For example, in Thailand, operators are subjected to a 30 per cent revenue sharing tax, which contributes significantly to the burden and results in a large proportion of regulatory taxes and fees. However, in Turkey, the combination of VAT, special communications tax, and activation and usage fees result in a large proportion of expenditure taxes in the mobile services burden.
These findings also suggest that the burden from sector-specific taxes and fees has increased relatively more than that arising from general taxes and fees. The relative rise of sector-specific burden appears to be driven by sector-specific regulatory taxes and fees, which have increased by more than four per cent year-on-year.
Mobile taxes and fees – a tool Kit of PRinCiPles and eVidenCe
18
Mobile taxes and fees – a tool Kit of PRinCiPles and eVidenCe
cHanges In tHe coMposItIon oF tHe average burden on MobIle servIces
(Source: Deloitte analysis)
Table 2
2.2
dIFFerences In taX treatMent across sectors
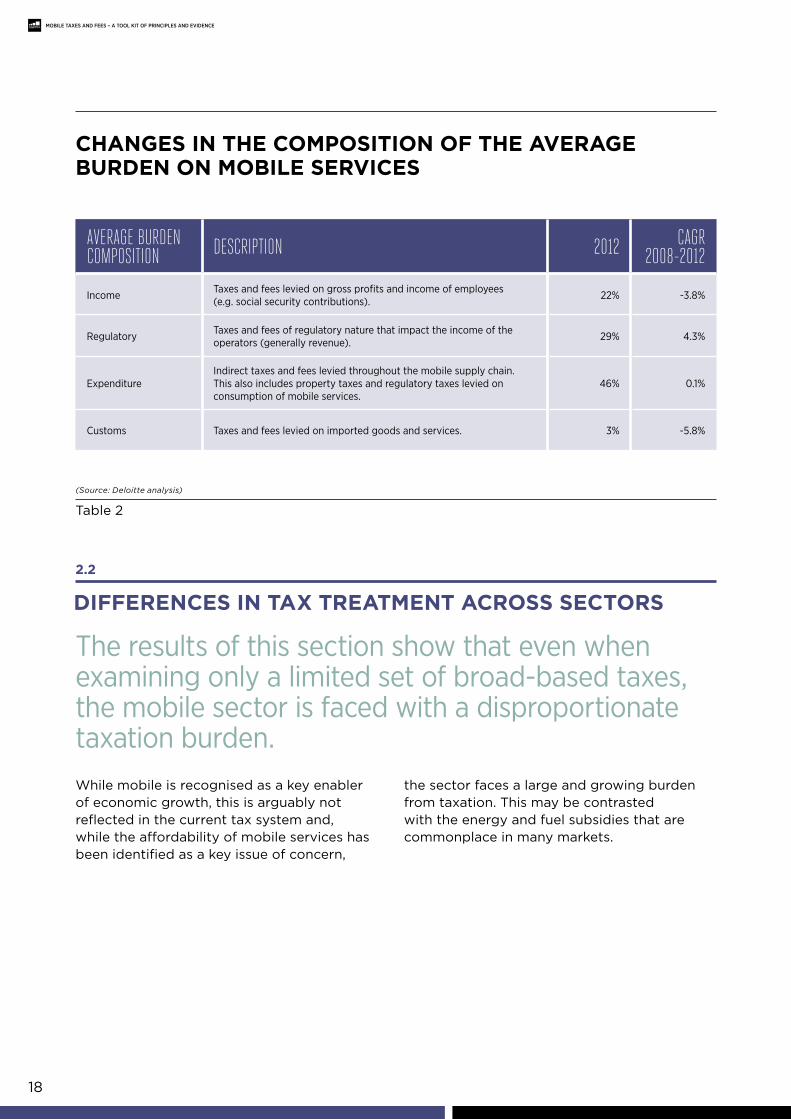
While mobile is recognised as a key enabler of economic growth, this is arguably not reflected in the current tax system and, while the affordability of mobile services has been identified as a key issue of concern,
the sector faces a large and growing burden from taxation. This may be contrasted with the energy and fuel subsidies that are commonplace in many markets.
AverAGe burdenCoMposition desCription 2012 CAGr
2008-2012
Income Taxes and fees levied on gross profits and income of employees (e.g. social security contributions). 22% -3.8%
regulatory Taxes and fees of regulatory nature that impact the income of the operators (generally revenue). 29% 4.3%
expenditureIndirect taxes and fees levied throughout the mobile supply chain. This also includes property taxes and regulatory taxes levied on consumption of mobile services.
46% 0.1%
Customs Taxes and fees levied on imported goods and services. 3% -5.8%
The results of this section show that even when examining only a limited set of broad-based taxes, the mobile sector is faced with a disproportionate taxation burden.
19
Mobile taxes and fees – a tool Kit of PRinCiPles and eVidenCe
eXaMples oF FIscal support For energY and Fuel prIces
(Source: International Monetary Fund (IMF) (2013), ‘Energy Subsidy Reform in Sub-Saharan Africa’; IMF (2013), ‘Case Studies on Energy Subsidy Reform: Lessons and Implications’)
Table 3
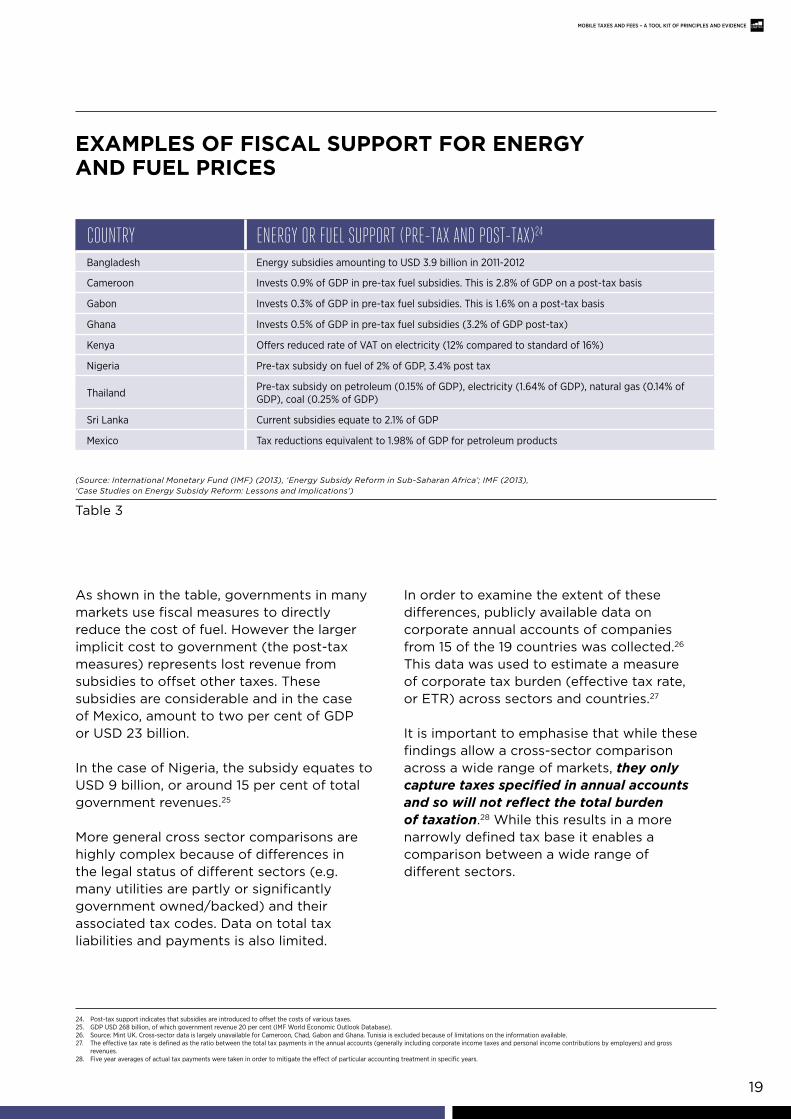
As shown in the table, governments in many markets use fiscal measures to directly reduce the cost of fuel. However the larger implicit cost to government (the post-tax measures) represents lost revenue from subsidies to offset other taxes. These subsidies are considerable and in the case of Mexico, amount to two per cent of GDP or USD 23 billion.
In the case of Nigeria, the subsidy equates to USD 9 billion, or around 15 per cent of total government revenues.25
More general cross sector comparisons are highly complex because of differences in the legal status of different sectors (e.g. many utilities are partly or significantly government owned/backed) and their associated tax codes. Data on total tax liabilities and payments is also limited.
In order to examine the extent of these differences, publicly available data on corporate annual accounts of companies from 15 of the 19 countries was collected.26 This data was used to estimate a measure of corporate tax burden (effective tax rate, or ETR) across sectors and countries.27
It is important to emphasise that while these findings allow a cross-sector comparison across a wide range of markets, they only capture taxes specified in annual accounts and so will not reflect the total burden of taxation.28 While this results in a more narrowly defined tax base it enables a comparison between a wide range of different sectors.
24. Post-tax support indicates that subsidies are introduced to offset the costs of various taxes.25. GDP uSD 268 billion, of which government revenue 20 per cent (IMf World economic Outlook Database).26. Source: Mint uK. Cross-sector data is largely unavailable for Cameroon, Chad, Gabon and Ghana. Tunisia is excluded because of limitations on the information available.27. The effective tax rate is defined as the ratio between the total tax payments in the annual accounts (generally including corporate income taxes and personal income contributions by employers) and gross
revenues.28. five year averages of actual tax payments were taken in order to mitigate the effect of particular accounting treatment in specific years.
Country enerGy or fuel support (pre-tAx And post-tAx)24
bangladesh energy subsidies amounting to uSD 3.9 billion in 2011-2012
Cameroon Invests 0.9% of GDP in pre-tax fuel subsidies. This is 2.8% of GDP on a post-tax basis
Gabon Invests 0.3% of GDP in pre-tax fuel subsidies. This is 1.6% on a post-tax basis
Ghana Invests 0.5% of GDP in pre-tax fuel subsidies (3.2% of GDP post-tax)
Kenya Offers reduced rate of VAT on electricity (12% compared to standard of 16%)
Nigeria Pre-tax subsidy on fuel of 2% of GDP, 3.4% post tax
Thailand Pre-tax subsidy on petroleum (0.15% of GDP), electricity (1.64% of GDP), natural gas (0.14% of GDP), coal (0.25% of GDP)
Sri Lanka Current subsidies equate to 2.1% of GDP
Mexico Tax reductions equivalent to 1.98% of GDP for petroleum products
20
Mobile taxes and fees – a tool Kit of PRinCiPles and eVidenCe
average cross-sector corporate taX burden coMpared agaInst tHat on post and telecoMs
(Source: Deloitte analysis
Figure 7
BANG
LADE
SH
SOUT
H AFR
ICA
JORD
AN
KENY
A
TURK
EY
MEXIC
O
COLO
MBIA
EGYP
T
THAIL
AND
SAMP
LE AV
ERAG
E
CROA
TIA
HUNG
ARY
SRI L
ANKA
BRAZ
IL
NIGER
IATelecoms and post ETR, % revenueAverage cross-sector ETR, % revenue
0%
2%
4%
6%
8%
10%
12%
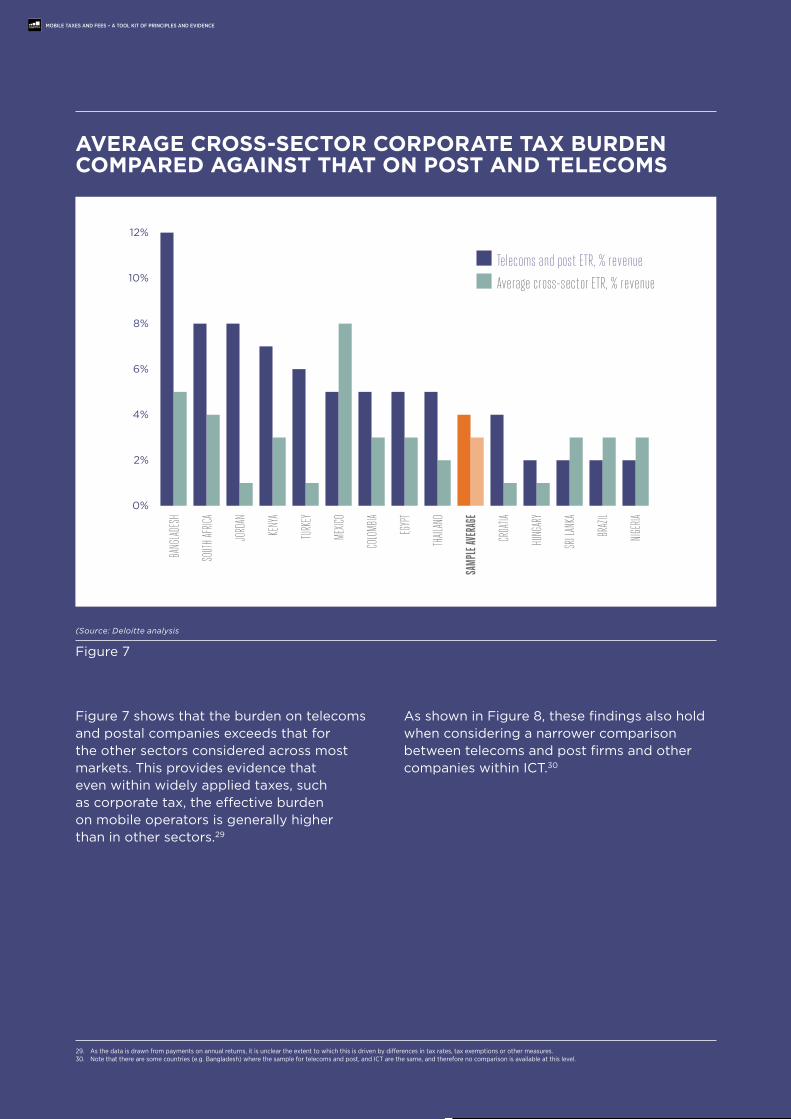
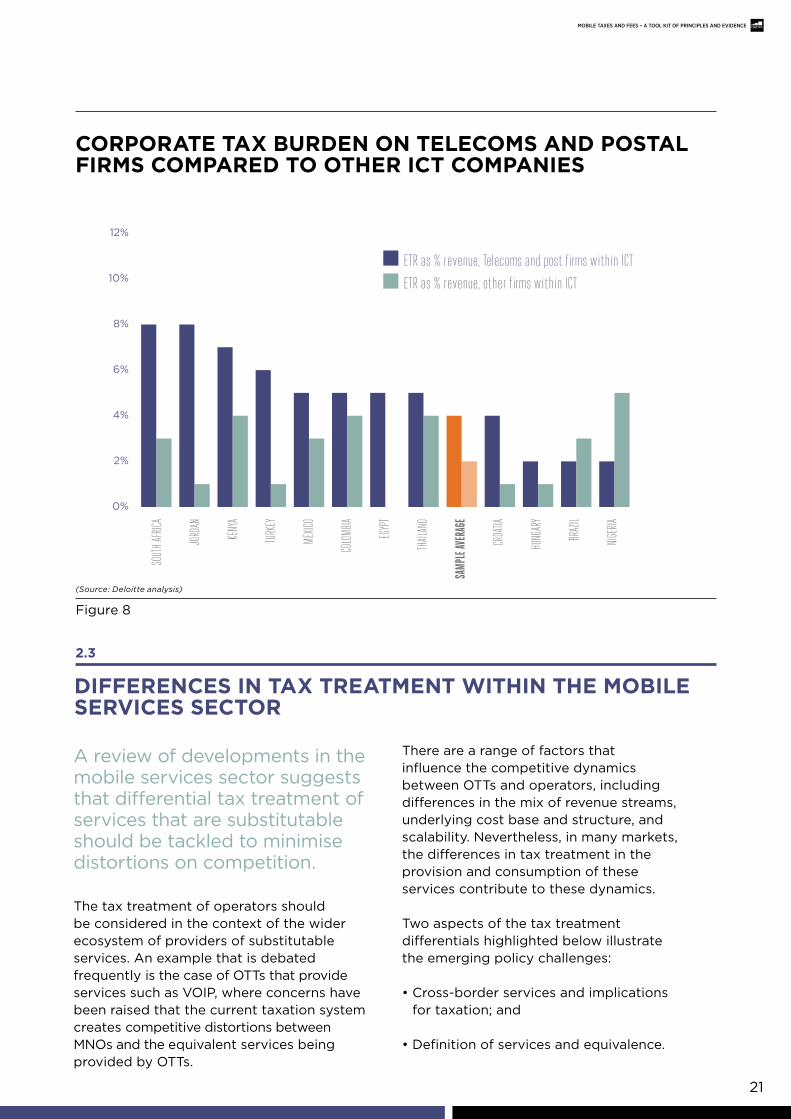
Figure 7 shows that the burden on telecoms and postal companies exceeds that for the other sectors considered across most markets. This provides evidence that even within widely applied taxes, such as corporate tax, the effective burden on mobile operators is generally higher than in other sectors.29
As shown in Figure 8, these findings also hold when considering a narrower comparison between telecoms and post firms and other companies within ICT.30
Mobile taxes and fees – a tool Kit of PRinCiPles and eVidenCe
telecoms and post etr, % revenue
Average cross-sector etr, % revenue
29. As the data is drawn from payments on annual returns, it is unclear the extent to which this is driven by differences in tax rates, tax exemptions or other measures.30. Note that there are some countries (e.g. bangladesh) where the sample for telecoms and post, and ICT are the same, and therefore no comparison is available at this level.
21
Mobile taxes and fees – a tool Kit of PRinCiPles and eVidenCe
0%
2%
4%
6%
8%
10%
12%
SOUT
H AFR
ICA
JORD
AN
KENY
A
TURK
EY
MEXIC
O
COLO
MBIA
EGYP
T
THAIL
AND
SAMP
LE AV
ERAG
E
CROA
TIA
HUNG
ARY
BRAZ
IL
NIGER
IA
ETR as % revenue, Telecoms and post firms within ICTETR as % revenue, other firms within ICT
etr as % revenue, telecoms and post firms within iCt
etr as % revenue, other firms within iCt
corporate taX burden on telecoMs and postal FIrMs coMpared to otHer Ict coMpanIes
(Source: Deloitte analysis)
Figure 8
2.3
dIFFerences In taX treatMent wItHIn tHe MobIle servIces sector
A review of developments in the mobile services sector suggests that differential tax treatment of services that are substitutable should be tackled to minimise distortions on competition.
The tax treatment of operators should be considered in the context of the wider ecosystem of providers of substitutable services. An example that is debated frequently is the case of OTTs that provide services such as VOIP, where concerns have been raised that the current taxation system creates competitive distortions between MNOs and the equivalent services being provided by OTTs.
There are a range of factors that influence the competitive dynamics between OTTs and operators, including differences in the mix of revenue streams, underlying cost base and structure, and scalability. Nevertheless, in many markets, the differences in tax treatment in the provision and consumption of these services contribute to these dynamics.
Two aspects of the tax treatment differentials highlighted below illustrate the emerging policy challenges:
• Cross-border services and implications for taxation; and
• Definition of services and equivalence.
22
Mobile taxes and fees – a tool Kit of PRinCiPles and eVidenCe
Tax residence of providers of substitutable servicesTraditionally, the provision of telecoms services requires, to a certain extent, local presence. For example, this may be in the form of a subsidiary of an international MNO or a branch, which would for tax purposes be considered a permanent establishment, and therefore, subject to the majority of the taxes and fees effective in the country.
Substitutable services, such as VoIP, can be offered without the same geographic ties. This therefore has important implications for tax liability. For example, in many markets, OTTs may offer services from other countries that offer advantages in terms of:
• Corporate income tax;
• Employment taxes (income tax, social security taxes);
• Regulatory taxes and fees, including licence fees and infrastructure taxes and fees (such as property taxes and fees on base stations); and/or
• VAT.
Indeed, concerns over the competitive effects of these have contributed to changes of the VAT rules in the European Union (EU), which has already had a special scheme for third country businesses since 2003. This scheme is due to be extended to cross-border services within the EU in 2015.31
Definition of services for tax and regulatory purposes
In addition to tax residence considerations, variation in the regulatory or legal status between traditional and non-traditional mobile services, such as VoIP, may also generate additional differences on their tax treatment.
• VoIP services are generally defined as ‘electronic services’ rather than telecom services. This can result in differences on the tax treatment. For example, a higher sales tax rate of 15 per cent that is applicable to mobile calls in Egypt does not apply to the electronic services, and therefore services provided by OTTs. The latter are subject to the general sales tax rate of 10 per cent. Services provided by OTTs may also escape special airtime excise and other sector-specific taxes levied on traditional telecommunications services.
• The regulatory/legal status of operators and OTTs may result in differences in licensing costs or tax treatment. For example, OTTs may not be regarded as a ‘telecom operator’. As a result, even if they were to reside in the country of operation, they could avoid higher sectorial corporate tax rates (e.g. in Bangladesh32) or special taxes applicable to the telecommunications sector (e.g. the telecommunications tax in Hungary).
• These regulatory differences may also have wider consequences for the firms in terms of their ability to set prices and compete on a level playing field. This is illustrated by the debate in France, recently covered in the press, about whether VoIP service providers ought to be brought under the telecommunications regulatory scheme.34
Risks related to the definition of these substitutable services have been recognised in some countries. In India, telecom authorities have recently published the rules for a new unified licensing scheme, which applies to all spectrum and technologies used by operators including VoIP.35 In the EU, the definitional differences in VAT legislation have been addressed by applying the same tax treatment to telecommunications and electronic services, which will be further strengthened by the 2015 changes.
31. european Commission overview of the VAT changes to telecommunications, broadcasting and e-services; urL: http://ec.europa.eu/taxation_customs/taxation/vat/how_vat_works/telecom/index_en.htm.32. bangladesh National board of revenue ‘Income tax at a glance 2012-13’.33. The Wall Street Journal (18/06/2013) ‘Hungary telecoms want a tax plan reversed to keep investing’.34. Ovum (2013), ‘Conflict between ArCeP and Skype highlights the uncertainty of VoIP regulation’.35. The Wall Street Journal (2/08/2013) ‘India issues unified telecom-licensing rules’.
23
Mobile taxes and fees – a tool Kit of PRinCiPles and eVidenCe
Taxes and fees: Empirical implicationsTaxes and fees levied on mobile services appear to be increasing over time and at a faster rate than other sectors in the economy.
This chapter considers the consequences of high taxes and fees burden on operators, consumers and governments. Specifically, this chapter draws on accepted principles of taxation, and considers alternatives that focus on minimising the distortionary impacts of the burden on mobile services.
3.
• Sector specific taxation is a key issue of concern to mobile operators. An analysis of the tax burden against GDP suggests that governments at varying stages of economic development have a number of alternatives available to them.
• High taxes hold back the growth of mobile services and the economic benefits they offer.
• New and emerging services are particularly sensitive to the application of taxation and there is a risk that governments may significantly delay or prevent their emergence if this is not properly accounted for.
• The complexity of mobile taxation is increasing the burden on the industry and deterring investment.
KeY Messages
24
Mobile taxes and fees – a tool Kit of PRinCiPles and eVidenCe
3.1
tHe negatIve econoMIc eFFects FroM HIgH MobIle taX
High mobile taxation levels raise service costs and reduce sector growth, resulting in negative economic effects. These adverse effects can occur even in markets with high penetration where they slow the adoption of new services such as mobile broadband, or have a disproportionate effect on low income consumers.
The economic contribution of the telecommunications sector, and in particular mobile services, is widely recognised.
Mobile services have been shown to contribute to:37
• Increases in investment and technological development;
• Improvements in productivity and economic growth;
• Reductions in income inequality and poverty; and
• Increases in government tax revenue.
To illustrate the magnitude of these effects, a 2007 study estimated that a 10 per cent increase in penetration may result in a 1.2 per cent increase in GDP.38 However, these benefits are contingent on access to these services by a wide spectrum of the population. Therefore, the affordability of mobile services is key to realising these effects. This is particularly important in emerging markets, which tend to have higher levels of income inequality and where a larger proportion of the population is likely to be sensitive to the costs of mobile services.
Previous research has found that as mobile services become more affordable, for example via reductions in the taxes and fees burden, the impact on economic growth is sufficiently high to offset, in the medium term, the direct negative effect on tax revenue.39 The outcome of lowering the burden would therefore be higher economic growth and similar, if not higher, government tax revenue.
36. Mireia fernández-Ardèvol, ‘Mobile Communication and Socio-economic Development: A Latin American Perspective’; united Nations Chronicle, 2011.37. See for example the GSMA and Deloitte (2007), Global mobile tax review 2006-07; and Mireia fernández-Ardèvol, ‘Mobile Communication and Socio-economic Development: A Latin American Perspective’; united
Nations Chronicle, 2011.38. The GSMA and Deloitte (2007), ‘Global mobile tax review 2006-07’.39. The GSMA (2007), ‘Taxation and growth in east Africa’.
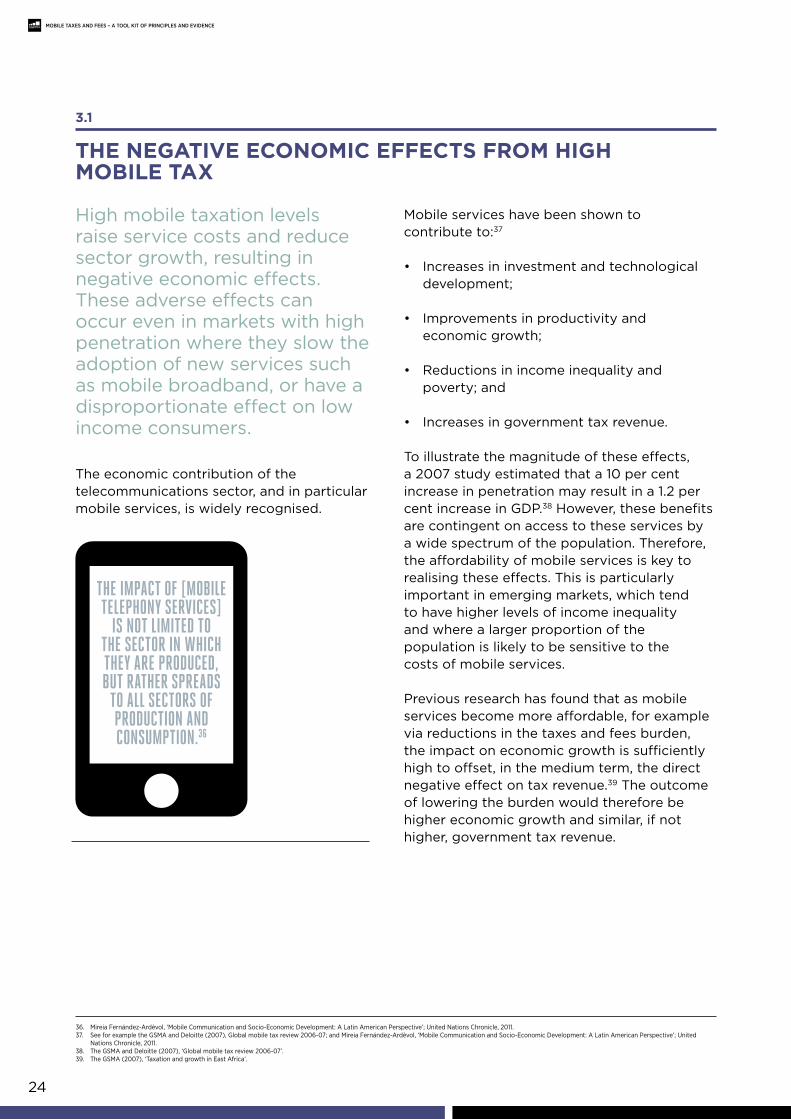
The impacT of [mobile Telephony services]
is noT limiTed To The secTor in which They are produced, buT raTher spreads
To all secTors of producTion and consumpTion.36
Mobile taxes and fees – a tool Kit of PRinCiPles and eVidenCe
25
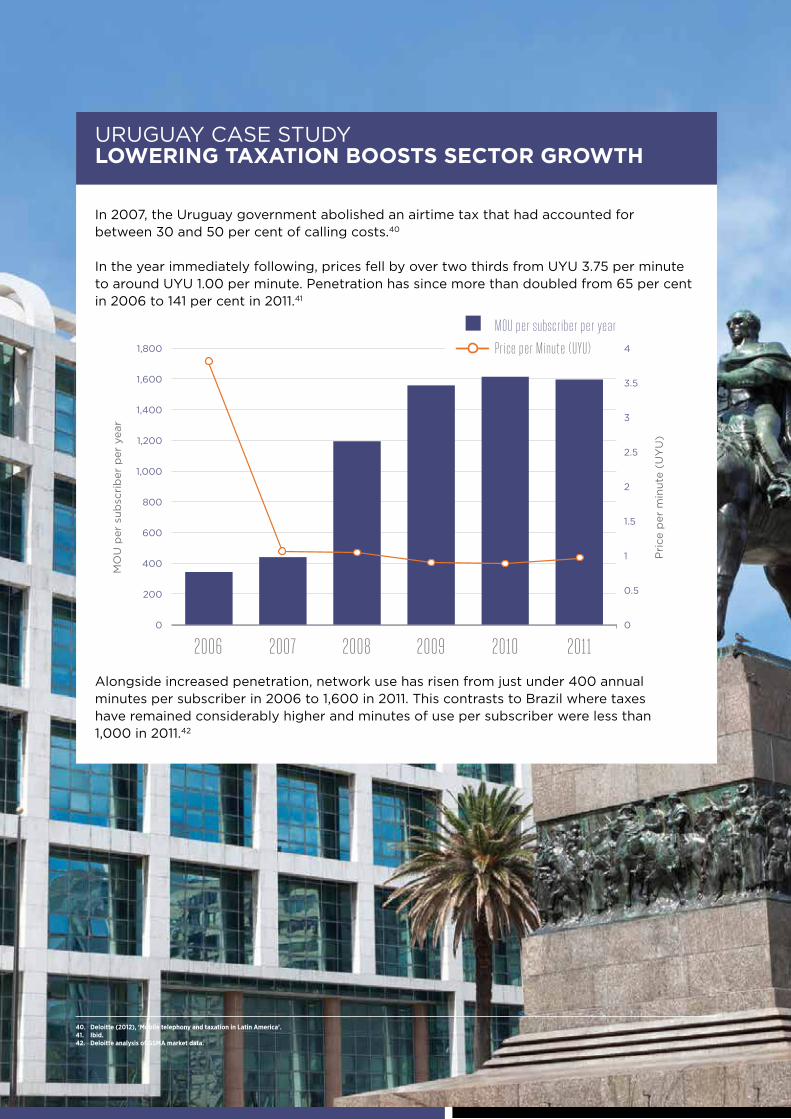
In 2007, the Uruguay government abolished an airtime tax that had accounted for between 30 and 50 per cent of calling costs.40
In the year immediately following, prices fell by over two thirds from UYU 3.75 per minute to around UYU 1.00 per minute. Penetration has since more than doubled from 65 per cent in 2006 to 141 per cent in 2011.41
Alongside increased penetration, network use has risen from just under 400 annual minutes per subscriber in 2006 to 1,600 in 2011. This contrasts to Brazil where taxes have remained considerably higher and minutes of use per subscriber were less than 1,000 in 2011.42
URUGUAY CASE STUDY lowerIng taXatIon boosts sector growtH
0
0.5
1
1.5
2
2.5
3
3.5
4
0
200
400
600
800
1,000
1,200
1,400
1,600
1,800
2006 2007 2008 2009 2010 2011P
rice
per
min
ute
(UY
U)
MO
U p
er s
ubsc
rib
er p
er y
ear
MOU per subscriber per year
Price per Minute (UYU)
40. deloitte (2012), ‘mobile telephony and taxation in latin america’.41. ibid.42. deloitte analysis of GSma market data.
Mou per subscriber per year
price per Minute (uyu)
MO
U p
er s
ubsc
rib
er p
er y
ear
Pri
ce p
er m
inut
e (U
YU
)
26
Mobile taxes and fees – a tool Kit of PRinCiPles and eVidenCe
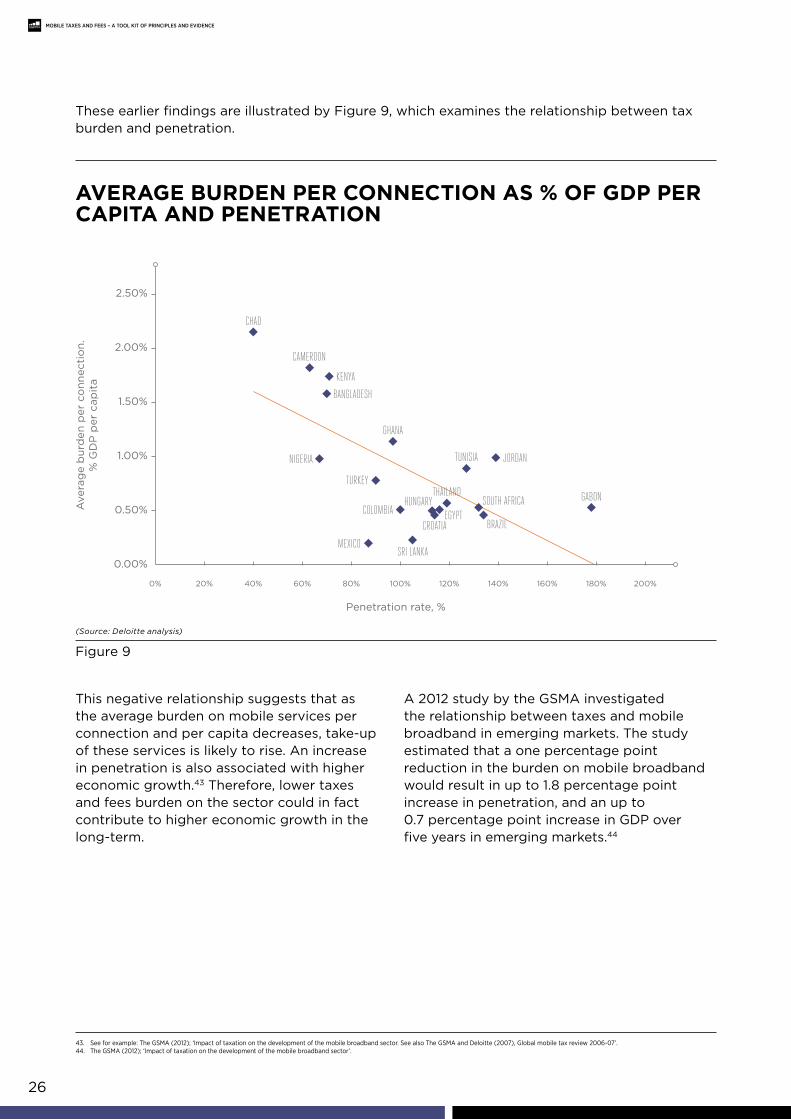
These earlier findings are illustrated by Figure 9, which examines the relationship between taxburden and penetration.
average burden per connectIon as % oF gdp per capIta and penetratIon
(Source: Deloitte analysis)
Figure 9
This negative relationship suggests that as the average burden on mobile services per connection and per capita decreases, take-up of these services is likely to rise. An increase in penetration is also associated with higher economic growth.43 Therefore, lower taxes and fees burden on the sector could in fact contribute to higher economic growth in the long-term.
A 2012 study by the GSMA investigated the relationship between taxes and mobile broadband in emerging markets. The study estimated that a one percentage point reduction in the burden on mobile broadband would result in up to 1.8 percentage point increase in penetration, and an up to 0.7 percentage point increase in GDP over five years in emerging markets.44
43. See for example: The GSMA (2012); ‘Impact of taxation on the development of the mobile broadband sector. See also The GSMA and Deloitte (2007), Global mobile tax review 2006-07’.44. The GSMA (2012); ‘Impact of taxation on the development of the mobile broadband sector’.
BANGLADESH
CHAD
COLOMBIA
KENYA
CAMEROON
NIGERIA
MEXICOSRI LANKA
GHANA
TURKEY
EGYPTHUNGARY
CROATIA
SOUTH AFRICA
BRAZIL
GABON
JORDANTUNISIA
THAILAND
0% 20% 40% 60% 80% 100% 120% 140% 160% 180% 200%
0.00%
0.50%
1.00%
1.50%
2.00%
2.50%
Ave
rag
e b
urd
en p
er c
onn
ecti
on.
%
GD
P p
er c
apit
a
Penetration rate, %
27
Mobile taxes and fees – a tool Kit of PRinCiPles and eVidenCe
45. Deloitte (2012), ‘Mobile telephony and taxation in Croatia’.46. Tax News (2012), ‘Croatian Lawmakers Abolish Mobile Phone Tax’.47. See for example reuters (2013), ‘eu-bound Croatia adopts investment law to boost economy’.
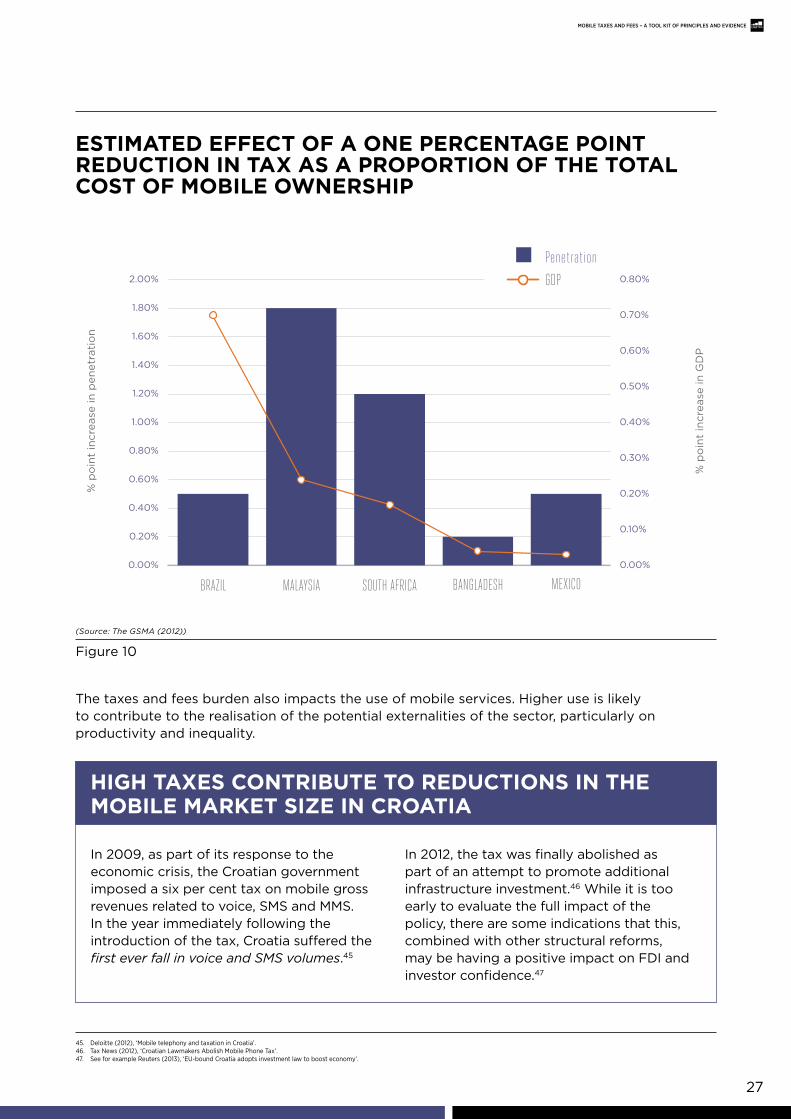
(Source: The GSMA (2012))
estIMated eFFect oF a one percentage poInt reductIon In taX as a proportIon oF tHe total cost oF MobIle ownersHIp
Figure 10
The taxes and fees burden also impacts the use of mobile services. Higher use is likely to contribute to the realisation of the potential externalities of the sector, particularly on productivity and inequality.
In 2009, as part of its response to the economic crisis, the Croatian government imposed a six per cent tax on mobile gross revenues related to voice, SMS and MMS. In the year immediately following the introduction of the tax, Croatia suffered the first ever fall in voice and SMS volumes.45
In 2012, the tax was finally abolished as part of an attempt to promote additional infrastructure investment.46 While it is too early to evaluate the full impact of the policy, there are some indications that this, combined with other structural reforms, may be having a positive impact on FDI and investor confidence.47
HIgH taXes contrIbute to reductIons In tHe MobIle MarKet sIze In croatIa
% p
oin
t in
crea
se in
pen
etra
tio
n
% p
oin
t in
crea
se in
GD
P
Penetration
GDP
0.00%
0.10%
0.20%
0.30%
0.40%
0.50%
0.60%
0.70%
0.80%
0.00%
0.20%
0.40%
0.60%
0.80%
1.00%
1.20%
1.40%
1.60%
1.80%
2.00%
BRAZIL MALAYSIA SOUTH AFRICA BANGLADESH MEXICO
% p
oin
t in
crea
se in
GD
P
% p
oin
t in
crea
se in
pen
etra
tio
n
penetration
Gdp

28
Mobile taxes and fees – a tool Kit of PRinCiPles and eVidenCe
Figure 11 explores the influence of mobile taxation burden on the minutes of use per connection.The findings suggest that generally, lower burden per capita is correlated with an increase in theminutes used.
As illustrated by the following case study, the positive impact of lowering the mobile taxationburden may be strong enough to more than offset the loss of tax receipts from reduced rates.
(Source: Deloitte analysis)
average burden per connectIon as % oF gdp per capIta and usage
Figure 11
BANGLADESH
COLOMBIA
KENYACAMEROON
NIGERIA
MEXICO
SRI LANKA
GHANA
TURKEY
EGYPT
HUNGARY
CROATIA
SOUTH AFRICA BRAZIL
TUNISIA
THAILAND
0 50 100 150 200 250 300 350 400
0.00%
0.50%
1.00%
1.50%
2.00%
2.50%
Ave
rag
e b
urd
en p
er c
onn
ecti
on.
%
GD
P p
er c
apit
a
Minutes of use per connection
29
Mobile taxes and fees – a tool Kit of PRinCiPles and eVidenCe
Brazil has an extremely complex and high taxation burden. In the case of mobile broadband, it has been estimated that tax increases the cost of use by 40 per cent and the cost of an average handset by 57 per cent.48
A 2012 study simulated the effect of a one percentage point reduction in the tax burden on mobile broadband by considering the impact on mobile penetration and subsequently on GDP growth.
The study considered two different penetration responses to the tax change as well as three different responses of GDP to the increased penetration. The overall findings were that, over five years, a one percentage point reduction in the tax burden would generate 520,000 – 1,000,000 subscribers, representing an increase in the tax base of two to four per cent.49
Further, in all the scenarios considered, the tax reduction on mobile broadband would be more than offset by the additional tax generated arising from increased consumption of the service and from wider economic growth.
CASE STUDY brazIl MobIle broadband: taX reForM can be revenue generatIve
Taxes and fees also influence the decisions of operators. In particular, higher burden on mobile services may translate into higher cost of operation and, other things being equal, reduce returns to capital employed and investment.50
A review of over 400 different studies found that, on average, a one per cent increase in the rate of tax on capital lead to a four per cent decrease in the level of FDI.51
While these impacts can be expected to differ across markets, they are likely to limit
the development of mobile communications infrastructure that is much needed for economic development. To illustrate the significance of the issue, World Bank research finds that lack of investment in telephony and other utilities is reducing growth by two per cent in sub-Saharan Africa, and productivity by as much as 40 per cent.52 As has been found in a number of studies, effective taxation and regulation of the sector is an essential requirement to unlock the potential of mobile broadband and other similar forms of telecoms infrastructure.53
48. The GSMA (2012), ‘The Impact of Taxation on the Development of the Mobile broadband Sector’.49. The GSMA (2012), ‘The Impact of Taxation on the Development of the Mobile broadband Sector’, p. 27.50. McKenzie, K. J. and Mintz, J. M. (1992); ‘Tax effects on the cost of capital’; National bureau of economic research; university of Chicago Press; Canada-uS tax comparisons p. 189 - 216.51. Mooij and ederveen (2005), ‘explaining the Variation in empirical estimates of Tax elasticities of foreign Direct Investment’.52. World bank (2009), ‘Transforming Africa’s infrastructure’.53. See for example World bank (2009), ‘Transforming Africa’s infrastructure’ also GSMA (2013), ‘bangladesh: Asia’s untapped mobile broadband opportunity’.
30
Mobile taxes and fees – a tool Kit of PRinCiPles and eVidenCe
3.2
IMpacts arIsIng FroM tHe structure oF tHe taXes and Fees burdenIn addition to the level, it is important to consider the impact of the type and structure of taxation. Taxes levied only on the mobile sector are likely to be particularly distortive.
These issues are considered in relation to:
• The use of sector-specific taxes and fees;
• Impact of mobile network externalities; and
• Complexity of the tax system.
Sector-specific taxation is a growing problem
A key trend observed in the cross-country data in Table 4 is the growth of mobile sector-specific taxation, rising at an average annual rate of 2.8 per cent between 2008 and 2012.
While sufficient data was not available to formally test the relationship between sector specifictaxation and market outcomes directly, simple correlation analysis finds results consistent with the impact of the overall tax burden, namely that higher rates are associated with:
• Lower contribution to economic growth;54
• Lower penetration growth; and
• Lower growth in use of mobile services.
54. The contribution to growth is measured by a proxy, the ratio of mobile sector growth to GDP growth, where growth is defined as a five year CAGr.
average taX burden coMposItIon across tIMe, general versus sector-specIFIc
(Source: Deloitte analysis)
Table 4
AverAGe burdenCoMposition desCription 2012 CAGr of seCtor
speCifiC shAre
General Taxes and fees that are broad-based 55% -2%
Sector-specific Taxes and fees that are levied on a sector specifically 45% 2.8%
Note: 11 of the 19 markets where time-series data was available

31
Mobile taxes and fees – a tool Kit of PRinCiPles and eVidenCe
Even if sector-specific taxation has an equivalent impact on penetration or usage to general taxation, the effect in practice is likely to be significantly more harmful. Since governments would need to apply a higher rate of tax to generate the same level of revenue as a general tax, the overall impact on penetration and economic welfare is expected to be considerably higher.
One potential explanation for the significant use of mobile specific taxes is that they are more cost efficient than taxes such as VAT for governments with limited or weak tax administration capabilities. However, as previously described, higher rates of tax on mobile have significant negative economic effects which in a number of cases have been shown to offset the revenue gain.
Equally, the weak correlation between GDP and the burden of tax on the sector demonstrates that there are viable alternatives to taxing mobile for countries across a range of different states of development.
sector-specIFIc burden and MobIle penetratIon across countrIes
(Source: Deloitte analysis)
Figure 12
COLOMBIA
KENYA
CAMEROON
CHAD
NIGERIA
MEXICO
SRI LANKA
GHANA
TURKEY
EGYPT
HUNGARY
CROATIASOUTH AFRICA
BRAZIL
TUNISIA
JORDAN
GABON
THAILAND
0% 20% 40% 60% 80% 100% 120% 140% 160% 180% 200%
0.00%
0.20%
0.40%
0.60%
0.80%
1.00%
1.20%BANGLADESH
Ave
rag
e se
cto
r sp
ecifi
c b
urd
en p
er c
onn
ecti
on.
%
GD
P p
er c
apit
a
Penetration rate, %
Mobile taxes and fees – a tool Kit of PRinCiPles and eVidenCe
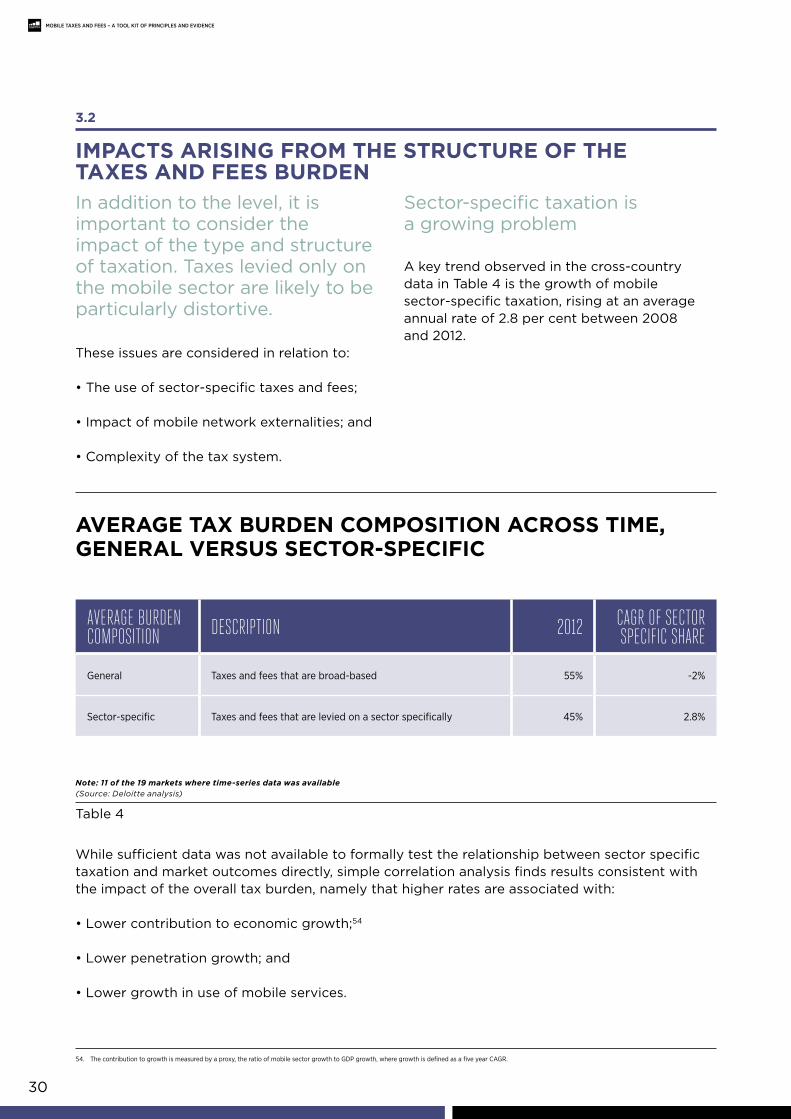
burden oF taX on tHe sector and gdp
(Source: Deloitte analysis)
Figure 13
COLOMBIAKENYA
CAMEROON
CHAD
BANGLADESH
NIGERIA
MEXICO
SRI LANKA
GHANA
TURKEY
EGYPT HUNGARY
CROATIA
SOUTH AFRICA
BRAZILTUNISIAJORDAN
GABON
THAILAND
0 5,000 10,000 15,000 20,000 25,0000%
10%
20%
30%
40%
50%
60%
70%
The network externalities effects arising from the mobile services sector should also be considered when evaluating the impacts of taxes and fees.
Taxes and fees that obstruct consumer access to mobile services, such as mobile handset taxes, are likely to be particularly harmful.
The impact of taxation is likely to be particularly significant for new and emerging services where customers are especially price sensitive. This is because the benefits to mobile services increase with the number of users, while the cost of the tax will remain constant (other things being equal).
32
Mobile taxes and fees – a tool Kit of PRinCiPles and eVidenCe
Ove
rall
bur
den
% o
f se
cto
r re
venu
e
GDP per capita in PPP
Consumption taxes on mobile should account for mobile network externalities
33
Mobile taxes and fees – a tool Kit of PRinCiPles and eVidenCe
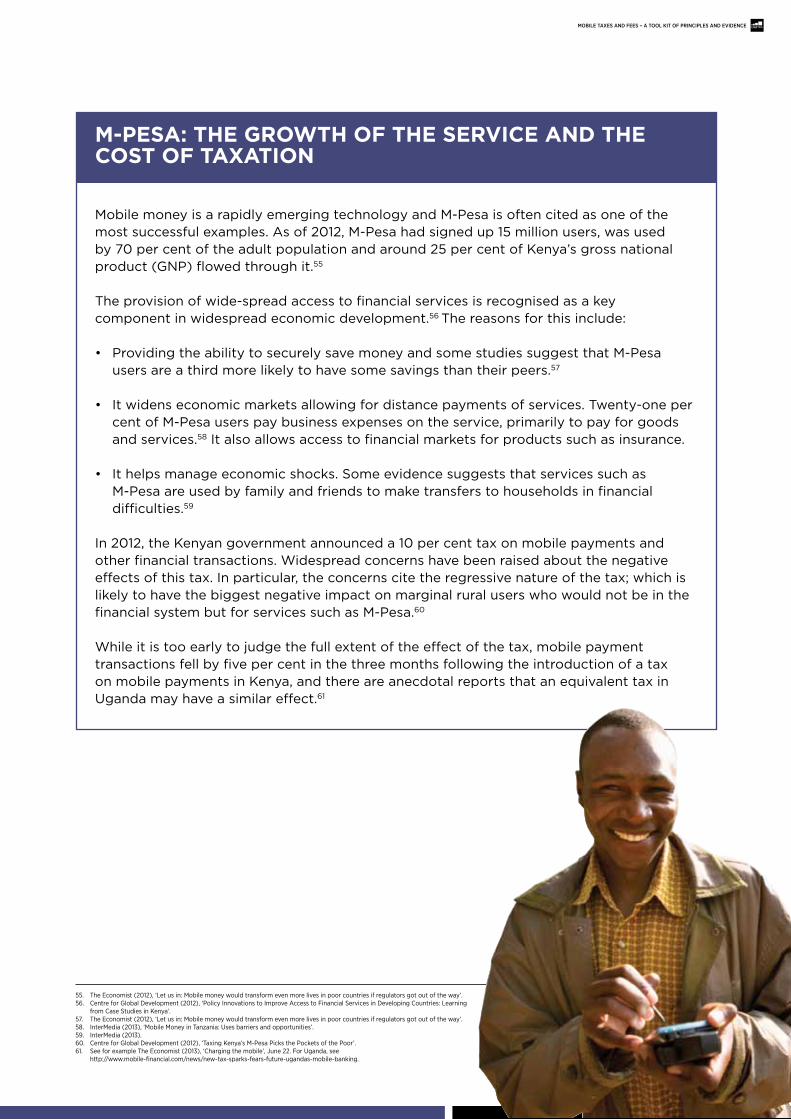
Mobile money is a rapidly emerging technology and M-Pesa is often cited as one of the most successful examples. As of 2012, M-Pesa had signed up 15 million users, was used by 70 per cent of the adult population and around 25 per cent of Kenya’s gross national product (GNP) flowed through it.55
The provision of wide-spread access to financial services is recognised as a key component in widespread economic development.56 The reasons for this include:
• Providing the ability to securely save money and some studies suggest that M-Pesa users are a third more likely to have some savings than their peers.57
• It widens economic markets allowing for distance payments of services. Twenty-one per cent of M-Pesa users pay business expenses on the service, primarily to pay for goods and services.58 It also allows access to financial markets for products such as insurance.
• It helps manage economic shocks. Some evidence suggests that services such as M-Pesa are used by family and friends to make transfers to households in financial difficulties.59
In 2012, the Kenyan government announced a 10 per cent tax on mobile payments and other financial transactions. Widespread concerns have been raised about the negative effects of this tax. In particular, the concerns cite the regressive nature of the tax; which is likely to have the biggest negative impact on marginal rural users who would not be in the financial system but for services such as M-Pesa.60
While it is too early to judge the full extent of the effect of the tax, mobile payment transactions fell by five per cent in the three months following the introduction of a tax on mobile payments in Kenya, and there are anecdotal reports that an equivalent tax in Uganda may have a similar effect.61
M-pesa: tHe growtH oF tHe servIce and tHe cost oF taXatIon
55. The economist (2012), ‘Let us in: Mobile money would transform even more lives in poor countries if regulators got out of the way’.56. Centre for Global Development (2012), ‘Policy Innovations to Improve Access to financial Services in Developing Countries: Learning
from Case Studies in Kenya’.57. The economist (2012), ‘Let us in: Mobile money would transform even more lives in poor countries if regulators got out of the way’.58. InterMedia (2013), ‘Mobile Money in Tanzania: uses barriers and opportunities’.59. InterMedia (2013).60. Centre for Global Development (2012), ‘Taxing Kenya’s M-Pesa Picks the Pockets of the Poor’.61. See for example The economist (2013), ‘Charging the mobile’, June 22. for uganda, see
http://www.mobile-financial.com/news/new-tax-sparks-fears-future-ugandas-mobile-banking.
34
Mobile taxes and fees – a tool Kit of PRinCiPles and eVidenCe
Throughout the course of this study the complexity and transparency of the tax system was raised in a number of different ways. For example:
• In Brazil the general challenges with the complexity of the tax system was identified by a number of studies and, indeed, was described as ‘irrational’ by the Communications Minister of Brazil.62
• Concerns were raised over the consistency and equity of tax collection in Bangladesh.63
• Hungary’s crisis tax on the telecoms sector has been identified as a source of considerable uncertainty, for domestic and international investors.64 Some reports suggest the tax has led to a reduction in FDI to Hungary.65
Empirical research has found that greater levels of tax uncertainty result in reduced levels of investment.66 Similar results have been reported for wider issues associated with the complexity of the tax system:
It has been well established by numerous Investment Climate Surveys, DoingBusiness surveys, and the work of the Foreign Investment Advisory Service in Sub-Saharan Africa and the Middle East and North Africa that tax constitutes a significant barrier to investment.
Vague tax provisions, multiple tax instruments, arbitrary implementation of tax laws, limited opportunities for redress of taxpayers’ grievances, and laws that giveexcessive discretion to tax authorities trouble existing investors and deter potential investors.67
62. The GSMA and Deloitte (2012), ‘brazil Mobile Observatory 2012’.63. ODI (2010), ‘Assessing the economic Impact of competition: findings from bangladesh’.64. financial Times (2010), ‘Hungary unveils “crisis” tax on business’.65. euronews (2013), ‘Hungary wants to sever IMf connections’.66. edminston (2007), ‘Tax uncertainty and Investment: A Cross-Country empirical examination’.67. International finance Group (2009), ‘A handbook for tax simplification’.
Tax system uncertainty and complexity
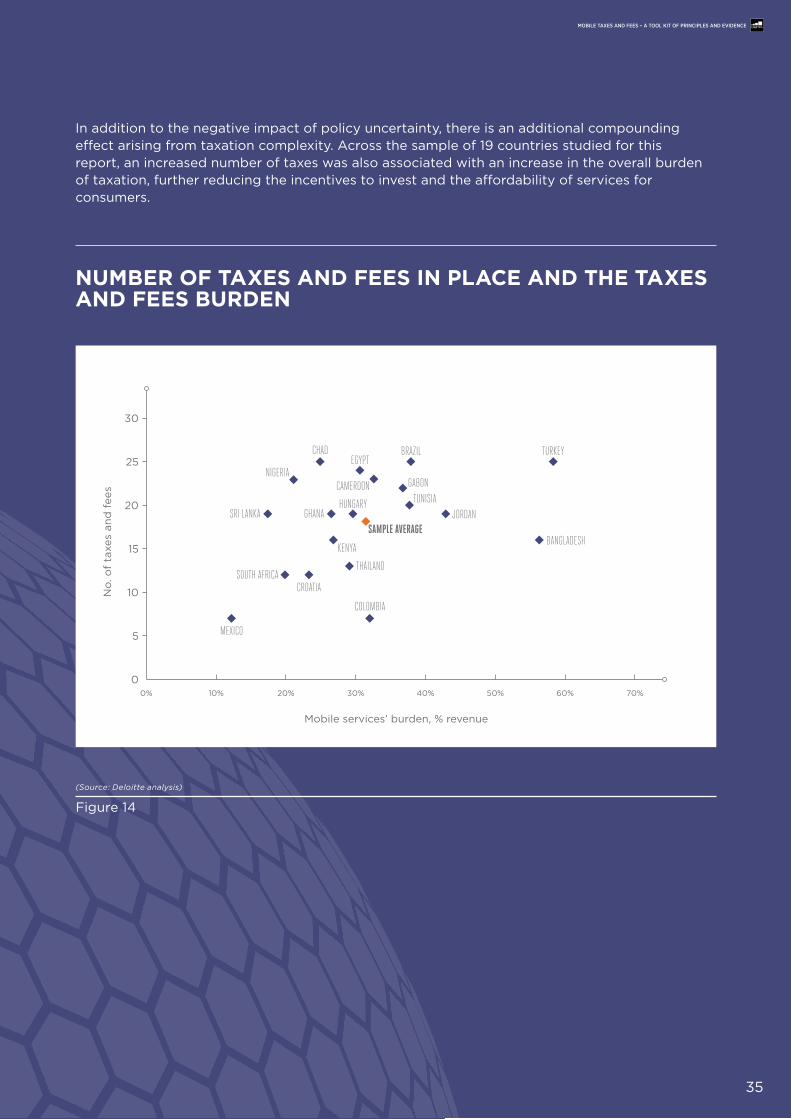
nuMber oF taXes and Fees In place and tHe taXes and Fees burden
(Source: Deloitte analysis)
Figure 14
0% 10% 20% 30% 40% 50% 60% 70%
0
5
10
15
20
25
30
COLOMBIA
KENYA
CAMEROON
CHAD
BANGLADESH
NIGERIA
MEXICO
SRI LANKA GHANA
TURKEYEGYPT
HUNGARY
CROATIASOUTH AFRICA
BRAZIL
TUNISIAJORDAN
SAMPLE AVERAGE
GABON
THAILAND
No
. of
taxe
s an
d f
ees
Mobile services’ burden, % revenue
In addition to the negative impact of policy uncertainty, there is an additional compounding effect arising from taxation complexity. Across the sample of 19 countries studied for this report, an increased number of taxes was also associated with an increase in the overall burden of taxation, further reducing the incentives to invest and the affordability of services for consumers.
35
Mobile taxes and fees – a tool Kit of PRinCiPles and eVidenCe
36
Mobile taxes and fees – a tool Kit of PRinCiPles and eVidenCeMobile taxes and fees – a tool Kit of PRinCiPles and eVidenCe
Priorities and practicalities of mobile taxation reformThis report has presented the international consensus regarding the structure of taxation and how this may apply to the telecoms sector. It has also examined the current structures of taxation and the extent to which these differ from recognised best practice.
This final chapter considers the practical challenges with addressing the gaps between current taxation structures and best practice; and identifies a number of priority areas for reform.
4.
• Governments understandably require tax revenue and there are few painless ways of raising this. All forms of taxation will distort behaviour to some extent and there is a large body of research that has examined how to raise revenue through taxation whilst minimising the negative effects.
• The mobile sector generates large positive externalities that enhance economic productivity, economic growth and consumer welfare. Yet across the 19 markets studied in this report, the sector is frequently subjected to high sector-
specific taxation that has been shown to hold back the growth of the sector and the positive contribution it is able to make.
• Recognising the long-term nature of tax reform, this report has identified three priority areas for government namely, addressing the:
• Scale and complexity of regulatory fees;
• Excessive taxes and fees applied to new and emerging services; and
• Access charges on mobile services.
KeY Messages
37
Mobile taxes and fees – a tool Kit of PRinCiPles and eVidenCe
The general consensus on tax policy for both developing and developed markets is that there are operational and wider economic benefits from rebalancing tax systems towards broad-based68 taxation, and particular broad-based taxes and fees on consumption of goods and services (see Appendix A). One reason for this is that broader and expenditure based taxes are thought to be less distortionary on investment, both in terms of the level and composition. Although the efficient policy mix will differ across markets, a shift in policy-making is generally recognised as likely to enhance social welfare.
However, the analysis in earlier chapters on current taxation practices across 19 markets highlights a high and growing burden on the mobile sector, much of which is driven by levies that are specific to the mobile sector. Moreover, these charges are specific to the services provided by MNOs and, in a number of cases, would not capture equivalent
services provided by non-traditional entities such as OTTs.
High effective rates of taxation on the mobile sector have been repeatedly shown to reduce the growth of the sector and, in that process, harm economic growth and productivity. This problem is expected to be exacerbated when the tax treatment differs between economic sectors, further distorting the allocation of resources.
Across the 19 markets, the mobile sector is transferring approximately USD 13.5 billion to the state through sector-specific taxes and fees. Reforming the use of tax instruments on this scale will therefore be complicated and time consuming. Nevertheless, governments can take immediate actions to reform the mobile taxation system. The following sub-sections discuss three priority areas for reform, before considering the practicalities of reform given the budget constraints faced by governments.
Most of the 19 markets considered in this study experienced an increase in the overall burden on mobile services across time; nearly 40 per cent of the revenue raised from the mobile sector came in the form of mobile specific taxation. In some countries it was considerably above this — between 70 and 90 per cent in Sri Lanka, Turkey, Thailand and Bangladesh.
A large component of these sector specific taxes relates to regulatory charges, which represent an important component of market regulation. Spectrum and numbering fees, for example, are mechanisms to facilitate
the efficient allocation of scarce resources between competing services and providers.69
However, during the course of this study, concerns were raised about the number, complexity and costs of the regulatory fees levied on the sector. Interviews with operators also revealed concerns that in some markets regulatory fees were also being used as revenue raising measures, and that this was creating significant market uncertainty.
4.1
prIorItY areas For reForM
68. In practice this equates to broadly defined bases for taxation, rate variations that are limited and effective enforcement of tax compliance.69. International Telecommunications union (2012); ‘Digital Dividend: Insights for spectrum decisions’, August.
4.1.1 system complexity and burden from regulatory taxes and fees
38
Mobile taxes and fees – a tool Kit of PRinCiPles and eVidenCe
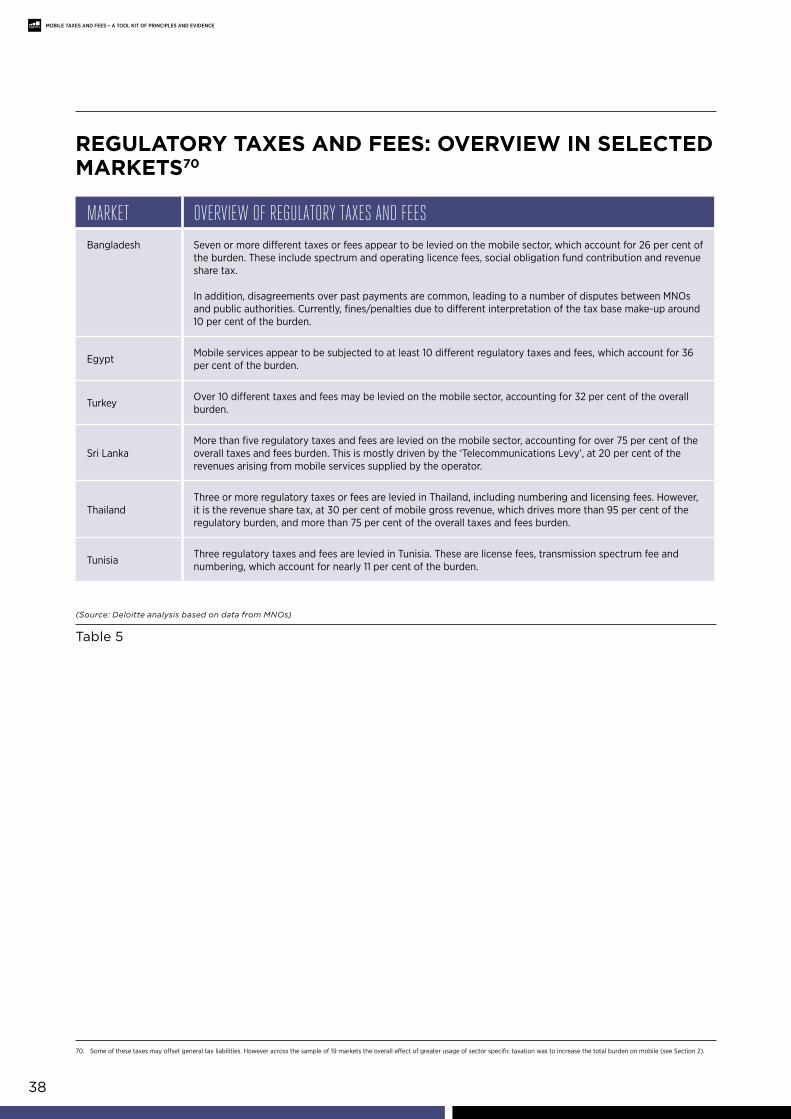
regulatorY taXes and Fees: overvIew In selected MarKets70
(Source: Deloitte analysis based on data from MNOs)
Table 5
70. Some of these taxes may offset general tax liabilities. However across the sample of 19 markets the overall effect of greater usage of sector specific taxation was to increase the total burden on mobile (see Section 2).
MArket overview of reGulAtory tAxes And feesbangladesh Seven or more different taxes or fees appear to be levied on the mobile sector, which account for 26 per cent of
the burden. These include spectrum and operating licence fees, social obligation fund contribution and revenue share tax.
In addition, disagreements over past payments are common, leading to a number of disputes between MNOs and public authorities. Currently, fines/penalties due to different interpretation of the tax base make-up around 10 per cent of the burden.
egypt Mobile services appear to be subjected to at least 10 different regulatory taxes and fees, which account for 36 per cent of the burden.
Turkey Over 10 different taxes and fees may be levied on the mobile sector, accounting for 32 per cent of the overall burden.
Sri LankaMore than five regulatory taxes and fees are levied on the mobile sector, accounting for over 75 per cent of the overall taxes and fees burden. This is mostly driven by the ‘Telecommunications Levy’, at 20 per cent of the revenues arising from mobile services supplied by the operator.
ThailandThree or more regulatory taxes or fees are levied in Thailand, including numbering and licensing fees. However, it is the revenue share tax, at 30 per cent of mobile gross revenue, which drives more than 95 per cent of the regulatory burden, and more than 75 per cent of the overall taxes and fees burden.
Tunisia Three regulatory taxes and fees are levied in Tunisia. These are license fees, transmission spectrum fee and numbering, which account for nearly 11 per cent of the burden.
39
Mobile taxes and fees – a tool Kit of PRinCiPles and eVidenCe
While these examples are intended to be illustrative, they highlight a couple of themes that are relevant when considering regulatory taxes and fees:
• High level burden driven by regulatory taxes and fees, in some cases notably higher than the burden arising from general taxation;
• High number of levies, increasing the complexity and operational burden in the taxes and fees system; and
• They are a source of significant dispute between regulators and operators.
These issues are particularly acute where the taxation structure results in competitive distortions in the market. These distortions are most likely where firms offering competing services are subjected to different rates of taxation as with the OTT discussion in Section 2.3.
In general, regulatory taxes and fees are expected to impact the deployment of network infrastructure,71 both in terms of the level and type of investment in the network and, ultimately, the contribution of mobile services to economic growth. Reasons for this include:
• Reduced return to capital employed, impacting operators’ decisions to continue to invest;
• Increased uncertainty on future liability, which is also likely to impact investment decisions; and
• Decreased return from the sector, in comparison to other sectors, further driving investment away from telecoms and into more profitable markets.
Consequently the application of regulatory fees to the sector should be limited and carefully targeted. There is need for some specific regulatory fees as part of an effective regulatory structure. However, more widespread use of these charges as revenue raising measures is likely to distort the market for mobile services, leading to reduced economic growth and welfare.
4.1.2 taxation on new and emerging services
Mobile services in developing markets have predominantly focussed on SMS and mobiletelephony. However, as 3G/4G and broadband penetration grows, so do the range of applications and services targeted at the needs of users in developing markets, including:72
• Business support services such as smartphone based inventory and sales management service;
• English language training; and
• Localised weather forecasts.
These relatively new services and products enhance the value to consumers, resulting in a self-reinforcing cycle of increased penetration and enhanced services. These also expand the sector’s interconnectedness with other sectors, and therefore, its contribution to overall economic growth.
71. Gorecki, Hennessy, Lyons (2011); ‘How impact fees and local planning regulation can influence deployment of telecoms infrastructure’; eSrI; urL: http://www.tara.tcd.ie/bitstream/2262/64057/1/WP401.pdf.72. The GSMA, ‘Digital empowerment in the developing world.’
40
Mobile taxes and fees – a tool Kit of PRinCiPles and eVidenCe
Apps are enabling new services across developing and developed markets such as e-education, health, agriculture and finance.73 Mobile technology is often central to the additional value from these apps, enabling amongst other things, peer-to-peer communication between individuals, geolocation services and camera-enabled features.74
Focusing on eHealth services specifically, these have been estimated at approximately USD 100-160 billion annually.75 Mobile operators are playing a crucial role in the development of the sector by broadening the reach of health services beyond traditional clinical settings. The examples of this are widespread and range from basic technology, such as SMS messages, to reduce the cost of missed appointments through mobile technology. This enables health professionals to provide services remotely that would not be practical or cost-effective to deliver directly.76 In rural areas of developing markets these latter technologies can prove particularly valuable.
MobIle Helps to enable eHealtH and a wIder ‘app econoMY’
73. The GSMA (2012), ‘Digital empowerment in the developing world’.74. Nesta (2010), ‘What’s App?’.75. boston Consulting Group (2008), ‘Making the eHealth Connection: Global Partners, Local Solutions’; research and Markets (2010), ‘The Global Size of the Healthcare IT market’. Cited in The GSMA (2012), ‘Integrating
Healthcare: The role and Value of Mobile Operators in eHealth’.76. The GSMA (2012), ‘Integrating Healthcare: The role and Value of Mobile Operators in eHealth’.77. Goolsbee (2006), ‘The value of broadband and the deadweight loss of taxing new technology’.
New services in early stages of implementation would tend to be more costly and consumers are also likely to be more price sensitive. The combination of consumer price sensitivity and investordemand uncertainty means that taxation of new services can lead to considerable deadweight losses. For example, one empirical study of the emergence of broadband in the US found that:
Applying a tax to broadband in 1998 would have reduced the quantity and generated a large deadweight loss in the conventional model but when the analysis accounts for the fixed costs of entering new markets, taxes would have also delayed entry in several markets.
In these places, the lost consumer surplus from delay is an additional deadweight loss and it more than doubles the estimated efficiency costs of taxation. The conventional model also dramatically understates the share of the tax burden that would have been borne by consumers.77
Therefore, high burden on emerging and innovative services may become an obstacle for their viability and adoption.
Within a reform framework that seeks to rebalance the system toward broad-based taxation, it is also possible to consider a different type of intervention for products and services that are innovative and expected to enhance productivity and reduce costs of production across sectors, provided that competitive distortions are not created in the process.
For example, governments may wish to introduce a policy that favours innovative products, and adjust this gradually towards the general level of taxes and fees as the product matures.
This could mitigate the impact of the burden on the take-up and use of new services, such as mobile payments. As the case of M-Pesa shows, the consumption of new and innovative services can be highly sensitive to the imposition of taxation.
41
Mobile taxes and fees – a tool Kit of PRinCiPles and eVidenCe
78. See for example Deloitte, the GSMA and Cisco (2012); ‘What is the impact of mobile telephony on economic growth?’; urL: http://www.gsma.com/publicpolicy/wp-content/uploads/2012/11/gsma-deloitteimpact-mobile-telephony-economic-growth.pdf
79. See for example the GSMA and Deloitte (2012), ‘brazil Mobile Observatory’.80. Deloitte (2011), ‘Mobile telephony and taxation in Kenya’.81. Ibid.82. The GSMA (2012), ‘Taxation of mobile telecoms: Sector-specific taxes on consumption and international traffic‘.83. for a general discussion see Deloitte (2011), ‘Mobile telephony and taxation in Kenya’. for equality discussion see references provided in the GSMA (2011), ‘Kenyan government boosts economic productivity by
removing tax on handset sales’.84. CIO (2013), ‘Kenyan government VAT on ICT will hurt the underprivileged’. http://www.cio.co.ke/news/main-stories/kenyan-government-vat-on-ict-will-hurt-the-underprivileged.
tHe beneFIts oF reMovIng Handset taXes In KenYa
The cost of access has been widely recognised as a barrier to adoption and, in recognition of this, the Kenyan government exempted mobile handsets from VAT in 2009.80 In the three years following, the VAT reduction contributed to an increase in handset sales of 200 per cent and a penetration rise from 50 to 70 per cent.81
Over the same period, the contribution of mobile telephony to the Kenyan economy grew by almost 250 per cent, while mobile-related employment has increased by 67 per cent.
Combined with wider market price reductions, the VAT exemption helped to increase access to a wide range of mobile services, with mobile usage increasing by 113 per cent.82 This has been recognised as improving economic growth, productivity and economic/social equality.83
More recent government proposals to re-introduce VAT across the ICT sector have caused widespread concerns around the negative impact on rural poverty, mobile penetration and economic growth.84
4.1.3 taxes and fees on network access
Taxes and fees are levied on consumer access to mobile services, although they vary in level and nature across markets. These include taxes on subscription, activation, SIM and/or connection as well handset taxes and fees.
Examples of direct taxes on access include Turkey, where handsets are taxed at approximately 25 per cent, in addition to VAT and other charges. In Nigeria, Jordan, Ghana, Cameroon, Chad and Gabon, handsets are also taxed on top of VAT.
A relatively high burden on access to mobile services is of particular concern because rising mobile penetration appears to be associated with higher economic growth and enhanced productivity.78 The taxes also disproportionately harm the poorest consumers and those in rural communities.79

42
Mobile taxes and fees – a tool Kit of PRinCiPles and eVidenCe
Addressing these taxation problems will impose a short-term fiscal cost on government. It is difficult to generalise about policy solutions to overcome this as different countries face different pressures, policy priorities and challenges. However, the findings in this report point to three broad options for governments to consider.
4.2.1 Harmonise and simplify taxation on mobile
Across the globe, mobile is at the forefront of wide range of digital innovation. These innovations are far from limited to developed markets as, for example, one study found that 85 per cent of innovations in mobile financial services have emanated from developing countries.85
However, many aspects of current taxation structures act to limit the use of these services and the productivity gains and innovation from wider usage. In the 19 countries studied:
• Bangladesh, Chad, Egypt and Turkey all levied some form of SIM tax or activation tax. These taxes depress the overall penetration of mobile services and the range of uses.
• A number of countries levy a charge on handsets, including Ghana which recently reintroduced a tax on the import of handsets. Some reports suggest that the abolition of the tax had played an important role in increasing the affordability and range of phones available in Ghana.86
Similarly analysts have predicted that the recent imposition of a handset charge in India will put the growth of penetration and internet adoption back by 1.5 years, with a particularly damaging effect on penetration growth in rural areas.87
4.2
transItIonIng to a More eFFectIve sYsteM oF taXatIon
85. boor, Olivera and Veloso (2013), ‘unusual suspects? Innovation by users in developing countries: evidence from mobile banking services’, September.86. http://www.thestatesmanonline.com/index.php/business/622-phone-dealers-protest-20-import-tax-asmanufacturers-threaten-to-leave-ghana.87. The economic Times (2013), ‘budget 2013 impact: Increased tax on mobiles to hit sales, 3G rollout’.
Mobile taxes and fees – a tool Kit of PRinCiPles and eVidenCe
Addressing the imbalance between mobile and other sectors offers the opportunity to improve economic growth and productivity. The range, quality and affordability of services for consumers would be enhanced by reducing competitive distortions with alternative providers. Increased certainty over future taxation could also be expected to enhance investment incentives for operators.
Early reform of taxes such as these will help countries to lock in the economic benefits of mobile and enhance the long-run economic prospects of the country. Furthermore, as the value of the services grows over time, the fiscal cost of reform will be bigger and more difficult to manage. Consequently, an additional benefit from early reform of taxation is that it may be achieved at a lower fiscal cost to government, with less need for subsequent rebalancing of taxation elsewhere.
4.2.2 consider phased reductions of taxes on established services
In very broad terms, economies are generally assumed to take around five years to adjust to taxation changes. A phased programme of tax reductions on mobile may therefore offer governments the opportunity to benefit from a stronger economic contribution from mobile whilst limiting the short-run fiscal costs.
To explore this issue, simulations were developed for four markets spanning Africa, Asia, Latin America and Europe. Each simulation examined the impact of different demand responses to the tax change, and economic responses to the subsequent growth of the mobile sector.
The basic structure of the model is as specified in Figure 15. For each of the four markets the model is populated with actual operators and market data as well as prevailing tax rates.
The specific markets are not identified by name as the intention of this simulation is to illustrate some of the key factors influencing market outcomes, rather than a tax impact analysis for specific markets.
43
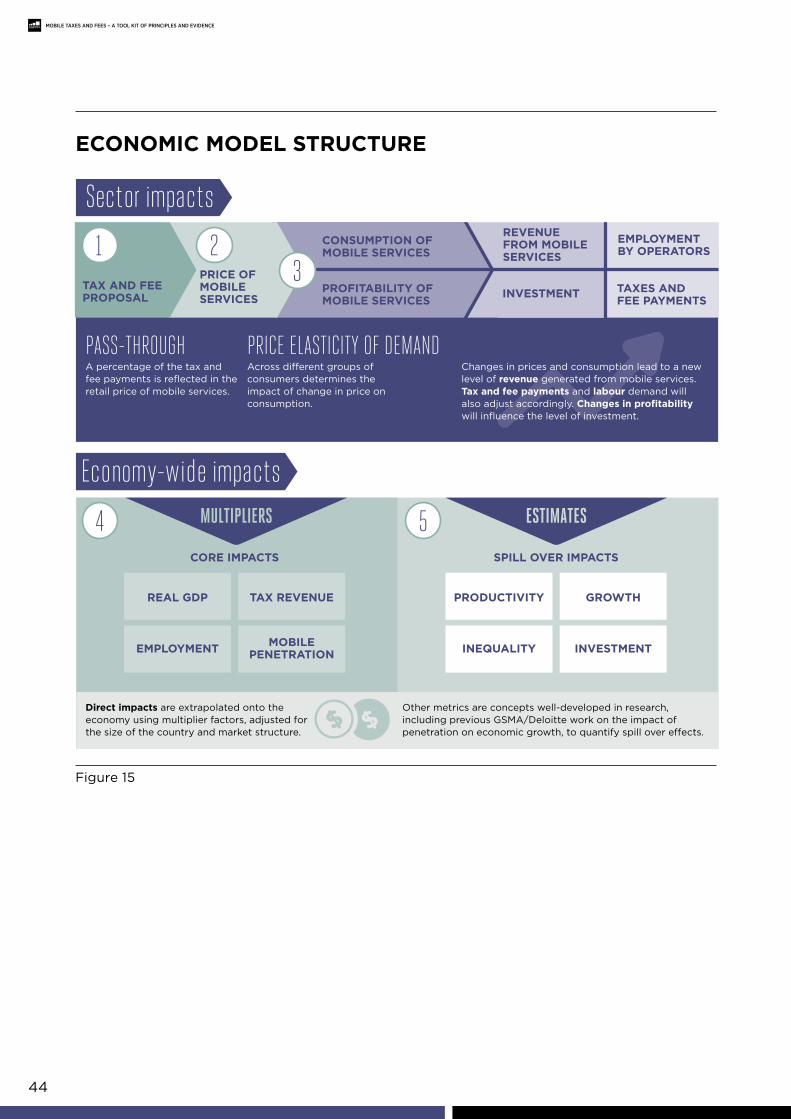
44
Mobile taxes and fees – a tool Kit of PRinCiPles and eVidenCe
econoMIc Model structure
Figure 15
PRICE OFMOBILE SERVICES
Economy-wide impacts
TAX AND FEE PROPOSAL
EMPLOYMENTBY OPERATORS
TAXES AND FEE PAYMENTS
REVENUE FROM MOBILE SERVICES
INVESTMENT
MULTIPLIERS
CORE IMPACTS SPILL OVER IMPACTS
ESTIMATES
CONSUMPTION OF MOBILE SERVICES
PASS-THROUGHA percentage of the tax and fee payments is reflected in the retail price of mobile services.
Direct impacts are extrapolated onto the economy using multiplier factors, adjusted for the size of the country and market structure.
Other metrics are concepts well-developed in research, including previous GSMA/Deloitte work on the impact of penetration on economic growth, to quantify spill over e�ects.
PRICE ELASTICITY OF DEMANDAcross di�erent groups of consumers determines the impact of change in price on consumption.
Changes in prices and consumption lead to a new level of revenue generated from mobile services. Tax and fee payments and labour demand will also adjust accordingly. Changes in profitability will influence the level of investment.
GROWTHPRODUCTIVITY
INVESTMENTINEQUALITY
TAX REVENUEREAL GDP
MOBILEPENETRATIONEMPLOYMENT
PROFITABILITY OF MOBILE SERVICES
23
4 5
1
Sector impacts
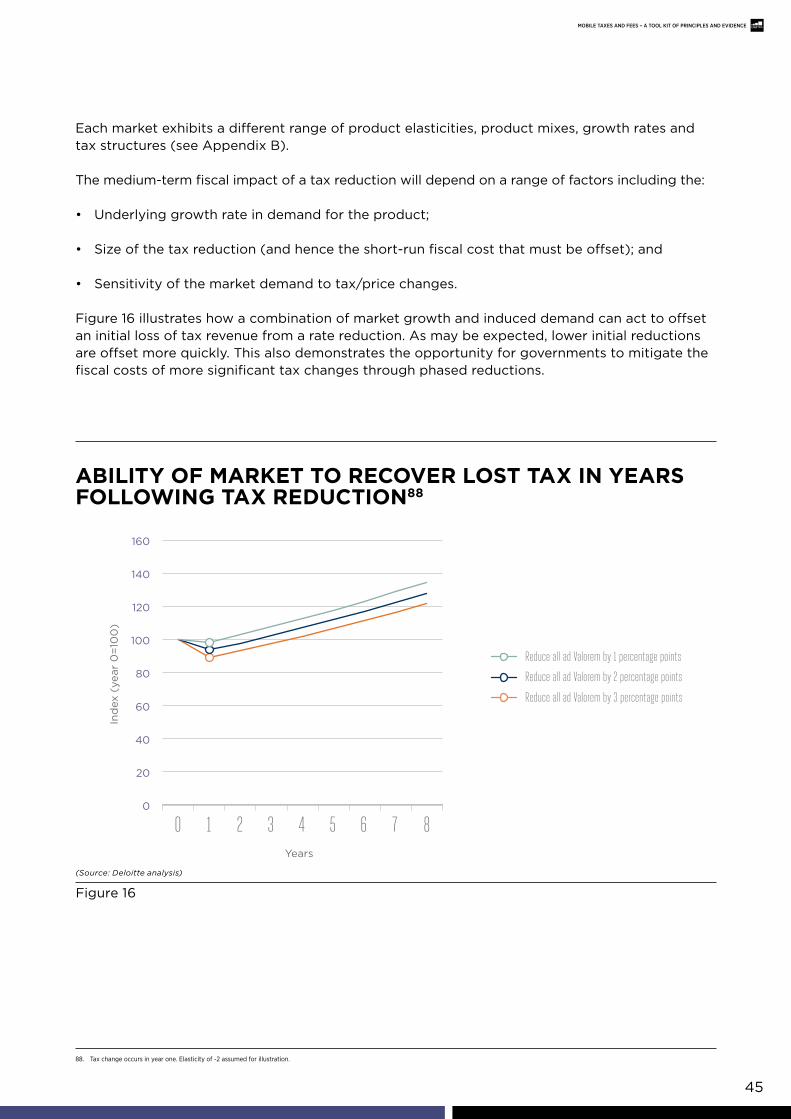
45
Mobile taxes and fees – a tool Kit of PRinCiPles and eVidenCe
Each market exhibits a different range of product elasticities, product mixes, growth rates and tax structures (see Appendix B).
The medium-term fiscal impact of a tax reduction will depend on a range of factors including the:
• Underlying growth rate in demand for the product;
• Size of the tax reduction (and hence the short-run fiscal cost that must be offset); and
• Sensitivity of the market demand to tax/price changes.
Figure 16 illustrates how a combination of market growth and induced demand can act to offset an initial loss of tax revenue from a rate reduction. As may be expected, lower initial reductions are offset more quickly. This also demonstrates the opportunity for governments to mitigate the fiscal costs of more significant tax changes through phased reductions.
88. Tax change occurs in year one. elasticity of -2 assumed for illustration.
abIlItY oF MarKet to recover lost taX In Years FollowIng taX reductIon88
(Source: Deloitte analysis)
Figure 16
Reduce all ad Valorem by 2 percentage points
Reduce all ad Valorem by 3 percentage points
Reduce all ad Valorem by 1 percentage points
0
20
40
60
80
100
120
140
160
0 1 2 3 4 5 6 7 8Years
Ind
ex (
year
0=
100
)In
dex
(ye
ar 0
=10
0)
Years
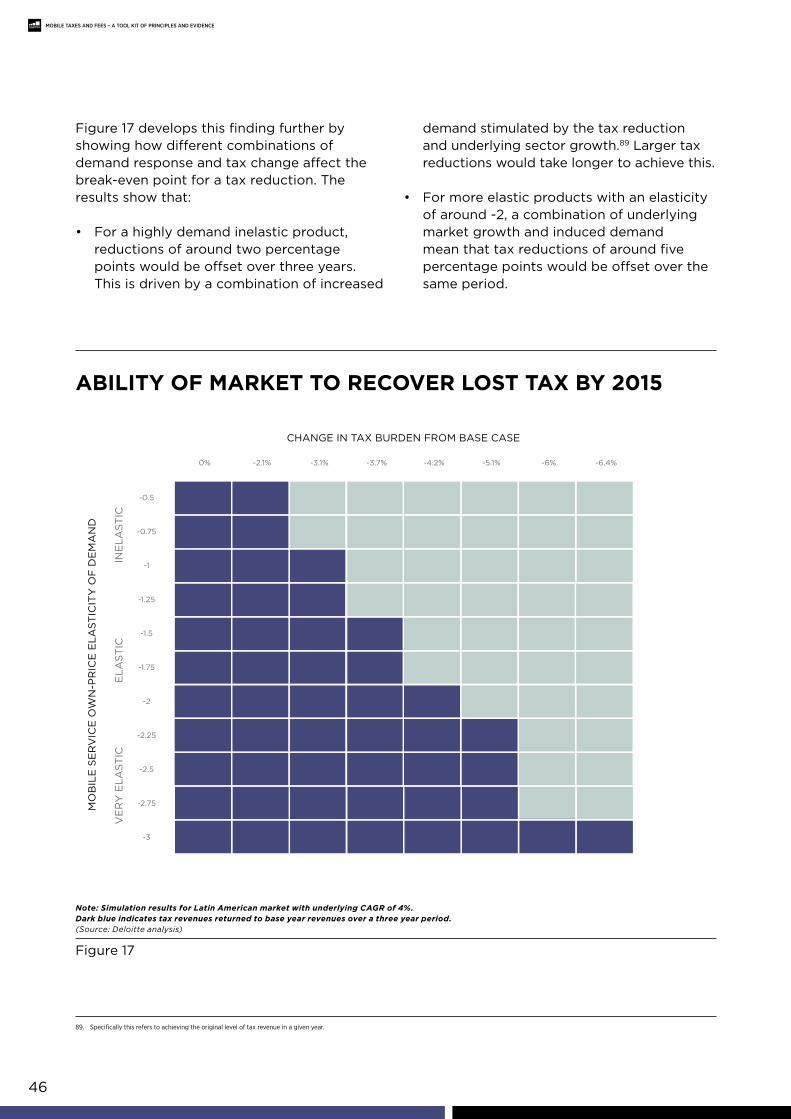
46
Mobile taxes and fees – a tool Kit of PRinCiPles and eVidenCe
abIlItY oF MarKet to recover lost taX bY 2015
Note: Simulation results for Latin American market with underlying CAGR of 4%. Dark blue indicates tax revenues returned to base year revenues over a three year period.(Source: Deloitte analysis)
Figure 17
MO
BIL
E S
ER
VIC
E O
WN
-PR
ICE
EL
AS
TIC
ITY
OF
DE
MA
ND
CHANGE IN TAX BURDEN FROM BASE CASE
INE
LA
ST
ICE
LA
ST
ICV
ER
Y E
LA
ST
IC
-3
-2.75
-2.5
-2.25
-2
-1.75
-1.5
-1.25
-1
-0.75
-0.5
0% -2.1% -3.1% -3.7% -4.2% -5.1% -6% -6.4%
Figure 17 develops this finding further by showing how different combinations of demand response and tax change affect the break-even point for a tax reduction. The results show that:
• For a highly demand inelastic product, reductions of around two percentage points would be offset over three years. This is driven by a combination of increased
demand stimulated by the tax reduction and underlying sector growth.89 Larger tax reductions would take longer to achieve this.
• For more elastic products with an elasticity of around -2, a combination of underlying market growth and induced demand mean that tax reductions of around five percentage points would be offset over the same period.
89. Specifically this refers to achieving the original level of tax revenue in a given year.
47
Mobile taxes and fees – a tool Kit of PRinCiPles and eVidenCe
Although not directly shown here, the additional demand stimulated by these tax reductions would have a range of wider social and economic benefits consistent with the analysis presented in Section 3.
The findings from this work are consistent with other previous research, as illustrated by the following example:
Further simulation results are simulated in Table 6 looking at tax reductions that cover a range of different products. In each of these examples, the combination of market growth and stimulated demand returns tax revenues to their initial levels within four to seven years.
In each of these cases, a tax reduction of around six percentage points was analysed, with different recovery rates depending on the market, demand conditions and underlying growth rates.
Mexico’s taxation collection stands at just 9.8 per cent, compared to an Organisation for Economic Cooperation and Development (OECD) average of around 30 per cent.90 It is currently undertaking a program of reform aimed at addressing this challenge, with a wide range of potential revisions being discussed, including increased taxation on higher earners.91
In this context it is noteworthy that a 2012 study simulated the effect of a one percentage point reduction in the tax burden on mobile broadband on total receipts to the Mexican government. The model examined this by considering the impact of the tax change on mobile broadband penetration and, subsequently, on GDP growth and taxation.
Drawing from the empirical literature, the study considered two different penetration responses to the tax change as well as three different responses of GDP to the increased penetration. The overall findings were that, over five years, a one percentage point reduction in the tax burden would generate 300,000-600,000 subscribers, representing an increase in the tax base of three to five per cent.92
Further, in four of the six scenarios considered, the tax reduction on mobile broadband would be more than offset by the additional tax generated arising from increased consumption of the service and from wider economic growth.93
sIMulated IMpact oF a one percentage poInt reductIon on MobIle broadband taXatIon In MeXIco
90. economonitor (2012), ‘Mexico’s Tax reform in the Works: Preview and Initial Considerations’.91. Wall Street Journal (2013), ‘Mexico Looks at raising Taxes on Wealthy’, July 19.92. The GSMA (2012), ‘The Impact of Taxation on the Development of the Mobile broadband Sector’, p. 26.93. The two scenarios with a negative impact on tax revenues both assumed a combination of price inelastic demand for mobile and an inelastic GDP response to increased broadband penetration.
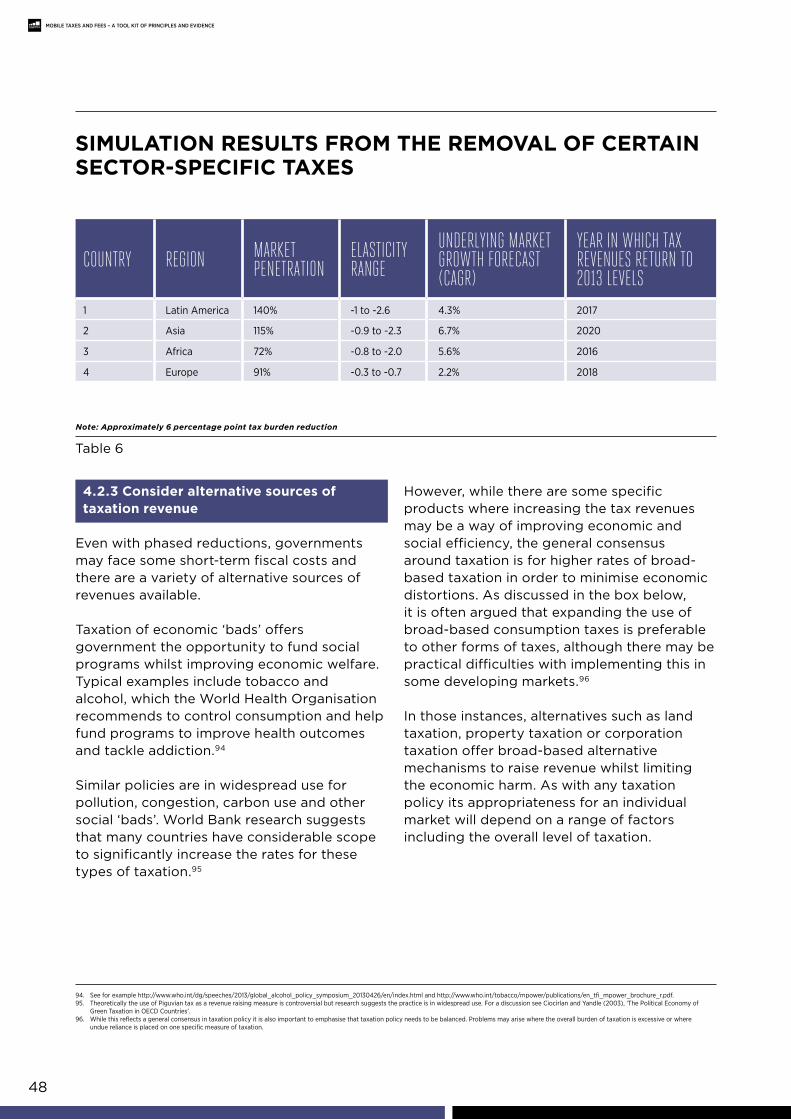
48
Mobile taxes and fees – a tool Kit of PRinCiPles and eVidenCe
4.2.3 consider alternative sources of taxation revenue
Even with phased reductions, governments may face some short-term fiscal costs and there are a variety of alternative sources of revenues available.
Taxation of economic ‘bads’ offers government the opportunity to fund social programs whilst improving economic welfare. Typical examples include tobacco and alcohol, which the World Health Organisation recommends to control consumption and help fund programs to improve health outcomes and tackle addiction.94
Similar policies are in widespread use for pollution, congestion, carbon use and other social ‘bads’. World Bank research suggests that many countries have considerable scope to significantly increase the rates for these types of taxation.95
However, while there are some specific products where increasing the tax revenues may be a way of improving economic and social efficiency, the general consensus around taxation is for higher rates of broad-based taxation in order to minimise economic distortions. As discussed in the box below, it is often argued that expanding the use of broad-based consumption taxes is preferable to other forms of taxes, although there may be practical difficulties with implementing this in some developing markets.96
In those instances, alternatives such as land taxation, property taxation or corporation taxation offer broad-based alternative mechanisms to raise revenue whilst limiting the economic harm. As with any taxation policy its appropriateness for an individual market will depend on a range of factors including the overall level of taxation.
sIMulatIon results FroM tHe reMoval oF certaIn sector-specIFIc taXes
Table 6
94. See for example http://www.who.int/dg/speeches/2013/global_alcohol_policy_symposium_20130426/en/index.html and http://www.who.int/tobacco/mpower/publications/en_tfi_mpower_brochure_r.pdf.95. Theoretically the use of Piguvian tax as a revenue raising measure is controversial but research suggests the practice is in widespread use. for a discussion see Ciocirlan and yandle (2003), ‘The Political economy of
Green Taxation in OeCD Countries’.96. While this reflects a general consensus in taxation policy it is also important to emphasise that taxation policy needs to be balanced. Problems may arise where the overall burden of taxation is excessive or where
undue reliance is placed on one specific measure of taxation.
Country reGion MArket penetrAtion
elAstiCityrAnGe
underlyinG MArketGrowth foreCAst(CAGr)
yeAr in whiCh tAx revenues return to 2013 levels
1 Latin America 140% -1 to -2.6 4.3% 2017
2 Asia 115% -0.9 to -2.3 6.7% 2020
3 Africa 72% -0.8 to -2.0 5.6% 2016
4 europe 91% -0.3 to -0.7 2.2% 2018
Note: Approximately 6 percentage point tax burden reduction
econoMIc reasons For recent trends In tHe use oF consuMptIon taX
97. McKenzie, K. J. and Mintz, J. M. (1992).98. Mooij and ederveen (2005), ‘explaining the Variation in empirical estimates of Tax elasticities of foreign Direct Investment’.99. See for example OeCD (2007), ‘Consumption taxes: the way of the future?’.100. Some research suggests this may not hold in the presence of a large informal sector. for a discussion of the issues see Aizenman and Jinjarak (2005), ‘The collection efficiency of the value added tax: theory and
international evidence’.101. Minh Le (2003); ‘Value Added Taxation: Mechanism, Design, and Policy Issues’; Paper prepared for World bank course on Practical Issues of Tax Policy in Developing Countries.102. Acosta-Ormaechea and yoo Jiae (IMf, 2012).103. for a discussion of the issue see Minh Le (2003), ‘Value Added Taxation: Mechanism, Design, and Policy Issues’.104. Cited in Mankiw (2009), ‘Smart Taxes: An Open Invitation to Join the Pigou Club’.
In recent years, studies looking into the composition of the tax burden have favoured a shift towards broad-based expenditure taxation. Some reasons for these include:
• FdI: Research suggests that a shift away from income-based taxation would improve the efficiency in the allocation of resources, both capital and labour. For example, higher and more complex taxes and fees are likely to deter investment by lowering the return on capital employed97
and increasing uncertainty. FDI is similarly deterred by higher burden of taxation.98
In addition, another reason for moving away from income-based taxation arises from the challenges in revenue collection. As capital of individuals and businesses becomes increasingly mobile, the enforcement and collection of these taxes by governments will become more difficult.99
• breadth of the tax base and enforcement: Expenditure-based taxes such as VAT tend to have a broader base and have been argued to be less distortionary and easier to collect and enforce than income-based taxes.100
• economic efficiency and growth: One of the reasons that consumption taxes, and VAT specifically, have been promoted by organisations such as the IMF, OECD and World Bank is that:
Being a consumption tax, the VAT does not have discriminating effect on savings/investment because savings are essentially excluded from the consumption VAT base.101
While these results are generally accepted, the empirical evidence on the benefits of different tax structures is less well developed, partly due to the empirical challenges associated with studies of this nature. However, a 2012 study by the International Monetary Fund used a panel of 69 countries over 20 years and found that for high and middle income countries, a revenue-neutral shift of one percentage point from income-based to expenditure-based taxation could generate an increase in long-run per capita growth of 0.04-0.07 percentage point.102
While consumption taxes are sometimes cited as being regressive, this can be addressed through other policy mechanisms. In addition, research from both developing and developed markets suggests that not all consumption taxes are regressive.103
For example, a study of petrol taxation in the US examined the impact of petrol taxation on households and found that ‘low-expenditure households devote a smaller share of their budget to gasoline than do their counterparts in the middle of the expenditure distribution.’104
49
Mobile taxes and fees – a tool Kit of PRinCiPles and eVidenCe
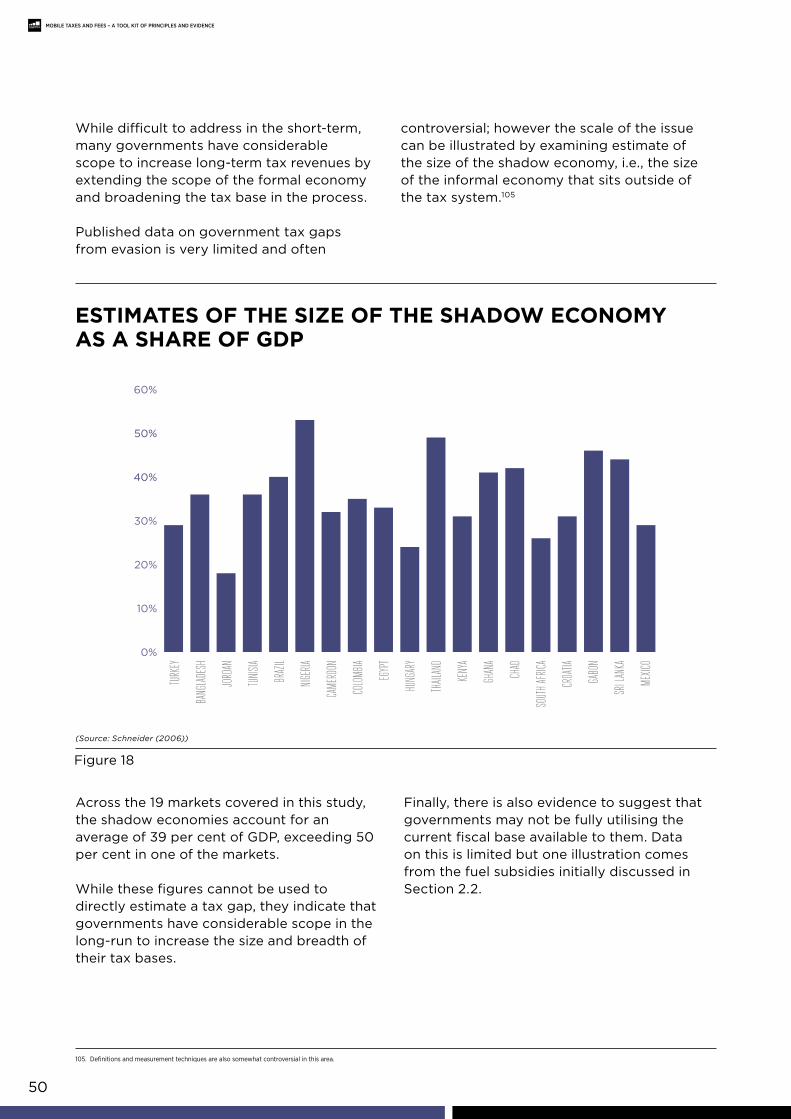
50
Mobile taxes and fees – a tool Kit of PRinCiPles and eVidenCe
estIMates oF tHe sIze oF tHe sHadow econoMY as a sHare oF gdp
While difficult to address in the short-term, many governments have considerable scope to increase long-term tax revenues by extending the scope of the formal economy and broadening the tax base in the process.
Published data on government tax gaps from evasion is very limited and often
controversial; however the scale of the issue can be illustrated by examining estimate of the size of the shadow economy, i.e., the size of the informal economy that sits outside of the tax system.105
Across the 19 markets covered in this study, the shadow economies account for an average of 39 per cent of GDP, exceeding 50 per cent in one of the markets.
While these figures cannot be used to directly estimate a tax gap, they indicate that governments have considerable scope in the long-run to increase the size and breadth of their tax bases.
Finally, there is also evidence to suggest that governments may not be fully utilising the current fiscal base available to them. Data on this is limited but one illustration comes from the fuel subsidies initially discussed in Section 2.2.
(Source: Schneider (2006))
Figure 18
105. Definitions and measurement techniques are also somewhat controversial in this area.
TURK
EY
BANG
LADE
SH
JORD
AN
TUNIS
IA
BRAZ
IL
NIGER
IA
CAME
ROON
COLO
MBIA
EGYP
T
HUNG
ARY
THAIL
AND
KENY
A
GHAN
A
CHAD
SOUT
H AFR
ICA
CROA
TIA
GABO
N
SRI L
ANKA
MEXIC
O0%
10%
20%
30%
40%
50%
60%
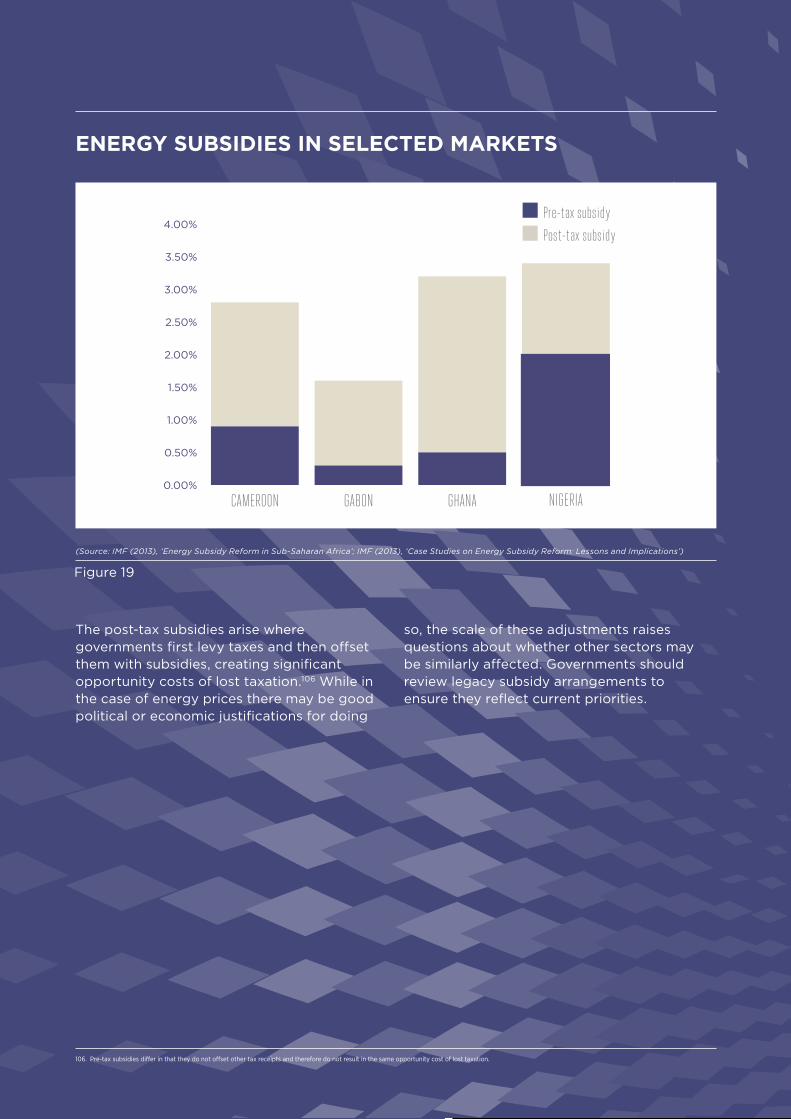
51
Mobile taxes and fees – a tool Kit of PRinCiPles and eVidenCe
energY subsIdIes In selected MarKets
(Source: IMF (2013), ‘Energy Subsidy Reform in Sub-Saharan Africa’; IMF (2013), ‘Case Studies on Energy Subsidy Reform: Lessons and Implications’)
Figure 19
106. Pre-tax subsidies differ in that they do not offset other tax receipts and therefore do not result in the same opportunity cost of lost taxation.
The post-tax subsidies arise where governments first levy taxes and then offset them with subsidies, creating significant opportunity costs of lost taxation.106 While in the case of energy prices there may be good political or economic justifications for doing
so, the scale of these adjustments raises questions about whether other sectors may be similarly affected. Governments should review legacy subsidy arrangements to ensure they reflect current priorities.
0.00%
0.50%
1.00%
1.50%
2.00%
2.50%
3.00%
3.50%
4.00%
GABON GHANA NIGERIA
Pre-tax subsidyPost-tax subsidy
CAMEROON
pre-tax subsidy
post-tax subsidy
52
Mobile taxes and fees – a tool Kit of PRinCiPles and eVidenCe
General principles of taxationThere is a significant body of research on the principles of effective taxation conducted by a mixture of academics, international organisations and governmental bodies, such as the Organisation for economic Cooperation and Development (OeCD), the european Commission (eC), the International Monetary fund (IMf) and the World bank.
This section summarises this literature, first defining an economic and policy framework for taxation before examining a number of operational considerations.
Appendix A
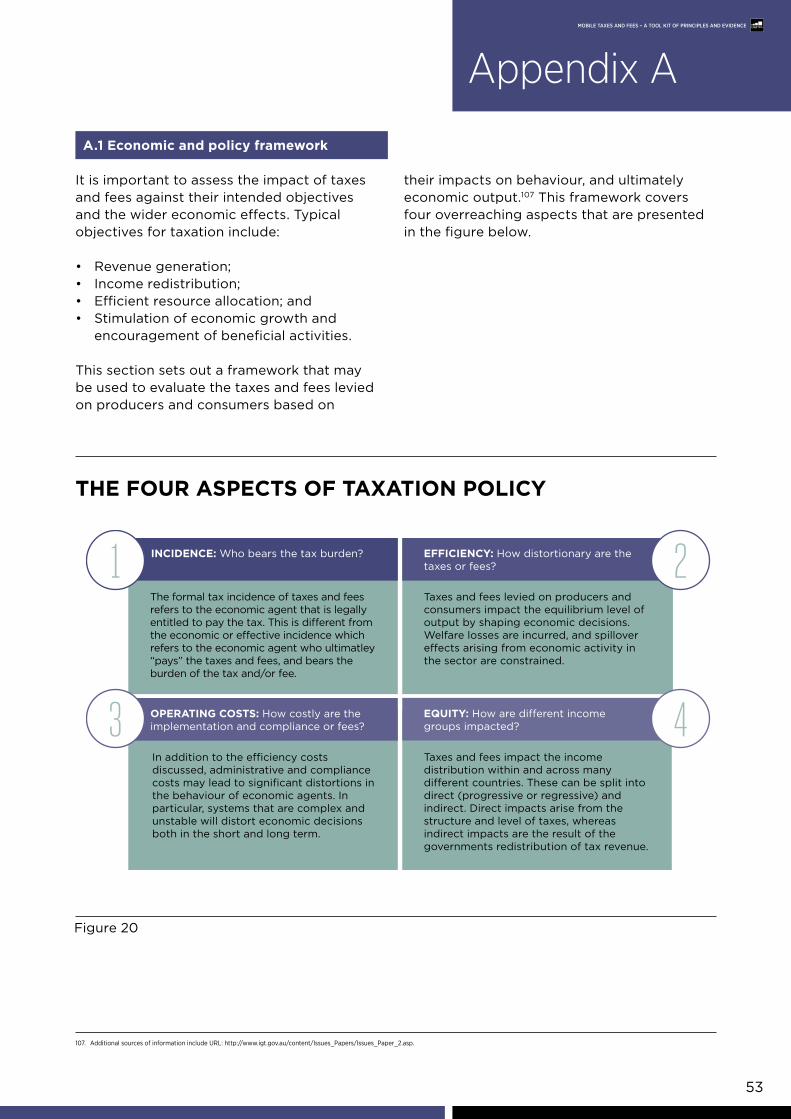
53
Appendix A
a.1 economic and policy framework
It is important to assess the impact of taxes and fees against their intended objectives and the wider economic effects. Typical objectives for taxation include:
• Revenue generation;• Income redistribution;• Efficient resource allocation; and• Stimulation of economic growth and
encouragement of beneficial activities.
This section sets out a framework that may be used to evaluate the taxes and fees levied on producers and consumers based on
their impacts on behaviour, and ultimately economic output.107 This framework covers four overreaching aspects that are presented in the figure below.
tHe Four aspects oF taXatIon polIcY
Figure 20
107. Additional sources of information include urL: http://www.igt.gov.au/content/Issues_Papers/Issues_Paper_2.asp.
The formal tax incidence of taxes and fees refers to the economic agent that is legally entitled to pay the tax. This is dierent from the economic or eective incidence which refers to the economic agent who ultimatley “pays” the taxes and fees, and bears the burden of the tax and/or fee.
In addition to the e�ciency costs discussed, administrative and compliance costs may lead to significant distortions in the behaviour of economic agents. In particular, systems that are complex and unstable will distort economic decisions both in the short and long term.
Taxes and fees impact the income distribution within and across many dierent countries. These can be split into direct (progressive or regressive) and indirect. Direct impacts arise from the structure and level of taxes, whereas indirect impacts are the result of the governments redistribution of tax revenue.
Taxes and fees levied on producers and consumers impact the equilibrium level of output by shaping economic decisions. Welfare losses are incurred, and spillover eects arising from economic activity in the sector are constrained.
1
3 4
2
OPERATING COSTS: How costly are the implementation and compliance or fees?
INCIDENCE: Who bears the tax burden?
EQUITY: How are dierent income groups impacted?
EFFICIENCY: How distortionary are the taxes or fees?
Mobile taxes and fees – a tool Kit of PRinCiPles and eVidenCe
54
Mobile taxes and fees – a tool Kit of PRinCiPles and eVidenCe
IncidenceIn order to understand the impact of taxes, it is imperative to discover who bears the tax burden, as it is this burden that will drive the impacts on the behaviour of economic agents and the level of economic output. This will depend on a variety of factors, including price elasticity of the quantity supplied and demanded.
The effective incidence may therefore be determined by understanding: 1. The formal incidence; and
2. Exploring the elasticity of both quantity supplied and demanded.
Identifying the effective incidence is therefore the first step to assess the impacts of taxes and fees on efficiency and equity.
efficiencyThe mobile sector is widely recognised as generating externalities that contribute to economic growth and productivity.108 & 109 Therefore, a central issue in the design of taxes and fees levied on this sector should be to maximise the economic opportunity from these effects within the wider framework of an effective and efficient tax system.
Public authorities should also consider the deadweight loss caused by taxes and fees. This can be observed by exploring the output change resulting from the introduction or change of a tax or fee. The larger the output change, the more likely it is that the tax or fee is relatively more distortionary.
equityTaxes and fees impact the income distribution within and across many different countries. These impacts can be split into:
• Direct impacts, arising from the structure and level of taxes; and
• Indirect impacts, resulting from the government’s redistribution of income (tax revenue).
The proportion of taxes paid as a percentage of disposable income defines whether taxes are:
• Progressive: increasing with income; or
• Regressive: decreasing with income.
As governments aim to maximise social welfare, there tends to be a number of interactive constraints. For example, attempts to reach a certain revenue target might have negative consequences on income equality. Given the nature of these different objectives, not all can be satisfied exclusively through tax policy. Public authorities will have to use other tools, such as a benefits system, to correct for partially unachieved goals.
Both these direct and indirect impacts of taxation on income distribution should be considered when evaluating the effects of taxes and fees on income inequality.
operating costsAn efficient tax administration is crucial to collect taxes and fees payments. In addition, the structure of the tax system should be tailored to the ability of the administration to ensure that it is effectively handled.
Operating costs should also be considered when designing a policy. A complex tax system on its own may lead to distortionary impacts on the behaviour of economic agents and exacerbate the burden on consumers and producers alike. These impacts would therefore increase the inefficiencies, aggravating welfare losses and potentially outweighing the benefits sought through the tax.
108. röller, Lars-Hendrik and Waverman, Leonard (1996); ‘Telecommunications infrastructure and economic development: a simultaneous approach’; Discussion papers. urL: http://www.econstor.eu/bitstream/10419/50958/1/219965056.pdf.
109. M Timmer and b van Ark (2005); ‘Does information and communications technology drive uS/eu productivity growth differentials?’; Oxford economic Papers.
55
Appendix A
a.2 operational considerations
Public authorities need to primarily have an operating tax system that works efficiently and accurately. The success of this system rests on both the authorities and taxpayers. In fact, low tax payer morale, corruption and inefficient governance are closely correlated. That is why several international organisations have set out a number of recommendations, particularly for developing countries, on how to develop an effective tax system.110
The three major tasks of effective tax administration are facilitating compliance, enforcing it and improving governance.
Facilitating complianceTaxpayers must be aware of what taxes they need to pay. To facilitate this, authorities are required to provide sufficient assistance to taxpayers when paying their taxes. For instance, the easier it is to file a tax return, the more efficient and revenue maximising the tax system is likely to be.
MNOs may also be able to contribute to the efficiency of the tax system. The use of mobile technology has the potential to support increased overall compliance and ease collection, especially in developing countries with limited access to financial services.111
For example, countries such as Denmark, South Africa and Japan make a significant usage of mobile calls and SMS to inform, alert tax payers or as a medium of identification.112 Recent developments see these types of services being used also as a medium of payment.113
The use of mobile services to facilitate tax compliance and payment is still in relatively early stages of development. Consequently, the long-term benefits from the use of mobile technology to improve the compliance and collection of tax payments are likely to be larger than those currently achieved by governments across the world.
enforcing complianceOne of the biggest challenges of an efficient tax system is to ensure the collection of tax liabilities. A system of penalties must be set up to discourage tax evasion. Governments need to strengthen detection of tax infringements and the enforcement of penalties if they want to reduce evasion, increase their tax bases and raise more tax revenue. These types of actions should be particularly targeted at high-income groups that usually constitute the largest share of revenue.
Improving governanceA tax system will be well-accepted socially and politically if it is transparent and robust. Taxpayers need to understand what is being taxed and how the contributions to tax revenues will be used. This could be achieved by undertaking detailed analysis of tax expenditure, highlighting tax revenue allocation and its implementation outcome. Such an exercise should be carried out regularly and publicly to positively influence voluntary compliance and reductions in tax evasion. Authorities would also have incentives to make sure that tax payers money is spent efficiently, reducing corruption and poor governance.
110. IMf, OeCD, uN and World bank (2011), ‘Supporting the Development of More effective Tax Systems’, urL: http://www.oecd.org/ctp/48993634.pdf.111. H. Gruber, P Koutroumpis (2010); ‘Mobile telecommunications and the impact on economic development’; Ch 5. urL: http://www.cepr.org/meets/wkcn/9/979/papers/Gruber_Koutroumpis.pdf.112. OeCD (2010), ‘forum on tax administration: taxpayer services subgroup - Survey report’, urL: http://www.oecd.org/tax/administration/45035933.pdf.113. OeCD (2012), ‘forum on tax administration: SMe compliance subgroup’, urL: http://www.oecd.org/site/ctpfta/49427993.pdf.
Mobile taxes and fees – a tool Kit of PRinCiPles and eVidenCe
56
Mobile taxes and fees – a tool Kit of PRinCiPles and eVidenCe
Modelling approachA tax scenario impact Model was developed to form a baseline for the mobile sector and economy of a given country, and quantify the impact of policy alternatives. The Model:
•Developsamobileservicessector and socio-economic baseline (the ‘base case’).
•Quantifiestheimpactsof policy scenarios affecting the mobile sector.
Appendix B
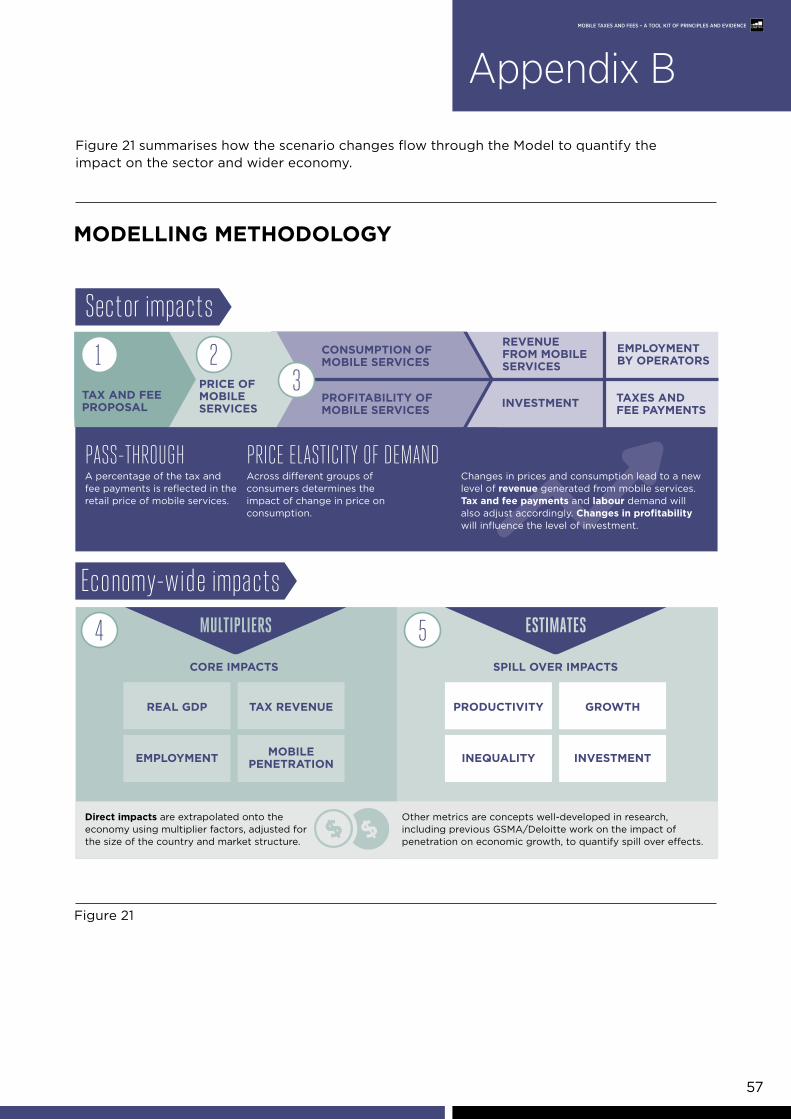
57
Mobile taxes and fees – a tool Kit of PRinCiPles and eVidenCe
Figure 21 summarises how the scenario changes flow through the Model to quantify the impact on the sector and wider economy.
ModellIng MetHodologY
Figure 21
Appendix BMobile taxes and fees – a tool Kit of PRinCiPles and eVidenCe
PRICE OFMOBILE SERVICES
Economy-wide impacts
TAX AND FEE PROPOSAL
EMPLOYMENTBY OPERATORS
TAXES AND FEE PAYMENTS
REVENUE FROM MOBILE SERVICES
INVESTMENT
MULTIPLIERS
CORE IMPACTS SPILL OVER IMPACTS
ESTIMATES
CONSUMPTION OF MOBILE SERVICES
PASS-THROUGHA percentage of the tax and fee payments is reflected in the retail price of mobile services.
Direct impacts are extrapolated onto the economy using multiplier factors, adjusted for the size of the country and market structure.
Other metrics are concepts well-developed in research, including previous GSMA/Deloitte work on the impact of penetration on economic growth, to quantify spill over e�ects.
PRICE ELASTICITY OF DEMANDAcross di�erent groups of consumers determines the impact of change in price on consumption.
Changes in prices and consumption lead to a new level of revenue generated from mobile services. Tax and fee payments and labour demand will also adjust accordingly. Changes in profitability will influence the level of investment.
GROWTHPRODUCTIVITY
INVESTMENTINEQUALITY
TAX REVENUEREAL GDP
MOBILEPENETRATIONEMPLOYMENT
PROFITABILITY OF MOBILE SERVICES
23
4 5
1
Sector impacts
58
Mobile taxes and fees – a tool Kit of PRinCiPles and eVidenCe
Appendix B
Some of the key components of the Model are explored in more detail below.
The base case used in this instance was defined for four separate markets that are located in Asia, Africa, Europe and Latin America.
For each market a base case, or baseline, is developed to quantify the current economicenvironment and serve as basis for comparison against any policy reform. This particularly includes three sets of information for the period 2012 to 2020.
• Taxes and fees paid on the provision and consumption of mobile services;114
• Size and economic footprint of the mobile services sector and employment; and
• Size of the macro-economy, including output, investment, employment and government tax revenue.
Consumption of mobile services is modelled separately for:
• Ownership: Discrete decision, i.e. new acquisitions or de-activations of services; and
• Usage: Continuous decision, i.e. the level of usage of services available to consumers.
The Model considers all transfers from private economic agents (including operators and consumers) to public authorities (including government and regulators), therefore capturing theburden of taxes and fees on the sector.
The Model explores the relationship between the various tax rates and actual total payments to estimate how tax changes impact prices – the first step in Figure 21 –and therefore output.
• In the baseline, the bases of taxes (and fees) are indirectly derived from the actual rates and actual total payments.115
• A change in taxes (and fees) leads to a direct change in total payments in the sector. Some or all of these changes are then passed through to prices, impacting profitability.
• The price changes lead to consumption changes, depending on the price elasticity of demand assumptions. A measure of tax burden is also used to assess the feedback effect of the changes in output (and other variables) on final tax and fee payments.
114. Tax and fee payments provided by a subset of operators have been extrapolated onto the sector level using revenue market shares sourced from GSMA Intelligence.115. The inferred base (also referred to as ‘effective tax base’) is derived from tax and fee payments after any deductions and other adjustments. This value differs from the actual tax base; however, it is useful for the purpose
of calculating effective tax burden.
59
Mobile taxes and fees – a tool Kit of PRinCiPles and eVidenCe
Important Notice from Deloitte
This final report (the “Final Report”) has been prepared by Deloitte LLP (“Deloitte”) for the G S M Association (the “GSMA”) in accordance with the contract with them dated 15 July 2013 (“the Contract”) and on the basis of the scope and limitations set out below.
The Final Report has been prepared solely for the purposes of providing you with a set of information and tools that may be used by you and your members in their engagement with the tax authorities, as set out in the Contract. It should not be used for any other purpose or in any other context, and Deloitte accepts no responsibility for its use in either regard including their use by the GSMA for decision making or reporting to third parties.
The Final Report is provided exclusively for the GSMA use under the terms of the Contract. No party other than the GSMA is entitled to rely on the Final Report for any purpose whatsoever and Deloitte accepts no responsibility or liability or duty of care to any party other than the GSMA in respect of the Final Report or any of its contents.
As set out in the Contract, the scope of our work has been limited by the time, information and explanations made available to us. The information contained in the Final Report has been obtained from the GSMA and third party sources that are clearly referenced in the appropriate sections of the Final Report. Deloitte has neither sought to corroborate this information nor to review its
overall reasonableness. Further, any results from the analysis contained in the Final Report are reliant on the information available at the time of writing the Final Report and should not be relied upon in subsequent periods.
Accordingly, no representation or warranty, express or implied, is given and no responsibility or liability is or will be accepted by or on behalf of Deloitte or by any of its partners, employees or agents or any other person as to the accuracy, completeness or correctness of the information contained in this document or any oral information made available and any such liability is expressly disclaimed.
All copyright and other proprietary rights in the Report remain the property of Deloitte LLP and any rights not expressly granted in these terms or in the Contract are reserved.
This Report and its contents do not constitute financial or other professional advice, and specific advice should be sought about your specific circumstances. In particular, the Report does not constitute a recommendation or endorsement by Deloitte to invest or participate in, exit, or otherwise use any of the markets or companies referred to in it. To the fullest extent possible, both Deloitte and the GSMA disclaim any liability arising out of the use (or non-use) of the Report and its contents, including any action or decision taken as a result of such use (or non-use).
GSMA Head OfficeLevel 7, 5 New Street Square, New Fetter LaneLondon, EC4A 3BF, United KingdomTel: +44 (0)207 356 0600
www.gsma.com
©GSMA 2014
gsMa researcH on MobIle taXatIon, IncludIng tHIs report, can be accessed at http://www.gsma.com/publicpolicy/tax
For More InForMatIon, please contact:gabriel solomonHead of Public [email protected]
Mani ManimohanPublic Policy [email protected]