a transient experiment to determine the heat transfer ......a simple and inexpensive experiment that...
TRANSCRIPT
Proceedings of the 2012 Midwest Section Conference of the American Society for Engineering Education
A Transient Experiment to Determine the Heat Transfer Characteristics of a 100 W Incandescent Light Bulb,
Operating at 48 W
Lauren Cole, Lindsay R. Hoggatt, Jamie A. Sterrenberg, David R. Suttmiller, W. Roy Penney and Edgar C. Clausen
Ralph E. Martin Department of Chemical Engineering University of Arkansas
Abstract A simple and inexpensive experiment that illustrates a number of heat transfer principles is presented for use in either the laboratory or the classroom. The purpose of this paper is to describe a transient experiment which determined the heat transfer characteristics of a 100 W light bulb, operating at 48 W. The fraction of the filament power absorbed by the glass envelope was measured and the fractions of the heat transferred from the glass envelope to the surroundings were determined for natural convection, forced convection and radiation. The glass bulb absorbed 26.3% of the filament radiation. At steady state, 64% (8.1 W) of the heat transfer from the glass envelope to the classroom surroundings was by convection and 36% (4.5 W) was by radiation. The calculated natural convection heat transfer coefficient was 7.1 𝑊
𝑚2𝐾 and the
experimentally determined forced convection coefficient was 12.9 𝑊𝑚2𝐾
. The effective classroom air velocity required to produce this coefficient was 0.6 𝑚
𝑠 (1.4 mph), which is in the upper range
of air velocities mandated by ASHRAE Standards to keep classroom occupants comfortable in a 26°C (79°F) classroom. The experimental results indicated that very little of the heat transfer from the filament to the glass bulb occurred by convection through the argon/nitrogen atmosphere within the bulb; essentially all heat transfer from the filament to the bulb was by radiation. Introduction One of the main objectives of engineering education is to effectively transfer subject information to the engineering students. A number of methods have been developed for enhancing student learning including multimedia developments,1,2 active, problem-based learning,3 collaborative learning,4,5 and participation in cooperative education.6 Several papers have specifically addressed methods for improving or supplementing the teaching of engineering including the use of spreadsheets to solve two-dimensional heat transfer problems,7 the use of a transport approach in teaching turbulent thermal convection,8 the use of computers to evaluate view factors in thermal radiation,9 implementation of a computational method for teaching free convection,10 and the use of an integrated experimental/analytical/numerical approach that brings the excitement of discovery to the classroom.11
2
Proceedings of the 2012 Midwest Section Conference of the American Society for Engineering Education
Since many students learn best when exposed to hands-on exercises,12 the importance of developing these types of activities cannot be overemphasized. A number of hands-on activities have been suggested for use in the laboratory or classroom, including rather novel experiments such as racecar-based laboratory exercises,13 the drying of a towel14 and the cooking of French fry-shaped potatoes.15 Several examples for the integration of hands-on engineering material into the laboratory and classroom have been described by Penney and Clausen,16-24 who presented a number of simple hands-on fluids and heat transfer experiments that can be constructed from materials present in most engineering departments. This cross-course integration of course material has been shown to be a very effective learning tool that causes students to think beyond the content of each individual course.25 Heat transfer from a simple light bulb is pertinent in our everyday lives. Every building, every store and every vehicle have light bulbs. Standing on a stage with full lighting overhead, or simply hovering a hand over a lit bulb demonstrates the heat transfer from a light bulb. Incandescent light bulbs only emit about 9% of their radiation in the visible spectrum; the remainder is wasted. A significant portion of the wasted energy is absorbed by the glass envelope surrounding the filament. This absorbed energy is then transferred by convection and radiation to the environment. The experiment described in this paper measures parameters associated with this heat transfer to determine (1) the fraction of the filament radiation absorbed by the glass bulb, (2) the combined heat transfer coefficient for the bulb, (3) the natural convection heat transfer coefficient of the bulb, and (4) the forced convection coefficient for the bulb. This experiment is ideal for use as a laboratory experiment and/or as a classroom demonstration because of its simplicity and coverage of a number of heat transfer principles. The incandescent light bulb is a marvel of modern technology. Riveros and Oliva26 present an excellent explanation of the key parts of a light bulb. The accompanying diagram was taken from http://www.enchantedlearning.com/inventors/page/i/incandescentbulb.shtml as an aid in understanding the description. “ T he three main components of an incandescent lamp are: the metallic filament (usually tungsten) with a high melting point; the bulb envelope made of glass, which is empty or partially filled with an inert gas, to prevent oxidization of the element; and the base of the lamp, which includes the two separate electrodes (metallic threaded base and the eyelet) and the glass tube (which seals the lead-in wires). The pressure of the gas reduces the evaporation rate but increases the convection losses, so that lamps below 25 W are in a low vacuum. To increase the visible light production, tungsten filaments need to be heated to high temperatures (between 2700 K and 2900 K), producing a small change in colour from yellow to white for illumination. However, infrared radiation is always produced, reducing the efficiency of the visible light emission.” The glass bulb for a 100 W bulb weighs about 13 g, is 6 cm in diameter and is about 0.4 mm thick. The glass is almost transparent to radiation in the visible spectrum, but is increasingly
3
Proceedings of the 2012 Midwest Section Conference of the American Society for Engineering Education
opaque to radiation above a 2.5 μm wavelength. A tungsten element operating at 2800 K emits a significant fraction of it radiation at wavelengths exceeding 2.5 μm. An excellent video about the complex spiral within a spiral tungsten element is available on Mr. Barlow’s Blog.27 The glass envelope is filled to about 0.7 atm with argon/nitrogen gas to prevent evaporation of the tungsten filament. The filament operates at about 2800 K and only produces about 9% of its light in the visible spectrum.28 Much of the radiation from the filament is in the infrared region, where the glass is practically opaque.28 Equipment and Procedures The following paragraphs describe the equipment and materials, experimental procedures and safety considerations in performing the experiment. Equipment List The equipment and supplies used in the experiment were as follows:
• 100 W, 115 V Sylvania Double Life Clear glass tungsten filament light bulbs, 2 • Omega Precision Fine Wire thermocouple (0.003 in (0.008 mm) diameter) • Omega HH12 thermocouple reader • Stopwatch • Porcelain ceramic light socket • EXTECH, Model DW-6060 wattmeter • Digital caliper • Laboratory ring stand • Mettler Toledo AB104-S analytical balance • STACO Energy Products, 120 V variable autotransformer • Transparent tape
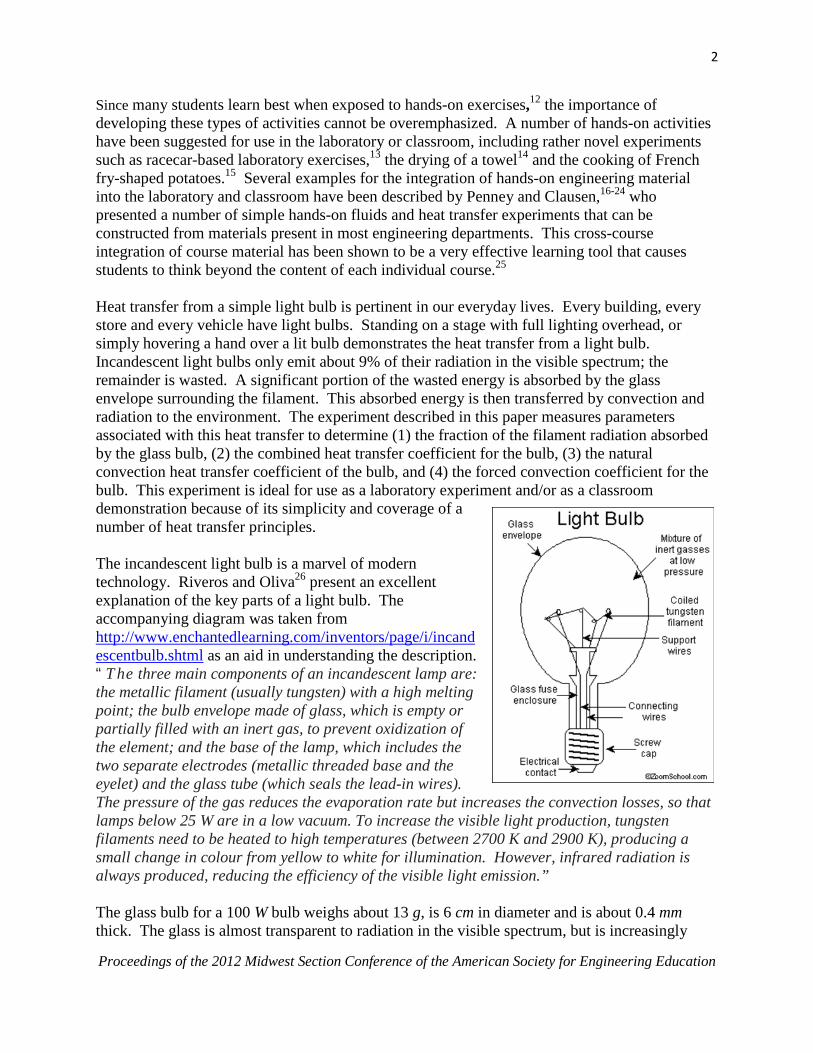
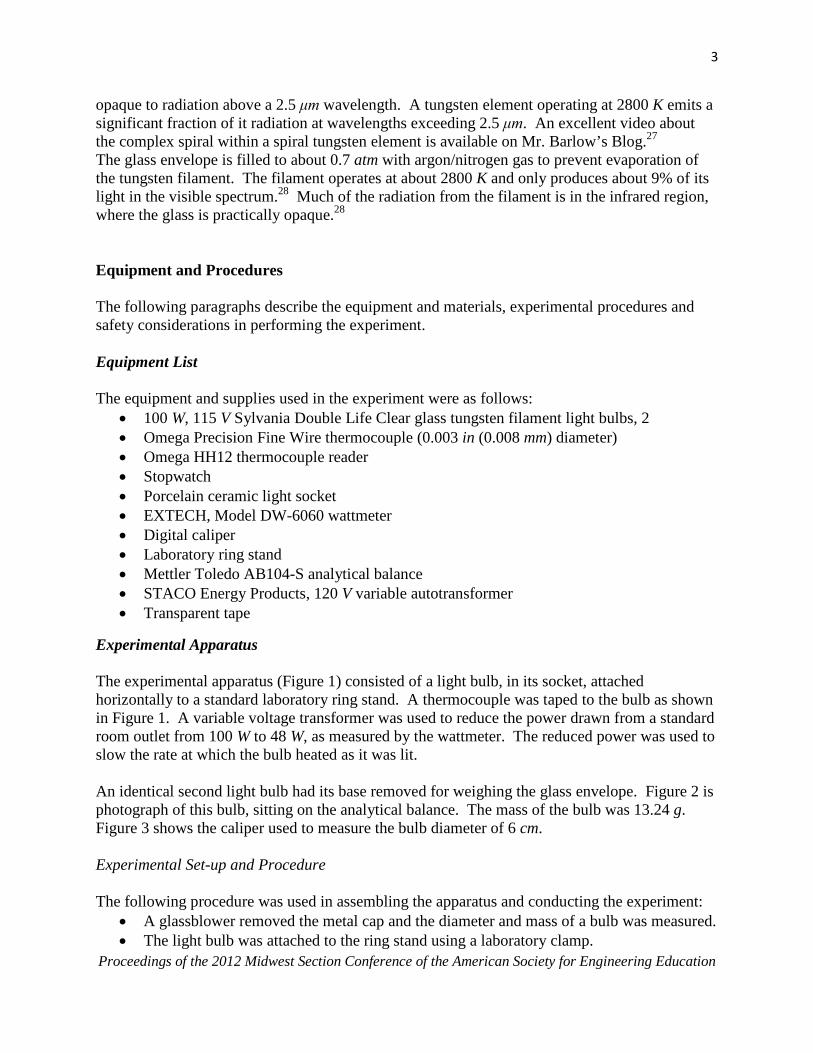
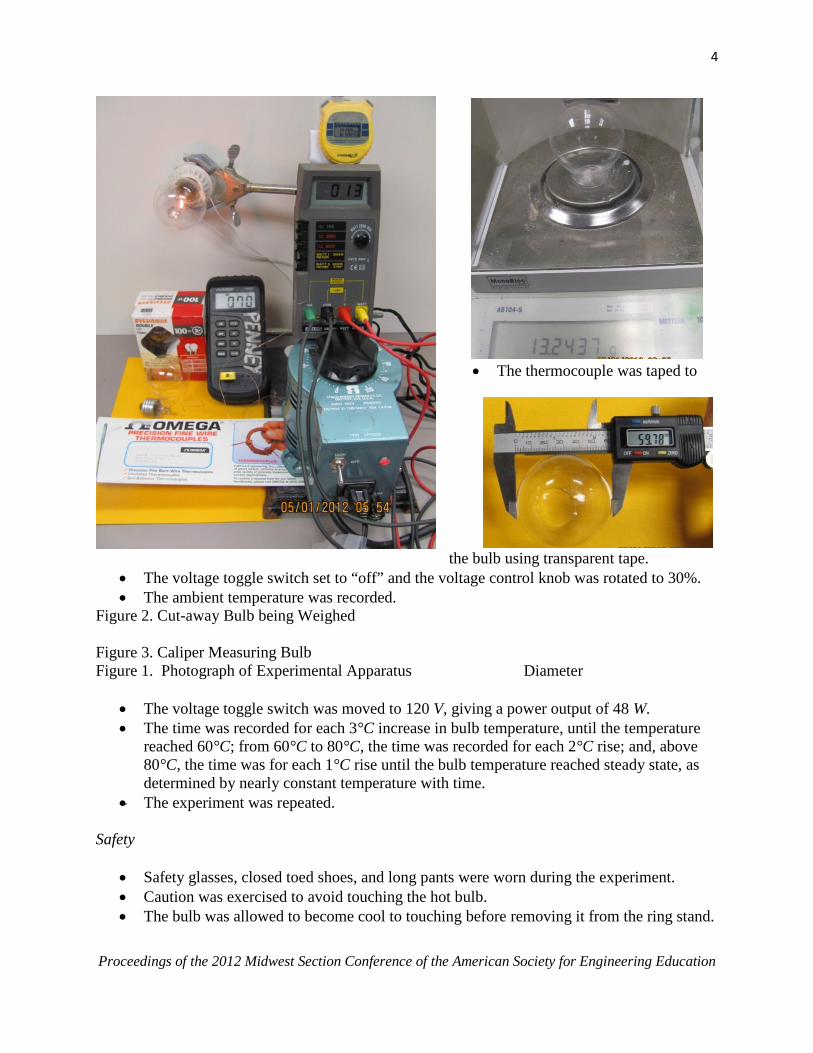
Experimental Apparatus The experimental apparatus (Figure 1) consisted of a light bulb, in its socket, attached horizontally to a standard laboratory ring stand. A thermocouple was taped to the bulb as shown in Figure 1. A variable voltage transformer was used to reduce the power drawn from a standard room outlet from 100 W to 48 W, as measured by the wattmeter. The reduced power was used to slow the rate at which the bulb heated as it was lit. An identical second light bulb had its base removed for weighing the glass envelope. Figure 2 is photograph of this bulb, sitting on the analytical balance. The mass of the bulb was 13.24 g. Figure 3 shows the caliper used to measure the bulb diameter of 6 cm. Experimental Set-up and Procedure The following procedure was used in assembling the apparatus and conducting the experiment:
• A glassblower removed the metal cap and the diameter and mass of a bulb was measured. • The light bulb was attached to the ring stand using a laboratory clamp.
4
Proceedings of the 2012 Midwest Section Conference of the American Society for Engineering Education
• The thermocouple was taped to
the bulb using transparent tape. • The voltage toggle switch set to “off” and the voltage control knob was rotated to 30%. • The ambient temperature was recorded.
Figure 2. Cut-away Bulb being Weighed Figure 3. Caliper Measuring Bulb Figure 1. Photograph of Experimental Apparatus Diameter
• The voltage toggle switch was moved to 120 V, giving a power output of 48 W. • The time was recorded for each 3°C increase in bulb temperature, until the temperature
reached 60°C; from 60°C to 80°C, the time was recorded for each 2°C rise; and, above 80°C, the time was for each 1°C rise until the bulb temperature reached steady state, as determined by nearly constant temperature with time.
• The experiment was repeated. Safety
• Safety glasses, closed toed shoes, and long pants were worn during the experiment. • Caution was exercised to avoid touching the hot bulb. • The bulb was allowed to become cool to touching before removing it from the ring stand.
5
Proceedings of the 2012 Midwest Section Conference of the American Society for Engineering Education
• Care was taken in handling the cutaway light bulb envelope avoid contact with the sharp cutaway edges.
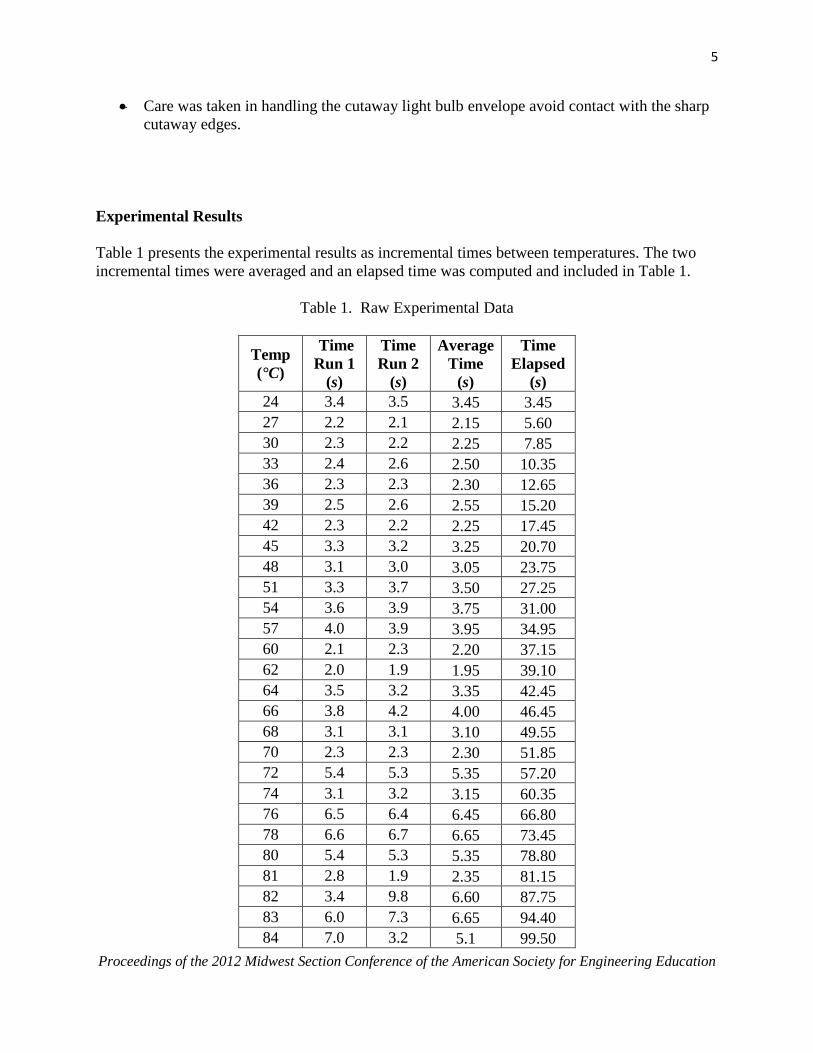
Experimental Results Table 1 presents the experimental results as incremental times between temperatures. The two incremental times were averaged and an elapsed time was computed and included in Table 1.
Table 1. Raw Experimental Data
Temp (°C)
Time Run 1
(s)
Time Run 2
(s)
Average Time
(s)
Time Elapsed
(s) 24 3.4 3.5 3.45 3.45 27 2.2 2.1 2.15 5.60 30 2.3 2.2 2.25 7.85 33 2.4 2.6 2.50 10.35 36 2.3 2.3 2.30 12.65 39 2.5 2.6 2.55 15.20 42 2.3 2.2 2.25 17.45 45 3.3 3.2 3.25 20.70 48 3.1 3.0 3.05 23.75 51 3.3 3.7 3.50 27.25 54 3.6 3.9 3.75 31.00 57 4.0 3.9 3.95 34.95 60 2.1 2.3 2.20 37.15 62 2.0 1.9 1.95 39.10 64 3.5 3.2 3.35 42.45 66 3.8 4.2 4.00 46.45 68 3.1 3.1 3.10 49.55 70 2.3 2.3 2.30 51.85 72 5.4 5.3 5.35 57.20 74 3.1 3.2 3.15 60.35 76 6.5 6.4 6.45 66.80 78 6.6 6.7 6.65 73.45 80 5.4 5.3 5.35 78.80 81 2.8 1.9 2.35 81.15 82 3.4 9.8 6.60 87.75 83 6.0 7.3 6.65 94.40 84 7.0 3.2 5.1 99.50
6
Proceedings of the 2012 Midwest Section Conference of the American Society for Engineering Education
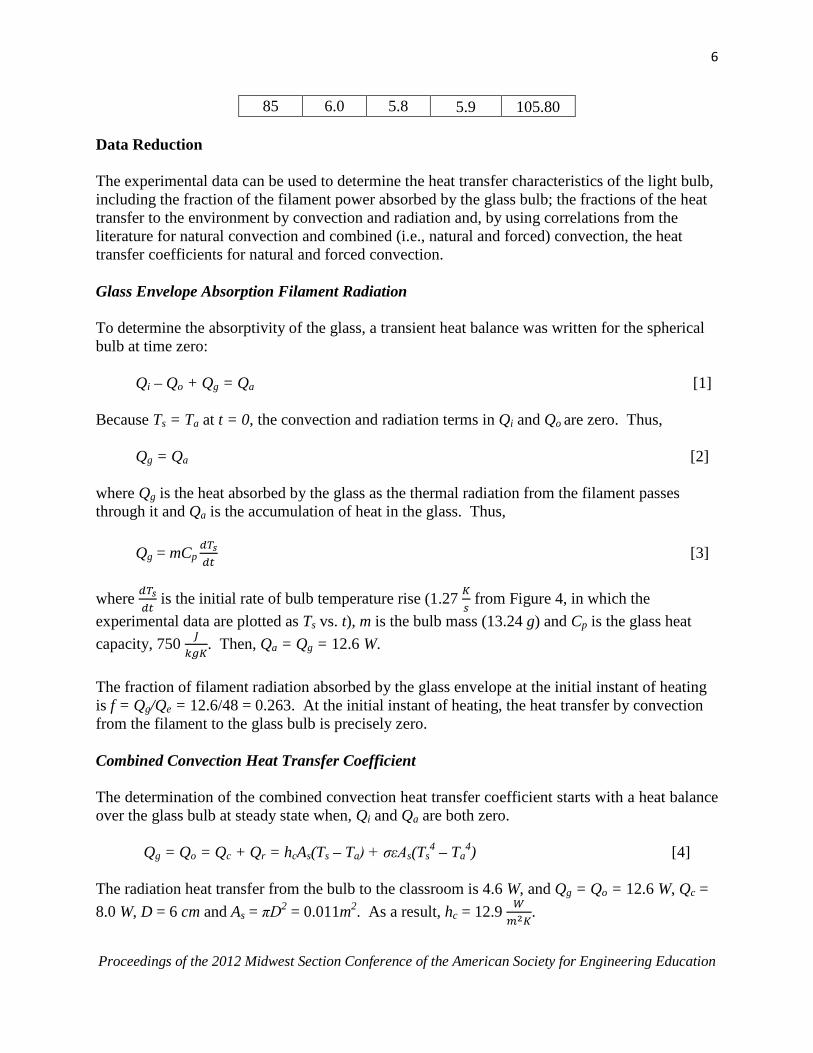
85 6.0 5.8 5.9 105.80 Data Reduction The experimental data can be used to determine the heat transfer characteristics of the light bulb, including the fraction of the filament power absorbed by the glass bulb; the fractions of the heat transfer to the environment by convection and radiation and, by using correlations from the literature for natural convection and combined (i.e., natural and forced) convection, the heat transfer coefficients for natural and forced convection. Glass Envelope Absorption Filament Radiation To determine the absorptivity of the glass, a transient heat balance was written for the spherical bulb at time zero: Qi – Qo + Qg = Qa [1] Because Ts = Ta at t = 0, the convection and radiation terms in Qi and Qo are zero. Thus, Qg = Qa [2] where Qg is the heat absorbed by the glass as the thermal radiation from the filament passes through it and Qa is the accumulation of heat in the glass. Thus, Qg = mCp
𝑑𝑇𝑠𝑑𝑡
[3] where 𝑑𝑇𝑠
𝑑𝑡 is the initial rate of bulb temperature rise (1.27 𝐾
𝑠 from Figure 4, in which the
experimental data are plotted as Ts vs. t), m is the bulb mass (13.24 g) and Cp is the glass heat capacity, 750 𝐽
𝑘𝑔𝐾. Then, Qa = Qg = 12.6 W.
The fraction of filament radiation absorbed by the glass envelope at the initial instant of heating is f = Qg/Qe = 12.6/48 = 0.263. At the initial instant of heating, the heat transfer by convection from the filament to the glass bulb is precisely zero. Combined Convection Heat Transfer Coefficient The determination of the combined convection heat transfer coefficient starts with a heat balance over the glass bulb at steady state when, Qi and Qa are both zero.
Qg = Qo = Qc + Qr = hcAs(Ts – Ta) + σεAs(Ts4 – Ta
4) [4]
The radiation heat transfer from the bulb to the classroom is 4.6 W, and Qg = Qo = 12.6 W, Qc = 8.0 W, D = 6 cm and As = πD2 = 0.011m2. As a result, hc = 12.9 𝑊
𝑚2𝐾.
7
Proceedings of the 2012 Midwest Section Conference of the American Society for Engineering Education
Natural Convection Heat Transfer Coefficient The heat loss by combined convection is by natural and forced convection. The natural convection coefficient can be calculated by a literature correlation28 Nun = ℎ𝑛𝐷
𝑘= 2 + 2+0.589𝑅𝑎0.25
�1+�0.469𝑃𝑟 �
0.63�0.444 [5]
With k = 0.0274 𝑊
𝑚𝐾, ν = 1.85E-5 𝑚
2
𝑠, β = 1/327 K-1, Pr = 0.723, Gr = 1.4E6 and Ra = GrPr, hn =
7.6 𝑊𝑚2𝐾
. Forced Convection Heat Transfer Coefficient In order to determine the forced convection heat transfer coefficient, a correlation28 for the combined coefficient as a function of hn and hf must be used Nuc = (Nun
n + Nufn)1/n → hc
n = hnn + hf
n → hf = (hcn - hn
n)1/n (Note: used n = 3) [6] With hc = 12.9 𝑊
𝑚2𝐾and hn = 7.6 𝑊
𝑚2𝐾, hf = 11.9 𝑊
𝑚2𝐾.
Thus, the forced convection heat transfer coefficient was not measured. Is the resulting value reasonable for a classroom with an ambient temperature of 26°C (79°F)? To answer this question, it is essential to know what air velocity would yield this value of hf. hf can be determined from a forced convection correlation28 for spheres Nuf = 2 + [0.4Re1/2 0.06Re2/3]Pr0.4 �𝜇𝑏
𝜇𝑠� 0.25 [7]
with Nuf = ℎ𝑓𝐷𝑘
= 26, Pr = 0.723 and μb ≈ μs, Re = 𝑉𝐷𝜈
= 2,000 and V = 0.62 𝑚𝑠
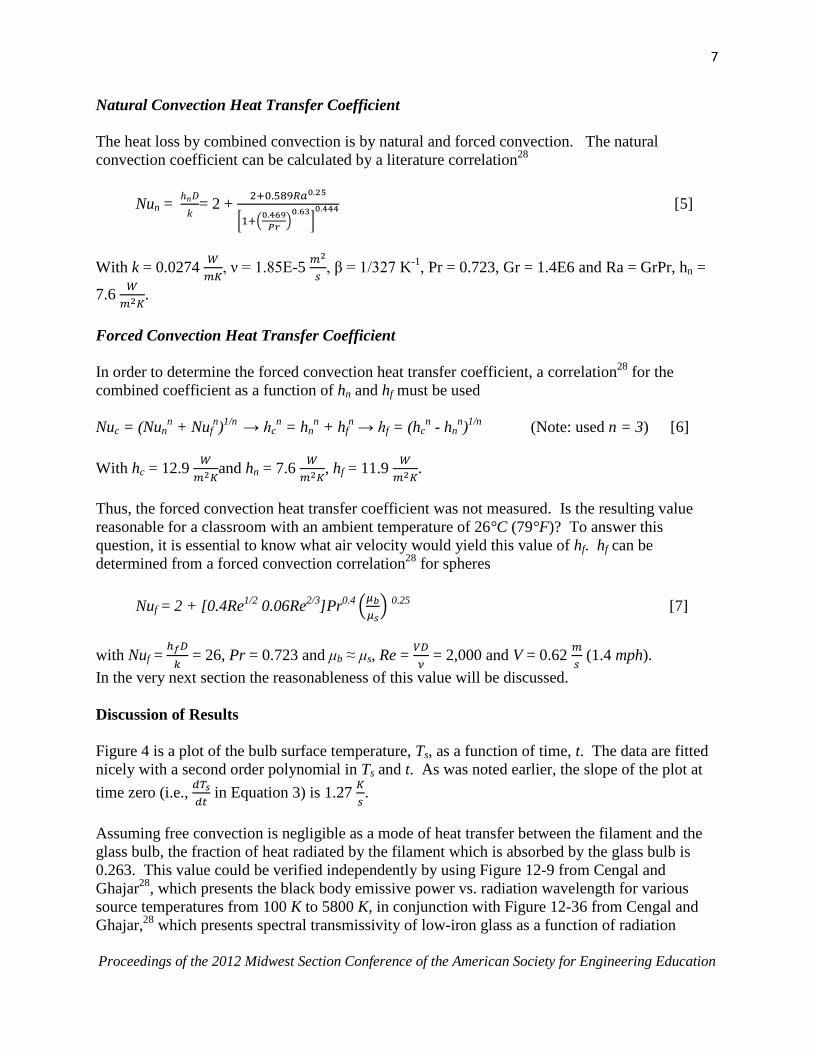
(1.4 mph). In the very next section the reasonableness of this value will be discussed. Discussion of Results Figure 4 is a plot of the bulb surface temperature, Ts, as a function of time, t. The data are fitted nicely with a second order polynomial in Ts and t. As was noted earlier, the slope of the plot at time zero (i.e., 𝑑𝑇𝑠
𝑑𝑡 in Equation 3) is 1.27 𝐾
𝑠.
Assuming free convection is negligible as a mode of heat transfer between the filament and the glass bulb, the fraction of heat radiated by the filament which is absorbed by the glass bulb is 0.263. This value could be verified independently by using Figure 12-9 from Cengal and Ghajar28, which presents the black body emissive power vs. radiation wavelength for various source temperatures from 100 K to 5800 K, in conjunction with Figure 12-36 from Cengal and Ghajar,28 which presents spectral transmissivity of low-iron glass as a function of radiation
8
Proceedings of the 2012 Midwest Section Conference of the American Society for Engineering Education
wavelength and glass thickness. These calculations were not carried out because all the other results of this experiment indicate that the measured factional absorption of 26% is reasonable.
Figure 4. Plot of Experimental Data: Bulb Surface Temperature as a Function of Elapsed Time
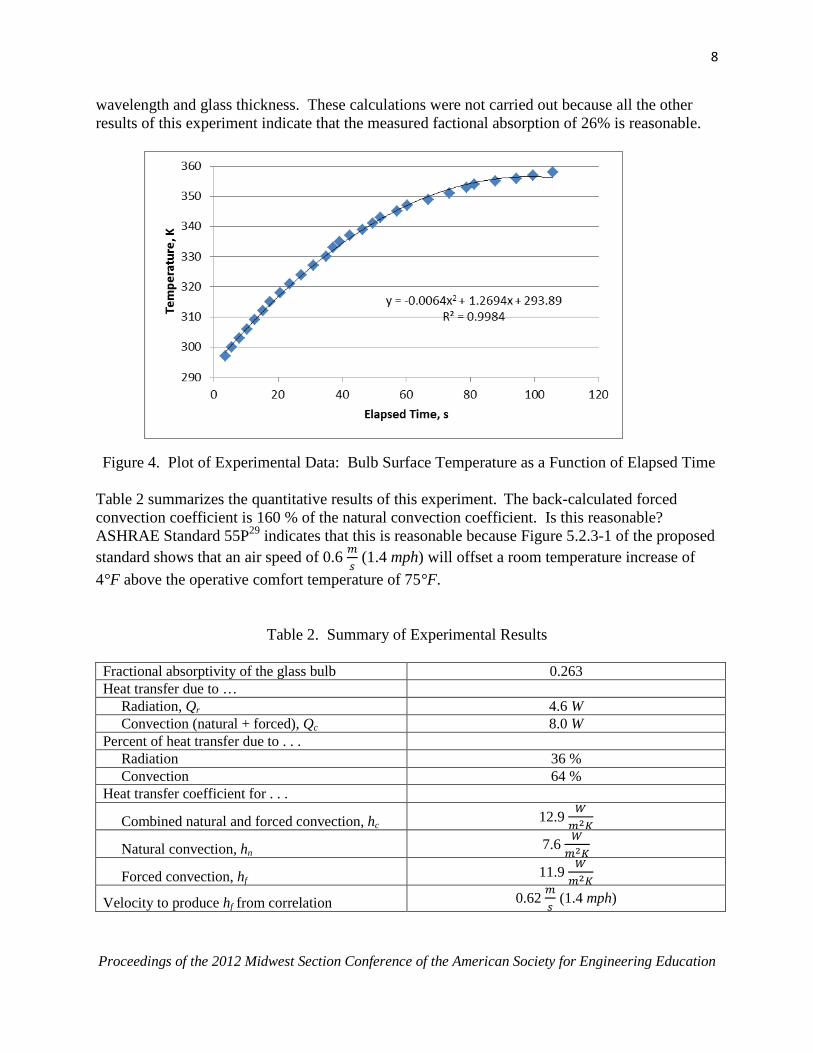
Table 2 summarizes the quantitative results of this experiment. The back-calculated forced convection coefficient is 160 % of the natural convection coefficient. Is this reasonable? ASHRAE Standard 55P29 indicates that this is reasonable because Figure 5.2.3-1 of the proposed standard shows that an air speed of 0.6 𝑚
𝑠 (1.4 mph) will offset a room temperature increase of
4°F above the operative comfort temperature of 75°F.
Table 2. Summary of Experimental Results Fractional absorptivity of the glass bulb 0.263 Heat transfer due to … Radiation, Qr 4.6 W Convection (natural + forced), Qc 8.0 W Percent of heat transfer due to . . . Radiation 36 % Convection 64 % Heat transfer coefficient for . . .
Combined natural and forced convection, hc 12.9 𝑊𝑚2𝐾
Natural convection, hn 7.6 𝑊𝑚2𝐾
Forced convection, hf 11.9 𝑊𝑚2𝐾
Velocity to produce hf from correlation 0.62 𝑚𝑠
(1.4 mph)
9
Proceedings of the 2012 Midwest Section Conference of the American Society for Engineering Education
Conclusions
1. A simple but effective incandescent light bulb experiment, using readily available
materials and equipment, was developed for use in the classroom and/or laboratory. 2. The fraction of filament radiation absorbed by the bulb was 26 %. This value is
reasonable based on the wavelengths of radiation produced by the element and based on other reasonable results of the experiment.
3. Forced convection in the classroom was greater than natural convection by a ratio of 1.6. From literature correlations, the air velocity required to produce the forced convection coefficient is 0.62 𝑚
𝑠 (1.4 mph). This value is within the ASHRE guidelines for room air
speeds allowed to offset room temperatures above the comfort zone temperature at a lower air speed of 0.4 𝑚
𝑠.
4. The experimental results indicate that, at steady state, the convection component of heat transfer from the filament to the bulb is very small relative to the radiation component.
Nomenclature Latin Symbols As Surface area of the bulb, m2 Cp Specific heat of glass, 𝑊
𝑘𝑔𝐾
D Bulb diameter, m f Fraction of the filament radiation which is absorbed by the glass envelope g Gravitational acceleration, 𝑚
𝑠2
hc Combined (natural + forced) convection heat transfer coefficient, 𝑊𝑚2𝐾
hf Forced convection heat transfer coefficient, 𝑊𝑚2𝐾
hn Natural convection heat transfer coefficient, 𝑊𝑚2𝐾
k Thermal conductivity of air, 𝑊𝑚𝐾
m Mass of the bulb, kg Qa Accumulation term in the heat balance equation, = mCp
𝑑𝑇𝑠𝑑𝑡
, W Qc Heat loss from the glass bulb by combined natural and forced convection, W Qe Measured power input to the light bulb from the electrical source, W Qg Heat generation term in the heat balance equation, W Qi Heat input term in the heat balance equation, W Qo Heat output term in the heat balance equation, W Qr Heat loss from the glass bulb by radiation to the classroom environment, W t Time measured from the start of power input to the light bulb, s
10
Proceedings of the 2012 Midwest Section Conference of the American Society for Engineering Education
Ta Ambient temperature, K; also, steady state surface temperature, K Ts Bulb surface temperature, K V Air velocity required to produce hf,
𝑚𝑠
Greek Symbols β Volume expansion coefficient, K-1
μ Kinematic viscosity, Pa s ε Surface emissivity of the tungsten filament σ Stefan–Boltzmann constant, 𝑊
𝑚2𝐾4
ν Kinematic viscosity of air, 𝑚2
𝑠
Dimensionless Parameters Gr Grashoff number, 𝑔𝛽(𝑇𝑠−𝑇𝑎)𝐷3
𝜐2
Nuc Nusselt number, ℎ𝑐𝐷𝑘
, combined natural and forced convection Nuf Nusselt number, forced convection Nun Nusselt number, natural convection Re Reynolds number, 𝑉𝐷𝜌
𝜇, required to produce the forced convection coefficient, hf
Ra Rayleigh number, GrPr
Bibliography
1. Ellis, T., “Animating to Build Higher Cognitive Understanding: A Model for Studying Multimedia Effectiveness in Education,” Journal of Engineering Education, Vol. 93, No. 1, pp. 59-64, 2004.
2. Wise, M., Groom, F.M., “The Effects of Enriching Classroom Learning with the Systematic Employment of Multimedia” Education, Vol. 117, No. 1, pp. 61-69, 1996.
3. Grimson, J., “Re-engineering the Curriculum for the 21st Century,” European Journal of Engineering Education, Vol. 27, No. 1, pp. 31-37, 2002.
4. Bjorklund, S.A., Parente, J.M., Sathianathan, D., “Effects of Faculty Interaction and Feedback on Gains in Student Skills,” Journal of Engineering Education, Vol. 93, No. 2, pp. 153-160, 2004.
5. Colbeck, C.L., Campbell, S.E., Bjorklund, S.A., “Grouping in the Dark: What College Students Learn from Group Projects,” Journal of Engineering Education, Vol. 71, No. 1, pp. 60-83, 2000.
6. Blair, B.F., Millea, M., Hammer, J., “The Impact of Cooperative Education on Academic Performance and Compensation of Engineering Majors,” Journal of Engineering Education, Vol. 93, No. 4, pp. 333-338, 2004.
7. Besser, R.S., “Spreadsheet Solutions to Two-Dimensional Heat Transfer Problems.” Chemical Engineering Education, Vol. 36, No. 2, pp. 160-165, 2002.
8. Churchill, S.W., “A New Approach to Teaching Turbulent Thermal Convection,” Chemical Engineering Education, Vol. 36, No. 4, pp. 264-270, 2002.
9. Henda, R., “Computer Evaluation of Exchange Factors in Thermal Radiation,” Chemical Engineering Education, Vol. 38, No. 2, pp. 126-131, 2004.
10. Goldstein, A.S., “A Computational Model for Teaching Free Convection,” Chemical Engineering Education, Vol. 38, No. 4, pp. 272-278, 2004.
11. Olinger, D.J., Hermanson, J.C., “Integrated Thermal-Fluid Experiments in WPI’s Discovery Classroom,” Journal of Engineering Education, Vol. 91, No. 2, pp. 239-243, 2002.
11
Proceedings of the 2012 Midwest Section Conference of the American Society for Engineering Education
12. Lin, C.C., Tsai, C.C., “The Relationships between Students’ Conceptions of Learning Engineering and their Preferences for Classroom and Laboratory Learning Environments,” Journal of Engineering Education, Vol. 98, No. 2, pp. 193-204, 2009.
13. Lyons, J., Young, E.F., “Developing a Systems Approach to Engineering Problem Solving and Design of Experiments in a Racecar-Based Laboratory Course,” Journal of Engineering Education, Vol. 90, No. 1, pp. 109-112, 2001.
14. Nollert, M.U., “An Easy Heat and Mass Transfer Experiment for Transport Phenomena,” Chemical Engineering Education, Vol. 36, No. 1, pp. 56-59, 2002.
15. Smart, J.L., “Optimum Cooking of French Fry-Shaped Potatoes: A Classroom Study of Heat and Mass Transfer,” Chemical Engineering Education, Vol. 37, No. 2, pp. 142-147, 153, 2003.
16. Clausen, E.C., Penney, W.R., Marrs, D.C., Park, M.V., Scalia, A.M., N.S. Weston, N.S., “Laboratory/Demonstration Experiments in Heat Transfer: Thermal Conductivity and Emissivity
Measurement,” Proceedings of the 2005 American Society of Engineering Education-Gulf Southwest Annual Conference, 2005. 17. Clausen, E.C., Penney, W.R., Dorman, J.R., Fluornoy, D.E., Keogh, A.K., Leach, L.N., “Laboratory/Demonstration Experiments in Heat Transfer: Laminar and Turbulent Forced Convection Inside Tubes,” Proceedings of the 2005 American Society of Engineering Education-Gulf Southwest Annual Conference, 2005.
18. Clausen, E.C., Penney, W.R., Colville, C.E., Dunn, A.N., El Qatto, N.M., Hall, C.D., Schulte, W.B., von der Mehden, C.A., “Laboratory/Demonstration Experiments in Heat Transfer: Free Convection,” Proceedings of the 2005 American Society of Engineering Education-Midwest Section Annual Conference, 2005. 19. Clausen, E.C., Penney, W.R., Dunn, A.N., Gray, J.M., Hollingsworth, J.C., Hsu, P.T., McLelland, B.K., Sweeney, P.M., Tran, T.D., von der Mehden, C.A., Wang, J.Y., “Laboratory/Demonstration Experiments in Heat Transfer: Forced Convection,” Proceedings of the 2005 American Society of Engineering Education-Midwest Section Annual Conference, 2005.
20. Clausen, E.C., Penney, W.R., “Laboratory Demonstrations/Experiments in Free and Forced Convection Heat Transfer,” Proceedings of the 2006 American Society for Engineering Education Annual Conference and Exposition, 2006.
21. Penney, W.R., Lee, R.M., Magie, M.E., Clausen, E.C., “Design Projects in Undergraduate Heat Transfer: Six Examples from the Fall 2007 Course at the University of Arkansas,” Proceedings of the 2007 American Society of Engineering Education Midwest Section Annual Conference, 2007.
22. Penney, W.R., Brown, K.J., Vincent, J.D., Clausen, E.C., “Solar Flux and Absorptivity Measurements: A Design Experiment in Undergraduate Heat Transfer,” Proceedings of the 2008 American Society of Engineering Education Midwest Section Annual Conference, 2008.
23. Busick, A.A., Cooley, M.L., Lopez, A.M., Steuart, A.J., Penney, W.R., Clausen, E.C., “Determining the Net Positive Suction Head of a Magnetic Drive Pump,” Proceedings of the 2010 American Society of Engineering Education Midwest Section Annual Conference, 2010.
24. Dunn, M.F., Penney, W.R. Clausen, E.C., “Bernoulli Balance Experiments Using a Venturi,” Proceedings of the 2011 American Society of Engineering Education Midwest Section Annual Conference, 2011.
25. Birol, G., Birol, Í., Çinar, A., “Student-Performance Enhancement by Cross-Course Project Assignments: A Case Study in Bioengineering and Process Modeling,” Chemical Engineering Education, Vol. 35, No. 2, pp. 128-133, 2001.
26. Riveros, H.G., Oliva, A.I, “Experiment Tests Pressure in Light Bulbs,” Physics Education, November 2006, pp. 487-486, 2006. Available WWW: http://www.mda.cinvestav.mx/labs/fisica/micros/laboratorio/articulos%20pdf/Internacionales/67.pdf.
27. Mr. Barlow’s Blog, (2012). Available WWW: http://mrbarlow.wordpress.com/2011/03/16/interesting-facts-about-light-bulb-filament.
28. Çengel, Y.A., Ghajar, A.J., Heat and Mass Transfer, Fundamentals & Applications, 4th edition, McGraw-Hill Book Companies, Inc., New York, NY, 2011.
29. ASHRAE Standard 55P, “Thermal Environment for Human Occupancy,” (2012). Available WWW: http://www.krueger-hvac.com/lit/pdf/therm_comf.pdf.
Biographical Information
12
Proceedings of the 2012 Midwest Section Conference of the American Society for Engineering Education
LAUREN COLE, LINDSAY R. HOGGATT, JAMIE A. STERRENBERG, DAVID R. SUTTMILLER Ms. Cole, Ms. Hoggatt, Ms. Sterrenberg and Mr. Suttmiller are currently seniors (juniors when the lab work was performed) in Chemical Engineering at the University of Arkansas. Their lab reports in CHEG 3232 were selected as sources of material for this paper. W. ROY PENNEY Dr. Penney currently serves as Professor of Chemical Engineering at the University of Arkansas. His research interests include fluid mixing and process design, and he has been instrumental in introducing hands-on concepts into the undergraduate classroom. Professor Penney is a registered professional engineer in the state of Arkansas. EDGAR C. CLAUSEN Dr. Clausen currently serves as Professor, Associate Department Head and the Ray C. Adam Endowed Chair in Chemical Engineering at the University of Arkansas. His research interests include bioprocess engineering, the production of energy and chemicals from biomass and waste, and enhancement of the K-12 educational experience. Professor Clausen is a registered professional engineer in the state of Arkansas.