a truly simultaneous combination of functional transcranial doppler sonography and h2 15o
TRANSCRIPT
A Truly Simultaneous Combination of FunctionalTranscranial Doppler Sonography and H2
15O PETAdds Fundamental New Information onDifferences in Cognitive Activation BetweenSchizophrenics and Healthy Control SubjectsOsama Sabri, MD1,2; Ammar Owega, MD3; Mathias Schreckenberger, MD1; Laszlo Sturz, PhD1; Bruno Fimm, PhD4;Philipp Kunert, MD3; Philipp T. Meyer, MD1,2; Dirk Sander, MD5; and Jurgen Klingelhofer, MD5,6
1Department of Nuclear Medicine, Aachen University of Technology, Aachen, Germany; 2Department of Nuclear Medicine,University of Leipzig, Leipzig, Germany; 3Department of Psychiatry/Psychotherapy, Aachen University of Technology, Aachen,Germany; 4Department of Neuropsychology, Aachen University of Technology, Aachen, Germany; 5Department of Neurology,Technical University Munich, Munich, Germany; and 6Department of Neurology, Klinikum Chemnitz, Chemnitz, Germany
Working memory deficits are a cardinal feature of the patho-physiology of schizophrenia. Lesion studies and functionalblood flow–dependent imaging methods with coarse temporalresolution, such as PET and functional MRI (fMRI), tend to painta fairly static picture of the cortical regions involved. In contrast,functional transcranial Doppler sonography (fTCD) provides ahigh temporal resolution. Truly simultaneous fTCD–fMRI is notyet possible for technical reasons, but H2
15O PET and fTCD canbe used really simultaneously. However, this combination hasnot yet been used for cognitive activations in schizophrenia. Wetherefore investigated the extent to which there are both spatial(PET) and temporal changes (fTCD) in the activation patterns ofschizophrenic patients. Methods: Eleven clinically stablechronic schizophrenic, right-handed patients and 10 healthy,right-handed control subjects, matched for age, sex, education,and intelligence quotient, participated in the study. We selectedstable chronic schizophrenic patients who could perform aworking memory task (N-back task) as well as healthy volun-teers to exclude the possibility of imaged artifacts due to poorperformance. All subjects were examined with a truly simulta-neous fTCD–H2
15O PET combination under cognitive activation.Results: Schizophrenic patients activate a significantly largercortical volume for adequate task performance (P � 0.05), butwith a significantly lower blood flow increase in this volume (P �0.01), than do control subjects. Furthermore, they cannot sig-nificantly increase blood flow velocity during the time course ofcognitive activation as control subjects do. There were onlysignificant correlations between neuropsychologic performanceand imaging parameters (fTCD changes, PET blood flowchanges) in control subjects (all r � �0.65�; P � 0.05), but nosignificant correlations in schizophrenics (all r � �0.3�; P � 0.4).
Conclusion: We demonstrated that schizophrenic patients ex-hibit qualitative differences in the spatial and temporal resolu-tion of cognitive processing. All facts could be interpreted as asign of alternative, less efficient problem-solving strategies inschizophrenia that lead to the working memory deficits ob-served during the further course of this disease. Truly simulta-neous fTCD–PET can be used in neuroscience to add funda-mental new information on spatial and temporal cognitiveactivation behavior to understand the true physiologic nature ofthe disease-specific differences of mental illnesses that areseen as disorders of the mind arising in the brain.
Key Words: PET; functional transcranial Doppler sonography;functional MRI; schizophrenia; working memory
J Nucl Med 2003; 44:671–681
Neuroimaging studies have provided direct evidence offrontal malfunction in schizophrenia, but the results havebeen inconsistent and controversial. In studies of patients atrest, hypofrontality has been an inconsistent finding (1).Recently, we investigated a comparatively large number ofneuroleptic-naive, actively psychotic, first-episode schizo-phrenic patients at rest before and after treatment. Theresults clearly showed that in such patients different positivesymptoms correlated exclusively with either cerebral hyper-or hypoperfusion (2,3). With transcranial Doppler sonogra-phy (TCD) we determined that such schizophrenics showaltered cerebral blood flow velocity (CBFV) in the anterior,middle, and posterior cerebral arteries (ACA, MCA, PCA)(4). After psychopathologic improvement, regional CBFand CBFV normalized (2–4).
Deficits in working memory, a brain system that providestemporary storage and manipulation of the information nec-
Received Jul. 11, 2002; revision accepted Nov. 27, 2002.For correspondence or reprints contact: Osama Sabri, MD, Department of
Nuclear Medicine, University of Leipzig, Liebigstrasse 20a, D-04103 Leipzig,Germany.
E-mail: [email protected]
PET–FTCD ACTIVATIONS IN SCHIZOPHRENIA • Sabri et al. 671
by on January 31, 2018. For personal use only. jnm.snmjournals.org Downloaded from
essary for complex cognitive tasks such as language com-prehension, learning, and reasoning, have been reported tobe a cardinal feature of the pathophysiology of schizophre-nia (5–7). Poor performance on working memory tests inschizophrenia is a strong predictor of poor community out-come and impairment in skills learning (6). Postmortemstudies have shown abnormalities of cortical areas withinthe working memory network, including the prefrontal,cingulate, and temporal cortices (5). However, workingmemory activation paradigms have been reliable in showingprefrontal hypofunction in schizophrenia, but these resultshave been challenged as artifacts of poor performance (1).We therefore selected clinically stable chronic schizo-phrenic patients who could perform a working memory task(N-back task) as well as healthy volunteers to understandthe physiologic nature of the postulated differences in cog-nitive activation between schizophrenics and control sub-jects.
Lesion studies and coarse temporal resolution imagingmethods, such as PET and MRI, tend to paint a fairly staticpicture of the involved cortical regions (8). In contrast, thehigh temporal resolution of functional transcranial Dopplersonography (fTCD) (9) provides a dynamic picture of sub-second changes in working memory effects over the courseof individual trials (10). Furthermore, because all of thesemethods (PET, functional MRI [fMRI], fTCD) determineblood flow–dependent imaging parameters as surrogate pa-rameters of neuronal activity, they are comparable. In prin-ciple, fTCD and PET can be used simultaneously. However,to our knowledge, there is no report in the literature of thiscombination being used for cognitive activation in schizo-phrenic patients. A truly simultaneous fTCD–fMRI combi-nation is not yet possible for technical reasons because theparamagnetic components of fTCD probes do not allow anartifact-free simultaneous fTCD–fMRI acquisition.
We therefore examined schizophrenic patients andhealthy control subjects with a truly simultaneous combi-nation of fTCD and H2
15O PET under working memoryactivation to investigate the extent to which there are bothspatial (PET) and temporal (fTCD) changes in the activationpatterns of schizophrenic patients and how these are influ-enced by the corresponding neuropsychologic performance.
Because results of a recent PET study (11) indicate acinguloparietal dysfunction underlying the impairment ofworking memory control processes in schizophrenia, andbecause in our pretests of this study for the methodologicdevelopment of a truly simultaneous PET–fTCD acquisitionwe found pronounced differences between schizophrenicsand control subjects in the supply area of the ACA, wefocused on a comparison of PET and simultaneous fTCD ofthe ACA. However, to our knowledge, there is no report inthe literature of fTCD of the ACA in schizophrenia and ofthe role of fTCD of the ACA in working memory in healthysubjects. Therefore, a truly simultaneous PET–fTCD acqui-sition can close this gap because PET can serve to cross-validate the findings of fTCD in the ACA.
MATERIALS AND METHODS
SubjectsEleven clinically stable chronic schizophrenic, right-handed
patients (DSM-IV 295.60 (12); 7 male, 4 female; mean age,30.6 � 11.9 y; intelligence quotient [IQ], 110.1 � 13.2) and 10healthy, right-handed comparison subjects, matched for age, sex,education, and IQ (6 male, 4 female; mean age, 30.7 � 10.7 y; IQ,111.1 � 12.3) participated in the study. The subjects with schizo-phrenia were clinically stable, medicated outpatients without cleardelusions, hallucinations, disorganized speech, or grossly disorga-nized or catatonic behavior and with persistent negative symptomsor 2 or more mild symptoms meeting the DSM-IV criterion A forschizophrenia (e.g., unusual ideas) (12). We thereby avoided anartificial influence of strongly pronounced positive symptoms (2,3)on rCBF measurements under working memory stimulation. Fur-thermore, the neuropsychologic performance in the working mem-ory task (N-back task) of all schizophrenic patients did not differsignificantly from that of healthy control subjects. Control subjectswere excluded for any lifetime axis I disorder, first-degree familyhistory of psychotic disorder, substance abuse within 6 mo, neu-rologic illness, previous head trauma, or mental retardation. Allparticipants gave written informed consent and were paid for theirparticipation. This study was performed using a protocol approvedby the local ethics committee.
Activation ParadigmSubjects were scanned under working memory conditions of the
N-back task (5,13). This task has been previously shown to pro-duce activation in a cortical network, including the same regionsinvolved in the Wisconsin Card Sorting Test, and to reveal similarpathophysiologic characteristics in patients with schizophrenia(14,15). Subjects observed random sequences of single numbers atthe center of a display. They pressed a button as quickly aspossible when the number presented was the same as the number2 back in the sequence. As a reference condition (0-back), theypressed a button whenever the number 3 appeared. Stimuli werepresented for 1,500 ms with a 1,500-ms interstimulus interval.Time parameters and the number of critical stimuli were identicalacross both conditions. Neuropsychologic performance (reactiontimes to on-screen stimuli) was stored for later analysis. A 2-backcondition, in which subjects respond according to a number seen 2stimuli before, requires continuous updating of the mental set andthe use of working memory (14). However, both conditions requirethat subjects encode and evaluate each stimulus and respond totargets (13). The 2-back condition further requires that subjectsmaintain the identity and order of 2 previous numbers and contin-uously update this representation. Therefore, in a subtraction de-sign (2 back minus reference condition), all common functionalcomponents that are conceptually independent of working memoryprocesses were not considered (13).
fTCDUsing a 2-MHz–pulsed Doppler device (Pioneer TC4040, soft-
ware version 2.40; Nicolet EME, Kleinostheim, Germany), theintracranial flow patterns of both anterior cerebral arteries (ACA,A2) were investigated simultaneously in the healthy subjects andpatients during working memory tasks. In the preparation phase ofthis study, every subject underwent MRI (Magnetom SP63; Sie-mens Medical Systems, Hoffman Estates, IL; 3-dimensionalFLASH (3D-FLASH) sequence; voxel size, 1 � 1 � 1 mm3; echo
672 THE JOURNAL OF NUCLEAR MEDICINE • Vol. 44 • No. 5 • May 2003
by on January 31, 2018. For personal use only. jnm.snmjournals.org Downloaded from
time [TE], 5 ms; repetition time [TR], 40 ms; flip angle [FA], 40°)to exclude morphologic abnormalities and rare variants of thecircle of Willis. Both ACAs were insonated transtemporally abovethe zygomatic arch, and CBFV was measured at a depth of 70–80mm. In a recent study on 20 healthy control subjects, we showeda high test–retest reproducibility for locating the ACA as well asgood insonation (0.90 � r � 0.95; P � 0.0001) (4). Motionartifacts were avoided by fixing both fTCD probes to the subject’shead in addition to the PET head holder (3,16,17) using a specialfTCD head frame (Spencer Mark 500; Spencer Technologies,Seattle, WA). We did not assess other factors influencing CBFV,such as PCO2, blood pressure, and heart rate frequency duringactivation, because we recently showed that cognitive tasks resultin only minor changes of these factors (18). The start of cognitiveactivation was recorded on-line with an electronic marker signal,and CBFV acquisition was done truly simultaneously with PET.
TCD measures the cerebral blood flow velocity (CBFV) in avessel. Here, CBFV refers to the mean flow velocity (Vmean). Thisis an average of all velocities—which are detected simultaneouslyin real time—along the parabola-shaped laminar flow front, wherevelocity is greatest at the center of the vessel. The various velocitycomponents Vi are weighted with their respective Doppler fre-quency Wi, which varies in proportion with the number of redblood cells flowing at that velocity. The sum of the weightedcomponent velocities is then divided by the sum of all intensitiesthat are proportional to the total number of red blood cells presentin the cross-section of the vessel. This is given by the formula:
Vmean � SUM�Wi � Vi�/SUM�Wi�,
where i stands for the 256 frequencies. (This is comparatively highand very accurate, given that the usual number is 64 or 128.)Therefore, because the flow velocities are directly related to theCBF, fTCD measures the relative CBF changes in a vessel. Duringcarotid artery and intracranial aneurysm surgery in humans, New-ell et al. (19) used electromagnetic flowmetry to directly measureblood flow in the internal carotid artery (ICA) and compared itwith the TCD-measured CBFV in the ipsilateral MCA. Becausethe ICA supplies mostly the MCA area, flow fluctuations in the 2vessels should be nearly identical. During artificially inducedhypotension in patients, both parameters did indeed show highlysimilar changes compared with the initial values before hypoten-sion (r � 0.995; P � 0.001; y � 5.6 � 0.94x). These findingsagree with those of Aaslid et al. (20) and, therefore, it could beshown that CBFV is proportional to CBF.
The spectral envelope curves of the Doppler signal were re-corded with a comparatively high rate of 256 sample points persecond (21) and stored for off-line processing with a special fTCDanalysis computer program (18). Using a specially designed, com-
puter-aided integration procedure (18), the mean CBFV was cal-culated on-line for each heart cycle from the original TCD enve-lope curve. The CBFV curves during the initial resting phase,which were defined as baseline, were normalized to 1; the trials ofeach task were averaged separately for each subject. Mean CBFVchanges were then related to the corresponding baseline values.The average curves of each subject were later used for statisticalanalysis. The reason for averaging was to systematically amplifyevent-dependent changes and to eliminate random variations. Inprestudy tests, we determined that 4 scans for each conditiongenerated a sufficient signal-to-noise ratio for both PET and fTCDin healthy control subjects as well as schizophrenic patients.
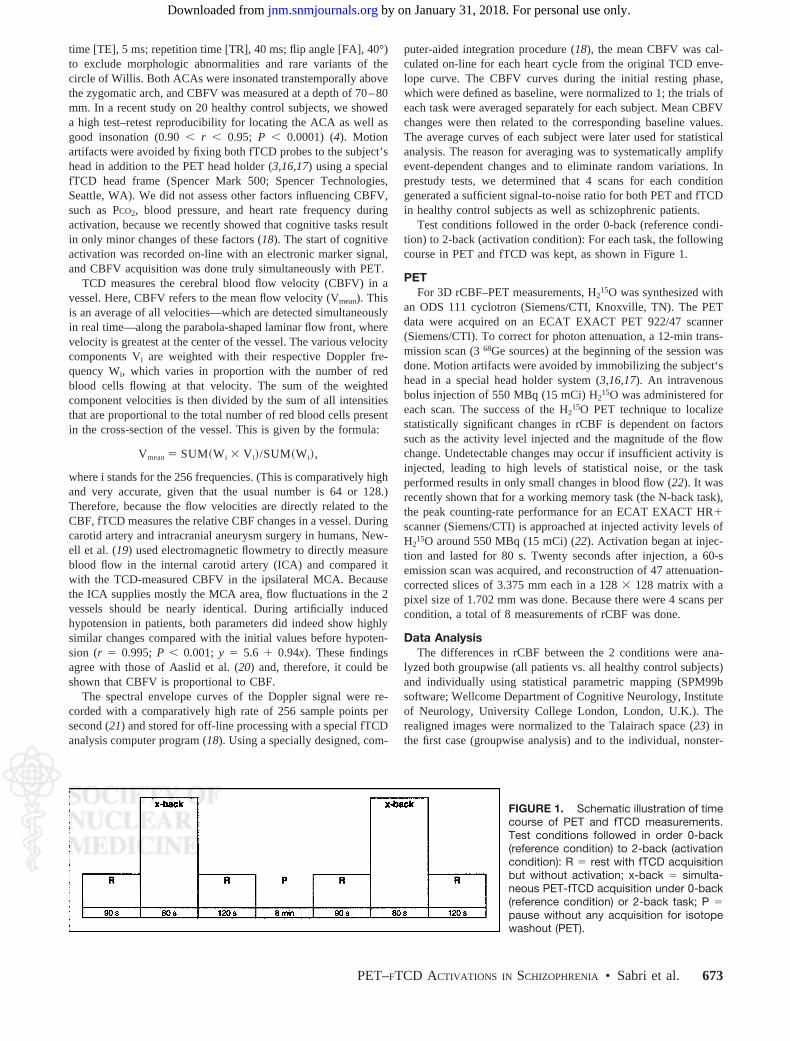
Test conditions followed in the order 0-back (reference condi-tion) to 2-back (activation condition): For each task, the followingcourse in PET and fTCD was kept, as shown in Figure 1.
PETFor 3D rCBF–PET measurements, H2
15O was synthesized withan ODS 111 cyclotron (Siemens/CTI, Knoxville, TN). The PETdata were acquired on an ECAT EXACT PET 922/47 scanner(Siemens/CTI). To correct for photon attenuation, a 12-min trans-mission scan (3 68Ge sources) at the beginning of the session wasdone. Motion artifacts were avoided by immobilizing the subject‘shead in a special head holder system (3,16,17). An intravenousbolus injection of 550 MBq (15 mCi) H2
15O was administered foreach scan. The success of the H2
15O PET technique to localizestatistically significant changes in rCBF is dependent on factorssuch as the activity level injected and the magnitude of the flowchange. Undetectable changes may occur if insufficient activity isinjected, leading to high levels of statistical noise, or the taskperformed results in only small changes in blood flow (22). It wasrecently shown that for a working memory task (the N-back task),the peak counting-rate performance for an ECAT EXACT HR�scanner (Siemens/CTI) is approached at injected activity levels ofH2
15O around 550 MBq (15 mCi) (22). Activation began at injec-tion and lasted for 80 s. Twenty seconds after injection, a 60-semission scan was acquired, and reconstruction of 47 attenuation-corrected slices of 3.375 mm each in a 128 � 128 matrix with apixel size of 1.702 mm was done. Because there were 4 scans percondition, a total of 8 measurements of rCBF was done.
Data AnalysisThe differences in rCBF between the 2 conditions were ana-
lyzed both groupwise (all patients vs. all healthy control subjects)and individually using statistical parametric mapping (SPM99bsoftware; Wellcome Department of Cognitive Neurology, Instituteof Neurology, University College London, London, U.K.). Therealigned images were normalized to the Talairach space (23) inthe first case (groupwise analysis) and to the individual, nonster-
FIGURE 1. Schematic illustration of timecourse of PET and fTCD measurements.Test conditions followed in order 0-back(reference condition) to 2-back (activationcondition): R � rest with fTCD acquisitionbut without activation; x-back � simulta-neous PET-fTCD acquisition under 0-back(reference condition) or 2-back task; P �pause without any acquisition for isotopewashout (PET).
PET–FTCD ACTIVATIONS IN SCHIZOPHRENIA • Sabri et al. 673
by on January 31, 2018. For personal use only. jnm.snmjournals.org Downloaded from
eotactic brains (i.e., the actual acquired, averaged PET images) topreserve the local size of activation or deactivation volumes in thesecond case (individual analysis). The normalized images weresmoothed with a 12-mm full width at half maximum gaussiankernel and clusters with significantly (P � 0.001; minimum clustersize, 30 voxels; voxel size, 2 � 2 � 2 mm3) changed rCBFextracted in both cases.
In the comparison of the 2 groups (groupwise analysis), con-trasts were modeled within SPM99b, which show activations ordeactivations for 1 group or simultaneously both groups as well ascontrasts, where 1 group activates or deactivates more than theother.
Overlaying the individual SPMs with a recent (about 1 wkbefore PET) individual MRI (Siemens Magnetom SP63; 3D-FLASH-sequence; voxel size, 1 � 1 � 1 mm3; TE, 5 ms; TR, 40ms; FA, 40°) for each subject, activated or deactivated clustersbelonging to the supply area of the ACA were identified (individ-ual analysis). The cluster volumes for significant activations anddeactivations as given by SPM analysis results sections werefurther computed. As activations in PET are connected with CBFincreases and deactivations with CBF decreases, the differencesbetween the volumes (volumes of significant activations minusvolumes of significant deactivations) were computed. rCBF dif-ferences were calculated by projecting the clusters onto the aver-aged PET images of each task and computing the mean rCBFdifference in the significant clusters for activation (rCBFactivation
minus rCBFreference condition) and deactivation (rCBFreference condition
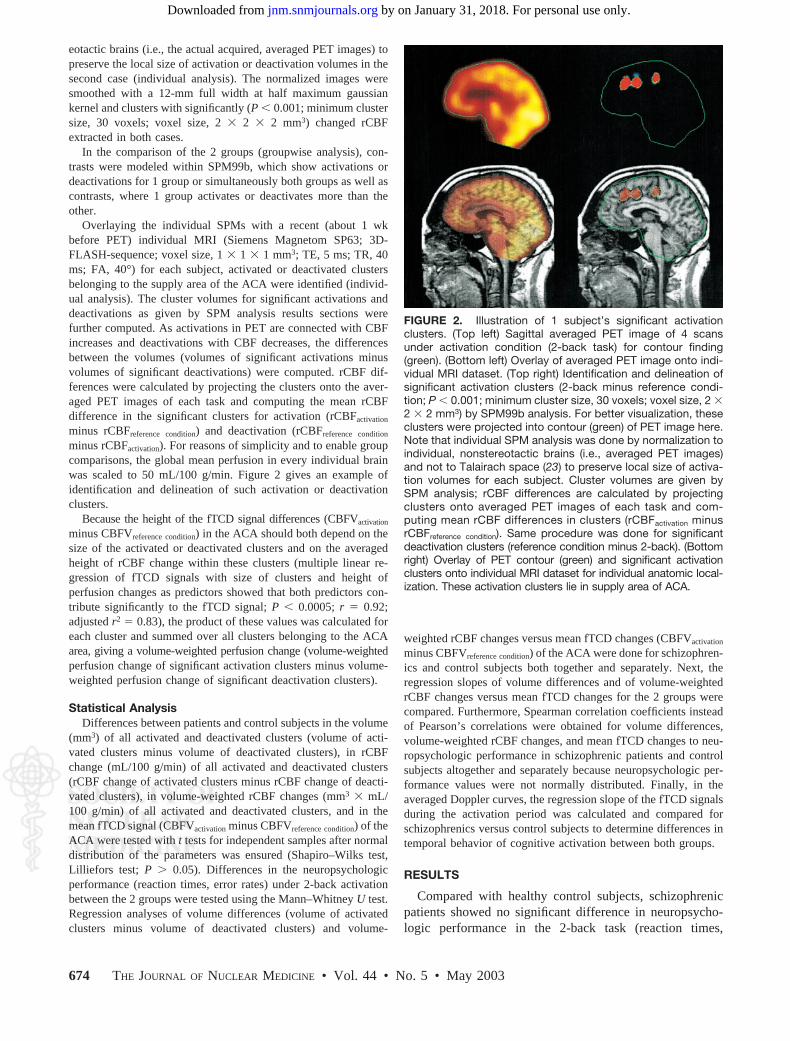
minus rCBFactivation). For reasons of simplicity and to enable groupcomparisons, the global mean perfusion in every individual brainwas scaled to 50 mL/100 g/min. Figure 2 gives an example ofidentification and delineation of such activation or deactivationclusters.
Because the height of the fTCD signal differences (CBFVactivation
minus CBFVreference condition) in the ACA should both depend on thesize of the activated or deactivated clusters and on the averagedheight of rCBF change within these clusters (multiple linear re-gression of fTCD signals with size of clusters and height ofperfusion changes as predictors showed that both predictors con-tribute significantly to the fTCD signal; P � 0.0005; r � 0.92;adjusted r2 � 0.83), the product of these values was calculated foreach cluster and summed over all clusters belonging to the ACAarea, giving a volume-weighted perfusion change (volume-weightedperfusion change of significant activation clusters minus volume-weighted perfusion change of significant deactivation clusters).
Statistical AnalysisDifferences between patients and control subjects in the volume
(mm3) of all activated and deactivated clusters (volume of acti-vated clusters minus volume of deactivated clusters), in rCBFchange (mL/100 g/min) of all activated and deactivated clusters(rCBF change of activated clusters minus rCBF change of deacti-vated clusters), in volume-weighted rCBF changes (mm3 � mL/100 g/min) of all activated and deactivated clusters, and in themean fTCD signal (CBFVactivation minus CBFVreference condition) of theACA were tested with t tests for independent samples after normaldistribution of the parameters was ensured (Shapiro–Wilks test,Lilliefors test; P � 0.05). Differences in the neuropsychologicperformance (reaction times, error rates) under 2-back activationbetween the 2 groups were tested using the Mann–Whitney U test.Regression analyses of volume differences (volume of activatedclusters minus volume of deactivated clusters) and volume-
weighted rCBF changes versus mean fTCD changes (CBFVactivation
minus CBFVreference condition) of the ACA were done for schizophren-ics and control subjects both together and separately. Next, theregression slopes of volume differences and of volume-weightedrCBF changes versus mean fTCD changes for the 2 groups werecompared. Furthermore, Spearman correlation coefficients insteadof Pearson’s correlations were obtained for volume differences,volume-weighted rCBF changes, and mean fTCD changes to neu-ropsychologic performance in schizophrenic patients and controlsubjects altogether and separately because neuropsychologic per-formance values were not normally distributed. Finally, in theaveraged Doppler curves, the regression slope of the fTCD signalsduring the activation period was calculated and compared forschizophrenics versus control subjects to determine differences intemporal behavior of cognitive activation between both groups.
RESULTS
Compared with healthy control subjects, schizophrenicpatients showed no significant difference in neuropsycho-logic performance in the 2-back task (reaction times,
FIGURE 2. Illustration of 1 subject’s significant activationclusters. (Top left) Sagittal averaged PET image of 4 scansunder activation condition (2-back task) for contour finding(green). (Bottom left) Overlay of averaged PET image onto indi-vidual MRI dataset. (Top right) Identification and delineation ofsignificant activation clusters (2-back minus reference condi-tion; P � 0.001; minimum cluster size, 30 voxels; voxel size, 2 �2 � 2 mm3) by SPM99b analysis. For better visualization, theseclusters were projected into contour (green) of PET image here.Note that individual SPM analysis was done by normalization toindividual, nonstereotactic brains (i.e., averaged PET images)and not to Talairach space (23) to preserve local size of activa-tion volumes for each subject. Cluster volumes are given bySPM analysis; rCBF differences are calculated by projectingclusters onto averaged PET images of each task and com-puting mean rCBF differences in clusters (rCBFactivation minusrCBFreference condition). Same procedure was done for significantdeactivation clusters (reference condition minus 2-back). (Bottomright) Overlay of PET contour (green) and significant activationclusters onto individual MRI dataset for individual anatomic local-ization. These activation clusters lie in supply area of ACA.
674 THE JOURNAL OF NUCLEAR MEDICINE • Vol. 44 • No. 5 • May 2003
by on January 31, 2018. For personal use only. jnm.snmjournals.org Downloaded from
536.0 � 89.1 ms vs. 501.4 � 99.7 ms, P � 0.2; error rates,0.34 � 0.46 vs. 0.27 � 0.27, P � 0.2).
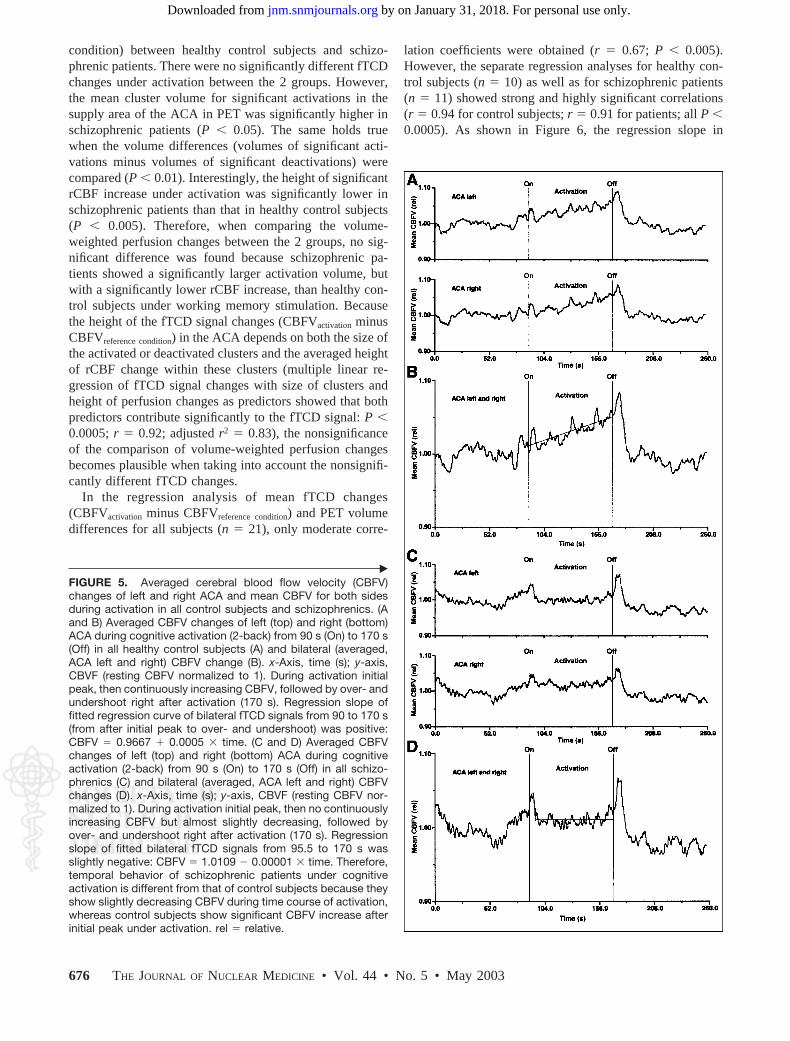
Under working memory activation (2-back task minusreference condition) in PET, healthy control subjects as wellas schizophrenic patients showed significant bilateral acti-vations in the frontoparietal areas as well as in the cerebel-lum (Fig. 3). However, it appears that schizophrenic patientsshowed more extended significant activations in the supplyarea of the ACA.
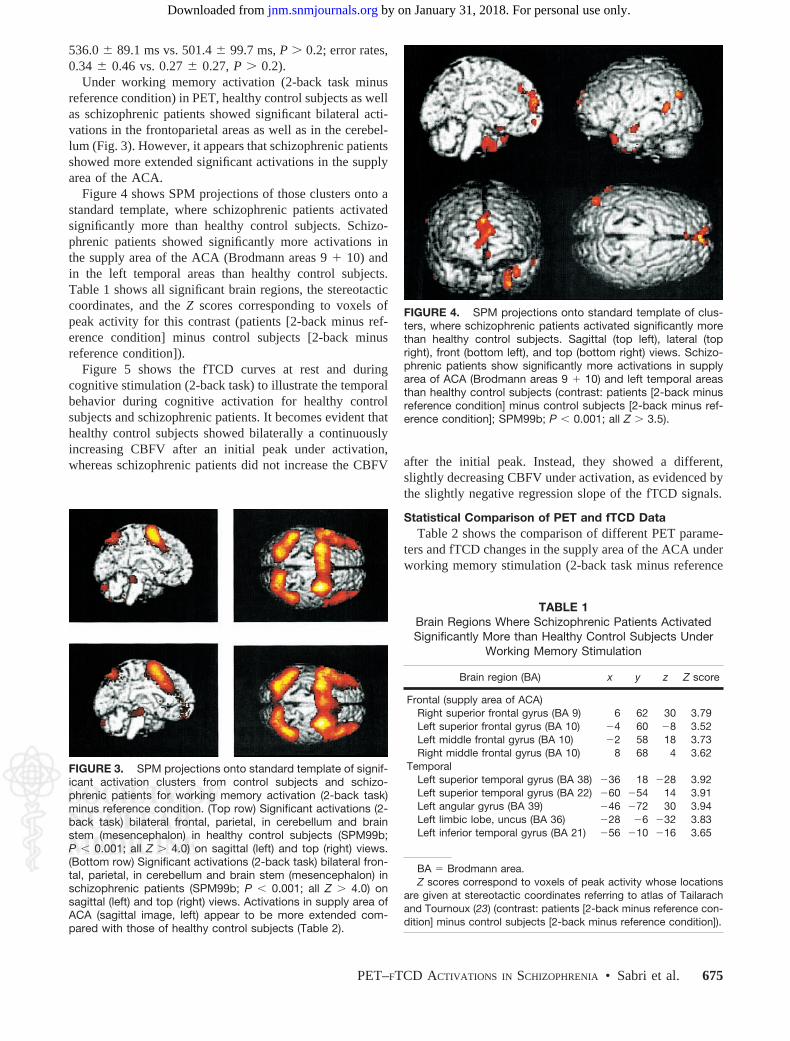
Figure 4 shows SPM projections of those clusters onto astandard template, where schizophrenic patients activatedsignificantly more than healthy control subjects. Schizo-phrenic patients showed significantly more activations inthe supply area of the ACA (Brodmann areas 9 � 10) andin the left temporal areas than healthy control subjects.Table 1 shows all significant brain regions, the stereotacticcoordinates, and the Z scores corresponding to voxels ofpeak activity for this contrast (patients [2-back minus ref-erence condition] minus control subjects [2-back minusreference condition]).
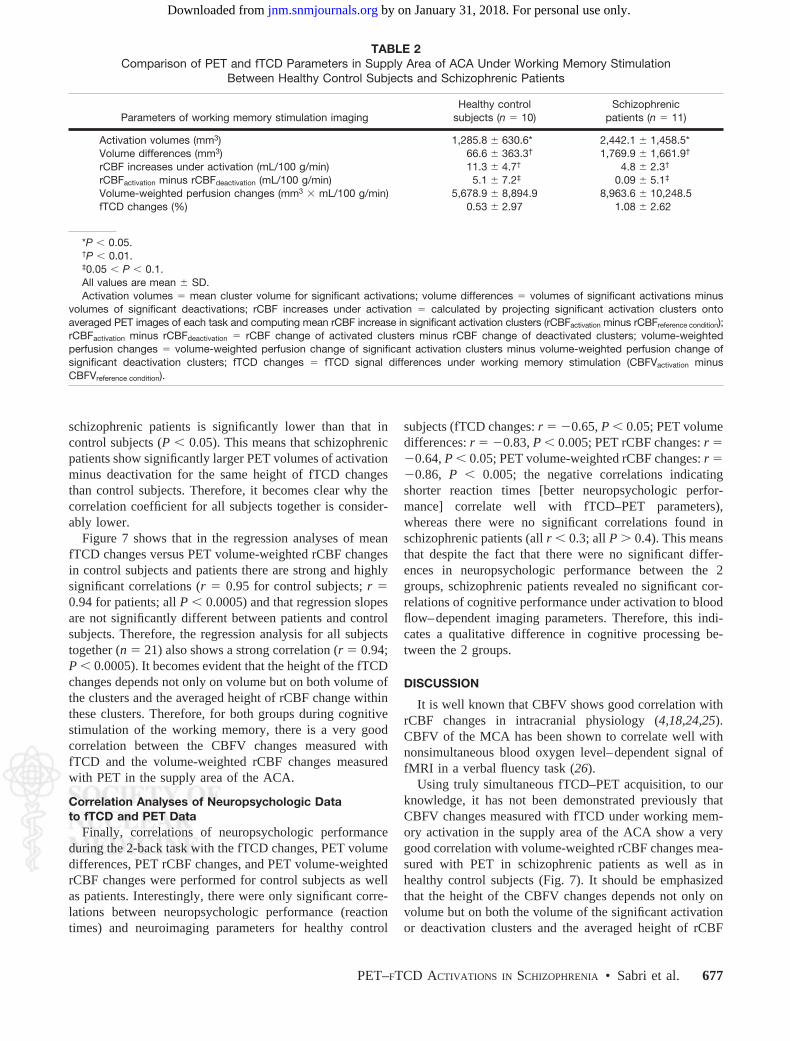
Figure 5 shows the fTCD curves at rest and duringcognitive stimulation (2-back task) to illustrate the temporalbehavior during cognitive activation for healthy controlsubjects and schizophrenic patients. It becomes evident thathealthy control subjects showed bilaterally a continuouslyincreasing CBFV after an initial peak under activation,whereas schizophrenic patients did not increase the CBFV after the initial peak. Instead, they showed a different,
slightly decreasing CBFV under activation, as evidenced bythe slightly negative regression slope of the fTCD signals.
Statistical Comparison of PET and fTCD DataTable 2 shows the comparison of different PET parame-
ters and fTCD changes in the supply area of the ACA underworking memory stimulation (2-back task minus reference
FIGURE 3. SPM projections onto standard template of signif-icant activation clusters from control subjects and schizo-phrenic patients for working memory activation (2-back task)minus reference condition. (Top row) Significant activations (2-back task) bilateral frontal, parietal, in cerebellum and brainstem (mesencephalon) in healthy control subjects (SPM99b;P � 0.001; all Z � 4.0) on sagittal (left) and top (right) views.(Bottom row) Significant activations (2-back task) bilateral fron-tal, parietal, in cerebellum and brain stem (mesencephalon) inschizophrenic patients (SPM99b; P � 0.001; all Z � 4.0) onsagittal (left) and top (right) views. Activations in supply area ofACA (sagittal image, left) appear to be more extended com-pared with those of healthy control subjects (Table 2).
FIGURE 4. SPM projections onto standard template of clus-ters, where schizophrenic patients activated significantly morethan healthy control subjects. Sagittal (top left), lateral (topright), front (bottom left), and top (bottom right) views. Schizo-phrenic patients show significantly more activations in supplyarea of ACA (Brodmann areas 9 � 10) and left temporal areasthan healthy control subjects (contrast: patients [2-back minusreference condition] minus control subjects [2-back minus ref-erence condition]; SPM99b; P � 0.001; all Z � 3.5).
TABLE 1Brain Regions Where Schizophrenic Patients ActivatedSignificantly More than Healthy Control Subjects Under
Working Memory Stimulation
Brain region (BA) x y z Z score
Frontal (supply area of ACA)Right superior frontal gyrus (BA 9) 6 62 30 3.79Left superior frontal gyrus (BA 10) 4 60 8 3.52Left middle frontal gyrus (BA 10) 2 58 18 3.73Right middle frontal gyrus (BA 10) 8 68 4 3.62
TemporalLeft superior temporal gyrus (BA 38) 36 18 28 3.92Left superior temporal gyrus (BA 22) 60 54 14 3.91Left angular gyrus (BA 39) 46 72 30 3.94Left limbic lobe, uncus (BA 36) 28 6 32 3.83Left inferior temporal gyrus (BA 21) 56 10 16 3.65
BA � Brodmann area.Z scores correspond to voxels of peak activity whose locations
are given at stereotactic coordinates referring to atlas of Tailarachand Tournoux (23) (contrast: patients [2-back minus reference con-dition] minus control subjects [2-back minus reference condition]).
PET–FTCD ACTIVATIONS IN SCHIZOPHRENIA • Sabri et al. 675
by on January 31, 2018. For personal use only. jnm.snmjournals.org Downloaded from
condition) between healthy control subjects and schizo-phrenic patients. There were no significantly different fTCDchanges under activation between the 2 groups. However,the mean cluster volume for significant activations in thesupply area of the ACA in PET was significantly higher inschizophrenic patients (P � 0.05). The same holds truewhen the volume differences (volumes of significant acti-vations minus volumes of significant deactivations) werecompared (P � 0.01). Interestingly, the height of significantrCBF increase under activation was significantly lower inschizophrenic patients than that in healthy control subjects(P � 0.005). Therefore, when comparing the volume-weighted perfusion changes between the 2 groups, no sig-nificant difference was found because schizophrenic pa-tients showed a significantly larger activation volume, butwith a significantly lower rCBF increase, than healthy con-trol subjects under working memory stimulation. Becausethe height of the fTCD signal changes (CBFVactivation minusCBFVreference condition) in the ACA depends on both the size ofthe activated or deactivated clusters and the averaged heightof rCBF change within these clusters (multiple linear re-gression of fTCD signal changes with size of clusters andheight of perfusion changes as predictors showed that bothpredictors contribute significantly to the fTCD signal: P �0.0005; r � 0.92; adjusted r2 � 0.83), the nonsignificanceof the comparison of volume-weighted perfusion changesbecomes plausible when taking into account the nonsignifi-cantly different fTCD changes.
In the regression analysis of mean fTCD changes(CBFVactivation minus CBFVreference condition) and PET volumedifferences for all subjects (n � 21), only moderate corre-
lation coefficients were obtained (r � 0.67; P � 0.005).However, the separate regression analyses for healthy con-trol subjects (n � 10) as well as for schizophrenic patients(n � 11) showed strong and highly significant correlations(r � 0.94 for control subjects; r � 0.91 for patients; all P �0.0005). As shown in Figure 6, the regression slope in
‹
FIGURE 5. Averaged cerebral blood flow velocity (CBFV)changes of left and right ACA and mean CBFV for both sidesduring activation in all control subjects and schizophrenics. (Aand B) Averaged CBFV changes of left (top) and right (bottom)ACA during cognitive activation (2-back) from 90 s (On) to 170 s(Off) in all healthy control subjects (A) and bilateral (averaged,ACA left and right) CBFV change (B). x-Axis, time (s); y-axis,CBVF (resting CBFV normalized to 1). During activation initialpeak, then continuously increasing CBFV, followed by over- andundershoot right after activation (170 s). Regression slope offitted regression curve of bilateral fTCD signals from 90 to 170 s(from after initial peak to over- and undershoot) was positive:CBFV � 0.9667 � 0.0005 � time. (C and D) Averaged CBFVchanges of left (top) and right (bottom) ACA during cognitiveactivation (2-back) from 90 s (On) to 170 s (Off) in all schizo-phrenics (C) and bilateral (averaged, ACA left and right) CBFVchanges (D). x-Axis, time (s); y-axis, CBVF (resting CBFV nor-malized to 1). During activation initial peak, then no continuouslyincreasing CBFV but almost slightly decreasing, followed byover- and undershoot right after activation (170 s). Regressionslope of fitted bilateral fTCD signals from 95.5 to 170 s wasslightly negative: CBFV � 1.0109 0.00001 � time. Therefore,temporal behavior of schizophrenic patients under cognitiveactivation is different from that of control subjects because theyshow slightly decreasing CBFV during time course of activation,whereas control subjects show significant CBFV increase afterinitial peak under activation. rel � relative.
676 THE JOURNAL OF NUCLEAR MEDICINE • Vol. 44 • No. 5 • May 2003
by on January 31, 2018. For personal use only. jnm.snmjournals.org Downloaded from
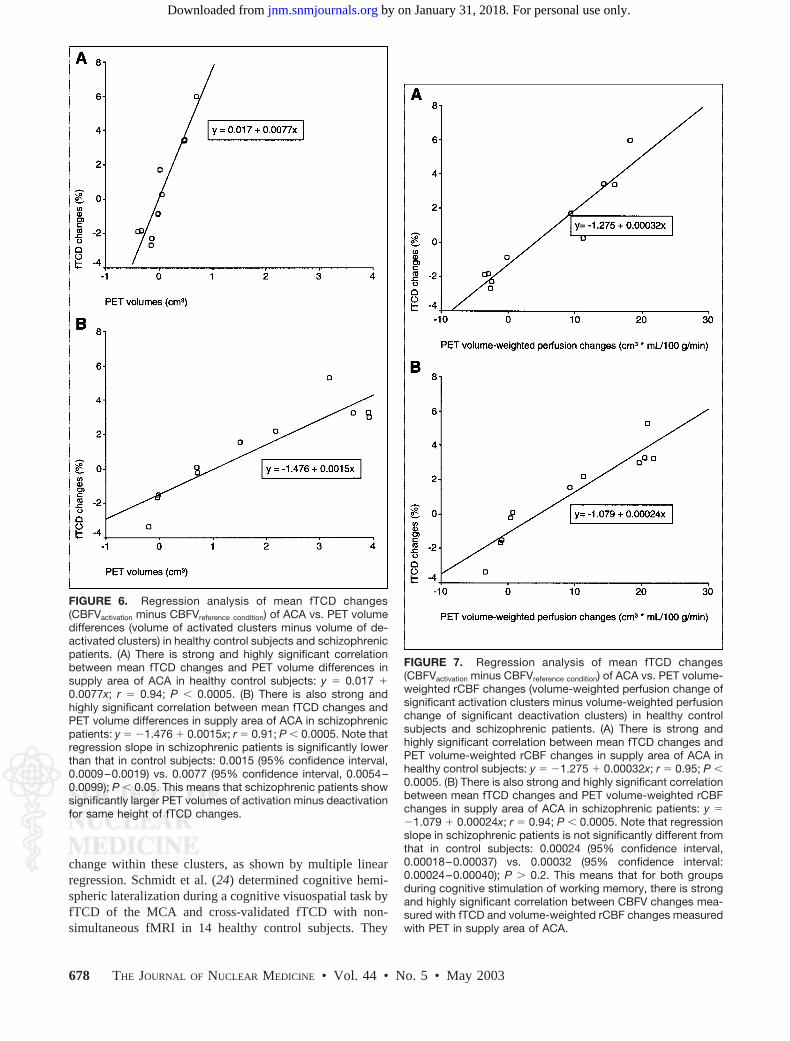
schizophrenic patients is significantly lower than that incontrol subjects (P � 0.05). This means that schizophrenicpatients show significantly larger PET volumes of activationminus deactivation for the same height of fTCD changesthan control subjects. Therefore, it becomes clear why thecorrelation coefficient for all subjects together is consider-ably lower.
Figure 7 shows that in the regression analyses of meanfTCD changes versus PET volume-weighted rCBF changesin control subjects and patients there are strong and highlysignificant correlations (r � 0.95 for control subjects; r �0.94 for patients; all P � 0.0005) and that regression slopesare not significantly different between patients and controlsubjects. Therefore, the regression analysis for all subjectstogether (n � 21) also shows a strong correlation (r � 0.94;P � 0.0005). It becomes evident that the height of the fTCDchanges depends not only on volume but on both volume ofthe clusters and the averaged height of rCBF change withinthese clusters. Therefore, for both groups during cognitivestimulation of the working memory, there is a very goodcorrelation between the CBFV changes measured withfTCD and the volume-weighted rCBF changes measuredwith PET in the supply area of the ACA.
Correlation Analyses of Neuropsychologic Datato fTCD and PET Data
Finally, correlations of neuropsychologic performanceduring the 2-back task with the fTCD changes, PET volumedifferences, PET rCBF changes, and PET volume-weightedrCBF changes were performed for control subjects as wellas patients. Interestingly, there were only significant corre-lations between neuropsychologic performance (reactiontimes) and neuroimaging parameters for healthy control
subjects (fTCD changes: r � 0.65, P � 0.05; PET volumedifferences: r � 0.83, P � 0.005; PET rCBF changes: r �0.64, P � 0.05; PET volume-weighted rCBF changes: r �0.86, P � 0.005; the negative correlations indicatingshorter reaction times [better neuropsychologic perfor-mance] correlate well with fTCD–PET parameters),whereas there were no significant correlations found inschizophrenic patients (all r � 0.3; all P � 0.4). This meansthat despite the fact that there were no significant differ-ences in neuropsychologic performance between the 2groups, schizophrenic patients revealed no significant cor-relations of cognitive performance under activation to bloodflow–dependent imaging parameters. Therefore, this indi-cates a qualitative difference in cognitive processing be-tween the 2 groups.
DISCUSSION
It is well known that CBFV shows good correlation withrCBF changes in intracranial physiology (4,18,24,25).CBFV of the MCA has been shown to correlate well withnonsimultaneous blood oxygen level–dependent signal offMRI in a verbal fluency task (26).
Using truly simultaneous fTCD–PET acquisition, to ourknowledge, it has not been demonstrated previously thatCBFV changes measured with fTCD under working mem-ory activation in the supply area of the ACA show a verygood correlation with volume-weighted rCBF changes mea-sured with PET in schizophrenic patients as well as inhealthy control subjects (Fig. 7). It should be emphasizedthat the height of the CBFV changes depends not only onvolume but on both the volume of the significant activationor deactivation clusters and the averaged height of rCBF
TABLE 2Comparison of PET and fTCD Parameters in Supply Area of ACA Under Working Memory Stimulation
Between Healthy Control Subjects and Schizophrenic Patients
Parameters of working memory stimulation imagingHealthy control
subjects (n � 10)Schizophrenic
patients (n � 11)
Activation volumes (mm3) 1,285.8 � 630.6* 2,442.1 � 1,458.5*Volume differences (mm3) 66.6 � 363.3† 1,769.9 � 1,661.9†
rCBF increases under activation (mL/100 g/min) 11.3 � 4.7† 4.8 � 2.3†
rCBFactivation minus rCBFdeactivation (mL/100 g/min) 5.1 � 7.2‡ 0.09 � 5.1‡
Volume-weighted perfusion changes (mm3 � mL/100 g/min) 5,678.9 � 8,894.9 8,963.6 � 10,248.5fTCD changes (%) 0.53 � 2.97 1.08 � 2.62
*P � 0.05.†P � 0.01.‡0.05 � P � 0.1.All values are mean � SD.Activation volumes � mean cluster volume for significant activations; volume differences � volumes of significant activations minus
volumes of significant deactivations; rCBF increases under activation � calculated by projecting significant activation clusters ontoaveraged PET images of each task and computing mean rCBF increase in significant activation clusters (rCBFactivation minus rCBFreference condition);rCBFactivation minus rCBFdeactivation � rCBF change of activated clusters minus rCBF change of deactivated clusters; volume-weightedperfusion changes � volume-weighted perfusion change of significant activation clusters minus volume-weighted perfusion change ofsignificant deactivation clusters; fTCD changes � fTCD signal differences under working memory stimulation (CBFVactivation minusCBFVreference condition).
PET–FTCD ACTIVATIONS IN SCHIZOPHRENIA • Sabri et al. 677
by on January 31, 2018. For personal use only. jnm.snmjournals.org Downloaded from
change within these clusters, as shown by multiple linearregression. Schmidt et al. (24) determined cognitive hemi-spheric lateralization during a cognitive visuospatial task byfTCD of the MCA and cross-validated fTCD with non-simultaneous fMRI in 14 healthy control subjects. They
FIGURE 7. Regression analysis of mean fTCD changes(CBFVactivation minus CBFVreference condition) of ACA vs. PET volume-weighted rCBF changes (volume-weighted perfusion change ofsignificant activation clusters minus volume-weighted perfusionchange of significant deactivation clusters) in healthy controlsubjects and schizophrenic patients. (A) There is strong andhighly significant correlation between mean fTCD changes andPET volume-weighted rCBF changes in supply area of ACA inhealthy control subjects: y � 1.275 � 0.00032x; r � 0.95; P �0.0005. (B) There is also strong and highly significant correlationbetween mean fTCD changes and PET volume-weighted rCBFchanges in supply area of ACA in schizophrenic patients: y �1.079 � 0.00024x; r � 0.94; P � 0.0005. Note that regressionslope in schizophrenic patients is not significantly different fromthat in control subjects: 0.00024 (95% confidence interval,0.00018–0.00037) vs. 0.00032 (95% confidence interval:0.00024–0.00040); P � 0.2. This means that for both groupsduring cognitive stimulation of working memory, there is strongand highly significant correlation between CBFV changes mea-sured with fTCD and volume-weighted rCBF changes measuredwith PET in supply area of ACA.
FIGURE 6. Regression analysis of mean fTCD changes(CBFVactivation minus CBFVreference condition) of ACA vs. PET volumedifferences (volume of activated clusters minus volume of de-activated clusters) in healthy control subjects and schizophrenicpatients. (A) There is strong and highly significant correlationbetween mean fTCD changes and PET volume differences insupply area of ACA in healthy control subjects: y � 0.017 �0.0077x; r � 0.94; P � 0.0005. (B) There is also strong andhighly significant correlation between mean fTCD changes andPET volume differences in supply area of ACA in schizophrenicpatients: y � 1.476 � 0.0015x; r � 0.91; P � 0.0005. Note thatregression slope in schizophrenic patients is significantly lowerthan that in control subjects: 0.0015 (95% confidence interval,0.0009–0.0019) vs. 0.0077 (95% confidence interval, 0.0054–0.0099); P � 0.05. This means that schizophrenic patients showsignificantly larger PET volumes of activation minus deactivationfor same height of fTCD changes.
678 THE JOURNAL OF NUCLEAR MEDICINE • Vol. 44 • No. 5 • May 2003
by on January 31, 2018. For personal use only. jnm.snmjournals.org Downloaded from
found a significant, but only moderate, correlation betweenfTCD (CBFV) changes and fMRI volume of activated clus-ters (r � 0.54; P � 0.02). However, they did not take intoaccount the influence of the volume of significant deactiva-tions during this task on the CBFV changes. Furthermore,the height of the fMRI signal change should have also beenconsidered, as we showed for PET in our study. Therefore,our correlation of fTCD with PET was much higher (r �0.95, P � 0.0005 for healthy control subjects; r � 0.94, P �0.0005 for schizophrenic patients).
Regarding working memory activation, Cupini et al. (10)studied 22 healthy volunteers with fTCD of the MCA dur-ing visuospatial and verbal working memory tasks. Theysuggested that the high temporal resolution of this techniquewould be promising for further application in CBFV changemonitoring during neuropsychologic studies. Furthermore,it could be very well comparable with results from PET andfMRI because all of these methods determine blood flow–dependent imaging parameters as surrogate parameters ofneuronal activity. However, to our knowledge, there is noreport in the literature of the role of fTCD of the ACA inworking memory and of the role of fTCD of the ACA inschizophrenia. Clearly, the reason for this is that duringmonitoring, the MCA is technically much easier to insonatecontinuously over several minutes than the ACA (27).
Owen et al. (28) demonstrated that working memoryprocesses within the human middorsolateral and midventro-lateral frontal regions are organized according to the type ofprocessing required rather than according to the nature (i.e.,spatial or nonspatial) of the information being processed, ashas been widely assumed. Up to this time, PET and MRIstudies on the verbal and nonverbal working memory inhealthy subjects usually showed broad frontal and parietalactivations even when the stimuli were held constant andonly the memory load changed (29–31). Thus, it seems thatMCA-supplied structures are the main ones affected, butactivations have also been reported for the medial corticalACA-supplied structures, such as the cingulate gyrus or themedial portions of the superior frontal gyrus (30,32–37),which would indicate that these are also part of a dissemi-nated neuronal system for mediating working memory pro-cesses. Postmortem studies of the brains of schizophrenicpatients have also shown abnormalities of cortical areas withinthe working memory network, including the dorsolateral pre-frontal cortex, cingulate, and temporal cortices (5).
However, in our study we demonstrated that schizo-phrenic patients compared with healthy control subjectsshowed significantly different activations, especially in thesupply area of the ACA and the left temporal areas (Fig. 4;Table 1). Artiges et al. (11) investigated brain regionsinvolved in working memory control processes in patientswith schizophrenia. The results suggested a cinguloparietaldysfunction underlying the impairment of working memorycontrol processes during a random number generation taskin patients with schizophrenia (11). Bertolino et al. (5)researched 13 schizophrenic patients with proton magnetic
resonance spectroscopic imaging (to measure N-acetylas-partate as a marker of neuronal pathology) and with PETduring performance of an N-back task. Patients showedworse task performance compared with control subjects. Atraditional criticism of functional neuroimaging studies as-sessing differences in activation by working memory tasksbetween schizophrenic patients and healthy control subjectshas been that patients usually perform worse on these tests,thus making the comparison unfair (1,5). Carter et al. (13)studied 8 patients with schizophrenia and 8 matched com-parison subjects using PET and the N-back task. The rCBFresponse to increased working memory load was signifi-cantly reduced in the patients’ right dorsolateral prefrontalcortex, but the patients’ task performance was significantlyworse (P � 0.0001). We therefore studied 11 clinicallystable chronic schizophrenic patients with no significantdifference in performance of a 2-back task to detect differ-ences that cannot be challenged as artifacts of poor perfor-mance. Because we recently showed that different positivesymptoms in schizophrenics correlate exclusively with ei-ther hyper- or hypoperfusion of the cerebral cortex (2,3), weavoided an artificial influence of strongly pronounced pos-itive symptoms on rCBF measurements under the 2-backtask by using special patient selection criteria. Furthermore,control subjects were matched individually for age, sex,education, and IQ because several studies indicate age dif-ferences in the frontal lateralization of verbal and spatialworking memory revealed by PET (38–40). The fact thatour schizophrenic patients showed significantly more acti-vations in the supply area of the ACA and left temporalareas (with a task performance comparable with that ofcontrol subjects) could be interpreted as recruitment tocompensate for partial neural dysfunction, as is speculatedfor age-related neural declines and more extended activa-tions in control subjects (40). However, the fact that onlyhealthy control subjects show a good correlation betweentask performance and blood flow–dependent imaging pa-rameters indicates a qualitative difference in cognitive pro-cessing between control subjects and schizophrenic pa-tients. Artiges et al. (11) also found no correlation betweenactivity in the anterior cingulate (supply area of the ACA)and task performance in schizophrenics.
Using truly simultaneous fTCD–PET acquisition, to ourknowledge, it has not been shown previously that schizo-phrenic patients show a significant and qualitative differ-ence in the temporal (Fig. 5) and spatial resolution (Fig. 4;Table 1) of cognitive processing compared with healthycontrol subjects. Under working memory stimulation, theyactivate a significantly larger cortical volume, perhaps toensure adequate task performance but with a significantlylower increase of rCBF in this volume, than control sub-jects. The healthy subjects activated a certain number ofneurons in the ACA-supplied area (qualitative strategy, Fig.3). After an initial peak at the beginning of the task, whichis physiologically quite normal in activation studies usingfTCD, they showed a slight reactive rise in CBFV that
PET–FTCD ACTIVATIONS IN SCHIZOPHRENIA • Sabri et al. 679
by on January 31, 2018. For personal use only. jnm.snmjournals.org Downloaded from
increased steadily throughout the task (Fig. 5). This wouldsuggest that, when executing a cognitive task, control sub-jects continuously increased neuronal activity. This increasein activity caused an increase in the neuronal metabolism,which in turn caused an increase in rCBF and a continuousrise in CBFV (Fig. 5). Thus, during a working memory task,healthy subjects were capable of adapting their neuronalactivity, and hence rCBF, to the current need. In contrast,schizophrenic patients showed a completely different strat-egy. They activated a significantly larger cortical volume(i.e., much greater number of neurons) (Figs. 3 and 4; Table2). After the initial peak and a likewise slight reactive risein CBFV, their CBFV remained essentially constantthroughout the task and even decreased slightly (Fig. 5).This would suggest that patients activate a larger number ofspecific and unspecific neurons already at the beginning ofthe test (quantitative strategy). The patients evidently thencould not further increase neuronal activity during the timecourse of cognitive activation, as shown by the patients’essentially unchanged reactive CBFV (Fig. 5).
The temporal weight of flow information in bolus-in-jected H2
15O PET scans is not uniform throughout the scanduration. In fact, the CBF-sensitive part of the scan ismainly restricted to a relatively short time window of 15- to20-s length after the arrival of the radiotracer in the brain(41). This CBF-sensitive window may be too short forcomplex activation paradigms, particularly those of longerduration (e.g., the go-‘n-get-me-a-beer-task (41)). Regard-ing the N-back task, the bolus injection method with PETscans of 60-s duration starting 20 s after injection seems tobe well suited as shown by other groups (5,13). However,one might suggest, that the wider PET activation clusters inour patient group could be due to the relatively higher flowvelocity during the very initial part of the activation task(peaks) in the patient group compared with healthy controlsubjects as shown in the fTCD–CBFV diagram (Fig. 5). It istherefore important to emphasize that the PET scans werestarted 20 s after the injection of the radiotracer, whereas theactivation task and the fTCD acquisition were started im-mediately upon injection of the radiotracer. Thus, the PETscans were securely started after the initial flow peak in thefTCD–CBFV diagrams.
CONCLUSION
We showed that schizophrenic patients exhibit qualitativedifferences in the spatial and temporal resolution of cogni-tive processing. All facts could be interpreted as a sign ofalternative, less-efficient problem-solving strategies inschizophrenia, less efficient than those used by healthycontrol subjects, which lead to the working memory deficitsobserved during the further course of this disease. A trulysimultaneous combination of fTCD and H2
15O PET can beused in neuroscience to add fundamental new informationon both spatial and temporal cognitive activation behaviorto understand the true physiologic nature of the disease-
specific differences of mental illnesses that are seen asdisorders of the mind arising in the brain (42).
ACKNOWLEDGMENTS
The authors thank Keyvan Setani for patient manage-ment, Alejandro Rodon for language editing, and KlausWillmes for guidance and supervision during the statisticalanalysis. This study was supported by a grant from theInterdisciplinary Center for Clinical Research-Central Ner-vous System (IZKF-ZNS) of the Aachen University ofTechnology.
REFERENCES
1. Weinberger DR, Berman KF. Prefrontal function in schizophrenia: confoundsand controversies. Philos Trans R Soc Lond B Biol Sci. 1996;351:1495–1503.
2. Sabri O, Erkwoh R, Schreckenberger M, et al. Regional cerebral blood flow andnegative/positive symptoms in 24 drug-naive schizophrenics. J Nucl Med. 1997;38:181–188.
3. Sabri O, Erkwoh R, Schreckenberger M, Owega A, Sass H, Buell U. Correlationof positive symptoms exclusively to hyperperfusion or hypoperfusion of cerebralcortex in never-treated schizophrenics. Lancet. 1997;349:1735–1739.
4. Owega A, Klingelhofer J, Sabri O, Kunert HJ, Albers M, Sass H. Cerebral bloodflow velocity in acute schizophrenic patients: a transcranial Doppler ultrasonog-raphy study. Stroke. 1998;29:1149–1154.
5. Bertolino A, Esposito G, Callicott JH, et al. Specific relationship betweenprefrontal neuronal N-acetylaspartate and activation of the working memorycortical network in schizophrenia. Am J Psychiatry. 2000;157:26–33.
6. Liddle PF. Cognitive impairment in schizophrenia: its impact on social function-ing. Acta Psychiatr Scand Suppl. 2000;400:11–16.
7. Baddeley A. Working memory. Science. 1992;255:556–559.8. Gevins A, Smith ME, Le J, et al. High resolution evoked potential imaging of the
cortical dynamics of human working memory. Electroencephalogr Clin Neuro-physiol. 1996;98:327–348.
9. Conrad B, Klingelhofer J. Dynamics of regional cerebral blood flow for variousvisual stimuli. Exp Brain Res. 1989;77:437–441.
10. Cupini LM, Matteis M, Troisi E, et al. Bilateral simultaneous transcranialDoppler monitoring of flow velocity changes during visuospatial and verbalworking memory tasks. Brain. 1996;119:1249–1253.
11. Artiges E, Salame P, Recasens C, et al. Working memory control in patients withschizophrenia: a PET study during a random number generation task. Am JPsychiatry. 2000;157:1517–1519.
12. American Psychiatric Association. Diagnostic and Statistical Manual of MentalDisorders. 4th ed., text revision. Washington, DC: American Psychiatric Asso-ciation; 2000.
13. Carter CS, Perlstein W, Ganguli R, Brar J, Mintun M, Cohen JD. Functionalhypofrontality and working memory dysfunction in schizophrenia. Am J Psychi-atry. 1998;155:1285–1287.
14. Callicott JH, Ramsey NF, Tallent K, et al. Functional magnetic resonanceimaging brain mapping in psychiatry: methodological issues illustrated in a studyof working memory in schizophrenia. Neuropsychopharmacology. 1998;18:186–196.
15. Callicott JH, Mattay VS, Bertolino A, et al. Physiological characteristics ofcapacity constraints in working memory as revealed by functional MRI. CerebCortex. 1999;9:20–26.
16. Sabri O, Hellwig D, Schreckenberger M, et al. Correlation of neuropsychological,morphological and functional (regional cerebral blood flow and glucose utiliza-tion) findings in cerebral microangiopathy. J Nucl Med. 1998;39:147–154.
17. Sabri O, Ringelstein EB, Hellwig D, et al. Neuropsychological impairmentcorrelates with hypoperfusion and hypometabolism but not with severity of whitematter lesions on MRI in patients with cerebral microangiopathy. Stroke. 1999;30:556–566.
18. Klingelhofer J, Matzander G, Sander D, Schwarze J, Boecker H, Bischoff C.Assessment of functional hemispheric asymmetry by bilateral simultaneous ce-rebral blood flow velocity monitoring. J Cereb Blood Flow Metab. 1997;17:577–585.
19. Newell DW, Aaslid R, Lam A, Mayberg TS, Winn HR. Comparison of flow andvelocity during dynamic autoregulation testing in humans. Stroke. 1994;25:793–797.
20. Aaslid R, Newell DW, Stooss R, Sorteberg W, Lindegaard KF. Assessment of
680 THE JOURNAL OF NUCLEAR MEDICINE • Vol. 44 • No. 5 • May 2003
by on January 31, 2018. For personal use only. jnm.snmjournals.org Downloaded from
cerebral autoregulation dynamics from simultaneous arterial and venous trans-cranial Doppler recordings in humans. Stroke. 1991;22:1148–1154.
21. Knecht S, Deppe M, Ringelstein EB, et al. Reproducibility of functional trans-cranial Doppler sonography in determining hemispheric language lateralization.Stroke. 1998;29:1155–1159.
22. Isoardi RA, Townsend DW, Carter CS, Herbster A, Dachille MA, Meltzer CC. Astudy of injected dose for brain mapping on the ECAT HR�: activation maps fora parametric verbal working memory task. Neuroimage. 1999;9:145–153.
23. Talairach J, Tournoux P. Co-Planar Stereotaxic Atlas of the Human Brain. NewYork, NY: Thieme Medical; 1988.
24. Schmidt P, Krings T, Willmes K, Roessler F, Reul J, Thron A. Determination ofcognitive hemispheric lateralization by “functional” transcranial Doppler cross-validated by functional MRI. Stroke. 1999;30:939–945.
25. Bishop CC, Powell S, Rutt D, Browse NL. Transcranial Doppler measurement ofmiddle cerebral artery blood flow velocity: a validation study. Stroke. 1986;17:913–915.
26. Deppe M, Knecht S, Papke K, et al. Assessment of hemispheric languagelateralization: a comparison between fMRI and fTCD. J Cereb Blood FlowMetab. 2000;20:263–268.
27. Ringelstein EB, Kahlscheuer B, Niggemeyer E, Otis SM. Transcranial Dopplersonography: anatomical landmarks and normal velocity values. Ultrasound MedBiol. 1990;16:745–761.
28. Owen AM, Herrod NJ, Menon DK, et al. Redefining the functional organizationof working memory processes within human lateral prefrontal cortex. Eur J Neu-rosci. 1999;11:567–574.
29. Cabeza R, Nyberg L. Imaging cognition II: an empirical review of 275 PET andfMRI studies. J Cogn Neurosci. 2000;12:1–47.
30. Jonides J, Schumacher EH, Smith EE, et al. The role of parietal cortex in verbalworking memory. J Neurosci. 1998;18:5026–5034.
31. Rypma B, D’Esposito M. Isolating the neural mechanisms of age-related changesin human working memory. Nat Neurosci. 2000;3:509–515.
32. Cowell SF, Egan GF, Code C, Harasty J, Watson JD. The functional neuroanat-omy of simple calculation and number repetition: a parametric PET activationstudy. Neuroimage. 2000;12:565–573.
33. Petrides M, Alivisatos B, Meyer E, Evans AC. Functional activation of the humanfrontal cortex during the performance of verbal working memory tasks. Proc NatlAcad Sci USA. 1993;90:878–882.
34. Petrides M, Alivisatos B, Evans AC, Meyer E. Dissociation of human mid-dorsolateral from posterior dorsolateral frontal cortex in memory processing.Proc Natl Acad Sci USA. 1993;90:873–877.
35. Schumacher EH, Lauber E, Awh E, Jonides J, Smith EE, Koeppe RA. PETevidence for an amodal verbal working memory system. Neuroimage. 1996;3:79–88.
36. Smith EE, Jonides J. Storage and executive processes in the frontal lobes.Science. 1999;283:1657–1661.
37. Van der Linden M, Collette F, Salmon E, et al. The neural correlates of updatinginformation in verbal working memory. Memory. 1999;7:549–560.
38. Esposito G, Kirkby BS, Van Horn JD, Ellmore TM, Berman KF. Context-dependent, neural system-specific neurophysiological concomitants of age-ing: mapping PET correlates during cognitive activation. Brain. 1999;122:963–979.
39. Jonides J, Marshuetz C, Smith EE, Reuter-Lorenz PA, Koeppe RA, Hartley A.Age differences in behavior and PET activation reveal differences in interferenceresolution in verbal working memory. J Cogn Neurosci. 2000;12:188–196.
40. Reuter-Lorenz PA, Jonides J, Smith EE, et al. Age differences in the frontallateralization of verbal and spatial working memory revealed by PET. J CognNeurosci. 2000;12:174–187.
41. Beason-Held LL, Desmond RE, Herscovitch P, Carson RE. Bolus injectionversus slow infusion of [15O]water for positron emission tomography activationstudies. J Cereb Blood Flow Metab. 1999;19:843–852.
42. Andreasen NC. Linking mind and brain in the study of mental illnesses: a projectfor a scientific psychopathology. Science. 1997;275:1586–1593.
PET–FTCD ACTIVATIONS IN SCHIZOPHRENIA • Sabri et al. 681
by on January 31, 2018. For personal use only. jnm.snmjournals.org Downloaded from
2003;44:671-681.J Nucl Med. Dirk Sander and Jürgen KlingelhöferOsama Sabri, Ammar Owega, Mathias Schreckenberger, Laszlo Sturz, Bruno Fimm, Philipp Kunert, Philipp T. Meyer, Activation Between Schizophrenics and Healthy Control Subjects
O PET Adds Fundamental New Information on Differences in Cognitive152and H
A Truly Simultaneous Combination of Functional Transcranial Doppler Sonography
http://jnm.snmjournals.org/content/44/5/671This article and updated information are available at:
http://jnm.snmjournals.org/site/subscriptions/online.xhtml
Information about subscriptions to JNM can be found at:
http://jnm.snmjournals.org/site/misc/permission.xhtmlInformation about reproducing figures, tables, or other portions of this article can be found online at:
(Print ISSN: 0161-5505, Online ISSN: 2159-662X)1850 Samuel Morse Drive, Reston, VA 20190.SNMMI | Society of Nuclear Medicine and Molecular Imaging
is published monthly.The Journal of Nuclear Medicine
© Copyright 2003 SNMMI; all rights reserved.
by on January 31, 2018. For personal use only. jnm.snmjournals.org Downloaded from