a two-dimensional zeolitic imidazolate framework with … · 5 supplementary information . a...
TRANSCRIPT

5
Supplementary Information
A Two-Dimensional Zeolitic Imidazolate Framework with a
Cushion-Shaped Cavity for CO2 Adsorption Rizhi Chen, a,b Jianfeng Yao, a Qinfen Gu, c Stef Smeets, d Christian Baerlocher, d Haoxue Gu, b
Dunru Zhu, b William Morris, e Omar M. Yaghi, f Huanting Wang*a a Department of Chemical Engineering, Monash University, Clayton, Victoria 3800, Australia.
Email: [email protected] b State Key Laboratory of Materials-Oriented Chemical Engineering, Nanjing University of
Technology, Nanjing 210009, P. R. China c Australian Synchrotron, Clayton, Vic 3168, Australia d ETH Zurich, Laboratory of Crystallography, CH-8093 Zurich, Switzerland e Department of Chemistry, Northwestern University, Evanston, IL 60208, USA f Department of Chemistry, University of California-Berkeley, and Molecular Foundry, Lawrence
Berkeley National Laboratory, Berkeley, CA 94720, USA
Sample synthesis and characterization
Zn(NO3)2·6H2O (98%) and 2-methylimidazole (Hmim) (99%) were purchased from Sigma-Aldrich,
and used as received without further purification. ZIF-L crystals with leaf-like morphology were
synthesized at room temperature in an aqueous system with a Hmim to zinc ions molar ratio of 8.
Typically, 0.59 g of Zn(NO3)2·6H2O and 1.30 g of Hmim were dissolved in 40 mL deionized water
respectively, and then the aqueous solution of zinc nitrate was added into the aqueous solution of
Hmim under stirring. The mixture was stirred at room temperature for 4 h. The product was
collected by repeated centrifugation (at 6000 rpm for 20 min) and washed by water for three times,
and then dried in an oven at 70 ˚C overnight.
SEM images were taken with a JSM-7100F microscope (JEOL). Nitrogen physisorption isotherms
were measured at 77 K on an automatic volumetric adsorption apparatus (Micromertics ASAP
Electronic Supplementary Material (ESI) for Chemical CommunicationsThis journal is © The Royal Society of Chemistry 2013
6
2020). CO2 and CH4 adsorption isotherms were obtained with a Micromeritics ASAP 2010 analyzer
at room temperature. The samples were activated in hot methanol (60 oC). After drying, they were
degassed at 383 K for 24 h prior to the sorption measurements. Elemental analysis of as-prepared
ZIF-L was performed by the Galbraith Laboratories, Inc. Knoxville, TN 37921-1750, USA
Elemental composition of as-synthesized ZIF-L
The composition of ZIF-L prior to activation was determined to be
Zn(mim)2·(Hmim)1/2·(H2O)3/2 (C10H16N5O3/2Zn) from the elemental analysis result (C: 40.50; H:
4.86; N: 25.30). The values calculated from the above molecular formula: C: 40.62; H: 5.45; N:
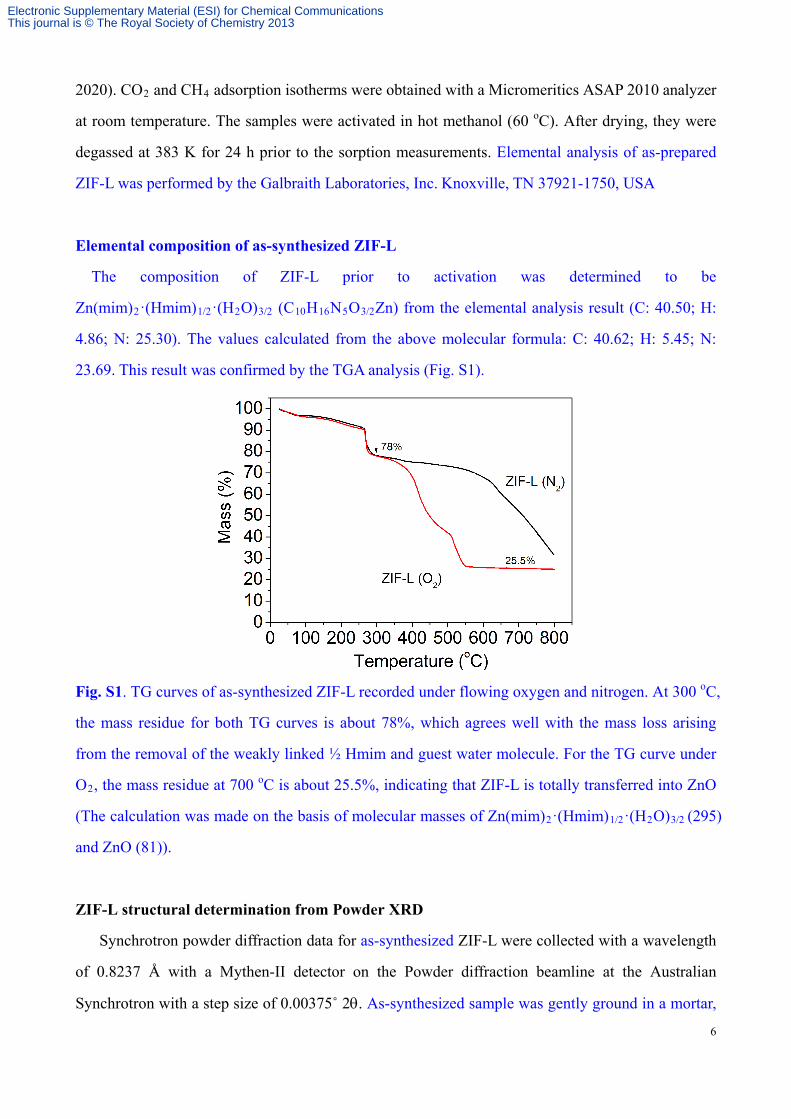
23.69. This result was confirmed by the TGA analysis (Fig. S1).
Fig. S1. TG curves of as-synthesized ZIF-L recorded under flowing oxygen and nitrogen. At 300 oC,
the mass residue for both TG curves is about 78%, which agrees well with the mass loss arising
from the removal of the weakly linked ½ Hmim and guest water molecule. For the TG curve under
O2, the mass residue at 700 oC is about 25.5%, indicating that ZIF-L is totally transferred into ZnO
(The calculation was made on the basis of molecular masses of Zn(mim)2·(Hmim)1/2·(H2O)3/2 (295)
and ZnO (81)).
ZIF-L structural determination from Powder XRD
Synchrotron powder diffraction data for as-synthesized ZIF-L were collected with a wavelength
of 0.8237 Å with a Mythen-II detector on the Powder diffraction beamline at the Australian
Synchrotron with a step size of 0.00375˚ 2θ. As-synthesized sample was gently ground in a mortar,
Electronic Supplementary Material (ESI) for Chemical CommunicationsThis journal is © The Royal Society of Chemistry 2013

7
and then loaded into 0.7 mm glass capillaries. The pattern was indexed with an orthorhombic unit
cell (a = 24.0610 Å, b = 16.9673 Å, c = 19.6783 Å) using the program Topas.1 The large
background at low angles was manually removed and data was binned to 0.01˚ 2θ to eliminate the
noise in the data. This significantly eased the extraction of the reflection intensities using the
Pawley peak fitting procedure in Topas. The structure solution was started using the powder
charge-flipping algorithm (pCF) implemented in the program Superflip.2 Two Zn atoms were easily
located in the electron density maps and the space group was determined to be Cmce. However, it
was difficult to locate the imidazole molecules directly. The Zn-Zn framework distance of 6.0 Å
was consistent with that of similar ZIF structures, so a tentative model could be constructed by
placing Mim molecules midway between the Zn atoms. The correct orientation of the Mim
molecules was found with the program Topas in the following way: Zn-Mim-Zn fragments were
constructed as rigid bodies. The Zn atoms were treated as dummy atoms in the rigid body fragments
and their positions were restrained to the positions located in the pCF electron density maps.
Consequently, the orientation of the Mim fragments could be refined by allowing rotations only
around their respective Zn-Zn axis. This essentially reduced the number of parameters for the
orientation of the Mim molecules to 4. The starting orientations were randomised for many runs in
order to eliminate the possibility of local minima and optimised considering intermolecular distance.
Using difference Fourier maps a 5th Mim molecule could be located that connected to the “free”
N46-atoms of two monodentate Mim-4 molecules. The N46 – N55 distance refined to 2.66 Å which
is somewhat shorter than the N-H···N hydrogen bond distance of 2.82 Å found in the crystal
structure of 2-methylimidazole.3 Further improvements to the structure could be made by locating
two water molecules in the voids using difference Fourier maps. Refinement of the framework
converged with an Rwp value of 0.0755.
To get a better understanding of the CO2 sorption the XRD data collected for the 100 kPa
sorption experiment were used in a Rietveld refinement. Since the sorption of CO2 did not change
the XRD pattern significantly, the structure of the as made sample could be used as a starting point.
All cell parameters were somewhat shorter after the sorption, resulting in a volume decrease of the
unit cell of 1.15%. The CO2 molecule could be located in the cavity using difference Fourier maps.
It was refined to an occupancy of about 0.5, so it was fixed at this value. There are two
symmetrically equivalent CO2 molecules in the cavity with an O…O distance of 2.5 Å, which
Electronic Supplementary Material (ESI) for Chemical CommunicationsThis journal is © The Royal Society of Chemistry 2013

8
means that both molecules are probably not present at the same time. An additional water position
was also found in the cavity that was also fixed at an occupancy of 0.5. Apparently, the in-situ
outgassing on the capillary was not complete. The total amount of CO2 found in the refinement is
about 1 mmol/g, which is in good agreement with the value found in the sorption experiment.
In both refinements the Hmim molecules were geometrically restricted to the bond distances
found in the single crystal refinement of 2-Methylimidazole.3 In addition, soft restraints were
applied the Zn-N distances and N-Zn-N tetrahedral angles. Except for the Zn atoms, the
displacement factors were constraint to be the same for each atom type. Details of the data
collection and refinements are listed in Table S1.
In-situ XRD measurements
High pressure synchrotron x-ray diffraction experiments were performed at the Powder
diffraction beamline, Australian Synchrotron. The 2D diffraction data were collected on a Mar165
CCD detector using a wavelength of 0.6881 Å. The 2D diffraction images were integrated by the
use of the program fit2d. High pressures up to 6.3 GPa were generated by use of a diamond anvil
cell (easyLab) at room temperature. A mixture of methanol and ethanol (4:1) was served as
pressure-transmitting medium. To minimize deviatoric stress, the amount of pressure medium
covered ca. 30% of the total volume (materials 70%) of the sample chamber within a rhenium
gasket. A ruby crystal was placed into the sample chamber as a pressure marker and the pressures
were determined using the ruby fluorescence technique. For in-situ CO2 absorption measurements,
the sample was first loaded into a 0.7 mm quartz capillary into a flow cell, and then it was pumped
under vacuum overnight at 100 °C. After cooling down to room temperature in vacuum the flow
cell was mounted onto the diffractometer for XRD measurement, then high purity CO2 (99.99%)
was introduced into the flow cell and stabilized for 5 min with 10 min data collection time at 20, 50,
and 100 kPa, respectively. The refined XRD results show that the H2O molecules cannot be totally
pumped out from the structure; this may due to insufficient vacuum from the roughing pump (about
10-3 torr).
Electronic Supplementary Material (ESI) for Chemical CommunicationsThis journal is © The Royal Society of Chemistry 2013

9
Table S1. Experimental and crystallographic data for ZIF-L
ZIF-L at 298K ZIF-L CO2 at 100kPa Data Collection Synchrotron facility Australian Synchrotron Beamline Powder diffraction Wavelength (Å) 0.8237 0.6881 Detector Mythen-II Mythen-II Unit Cell Space group Cmce Cmce a 24.1191(5) 24.0175(5) b 17.0604(3) 17.0004(4) c 19.7398(4) 19.6651(4) Refinement 2θ range (˚2θ) used 3.0 - 40.0 2.7 - 40.0 step size (˚2θ) 0.01 (binned) 0.01 (binned) Number of observations 3700 3699 Soft restrictions 96 Zn-N 1.985 Å N-Zn-N 109.47˚ Number of rigid Mim’s 5 Number of structural parameters 75 91 Rwp 0.075 0.134 Rexp 0.049 0.124
Electronic Supplementary Material (ESI) for Chemical CommunicationsThis journal is © The Royal Society of Chemistry 2013

10
Fig. S2. Rietveld refinement profile for ZIF-L sample showing observed (blue line), calculated (red
line), and difference (grey line) plots. The positions of Bragg reflections (tick marks) are shown for
ZIF-L. The data was collected at a wavelength of 0.6881 Å at room temperature under 100 kPa
CO2.
Electronic Supplementary Material (ESI) for Chemical CommunicationsThis journal is © The Royal Society of Chemistry 2013

11
Table S2. Comparison of CO2 adsorption capacity for various ZIFs and MOFs.
Sample Temperature
/K
Pressure
/MPa
CO2
uptake
/mmol/g
CO2/CH4
Selectivity Reference
ZIF-L 298 0.1 0.94 7.2 this work
ZIF-8 298 0.1 0.66 2.8 this work
ZIF-100 298 0.1 0.9 4.1 4
ZIF-95 298 0.1 0.8 3.6 4
ZIF-8 298 0.1 0.45 - 5
ZIF-8 298 0.1 0.68 - 6
ZIF-8 298 0.1 0.78 2.8 7
ZIF-8 298 0.1 0.57 - 8
ZIF-8 298 0.1 0.60 2.6 9
ZIF-20 273 0.1 3.13 5 10
ZIF-25, -71, -93, 96,-97 298 0.1 0.6~2.1 - 11
MOF-177 298 0.1 1.36 2.3 12
MOF-5 298 0.1 0.91 7.2 12
MIL-53 (Cr) 304 2 8.6 2.0 13
MIL-53 (Al) 303 2 6.3 3.0 14
MIL-53 (Al) 304 2 9.8 2.04 15
MIL-53 (Cr) 304 2 9.5 1.9 15
MIL-101c (Cr) 303 5 40 3.1 16
Cu-BTC 303 4 14 1.53 17
MOF-508b 303 0.45 5.9 3.1 18
Cu-HBTB 298 2 5.6 1.75 19
NOTT-300 273 0.1 7.0 100 20
UIO-66 306 2 6.4 2.4 21
Electronic Supplementary Material (ESI) for Chemical CommunicationsThis journal is © The Royal Society of Chemistry 2013

12
(a) (b)
(c)
Fig. S3. (a) Nitrogen adsorption-desorption isotherm and (b) its semi-log plot for ZIF-L, and (c)
semi-plot for N2 adsorption isotherm of ZIF-8. The nitrogen sorption experiments were carried out
at 77K. Fig.3c shows that there is a sharp increase in the amount of nitrogen adsorbed at low
relative pressures (red-circled), indicating the gate-opening adsorption process. In contrast, the
gate-opening adsorption also occurs in ZIF-L, but it is much less significant than that in ZIF-8.
Electronic Supplementary Material (ESI) for Chemical CommunicationsThis journal is © The Royal Society of Chemistry 2013
13
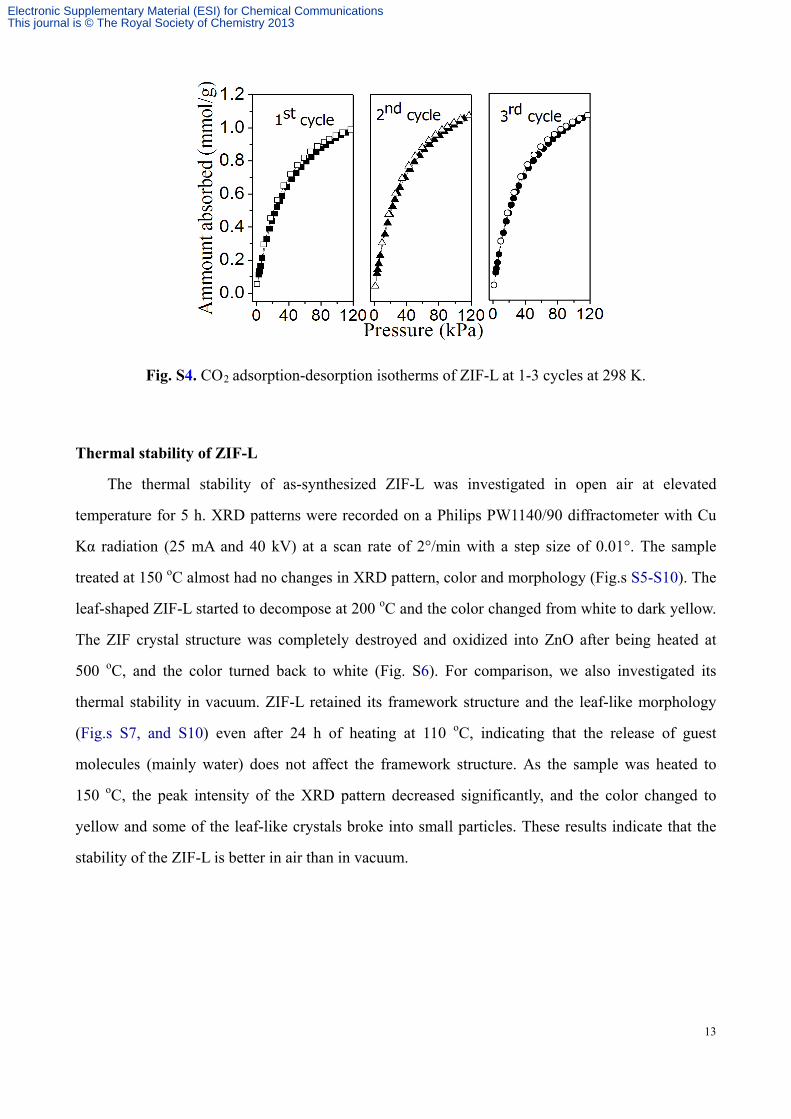
Fig. S4. CO2 adsorption-desorption isotherms of ZIF-L at 1-3 cycles at 298 K.
Thermal stability of ZIF-L
The thermal stability of as-synthesized ZIF-L was investigated in open air at elevated
temperature for 5 h. XRD patterns were recorded on a Philips PW1140/90 diffractometer with Cu
Kα radiation (25 mA and 40 kV) at a scan rate of 2°/min with a step size of 0.01°. The sample
treated at 150 oC almost had no changes in XRD pattern, color and morphology (Fig.s S5-S10). The
leaf-shaped ZIF-L started to decompose at 200 oC and the color changed from white to dark yellow.
The ZIF crystal structure was completely destroyed and oxidized into ZnO after being heated at
500 oC, and the color turned back to white (Fig. S6). For comparison, we also investigated its
thermal stability in vacuum. ZIF-L retained its framework structure and the leaf-like morphology
(Fig.s S7, and S10) even after 24 h of heating at 110 oC, indicating that the release of guest
molecules (mainly water) does not affect the framework structure. As the sample was heated to
150 oC, the peak intensity of the XRD pattern decreased significantly, and the color changed to
yellow and some of the leaf-like crystals broke into small particles. These results indicate that the
stability of the ZIF-L is better in air than in vacuum.
Electronic Supplementary Material (ESI) for Chemical CommunicationsThis journal is © The Royal Society of Chemistry 2013
14
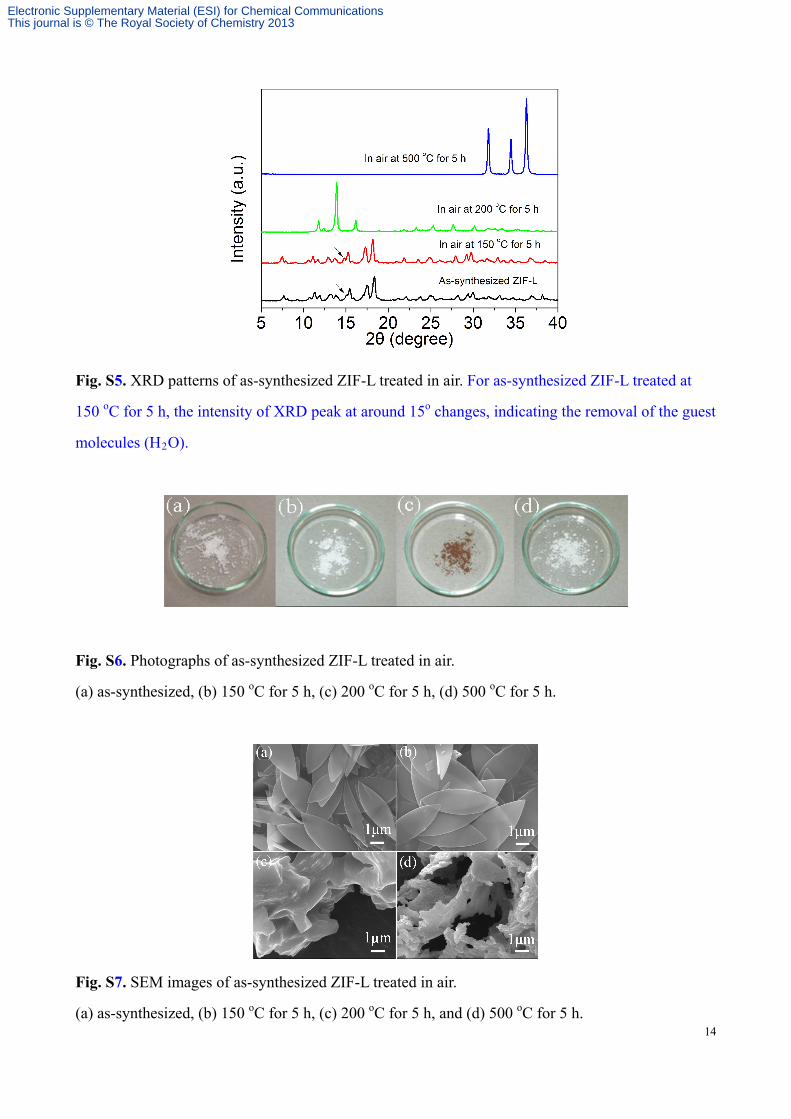
Fig. S5. XRD patterns of as-synthesized ZIF-L treated in air. For as-synthesized ZIF-L treated at
150 oC for 5 h, the intensity of XRD peak at around 15o changes, indicating the removal of the guest
molecules (H2O).
Fig. S6. Photographs of as-synthesized ZIF-L treated in air.
(a) as-synthesized, (b) 150 oC for 5 h, (c) 200 oC for 5 h, (d) 500 oC for 5 h.
Fig. S7. SEM images of as-synthesized ZIF-L treated in air.
(a) as-synthesized, (b) 150 oC for 5 h, (c) 200 oC for 5 h, and (d) 500 oC for 5 h.
Electronic Supplementary Material (ESI) for Chemical CommunicationsThis journal is © The Royal Society of Chemistry 2013

15
Fig. S8. XRD of as synthesized ZIF-L treated under vacuum. For as-synthesized ZIF-L treated in
vacuum above 60 oC, the change of the intensity of XRD peak at around 15o indicates the removal
of the guest molecules (H2O).
Fig. S9. Photographs of as synthesized ZIF-L treated under vacuum.
(a) 60 oC for 24 h, (b) 110 oC for 5 h, (c) 110 oC for 24h, and (d) 150 oC for 5 h
Electronic Supplementary Material (ESI) for Chemical CommunicationsThis journal is © The Royal Society of Chemistry 2013

16
Fig. S10. FESEM of as synthesized ZIF-L treated under vacuum.
(a) 60 oC for 24 h, (b) 110 oC for 5 h, (c) 110 oC for 24h, and (d) 150 oC for 5 h.
Fig. S11. X-ray powder diffraction patterns of ZIF-L at different pressures. The data was collected
at a wavelength of 0.6881 Å at the powder diffraction beamline, Australian Synchrotron.
References 1. A. Coelho, 2007, http://www.topas-academic.net/. 2. L. Palatinus and G. Chapuis, J. Appl. Crystallogr., 2007, 40, 786-790. 3. B. Hachula, M. Nowak and J. Kusz, J. Chem. Crystallogr., 2010, 40, 201-206. 4. B. Wang, A. P. Cote, H. Furukawa, M. O'Keeffe and O. M. Yaghi, Nature, 2008, 453,
207-U206.
Electronic Supplementary Material (ESI) for Chemical CommunicationsThis journal is © The Royal Society of Chemistry 2013
17
5. S. K. Nune, P. K. Thallapally, A. Dohnalkova, C. M. Wang, J. Liu and G. J. Exarhos, Chem. Commun., 2010, 46, 4878-4880.
6. C. Chen, J. Kim, D. A. Yang and W. S. Ahn, Chem. Eng. J., 2011, 168, 1134-1139. 7. H. L. Huang, W. J. Zhang, D. H. Liu, B. Liu, G. J. Chen and C. L. Zhong, Chem. Eng. Sci.,
2011, 66, 6297-6305. 8. Z. J. Zhang, S. K. Xian, H. X. Xi, H. H. Wang and Z. Li, Chem. Eng. Sci., 2011, 66,
4878-4888. 9. G. S. Xu, J. F. Yao, K. Wang, L. He, P. A. Webley, C. S. Chen and H. T. Wang, J. Membr. Sci.,
2011, 385, 187-193. 10. H. Hayashi, A. P. Cote, H. Furukawa, M. O'Keeffe and O. M. Yaghi, Nat. Mater., 2007, 6,
501-506. 11. W. Morris, B. Leung, H. Furukawa, O. K. Yaghi, N. He, H. Hayashi, Y. Houndonougbo, M.
Asta, B. B. Laird and O. M. Yaghi, J. Am. Chem. Soc., 2010, 132, 11006-11008. 12. D. Saha, Z. B. Bao, F. Jia and S. G. Deng, Environ. Sci. Technol., 2010, 44, 1820-1826. 13. P. L. Llewellyn, S. Bourrelly, C. Serre, Y. Filinchuk and G. Ferey, Angew. Chem.-Int. Edit.,
2006, 45, 7751-7754. 14. S. Couck, J. F. M. Denayer, G. V. Baron, T. Remy, J. Gascon and F. Kapteijn, J. Am. Chem.
Soc., 2009, 131, 6326-6327. 15. S. Bourrelly, P. L. Llewellyn, C. Serre, F. Millange, T. Loiseau and G. Ferey, J. Am. Chem.
Soc., 2005, 127, 13519-13521. 16. P. L. Llewellyn, S. Bourrelly, C. Serre, A. Vimont, M. Daturi, L. Hamon, G. De Weireld, J. S.
Chang, D. Y. Hong, Y. K. Hwang, S. H. Jhung and G. Ferey, Langmuir, 2008, 24, 7245-7250. 17. L. Hamon, E. Jolimaitre and G. D. Pirngruber, Ind. Eng. Chem. Res., 2010, 49, 7497-7503. 18. P. S. Barcia, L. Bastin, E. J. Hurtado, J. A. C. Silva, A. E. Rodrigues and B. L. Chen, Sep. Sci.
Technol., 2008, 43, 3494-3521. 19. B. Mu, F. Li and K. S. Walton, Chem. Commun., 2009, 2493-2495. 20. S. H. Yang, J. L. Sun, A. J. Ramirez-Cuesta, S. K. Callear, W. I. F. David, D. P. Anderson, R.
Newby, A. J. Blake, J. E. Parker, C. C. Tang and M. Schroder, Nat. Chem., 2012, 4, 887-894. 21. S. Biswas, J. Zhang, Z. B. Li, Y. Y. Liu, M. Grzywa, L. X. Sun, D. Volkmer and P. Van der
Voort, Dalton Trans., 2013, 42, 4730-4737.
Electronic Supplementary Material (ESI) for Chemical CommunicationsThis journal is © The Royal Society of Chemistry 2013