a uk industry performance report - glenigan · uk industry performance report 2016 6 glenigan...
TRANSCRIPT
Based on the UK Construction Industry Key Performance Indicators
UK Industry Performance Report
2016
UK Industry Performance Report 2016 2
UK Industry Performance Report 2016Contents
Ministerial Foreword............................................................Introduction ...........................................................................Executive Summary .............................................................
Key Performance Indicators 2016Economic Indicators ............................................................Client Satisfaction ................................................................Contractor Satisfaction .......................................................Profitability .............................................................................Predictability ..........................................................................Respect for People ...............................................................Environmental Indicators ..................................................Housing ...................................................................................Non-Housing .........................................................................Consultants ............................................................................
Economic KPIs - All ConstructionYear-on-Year ComparisonsKPI Summary Table ..............................................................KPI Group Trend Graph .......................................................
Economic KPIs - All ConstructionIndividual KPI Trend GraphsClient Satisfaction - Product, Service & Value For Money ................................................
Contractor Satisfaction - Overall - Performance,Provision of Information & Payment ...............................
Predictability Cost - Project, Design & Construction ........................................................
Predictability Time - Project, Design & Construction ........................................................
Profitability .............................................................................
Glenigan - Robert Davis, Allan WilénCITB - Lee Bryer Constructing Excellence - Don WardDepartment for Business, Innovation and Skills - Frances Pottier, Liam CavinBRE SMARTWaste - Stuart Blofeld, Maggie Blackwell
0304
06
07070808091011121213
1415
16
17
18
19
20
Productivity - (VAPE Current Values) ...............................Productivity - (VAPE Constant 2011 Values) .................Defects - Impact at Handover ...........................................
Respect for People KPIs - All ConstructionYear-on-Year ComparisonsKPI Summary Table ..............................................................KPI Group Trend Graph .......................................................
Environment KPIs - All ConstructionYear-on-Year ComparisonsKPI Summary Table ..............................................................KPI Group Trend Graph .......................................................
Economic KPIs - All HousingYear-on-Year ComparisonsKPI Summary Table ..............................................................KPI Group Trend Graph .......................................................
Economic KPIs - All Non-HousingYear-on-Year ComparisonsKPI Summary Table ..............................................................KPI Group Trend Graph .......................................................
Construction Consultants KPIsYear-on-Year ComparisonsKPI Summary Table ..............................................................KPI Group Trend Graph .......................................................
AboutGlenigan ..................................................................................CITB ...........................................................................................Constructing Excellence ....................................................BRE SMARTWaste .................................................................
2020
21
2223
2425
2627
2829
3030
31323334
The KPI Team
Key performance indicators (KPI’s) continue to be utilised to great effect by the construction industry to improve the service provided to clients, and this latest set builds on the solid foundations of previous years. BEIS follows on from BIS as a supporter of the collaboration between Glenigan and CITB as they continue to publish the construction KPIs. And as Chief Statistician I am particularly pleased to see the value that data can bring to the industry and wider economy.
The year’s figures are encouraging; the recent hard work of the industry to improve their performance reflects an industry that is client focused in both the housing and non-housing economic KPI’s. There are increases from last year in all client satisfaction measures; most strikingly there is a 4% increase to 85% in client’s product satisfaction.
The latest KPIs show the industry is evolving with the economy, with a marked improvement in client and contractor satisfaction KPIs in all construction apart from contractor satisfaction of payment. I hope that contractors, sub-contractors and consultants who assess and improve their performance using the industry KPIs will take advantage and seize the new
opportunities.
Francis PottierActing Chief Statistician, Department for Business, Innovation and Skills
UK Industry Performance Report 2016 3
Francis PottierForeword
UK Industry Performance Report 2016 4
CITBIntroduction
Heading into 2015, the year from which the latest set of KPIs are derived, optimism for the 12 months ahead was reasonably high despite a slowing of construction output growth.
At the time, results from CITB’s Employer Panel (a survey of some 1,500 firms) revealed that just under half of firms (46%) expected their annual turnover to increase. Slightly fewer (44%) felt their turnover would stay at about the same level, while just 8% expected a decrease. The outlook for construction had improved over the previous 12 months, reflecting a general recovery in the UK economy as a whole.
However, 2015 was actually a mixed year for construction in terms of output and employment. Divergent indicators showed that recovery was far from complete in every sector. Infrastructure and private housing were performing well, but commercial and public non-housing less so. Skills shortages began to re-emerge, creating concern in the short term. These KPIs reflect an industry that whilst buoyed by slow-but-steady growth, is beset by a host of challenges. These include a need for increased clarity in the project pipeline, required to foster a healthy supply chain, and underpinned by the need to boost skill levels and aspiration.
While the current KPIs paint a broadly positive picture for 2015, as client and contractor satisfaction levels rose, along with predictability of construction, this has clearly come at a cost. Profitability is down and staff loss has increased, pointing to a squeeze on margins and potential off-loading of risk; neither of which is conducive to investment in skills and training. The situation is not helped by deteriorating levels of productivity, which have fallen in real terms. Weaker industry growth and volatility in the cost of materials and labour point to challenging trading conditions and turning a profit is proving even more challenging.
This raises the question of whether contractors are being squeezed too hard on all fronts. Main contractors are making limited margins, as by September 2015 profit margins for the top 25 contractors in the UK had fallen by half from the year before to under 1.5%, as reported by Construction News. Yet clients will become no less demanding going forward. There is a pressure to drive efficiency and value, particularly in these straitened times, but equally clients should recognise there is a limit to how far costs can be reduced without impacting on quality. Contractors and clients need to work together to deliver to time and budget, but procurement models also need to change.
Falling levels of profitability are a particular concern for training as well. With margins under pressure, ‘non-essential training’ may be cut to reduce costs. However, this could be counter-productive, creating greater costs in the long-term due to inefficiency and skills gaps. Ultimately, the cost of skills will be felt somewhere whether it is higher tender prices or a poorer quality product.
However it is encouraging to see that levels of training were up in 2015, from 1.2 days training days per employee in the last survey to 1.5 in 2015. The proportion of employees qualified to NVQ Level 2 or above has also increased to 72% of employees, although this is in the context of increased levels of staff loss. In actual fact with tight margins and a price competitive market, improving productivity might just present the industry with its best opportunity to turn that profit. One of the most effective ways to do that is by increasing engagement, encouraging stability of employment and investing in people.
To prevent productivity levels falling further, firms need to improve the skills available to them by investing in training and widening their talent pool, particularly if the industry is to make the most of new technology and more innovative ways of working.
UK Industry Performance Report 2016 5
CITB (cont.)Introduction
The proportion of people from black or minority ethnic backgrounds has increased slightly, but still remains well below a level that represents the wider population. It is disappointing that the proportion of women in the workforce and people aged under 24 have both fallen back. With an ageing workforce, the industry needs to attract new recruits and position itself as an attractive ‘career for all’, but particularly amongst young people and non-traditional entrants. The results continue to highlight the need to do more to attract people from all backgrounds.
Continued growth in construction is key to wider success in the UK economy and can only be achieved if the necessary skills are available to deliver it. In this sense, the current results should not only be seen as providing construction clients, contractors and consultants with a rigorous benchmark, but also presenting targets for continuous improvement for industry as a whole.
Whilst the KPI results for 2015 are largely positive, the slowdown in output growth throughout 2015 and into 2016 suggest that tough operating conditions will continue over the medium-term. This will play a major role in investment decisions, including investment in skills. This is why CITB, through its continued reform of employer funding, is helping employers invest in the skills that are most important to their businesses now and for the future.
Following the EU referendum, uncertainty over future prospects has increased and will only intensify as Brexit nears. We will work with industry to encourage training, and to build a safe, professional, and fully qualified workforce that is able to not only deal with the changes that life outside the EU brings, but to make a success of it. This includes working with employers to benchmark their own performance in an increasingly competitive external environment and to help identify where they can secure future improvements. It is for this reason that CITB continues to support the Construction KPIs.
Lee BryerResearch Manager, CITB
UK Industry Performance Report 2016 6
GleniganExecutive Summary
The construction industry is currently facing uncertain market prospects amid the political and economic turbulence following the EU referendum vote. The latest set of KPIs provide a valuable assessment of the industry’s recent performance, its strengths and weaknesses, and its ability to accommodate evolving market conditions over the next few years.
Overall, the KPIs point to an industry working hard to maintaining recent levels of performance and client satisfaction.
The latest set of KPIs is based upon projects completed during 2015, a period of slowing construction output growth as the flow of new projects starting on site was disrupted by political uncertainties surrounding of last year’s general election. However many of the projects reaching completion started on site in earlier years, often based on contracts which were negotiated during the downturn.
Overall client satisfaction is high with 85% of clients rating the finished product as 8 out of 10 or better, reversing the downward trend seen in the previous three surveys. Contractors’ overall satisfaction with clients and the consultancy team has also improved, despite a slight drop in satisfaction with payment arrangements.
Evidence from this year’s KPIs suggests that construction firms have managed to keep control of costs. Project costs were on budget or better for 68% of schemes, close to the survey high recorded in the previous two surveys. In contrast projects only came in on time or better 41% of the time; a slight improvement on the previous year but markedly below the long term average of 45%.
The impact of the slowing in industry growth is evident in the workforce indicators, with construction firms reducing their workforce as departing staff went un-replaced. Staff losses rose from 6.3% to 7%, while staff turnover fell back to 2.7%. Company margins also remain tight. Indeed industry profitability slipped back from 2.8% to 2.5%, partially reversing the improvement seen in the previous survey as firms’ margins were squeezed by higher material and labour costs.
Looking ahead the construction industry is potentially facing a period of volatile industry workload and structural change as the UK economy adapts to life outside of the EU.
Up-skilling the workforce, delivering improved productivity and containing costs will be priorities if firms are to respond to these shifting and uncertain market conditions.
As the industry responds to these challenges, the Construction Industry Key Performance Indicators provide firms with the benchmark against which they can appraise their own performance and help identify where they can secure future improvements that will help safeguard their competitive position and win work.
Allan WilénEconomics Director, Glenigan

UK Industry Performance Report 2016 7
2016Key Performance Indicators
Economic IndicatorsOverall, the economic KPIs present an industry working hard to raise its performance and enhance client satisfaction. The latest set of KPIs were compiled from projects completed during 2015; a period of slowing construction output growth.
Client satisfaction has improved, recovering ground lost over the last two surveys.
Contractors are similarly more satisfied with their clients and consultancy teams, despite a small drop in satisfaction with payment provision.
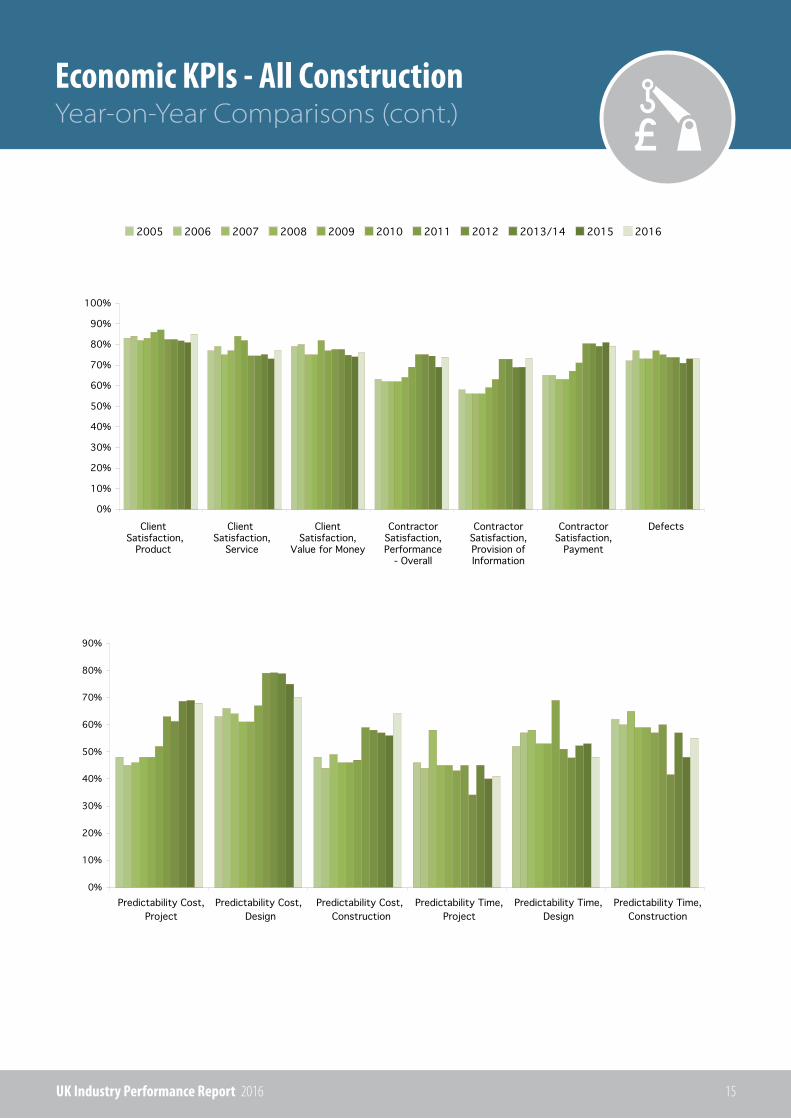
Client Satisfaction Clients rated their ‘overall satisfaction with the finished product’ as 8 out of 10 or higher on 85% of surveyed projects. This is a sharp 4 percentage point (pp) improvement on the 2015 survey and reverses the gradual decline in performance tracked in the last three surveys. The 2016 result is just below the previous record 87% achieved during 2010 and 2011.
Client Satisfaction with the service received from contractors also rose to 77%, from 73% last time around. This is the strongest performance since 2011, when 80% gave a rating of 8 out of 10 or higher.
On 76% of projects, clients scored ‘value for money’ as eight out of ten or higher. This is 2 pp up from 2015, but remains shy of the 82% peak seen in 2009.
The KPI for the clients’ rating of the ‘condition of the facility in respect to defects’ was unchanged, with 73% of clients rating the impact of defects as 8 out of 10 or better. This is in line with both the 2015 survey and the average rate seen in the previous ten surveys.
UK Industry Performance Report 2016 8
2016 (cont.)Key Performance Indicators
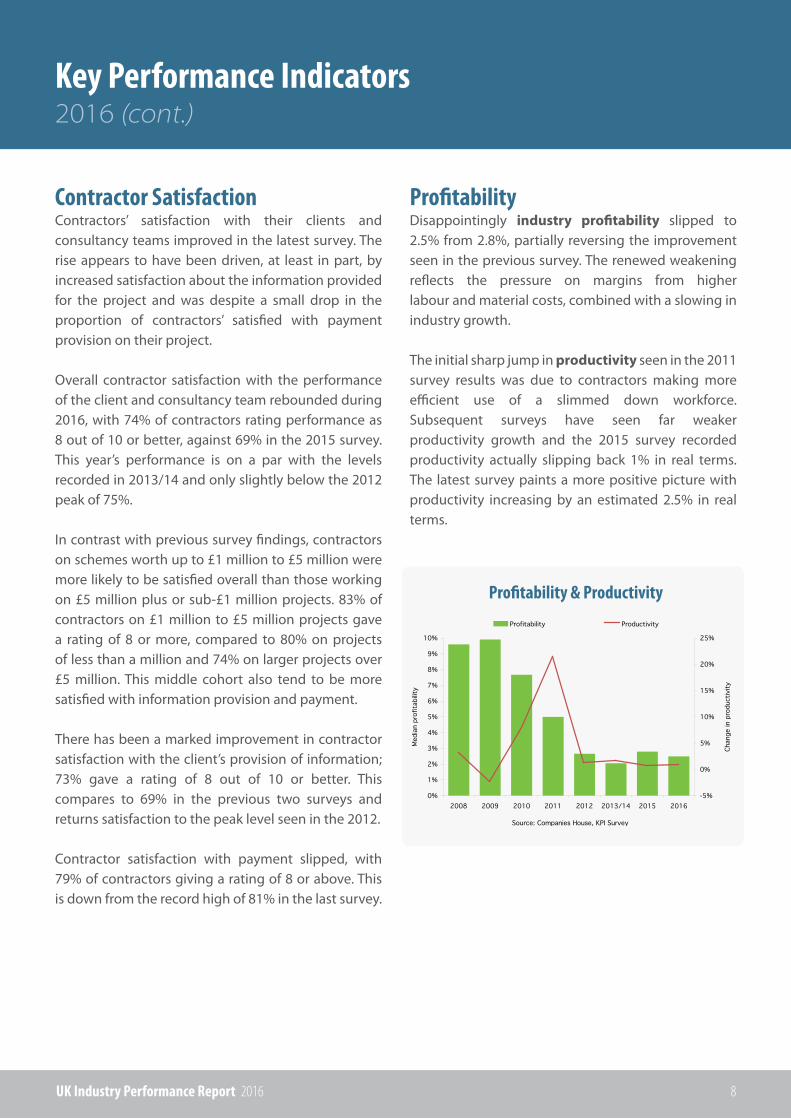
ProfitabilityDisappointingly industry profitability slipped to 2.5% from 2.8%, partially reversing the improvement seen in the previous survey. The renewed weakening reflects the pressure on margins from higher labour and material costs, combined with a slowing in industry growth.
The initial sharp jump in productivity seen in the 2011 survey results was due to contractors making more efficient use of a slimmed down workforce. Subsequent surveys have seen far weaker productivity growth and the 2015 survey recorded productivity actually slipping back 1% in real terms. The latest survey paints a more positive picture with productivity increasing by an estimated 2.5% in real terms.
0%
1%
2%
3%
4%
5%
6%
7%
8%
9%
10%
2008 2009 2010 2011 2012 2013/14 2015 2016-5%
0%
5%
10%
15%
20%
25%
Profitability & Productivity
Contractor Satisfaction Contractors’ satisfaction with their clients and consultancy teams improved in the latest survey. The rise appears to have been driven, at least in part, by increased satisfaction about the information provided for the project and was despite a small drop in the proportion of contractors’ satisfied with payment provision on their project.
Overall contractor satisfaction with the performance of the client and consultancy team rebounded during 2016, with 74% of contractors rating performance as 8 out of 10 or better, against 69% in the 2015 survey. This year’s performance is on a par with the levels recorded in 2013/14 and only slightly below the 2012 peak of 75%.
In contrast with previous survey findings, contractors on schemes worth up to £1 million to £5 million were more likely to be satisfied overall than those working on £5 million plus or sub-£1 million projects. 83% of contractors on £1 million to £5 million projects gave a rating of 8 or more, compared to 80% on projects of less than a million and 74% on larger projects over £5 million. This middle cohort also tend to be more satisfied with information provision and payment.
There has been a marked improvement in contractor satisfaction with the client’s provision of information; 73% gave a rating of 8 out of 10 or better. This compares to 69% in the previous two surveys and returns satisfaction to the peak level seen in the 2012.
Contractor satisfaction with payment slipped, with 79% of contractors giving a rating of 8 or above. This is down from the record high of 81% in the last survey.

UK Industry Performance Report 2016 9
2016 (cont.)Key Performance Indicators
Cost Predictability
Time Predictability
Predictability The latest results show a marked improvement in cost and time predictability, especially for the design process.
Project costs were on budget or better for 68% of projects; extending the positive long term trend seen in previous surveys.
Design costs came in on or under budget on 70% of the surveyed projects. Whilst this is the lowest level since 2010, cost predictability remains ahead of pre-2010 survey results.
Predictability in the cost of construction was also improved, with 64% of projects coming in on budget or better. This is significantly above the previous survey high of 59% in 2011.
The previous set of time predictability KPIs suggested that the industry had lost some ground. The latest results point to some strengthening in time predictability, especially for the construction phase.
Projects, as a whole, came in on time or better 41% of the time. This is a slight improvement on the 2015 survey results but remains below the average survey results since 2003.
The predictability of the design phase slipped back. The design was delivered on time or better for 48% of all projects, this compares with 53% of projects in the 2015 survey.
The construction phase was on time or better for 55% of projects, reversing the drop seen in 2015.
UK Industry Performance Report 2016 10
2016 (cont.)Key Performance Indicators
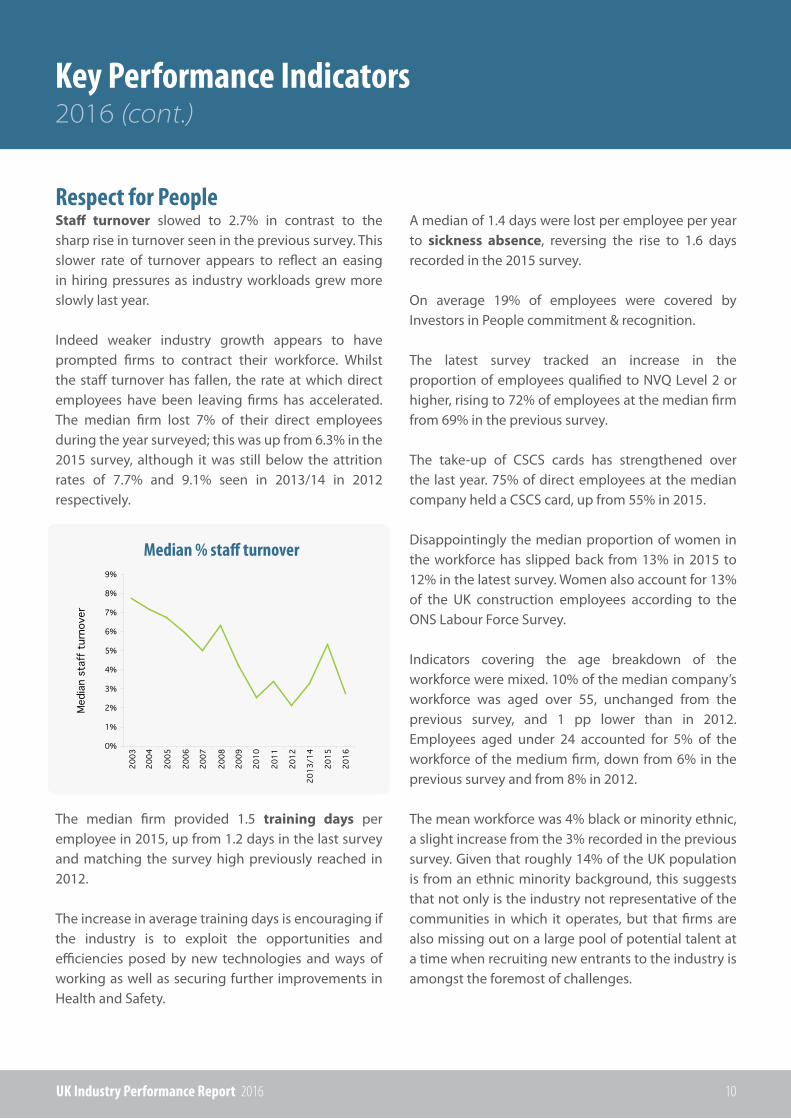
Respect for PeopleStaff turnover slowed to 2.7% in contrast to the sharp rise in turnover seen in the previous survey. This slower rate of turnover appears to reflect an easing in hiring pressures as industry workloads grew more slowly last year.
Indeed weaker industry growth appears to have prompted firms to contract their workforce. Whilst the staff turnover has fallen, the rate at which direct employees have been leaving firms has accelerated. The median firm lost 7% of their direct employees during the year surveyed; this was up from 6.3% in the 2015 survey, although it was still below the attrition rates of 7.7% and 9.1% seen in 2013/14 in 2012 respectively.
The median firm provided 1.5 training days per employee in 2015, up from 1.2 days in the last survey and matching the survey high previously reached in 2012.
The increase in average training days is encouraging if the industry is to exploit the opportunities and efficiencies posed by new technologies and ways of working as well as securing further improvements in Health and Safety.
A median of 1.4 days were lost per employee per year to sickness absence, reversing the rise to 1.6 days recorded in the 2015 survey.
On average 19% of employees were covered by Investors in People commitment & recognition.
The latest survey tracked an increase in the proportion of employees qualified to NVQ Level 2 or higher, rising to 72% of employees at the median firm from 69% in the previous survey.
The take-up of CSCS cards has strengthened over the last year. 75% of direct employees at the median company held a CSCS card, up from 55% in 2015.
Disappointingly the median proportion of women in the workforce has slipped back from 13% in 2015 to 12% in the latest survey. Women also account for 13% of the UK construction employees according to the ONS Labour Force Survey.
Indicators covering the age breakdown of the workforce were mixed. 10% of the median company’s workforce was aged over 55, unchanged from the previous survey, and 1 pp lower than in 2012. Employees aged under 24 accounted for 5% of the workforce of the medium firm, down from 6% in the previous survey and from 8% in 2012.
The mean workforce was 4% black or minority ethnic, a slight increase from the 3% recorded in the previous survey. Given that roughly 14% of the UK population is from an ethnic minority background, this suggests that not only is the industry not representative of the communities in which it operates, but that firms are also missing out on a large pool of potential talent at a time when recruiting new entrants to the industry is amongst the foremost of challenges.
Median % staff turnover
UK Industry Performance Report 2016 11
2016 (cont.)Key Performance Indicators
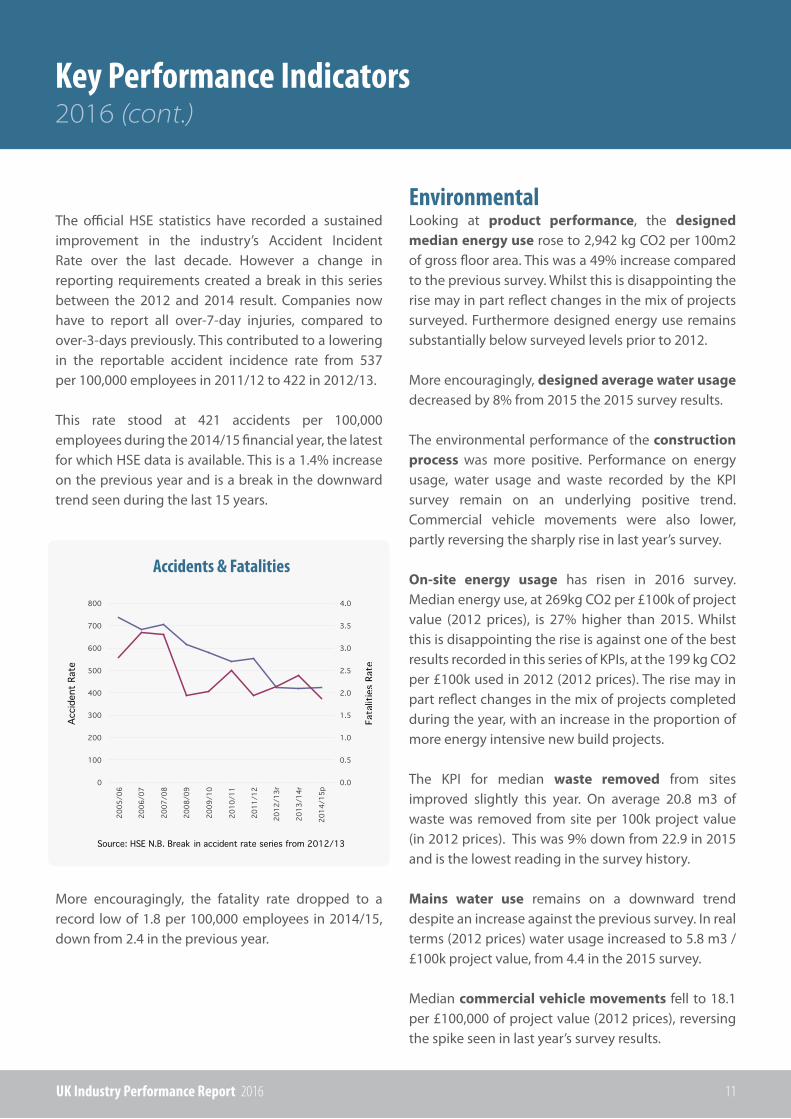
The official HSE statistics have recorded a sustained improvement in the industry’s Accident Incident Rate over the last decade. However a change in reporting requirements created a break in this series between the 2012 and 2014 result. Companies now have to report all over-7-day injuries, compared to over-3-days previously. This contributed to a loweringin the reportable accident incidence rate from 537 per 100,000 employees in 2011/12 to 422 in 2012/13.
This rate stood at 421 accidents per 100,000 employees during the 2014/15 financial year, the latest for which HSE data is available. This is a 1.4% increase on the previous year and is a break in the downward trend seen during the last 15 years.
More encouragingly, the fatality rate dropped to a record low of 1.8 per 100,000 employees in 2014/15, down from 2.4 in the previous year.
EnvironmentalLooking at product performance, the designed median energy use rose to 2,942 kg CO2 per 100m2 of gross floor area. This was a 49% increase compared to the previous survey. Whilst this is disappointing the rise may in part reflect changes in the mix of projects surveyed. Furthermore designed energy use remains substantially below surveyed levels prior to 2012.
More encouragingly, designed average water usage decreased by 8% from 2015 the 2015 survey results.
The environmental performance of the construction process was more positive. Performance on energy usage, water usage and waste recorded by the KPI survey remain on an underlying positive trend. Commercial vehicle movements were also lower, partly reversing the sharply rise in last year’s survey.
On-site energy usage has risen in 2016 survey. Median energy use, at 269kg CO2 per £100k of project value (2012 prices), is 27% higher than 2015. Whilst this is disappointing the rise is against one of the best results recorded in this series of KPIs, at the 199 kg CO2 per £100k used in 2012 (2012 prices). The rise may in part reflect changes in the mix of projects completed during the year, with an increase in the proportion of more energy intensive new build projects.
The KPI for median waste removed from sites improved slightly this year. On average 20.8 m3 of waste was removed from site per 100k project value (in 2012 prices). This was 9% down from 22.9 in 2015 and is the lowest reading in the survey history.
Mains water use remains on a downward trend despite an increase against the previous survey. In real terms (2012 prices) water usage increased to 5.8 m3 / £100k project value, from 4.4 in the 2015 survey.
Median commercial vehicle movements fell to 18.1 per £100,000 of project value (2012 prices), reversing the spike seen in last year’s survey results.
Accidents & Fatalities
UK Industry Performance Report 2016 12
2016 (cont.)Key Performance Indicators
HousingClient’s overall satisfaction with housing projects has improved. The proportion of clients rating satisfaction with the overall product as 8 out of 10 or higher increased to 82% against 74% in the previous survey. This reverses the dip in customer satisfaction seen in the previous two surveys and takes satisfaction levels slightly below the previous peak seen in 2011.
Satisfaction with service received also improved during the latest survey, with 77% giving a rating of 8 out of ten or more.
The housing KPIs tend to reflect trends and performance within the social housing sector, where the client/contractor dynamic is more prevalent than the developer/builder model that accounts for a larger proportion of private housing schemes. The previous deterioration in performance may well reflect the impact of reduced government funding for new social housing, causing strain as clients try to maintain their provision with fewer resources. The current improvement suggests that clients and the industry have adjusted to the new financial regime.
Clients’ satisfaction with the impact of defects at handover also improved, with 77% scoring 8 out of 10. This compares with 71% in the 2015 survey.
The overall cost predictability of housing projects improved with 46% of projects being to budget or better. Predictability of design cost was lower, with 70% of respondents seeing their design costs come in to cost or better. 62% reported that construction costs had been to budget or better.
The time predictability of projects was broadly maintained with half delivered to time of better. The time predictability of the design stage slipped back, with 57% reporting design was completed to time or earlier compared to 63% in the previous survey.
The time predictability of the construction phase of projects remained high, with 71% completed to time or earlier.
Non-HousingThere has been a broad strengthening in non-residential clients’ satisfaction.
The KPI for client satisfaction of non-housing projects rose with 86% giving a rating of at least 8 out of 10. Satisfaction with respect to defects was little changed, with the proportion of clients rating their impact as 8 out of 10 of better slipping 2 percentage point to 72%. Satisfaction with service improved after the fall seen in the previous survey, with the proportion rating service as 8 out of then or better rising from 74% to 77%.
There overall cost predictability of projects declined slightly, with 68% of non-residential projects were completed to budget; against 71% in 2015.
Design cost predictability dropped slightly with 73% completed to budget or better compared to 75% in the previous survey. The predictability of construction costs was greatly improved, with 67% of projects being to cost or better.
Time predictability was improved for projects included in the latest survey. 40% of projects completed on time overall, up from 38% in the previous survey. In contrast the design phase was on schedule 42% of projects, against 52% of projects in the previous survey. Similarly the construction phase came in time on 43% of schemes.
UK Industry Performance Report 2016 13
2016 (cont.)Key Performance Indicators
ConsultantsClients’ overall satisfaction with their consultants has improved since the last KPI survey. The proportion of clients rating their consultants overall performance at eight or better of out of ten rose from 72% in 2015 to 77%. This was a new high for this performance measure.
Progress on specific areas of performance are also positive. Clients’ perception of value for money improved with 79% rating this aspect as 8 or higher out of 10 against 74% in the previous survey. Satisfaction with service and timely delivery both increased sharply to 81% and 77% respectively.

Year-on-Year ComparisonsEconomic KPIs - All Construction
UK Industry Performance Report 2016 14
1 Data not available before the first year shown.
2 The measure for this KPI was changed in 2000; thus 1999 data was not reported. In order to regularise the volatile mix of financial data by company size from year to year, in 2006 a standard method of weighting by number of
3 Current values are deflated by the “All Construction Output Price Index” for the first years KPI to arrive at constant values .
Client Satisfaction - Product
Client Satisfaction - Service
Client Satisfaction - Value for Money
Contractor Satisfaction - Performance - Overall
Contractor Satisfaction - Provision of Information - Overall
Contractor Satisfaction - Payment - Overall
Defects - Impact at Handover
Predictability Cost - Project
Predictability Cost - Design
Predictability Cost - Construction
Predictability Time - Project
Predictability Time - Design
Predictability Time - Construction
Profitability
Productivity (VAPE Current Values)
Productivity (VAPE Constant 2012 Values)
KPI
% scoring 8/10 or better
% scoring 8/10 or better
% scoring 8/10 or better
% scoring 8/10 or better
% scoring 8/10 or better
% scoring 8/10 or better
% scoring 8/10 or better
% on cost or better
% on cost or better
% on cost or better
% on time or better
% on time or better
% on time or better
Median % profit before interest & tax
Median value added/FTE employee (£000)
Median value added/FTE employee (£000)
Measure Performance Trend
72%
58%
-
-
-
-
-
-
65%
37%
-
27%
34%
-
-
-
1999
73%
63%
-
-
-
-
65%
50%
64%
45%
28%
37%
62%
4.4%
27
43.9
81%
73%
74%
69%
69%
81%
73%
69%
75%
56%
40%
53%
48%
2.8%
66
62.1
85%
77%
76%
74%
73%
79%
73%
68%
70%
64%
41%
48%
55%
2.5%
69
63.7
2000 2015 2016
72%
63%
67%
-
-
-
53%
46%
63%
48%
36%
41%
59%
5.1%
28
43.2
2001
73%
65%
69%
-
-
-
58%
48%
63%
50%
42%
46%
61%
5.2%
28
41.1
2002
78%
71%
73%
64%
57%
67%
68%
52%
65%
52%
44%
53%
59%
5.4%
31.1
43.1
2003
80%
74%
74%
65%
59%
66%
68%
50%
62%
49%
44%
55%
60%
7.0%
32.6
42.4
2004
83%
77%
79%
63%
58%
65%
72%
48%
63%
48%
46%
52%
62%
8.1%
34.2
42.7
2005
84%
79%
80%
62%
56%
65%
77%
45%
66%
44%
44%
57%
60%
7.9%
38.2
44.5
2006
82%
75%
75%
62%
56%
63%
73%
46%
64%
49%
58%
58%
65%
8.2%
42
46.5
2007
83%
77%
75%
62%
56%
63%
73%
49%
65%
48%
45%
58%
58%
9.6%
45.5
47.9
2008
86%
84%
82%
64%
59%
67%
77%
48%
61%
46%
45%
53%
59%
9.9%
46.2
46.8
2009
87%
82%
77%
69%
63%
71%
75%
52%
67%
47%
43%
69%
57%
7.7%
49.5
50.4
2010
87%
80%
81%
69%
64%
77%
68%
63%
79%
59%
45%
51%
60%
5.0%
58.5
61.2
2011
83%
75%
78%
75%
73%
80%
74%
61%
79%
58%
34%
48%
42%
2.7%
60
61.9
2012
82%
75%
75%
74%
69%
79%
71%
69%
79%
57%
45%
52%
57%
2.1%
63.8
62.8
2013/14 All YearsLast Year
Year-on-Year Comparisons (cont.)Economic KPIs - All Construction
UK Industry Performance Report 2016 15
0%
10%
20%
30%
40%
50%
60%
70%
80%
90%
100%
2005 2006 2007 2008 2009 2010 2011 2012 2013/14 2015 2016
0%
10%
20%
30%
40%
50%
60%
70%
80%
90%
Client Satisfaction,
Product
Client Satisfaction,
Service
ClientSatisfaction,
Value for Money
ContractorSatisfaction,Performance
- Overall
ContractorSatisfaction,Provision ofInformation
ContractorSatisfaction,
Payment
Defects
Predictability Cost,Project
Predictability Cost, Design
Predictability Cost, Construction
Predictability Time,Project
Predictability Time,Design
Predictability Time,Construction
Individual KPI TrendsEconomic KPIs - All Construction
UK Industry Performance Report 2016 16
BE
TT
ER
BE
TT
ER
BE
TT
ER
83%84%
82%83%
86%87% 87%
83%82%
81%
85%
76%
78%
80%
82%
84%
86%
88%
2005 2006 2007 2008 2009 2010 2011 2012 2013/14 2015 2016
77%79%
75%77%
84%82%
80%
75% 75%73%
77%
66%68%70%72%74%76%78%80%82%84%86%
2005 2006 2007 2008 2009 2010 2011 2012 2013/14 2015 2016
79% 80%
75% 75%
82%
77%
81%
78%
75% 74%76%
70%
75%
80%
85%
2005 2006 2007 2008 2009 2010 2011 2012 2013/14 2015 2016
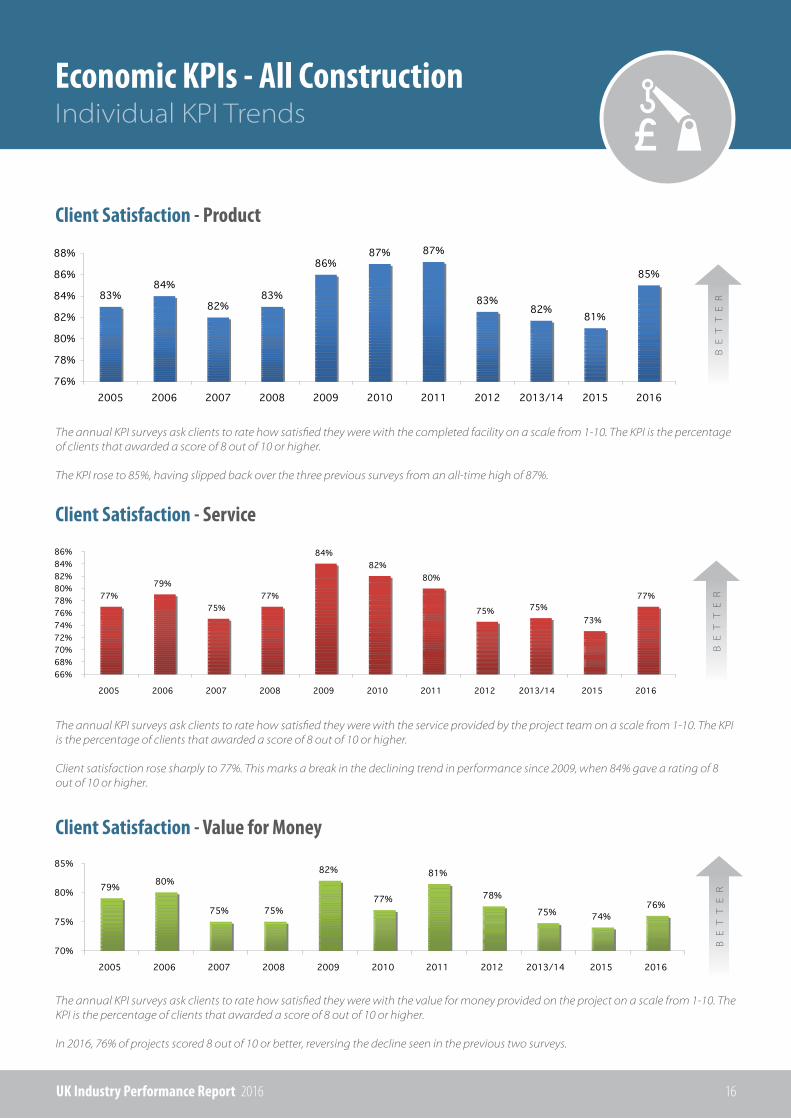
Client Satisfaction - Product
The annual KPI surveys ask clients to rate how satisfied they were with the completed facility on a scale from 1-10. The KPI is the percentage of clients that awarded a score of 8 out of 10 or higher.
The KPI rose to 85%, having slipped back over the three previous surveys from an all-time high of 87%.
BE
TT
ER
BE
TT
ER
BE
TT
ER
83%84%
82%83%
86%87% 87%
83%82%
81%
85%
76%
78%
80%
82%
84%
86%
88%
2005 2006 2007 2008 2009 2010 2011 2012 2013/14 2015 2016
77%79%
75%77%
84%82%
80%
75% 75%73%
77%
66%68%70%72%74%76%78%80%82%84%86%
2005 2006 2007 2008 2009 2010 2011 2012 2013/14 2015 2016
79% 80%
75% 75%
82%
77%
81%
78%
75% 74%76%
70%
75%
80%
85%
2005 2006 2007 2008 2009 2010 2011 2012 2013/14 2015 2016
BE
TT
ER
BE
TT
ER
BE
TT
ER
83%84%
82%83%
86%87% 87%
83%82%
81%
85%
76%
78%
80%
82%
84%
86%
88%
2005 2006 2007 2008 2009 2010 2011 2012 2013/14 2015 2016
77%79%
75%77%
84%82%
80%
75% 75%73%
77%
66%68%70%72%74%76%78%80%82%84%86%
2005 2006 2007 2008 2009 2010 2011 2012 2013/14 2015 2016
79% 80%
75% 75%
82%
77%
81%
78%
75% 74%76%
70%
75%
80%
85%
2005 2006 2007 2008 2009 2010 2011 2012 2013/14 2015 2016
Client Satisfaction - Service
Client Satisfaction - Value for Money
The annual KPI surveys ask clients to rate how satisfied they were with the service provided by the project team on a scale from 1-10. The KPI is the percentage of clients that awarded a score of 8 out of 10 or higher.
Client satisfaction rose sharply to 77%. This marks a break in the declining trend in performance since 2009, when 84% gave a rating of 8 out of 10 or higher.
The annual KPI surveys ask clients to rate how satisfied they were with the value for money provided on the project on a scale from 1-10. The KPI is the percentage of clients that awarded a score of 8 out of 10 or higher.
In 2016, 76% of projects scored 8 out of 10 or better, reversing the decline seen in the previous two surveys.
Individual KPI Trends (cont.)Economic KPIs - All Construction
UK Industry Performance Report 2016 17
BE
TT
ER
BE
TT
ER
BE
TT
ER
63% 62% 62% 62% 64% 69% 69% 75% 74% 69% 74%
0%
20%
40%
60%
80%
2005 2006 2007 2008 2009 2010 2011 2012 2013/14 2015 2016
58% 56% 56% 56% 59% 63% 64%73% 69% 69% 73%
0%
20%
40%
60%
80%
2005 2006 2007 2008 2009 2010 2011 2012 2013/14 2015 2016
65% 65% 63% 63% 67% 71% 77% 80% 79% 81% 79%
0%
20%
40%
60%
80%
100%
2005 2006 2007 2008 2009 2010 2011 2012 2013/14 2015 2016
BE
TT
ER
BE
TT
ER
BE
TT
ER
63% 62% 62% 62% 64% 69% 69% 75% 74% 69% 74%
0%
20%
40%
60%
80%
2005 2006 2007 2008 2009 2010 2011 2012 2013/14 2015 2016
58% 56% 56% 56% 59% 63% 64%73% 69% 69% 73%
0%
20%
40%
60%
80%
2005 2006 2007 2008 2009 2010 2011 2012 2013/14 2015 2016
65% 65% 63% 63% 67% 71% 77% 80% 79% 81% 79%
0%
20%
40%
60%
80%
100%
2005 2006 2007 2008 2009 2010 2011 2012 2013/14 2015 2016
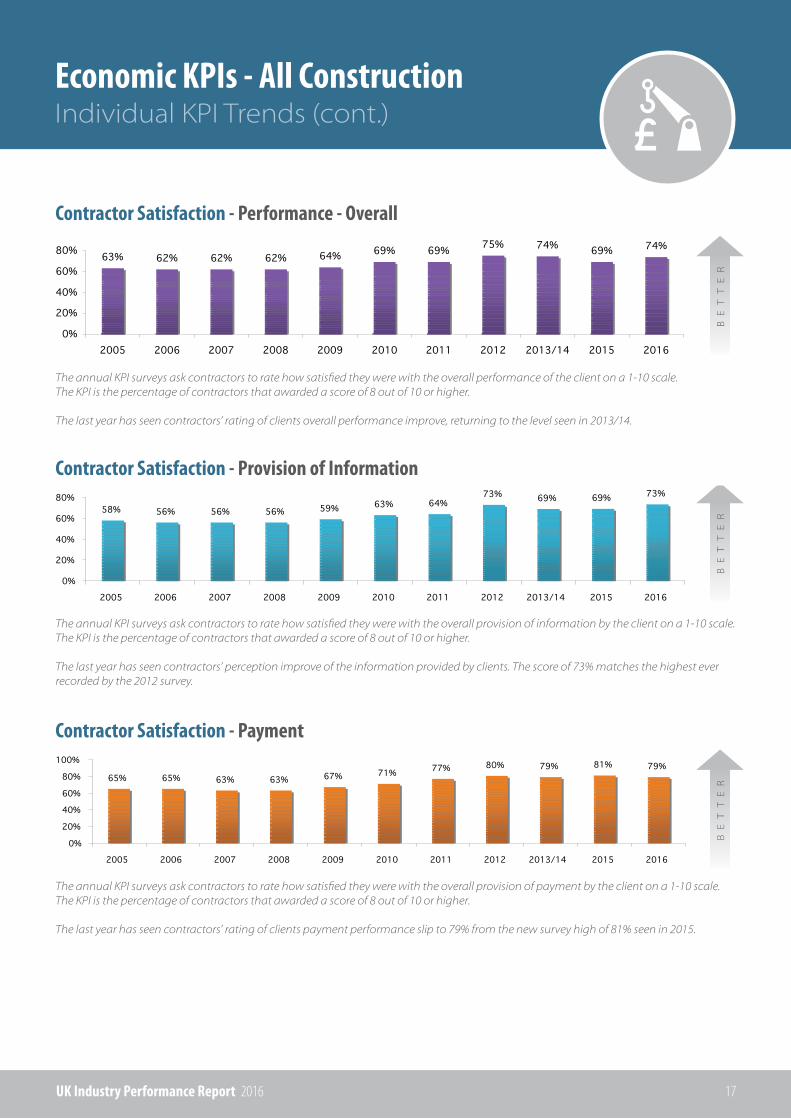
Contractor Satisfaction - Performance - Overall
Contractor Satisfaction - Provision of Information
Contractor Satisfaction - Payment
The annual KPI surveys ask contractors to rate how satisfied they were with the overall performance of the client on a 1-10 scale. The KPI is the percentage of contractors that awarded a score of 8 out of 10 or higher.
The last year has seen contractors’ rating of clients overall performance improve, returning to the level seen in 2013/14.
The annual KPI surveys ask contractors to rate how satisfied they were with the overall provision of information by the client on a 1-10 scale. The KPI is the percentage of contractors that awarded a score of 8 out of 10 or higher.
The last year has seen contractors’ perception improve of the information provided by clients. The score of 73% matches the highest ever recorded by the 2012 survey.
The annual KPI surveys ask contractors to rate how satisfied they were with the overall provision of payment by the client on a 1-10 scale. The KPI is the percentage of contractors that awarded a score of 8 out of 10 or higher.
The last year has seen contractors’ rating of clients payment performance slip to 79% from the new survey high of 81% seen in 2015.
Individual KPI Trends (cont.)Economic KPIs - All Construction
UK Industry Performance Report 2016 18
BE
TT
ER
BE
TT
ER
BE
TT
ER
63% 66% 64% 65% 61%67%
79% 79% 79% 75%70%
0%10%20%30%40%50%60%70%80%90%
2005 2006 2007 2008 2009 2010 2011 2012 2013/14 2015 2016
48% 45% 46% 49% 48%52%
63% 61%69% 69% 68%
0%
10%
20%
30%
40%
50%
60%
70%
80%
2005 2006 2007 2008 2009 2010 2011 2012 2013/14 2015 2016
48%44%
49% 48% 46% 47%
59% 58% 57% 56%64%
0%
10%
20%
30%
40%
50%
60%
70%
2005 2006 2007 2008 2009 2010 2011 2012 2013/14 2015 2016
BE
TT
ER
BE
TT
ER
BE
TT
ER
63% 66% 64% 65% 61%67%
79% 79% 79% 75%70%
0%10%20%30%40%50%60%70%80%90%
2005 2006 2007 2008 2009 2010 2011 2012 2013/14 2015 2016
48% 45% 46% 49% 48%52%
63% 61%69% 69% 68%
0%
10%
20%
30%
40%
50%
60%
70%
80%
2005 2006 2007 2008 2009 2010 2011 2012 2013/14 2015 2016
48%44%
49% 48% 46% 47%
59% 58% 57% 56%64%
0%
10%
20%
30%
40%
50%
60%
70%
2005 2006 2007 2008 2009 2010 2011 2012 2013/14 2015 2016
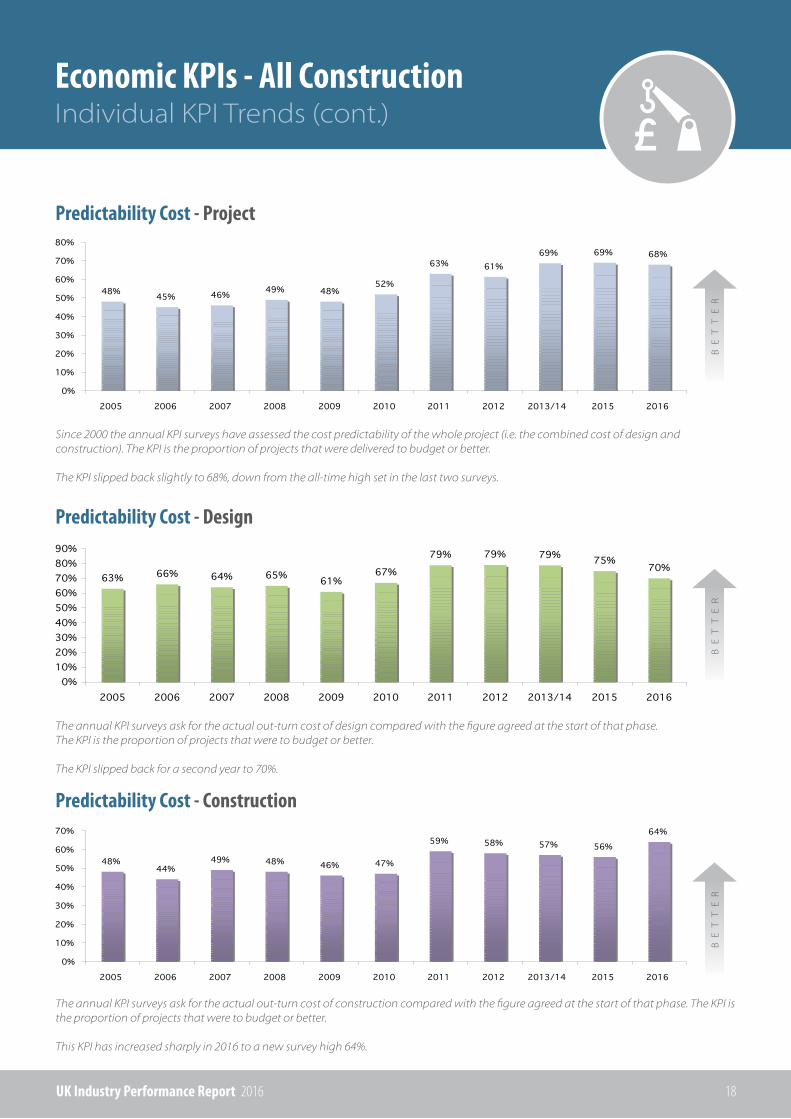
Predictability Cost - Project
Predictability Cost - Design
Predictability Cost - Construction
Since 2000 the annual KPI surveys have assessed the cost predictability of the whole project (i.e. the combined cost of design and construction). The KPI is the proportion of projects that were delivered to budget or better.
The KPI slipped back slightly to 68%, down from the all-time high set in the last two surveys.
The annual KPI surveys ask for the actual out-turn cost of design compared with the figure agreed at the start of that phase. The KPI is the proportion of projects that were to budget or better.
The KPI slipped back for a second year to 70%.
The annual KPI surveys ask for the actual out-turn cost of construction compared with the figure agreed at the start of that phase. The KPI is the proportion of projects that were to budget or better.
This KPI has increased sharply in 2016 to a new survey high 64%.

Individual KPI Trends (cont.)Economic KPIs - All Construction
UK Industry Performance Report 2016 19
WO
RS
E
BE
TT
ER
BE
TT
ER
46% 44%
58%
45% 45% 43% 45%
34%
45%40% 41%
0%
10%
20%
30%
40%
50%
60%
70%
2005 2006 2007 2008 2009 2010 2011 2012 2013/14 2015 2016
52%57% 58% 58%
53%
69%
51% 48%52% 53%
48%
0%10%20%30%40%50%60%70%80%
2005 2006 2007 2008 2009 2010 2011 2012 2013/14 2015 2016
62% 60%65%
58% 59% 57% 60%
42%
57%48%
55%
0%
10%
20%
30%
40%
50%
60%
70%
2005 2006 2007 2008 2009 2010 2011 2012 2013/14 2015 2016
Predictability Time - Project
Predictability Time - Design
Predictability Time - Construction
Since 2000 the annual KPI surveys have assessed the time predictability of the whole project (i.e. the combined time for design and con-struction). The KPI is the proportion of projects that were on time or better.
Projects, as a whole, came in on time or better 41% of the time. This is an improvement on the previous survey, but is below the average of recorded since 2003.
The annual KPI surveys ask for the actual out-turn time taken for the design phase compared with the length of time agreed at the start of that phase. The KPI is the proportion of projects that were on time or better.
The KPI declined to 48% in the 2016 survey, reversing the progress made over the previous two years.
The annual KPI surveys ask for the actual out-turn time taken for the construction phase compared with the length of time agreed at the start of that phase. The KPI is the proportion of projects that were on time or better.
The KPI improved in 2016, partially reversing the sharp drop in the previous survey.
Individual KPI Trends (cont.)Economic KPIs - All Construction
UK Industry Performance Report 2016 20
WO
RS
E
BE
TT
ER
BE
TT
ER
7.9% 8.2%9.6% 9.9%
7.7%
5.0%
2.7% 2.1% 2.8% 2.5%
8.1%
0%
2%
4%
6%
8%
10%
12%
2005 2006 2007 2008 2009 2010 2011 2012 2013/14 2015 2016
38.2 42 45.5 46.2 49.558.5 60 63.8 66 69
34.2
020406080
2005 2006 2007 2008 2009 2010 2011 2012 2013/14 2015 2016
44.5 46.5 47.9 46.8 50.461.2 61.9 62.8 62.1 63.7
42.7
0.020.040.060.080.0
2005 2006 2007 2008 2009 2010 2011 2012 2013/14 2015 2016
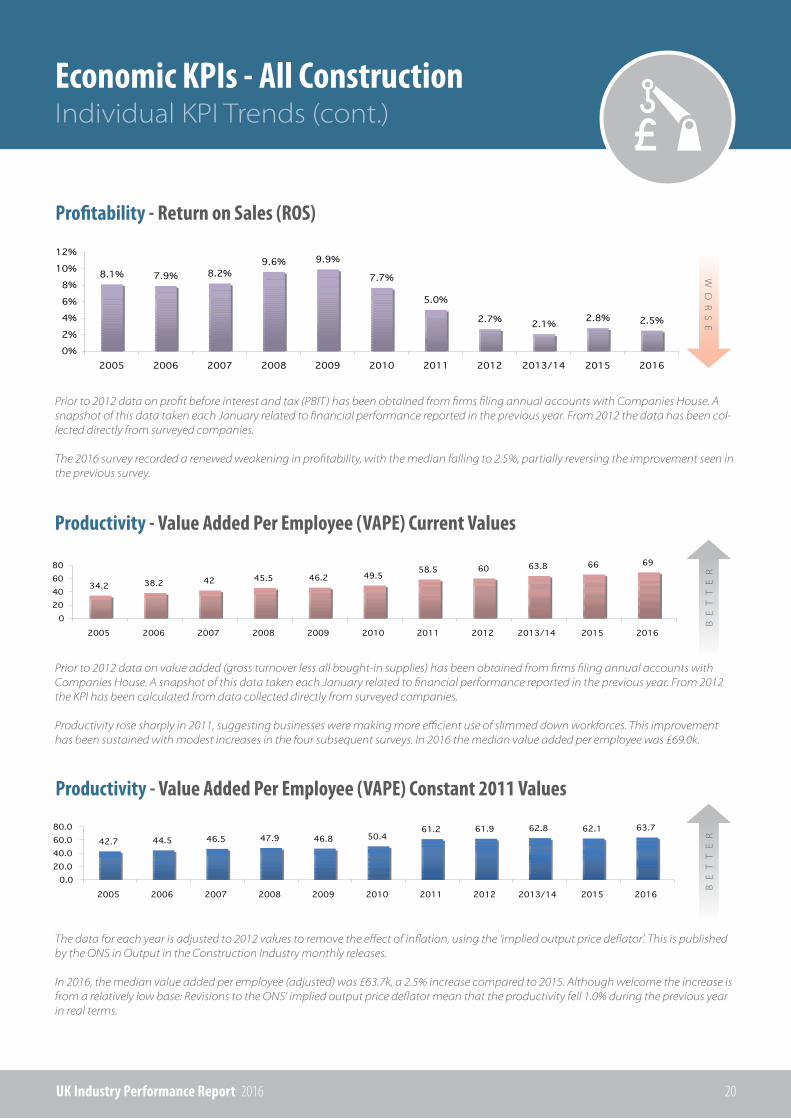
Profitability - Return on Sales (ROS)
Productivity - Value Added Per Employee (VAPE) Current Values
Productivity - Value Added Per Employee (VAPE) Constant 2011 Values
Prior to 2012 data on profit before interest and tax (PBIT) has been obtained from firms filing annual accounts with Companies House. A snapshot of this data taken each January related to financial performance reported in the previous year. From 2012 the data has been col-lected directly from surveyed companies.
The 2016 survey recorded a renewed weakening in profitability, with the median falling to 2.5%, partially reversing the improvement seen in the previous survey.
Prior to 2012 data on value added (gross turnover less all bought-in supplies) has been obtained from firms filing annual accounts with Companies House. A snapshot of this data taken each January related to financial performance reported in the previous year. From 2012 the KPI has been calculated from data collected directly from surveyed companies.
Productivity rose sharply in 2011, suggesting businesses were making more efficient use of slimmed down workforces. This improvement has been sustained with modest increases in the four subsequent surveys. In 2016 the median value added per employee was £69.0k.
The data for each year is adjusted to 2012 values to remove the effect of inflation, using the ‘implied output price deflator’. This is published by the ONS in Output in the Construction Industry monthly releases.
In 2016, the median value added per employee (adjusted) was £63.7k, a 2.5% increase compared to 2015. Although welcome the increase is from a relatively low base: Revisions to the ONS’ implied output price deflator mean that the productivity fell 1.0% during the previous year in real terms.
Individual KPI Trends (cont.)Economic KPIs - All Construction
UK Industry Performance Report 2016 21
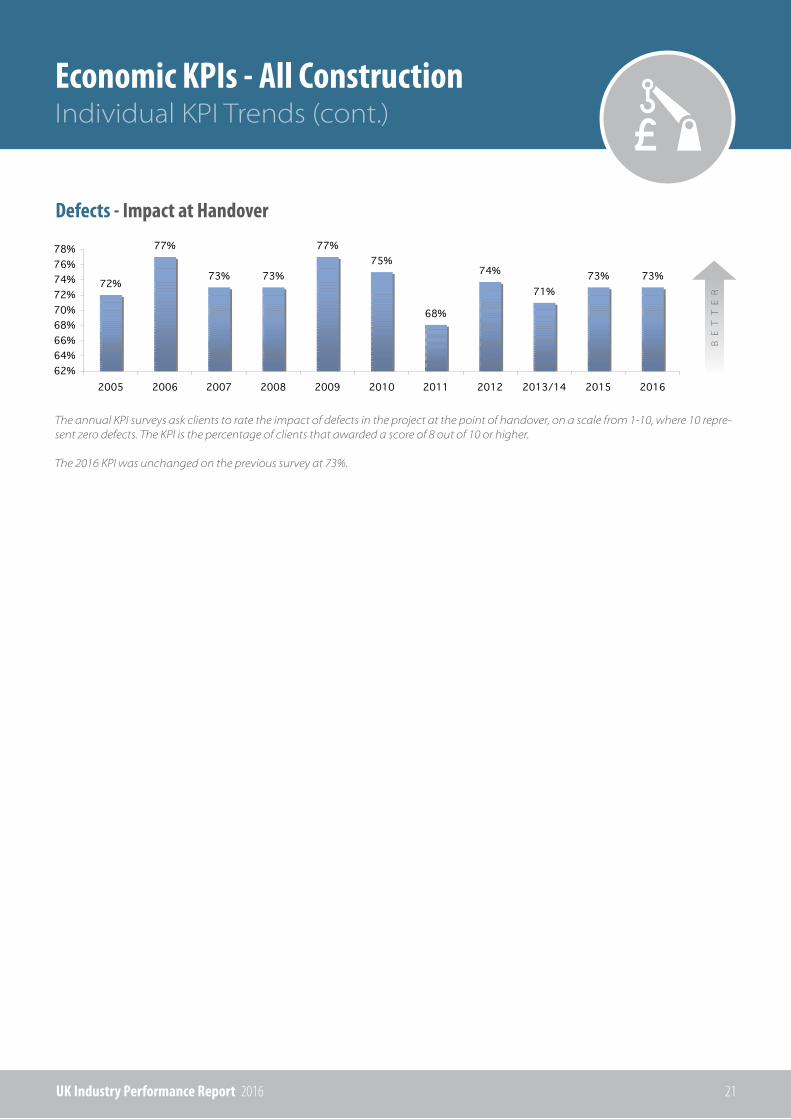
Defects - Impact at Handover
The annual KPI surveys ask clients to rate the impact of defects in the project at the point of handover, on a scale from 1-10, where 10 repre-sent zero defects. The KPI is the percentage of clients that awarded a score of 8 out of 10 or higher.
The 2016 KPI was unchanged on the previous survey at 73%.
BE
TT
ER
72%
77%
73% 73%
77%75%
68%
74%
71%73% 73%
62%64%66%68%70%72%74%76%78%
2005 2006 2007 2008 2009 2010 2011 2012 2013/14 2015 2016
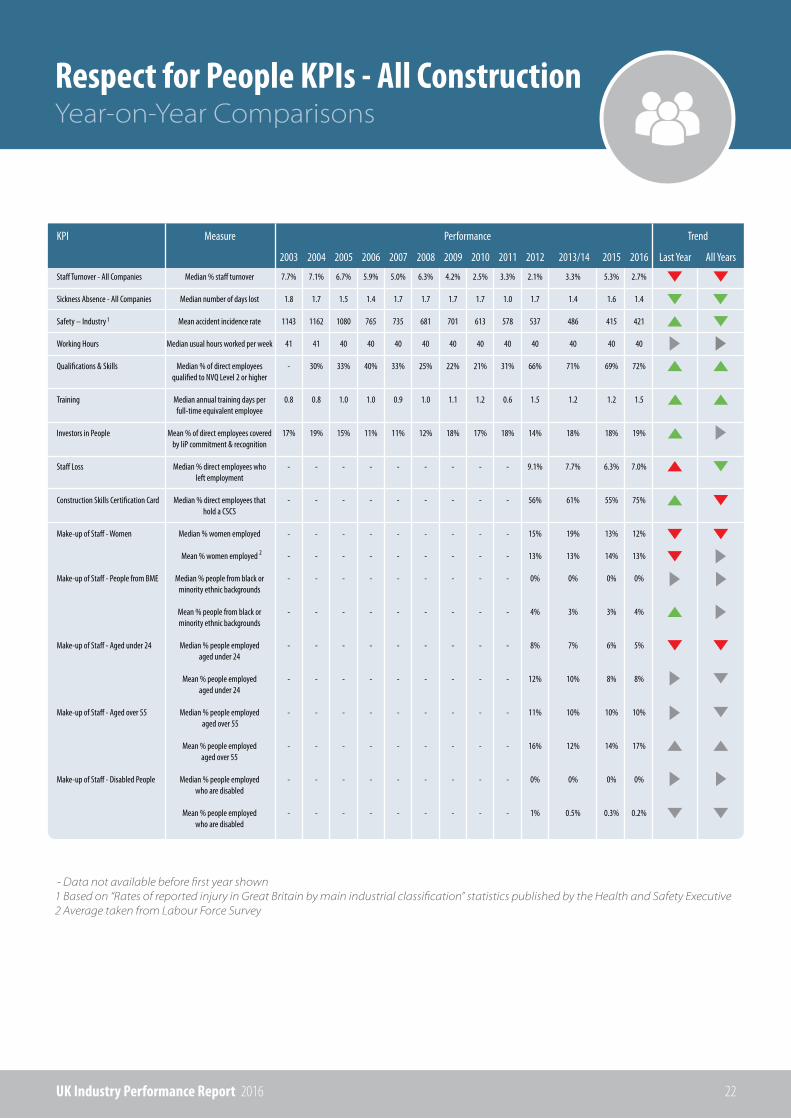
Year-on-Year ComparisonsRespect for People KPIs - All Construction
UK Industry Performance Report 2016 22
- Data not available before first year shown 1 Based on “Rates of reported injury in Great Britain by main industrial classification” statistics published by the Health and Safety Executive 2 Average taken from Labour Force Survey
Staff Turnover - All Companies
Sickness Absence - All Companies
Safety – Industry
Working Hours
Qualifications & Skills
Training
Investors in People
Staff Loss
Construction Skills Certification Card
Make-up of Staff - Women
Make-up of Staff - People from BME
Make-up of Staff - Aged under 24
Make-up of Staff - Aged over 55
Make-up of Staff - Disabled People
KPI
Median % staff turnover
Median number of days lost
Mean accident incidence rate
Median usual hours worked per week
Median % of direct employees qualified to NVQ Level 2 or higher
Median annual training days per full-time equivalent employee
Mean % of direct employees covered by IiP commitment & recognition
Median % direct employees who left employment
Median % direct employees that hold a CSCS
Median % women employed
Mean % women employed
Median % people from black or minority ethnic backgrounds
Mean % people from black or minority ethnic backgrounds
Median % people employed aged under 24
Mean % people employed aged under 24
Median % people employed aged over 55
Mean % people employed aged over 55
Median % people employed who are disabled
Mean % people employed who are disabled
Measure Performance Trend
All YearsLast Year2003
5.3%
1.6
415
40
69%
1.2
18%
6.3%
55%
13%
14%
0%
3%
6%
8%
10%
14%
0%
0.3%
2.7%
1.4
421
40
72%
1.5
19%
7.0%
75%
12%
13%
0%
4%
5%
8%
10%
17%
0%
0.2%
2015 20162004 2005 2006 2007 2008 2009 2010
7.7%
1.8
1143
41
-
0.8
17%
-
-
-
-
-
-
-
-
-
-
-
-
7.1%
1.7
1162
41
30%
0.8
19%
-
-
-
-
-
-
-
-
-
-
-
-
6.7%
1.5
1080
40
33%
1.0
15%
-
-
-
-
-
-
-
-
-
-
-
-
5.9%
1.4
765
40
40%
1.0
11%
-
-
-
-
-
-
-
-
-
-
-
-
5.0%
1.7
735
40
33%
0.9
11%
-
-
-
-
-
-
-
-
-
-
-
-
6.3%
1.7
681
40
25%
1.0
12%
-
-
-
-
-
-
-
-
-
-
-
-
4.2%
1.7
701
40
22%
1.1
18%
-
-
-
-
-
-
-
-
-
-
-
-
2.5%
1.7
613
40
21%
1.2
17%
-
-
-
-
-
-
-
-
-
-
-
-
3.3%
1.0
578
40
31%
0.6
18%
-
-
-
-
-
-
-
-
-
-
-
-
2011
2.1%
1.7
537
40
66%
1.5
14%
9.1%
56%
15%
13%
0%
4%
8%
12%
11%
16%
0%
1%
2012
3.3%
1.4
486
40
71%
1.2
18%
7.7%
61%
19%
13%
0%
3%
7%
10%
10%
12%
0%
0.5%
2013/14
Year-on-Year Comparisons (cont.)Respect for People KPIs - All Construction
UK Industry Performance Report 2016 23
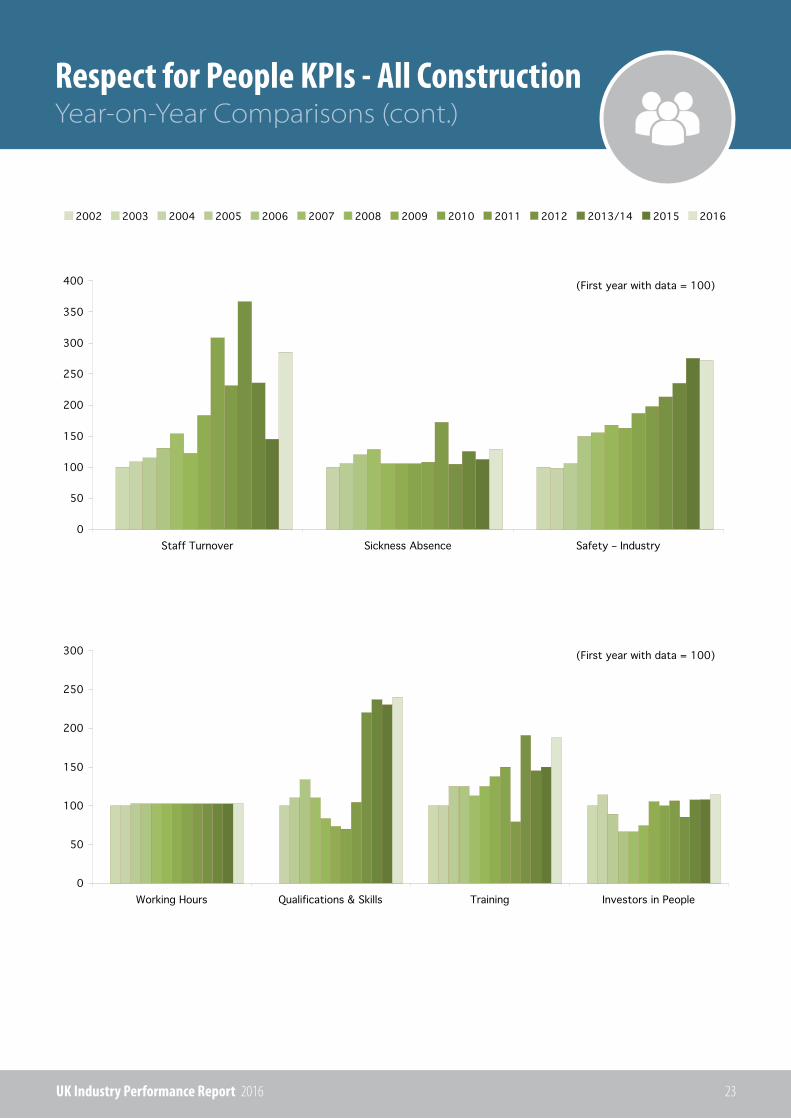
2002 2003 2004 2005 2006 2007 2008 2009 2010 2011 2012 2013/14 2015 2016
(First year with data = 100)
(First year with data = 100)
0
50
100
150
200
250
300
350
400
Staff Turnover Sickness Absence Safety – Industry
0
50
100
150
200
250
300
Working Hours Qualifications & Skills Training Investors in People

Year-on-Year ComparisonsEnvironment KPIs - All Construction
UK Industry Performance Report 2016 24
1 Data not available before the first year shown.2 Data not available after 2008. 3 Limited data use with caution. 4 Insufficient data to publish a result in 2008. The 2007 result used for 2008.5 Current values are deflated by the “All Construction Output Price Index” for the first years KPI to arrive at constant values.
Product Performance
Energy use (Designed)
Energy use (Designed) - Housing SAP Rating
Energy use (Designed) - Housing SAP Rating
Mains water use (Designed)
Construction Process Performance
Energy Use (Current Values)
Energy Use (Constant 2012 Values)
Mains Water Use (Current Values)
Mains Water Use (Constant 2012 Values)
Waste (Current Values)
Waste (Constant 2012 Values)
Commercial vehicle movements (Current Values)
Commercial vehicle movements (Constant 2012 Values)
KPI Performance Trend
All YearsLast Year
Median energy use kg CO2 / 100m2 gross floor area
Median SAP2001 rating
Median SAP2005 rating
Median water use m3 / 100m2 gross floor area
Median energy use kg CO2 / £100k project value
Median energy use kg CO2 / £100k project value
Median water use m3 / £100k project value
Median waste removed from site m3 / £100k project value
Median movements onto site / £100k project value
Median movements onto site / £100k project value
Measure
4,414
-
-
69.6
288
242
7.5
6.3
43.5
36.6
44.0
37.0
2003
1,970
-
86.0
54.8
199.0
211.3
4.4
4.4
22.9
22.9
20.0
21.2
2,942
-
86.96
50.5
247.9
268.5
5.3
5.8
19.2
20.8
16.7
18.1
2015 2016
4,295
90
-
70.4
322
288
9.7
8.7
47.1
42.2
34.5
30.9
2004
4,291
95
-
53.2
293
273
8.2
7.7
41.6
38.8
29.4
27.4
2005
3,729
97
-
52
293
293
8.9
8.9
37.0
37.0
30.4
30.4
2006
3,775
100
-
90.4
273
287
8.2
8.6
39.1
41.2
29.4
31.0
2007
4,474
100
-
80
192
213
7.1
7.9
36.9
40.8
26.5
29.3
2008
4,539
-
82.0
49.5
241
278
6.3
7.3
36.6
42.2
28.3
32.6
2009
4,053
-
78.5
47.2
249
286
6.3
7.2
35.1
40.4
23.1
26.6
2010
3,422
-
82.8
46.8
267
300
4.9
5.5
26.7
30.0
19.7
22.2
2011
2,000
-
86.5
46.8
196
223
6.9
7.9
19.4
22.1
16.1
18.3
2012
2,254
-
84.8
54.8
224.2
217.4
4.0
4.1
22.6
23.0
11.2
11.4
2013/14
Supported by
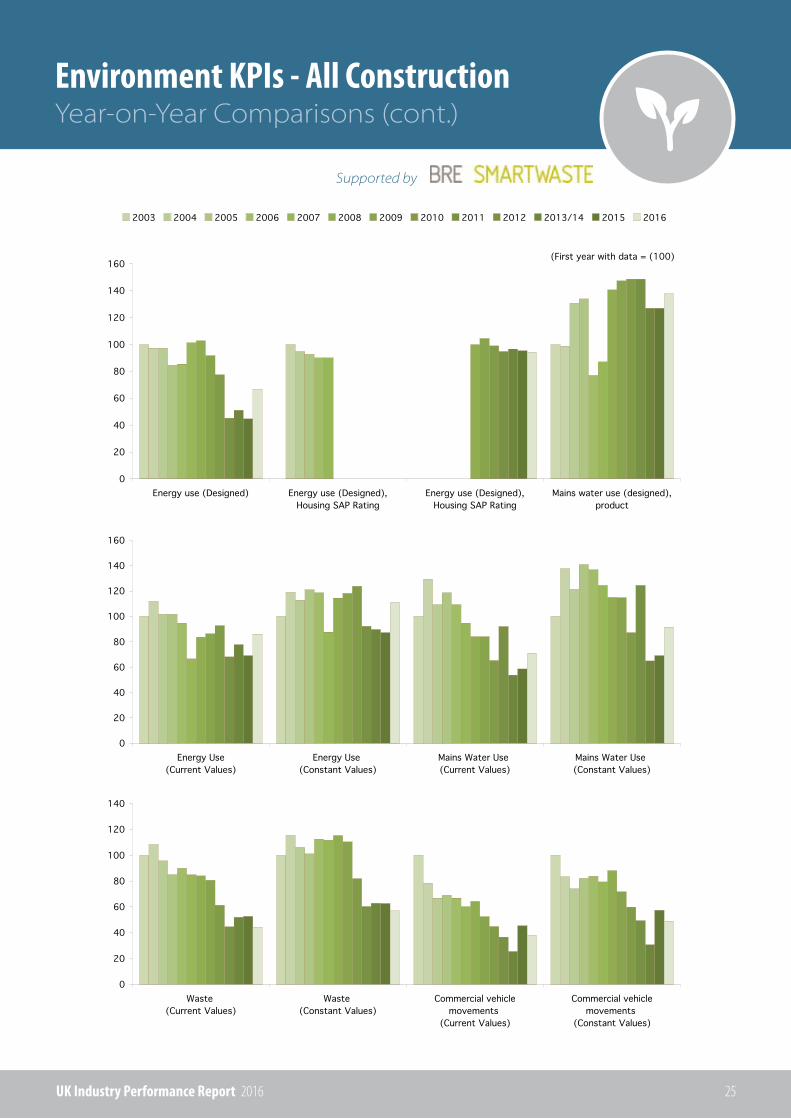
Year-on-Year Comparisons (cont.)Environment KPIs - All Construction
UK Industry Performance Report 2016 25
0
20
40
60
80
100
120
140
160
Energy use (Designed) Energy use (Designed),Housing SAP Rating
Energy use (Designed),Housing SAP Rating
Mains water use (designed),product
2003 2004 2005 2006 2007 2008 2009 2010 2011 2012 2013/14 2015 2016
(First year with data = (100)
0
20
40
60
80
100
120
140
160
Energy Use(Current Values)
Energy Use (Constant Values)
Mains Water Use (Current Values)
Mains Water Use (Constant Values)
0
20
40
60
80
100
120
140
Waste (Current Values)
Waste (Constant Values)
Commercial vehiclemovements
(Current Values)
Commercial vehiclemovements
(Constant Values)
Supported by
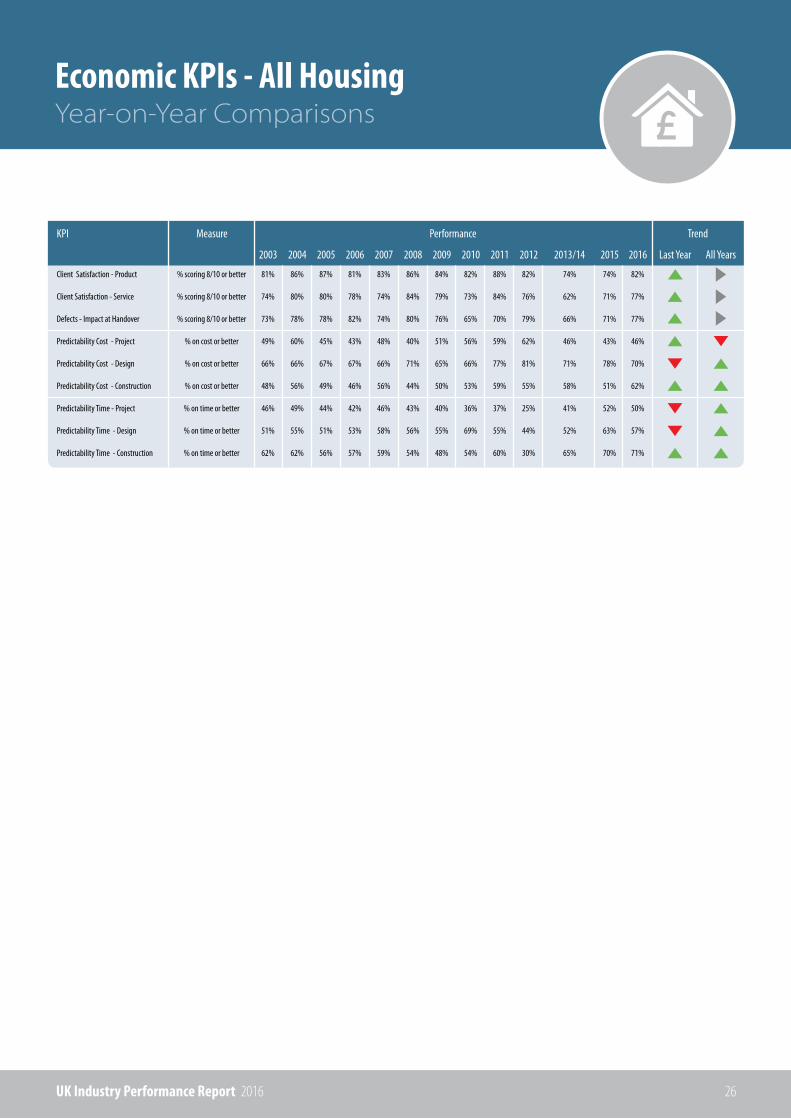
Year-on-Year ComparisonsEconomic KPIs - All Housing
UK Industry Performance Report 2016 26
Client Satisfaction - Product
Client Satisfaction - Service
Defects - Impact at Handover
Predictability Cost - Project
Predictability Cost - Design
Predictability Cost - Construction
Predictability Time - Project
Predictability Time - Design
Predictability Time - Construction
KPI
% scoring 8/10 or better
% scoring 8/10 or better
% scoring 8/10 or better
% on cost or better
% on cost or better
% on cost or better
% on time or better
% on time or better
% on time or better
Measure Performance Trend
81%
74%
73%
49%
66%
48%
46%
51%
62%
2003
74%
71%
71%
43%
78%
51%
52%
63%
70%
2015
82%
77%
77%
46%
70%
62%
50%
57%
71%
2016
86%
80%
78%
60%
66%
56%
49%
55%
62%
2004
87%
80%
78%
45%
67%
49%
44%
51%
56%
2005
81%
78%
82%
43%
67%
46%
42%
53%
57%
2006
83%
74%
74%
48%
66%
56%
46%
58%
59%
2007
86%
84%
80%
40%
71%
44%
43%
56%
54%
2008
84%
79%
76%
51%
65%
50%
40%
55%
48%
2009
82%
73%
65%
56%
66%
53%
36%
69%
54%
2010
88%
84%
70%
59%
77%
59%
37%
55%
60%
2011
82%
76%
79%
62%
81%
55%
25%
44%
30%
2012
74%
62%
66%
46%
71%
58%
41%
52%
65%
2013/14 All YearsLast Year
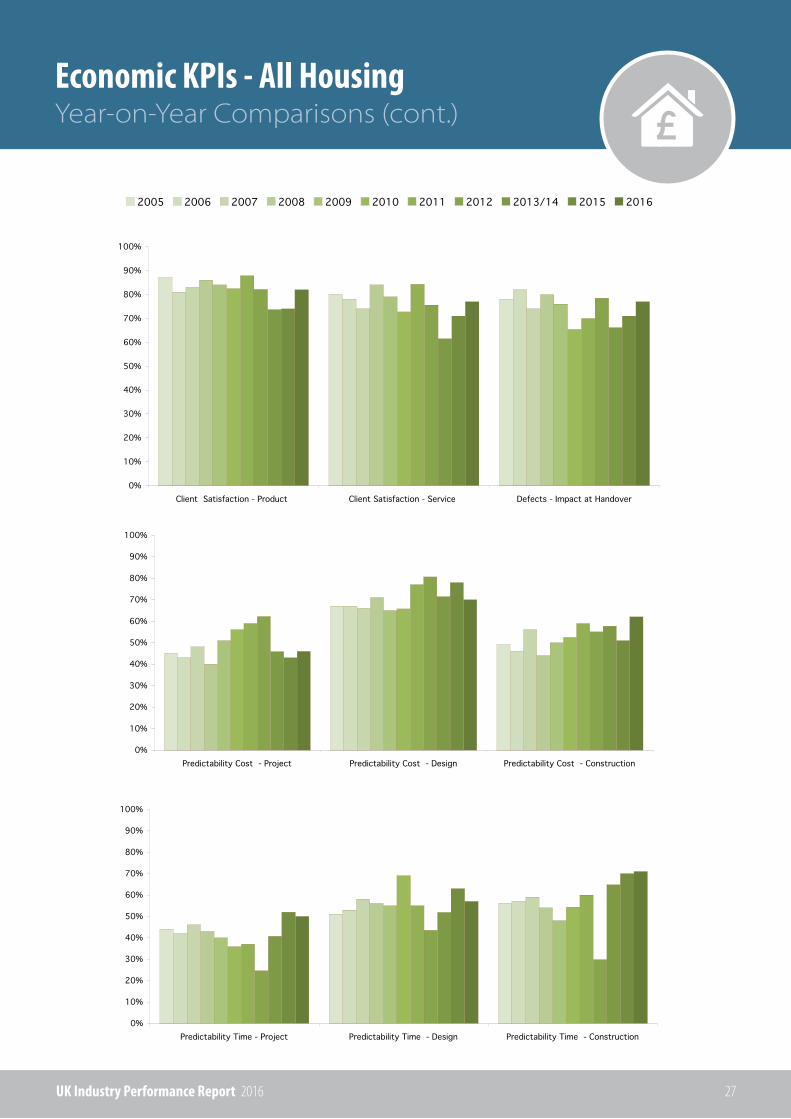
Economic KPIs - All HousingYear-on-Year Comparisons (cont.)
UK Industry Performance Report 2016 27
0%
10%
20%
30%
40%
50%
60%
70%
80%
90%
100%
Client Satisfaction - Product Client Satisfaction - Service Defects - Impact at Handover
2005 2006 2007 2008 2009 2010 2011 2012 2013/14 2015 2016
0%
10%
20%
30%
40%
50%
60%
70%
80%
90%
100%
Predictability Time - Project Predictability Time - Design Predictability Time - Construction
0%
10%
20%
30%
40%
50%
60%
70%
80%
90%
100%
Predictability Cost - Project Predictability Cost - Design Predictability Cost - Construction

Year-on-Year ComparisonsEconomic KPIs - All Non-Housing
UK Industry Performance Report 2016 28
Client Satisfaction - Product
Client Satisfaction - Service
Defects - Impact at Handover
Predictability Cost - Project
Predictability Cost - Design
Predictability Cost - Construction
Predictability Time - Project
Predictability Time - Design
Predictability Time - Construction
KPI
% scoring 8/10 or better
% scoring 8/10 or better
% scoring 8/10 or better
% on cost or better
% on cost or better
% on cost or better
% on time or better
% on time or better
% on time or better
Measure TrendPerformance
76%
70%
64%
54%
66%
52%
46%
57%
59%
2003
83%
74%
74%
71%
75%
56%
38%
52%
45%
2015
86%
77%
72%
68%
73%
67%
40%
42%
43%
2016
77%
73%
60%
50%
63%
48%
41%
60%
59%
2004
81%
75%
66%
48%
63%
47%
46%
54%
65%
2005
85%
79%
74%
46%
68%
43%
45%
60%
62%
2006
82%
78%
71%
45%
65%
46%
46%
54%
60%
2007
82%
72%
68%
51%
62%
50%
48%
61%
57%
2008
86%
86%
77%
47%
59%
44%
47%
50%
65%
2009
88%
85%
76%
63%
73%
56%
47%
61%
61%
2010
87%
78%
67%
66%
80%
60%
47%
52%
60%
2011
83%
74%
72%
61%
79%
60%
37%
49%
46%
2012
83%
77%
72%
75%
81%
57%
46%
52%
67%
2013/14 All YearsLast Year
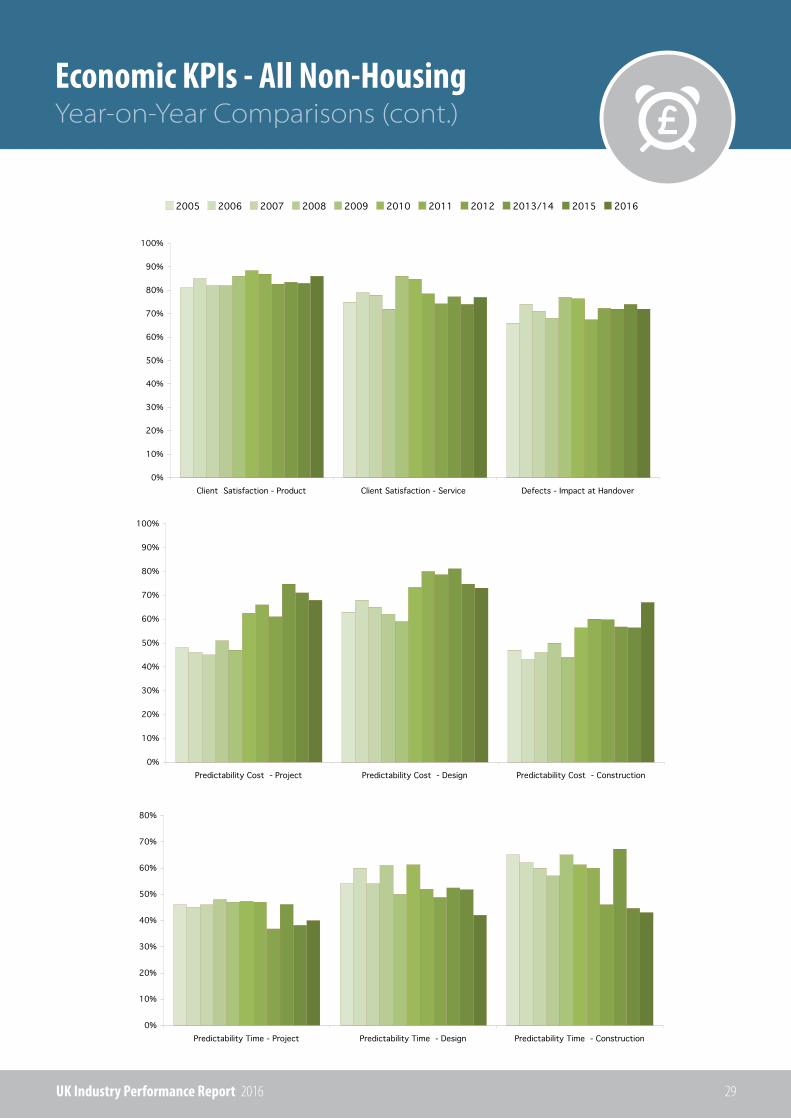
Economic KPIs - All Non-HousingYear-on-Year Comparisons (cont.)
UK Industry Performance Report 2016 29
0%
10%
20%
30%
40%
50%
60%
70%
80%
90%
100%
Client Satisfaction - Product Client Satisfaction - Service Defects - Impact at Handover
2005 2006 2007 2008 2009 2010 2011 2012 2013/14 2015 2016
0%
10%
20%
30%
40%
50%
60%
70%
80%
Predictability Time - Project Predictability Time - Design Predictability Time - Construction
0%
10%
20%
30%
40%
50%
60%
70%
80%
90%
100%
Predictability Cost - Project Predictability Cost - Design Predictability Cost - Construction

Year-on-Year ComparisonsConstruction Consultant KPIs
UK Industry Performance Report 2016 30
Client Satisfaction-Overall
Client Satisfaction-Value for Money
Client Satisfaction-Quality of Service
Client Satisfaction-Timely Delivery
KPI
% scoring 8/10 or better
% scoring 8/10 or better
% scoring 8/10 or better
% scoring 8/10 or better
Measure Performance Trend
42%
37%
43%
38%
2003
45%
39%
42%
41%
2002
72%
74%
73%
70%
2015
77%
79%
81%
77%
2016
48%
45%
45%
42%
2004
51%
41%
43%
36%
2005
50%
49%
47%
38%
2006
52%
47%
49%
44%
2007
54%
46%
49%
45%
2008
55%
46%
49%
45%
2009
76%
74%
79%
72%
2010
74%
74%
76%
72%
2011
75%
73%
73%
75%
2012
72%
70%
74%
72%
2013/14 All YearsLast Year
0%
10%
20%
30%
40%
50%
60%
70%
80%
90%
100%
Client Satisfaction-Overall Client Satisfaction-Value forMoney
Client Satisfaction-Quality ofService
Client Satisfaction-TimelyDelivery
2005 2006 2007 2008 2009 2010 2011 2012 2013/14 2015 2016
UK Industry Performance Report 2016 31
GleniganAbout
UK Industry Performance Report 2016 32
CITBAbout
Its role is to work with employers to encourage training, which helps to build a safe, professional and fully qualified workforce.
The support and funding CITB provides helps companies to improve skills, increase their competitiveness, and respond to challenges such as the low carbon agenda, reducing costs on site and recruiting the best talent for the sector.
CITB works with the industry and its clients to ensure the construction sector has the right skills, in the right place, at the right time.
ResearchCITB provides research and labour market intelligence that benefits the UK construction industry. Combining analysis of industry change, primary research and forecasting capabilities, it has established a strong evidencebase that addresses the needs of a wide range of key industry stakeholders and ensures that skills planning and training decisions can be made with the most up-to-date insight.
For further information on CITB’s research, visit www.citb.co.uk/research
Bespoke Research ServicesCITB’s bespoke research services can help those responsible for construction and infrastructure programmes, related training and assessing economic benefits.
Referring to the right research helps to improve the quality of construction projects, saves time and money, and addresses the issues that make the difference between success and failure.
CITB has a range of unique tools, data, and research and forecasting techniques that provide targeted research solutions that relate to skills and employment needs.
CITB can provide:
• Expertise in all areas of the industry • Unrivalled knowledge and a network of experts • Access to unique data
To find out more about how CITB’s bespoke research services can support your business, visit www.citb.co.uk/research/consultancy/bespoke-research-services
CITB is the Industry Training Board for the construction industry and a partner in ConstructionSkills, the Sector Skills Council

UK Industry Performance Report 2016 33
BRE SMARTWasteAbout
Constructing ExcellenceAbout
UK Industry Performance Report 2016 34

Based on the UK Construction Industry Key Performance Indicators
UK Industry Performance Report
2016