a uml framework for olap conceptual modeling amani jamal … · a uml framework for olap conceptual...
TRANSCRIPT

A UML Framework for OLAP Conceptual Modeling
Amani Jamal
A Thesis
in
The Department
of
Computer Science and Software Engineering
Presented in Partial Fullfilment of the Requirements
for the Degree of Master of Computer Science at
Concordia University
Montreal, Quebec, Canada
March, 2009
© Amani Jamal, 2009

1*1 Library and Archives Canada
Published Heritage Branch
395 Wellington Street Ottawa ON K1A 0N4 Canada
Bibliotheque et Archives Canada
Direction du Patrimoine de I'edition
395, rue Wellington OttawaONK1A0N4 Canada
Your file Votre reference ISBN: 978-0-494-63177-5 Our file Notre reference ISBN: 978-0-494-63177-5
NOTICE: AVIS:
The author has granted a nonexclusive license allowing Library and Archives Canada to reproduce, publish, archive, preserve, conserve, communicate to the public by telecommunication or on the Internet, loan, distribute and sell theses worldwide, for commercial or noncommercial purposes, in microform, paper, electronic and/or any other formats.
L'auteur a accorde une licence non exclusive permettant a la Bibliotheque et Archives Canada de reproduire, publier, archiver, sauvegarder, conserver, transmettre au public par telecommunication ou par I'Internet, preter, distribuer et vendre des theses partout dans le monde, a des fins commerciales ou autres, sur support microforme, papier, electronique et/ou autres formats.
The author retains copyright ownership and moral rights in this thesis. Neither the thesis nor substantial extracts from it may be printed or otherwise reproduced without the author's permission.
L'auteur conserve la propriete du droit d'auteur et des droits moraux qui protege cette these. Ni la these ni des extraits substantiels de celle-ci ne doivent etre imprimes ou autrement reproduits sans son autorisation.
In compliance with the Canadian Privacy Act some supporting forms may have been removed from this thesis.
Conformement a la loi canadienne sur la protection de la vie privee, quelques formulaires secondares ont ete enleves de cette these.
While these forms may be included in the document page count, their removal does not represent any loss of content from the thesis.
Bien que ces formulaires aient inclus dans la pagination, il n'y aura aucun contenu manquant.
• • I
Canada
ABSTRACT
A UML Framework for OLAP Conceptual Modeling
Amani Jamal
Data warehouses are used by organizations around the world to store huge volumes
of historical data. Ultimately, the purpose of the warehouse is to allow decision makers
to assess both the history and, more importantly, the future of the organization. In
practice, the capacity to make meaningful decisions is further supported through
the use of Online Analytical Processing (OLAP) applications that provide more
sophisticated representations of the warehouse data. In order to do this, OLAP
systems rely on a multidimensional conceptual data model that represents the core
elements of the data warehouse, as well as the relationships between them. Currently,
there is no definitive conceptual model for this kind of environment. It is therefore
quite difficult for data warehouse designers to express the kinds of complex analytical
requirements which arise in real-world situations. In this thesis, we propose a robust
and flexible conceptual model that can be used to represent multi-dimensional OLAP
domains. Specifically, we present a profile extension of the Unified Modeling Language
(UML) that consists of a set of stereotypes, constraints and tagged values that
elegantly represent multi-dimensional properties at the conceptual level. We also
make use of the Object Constraint Language (OCL) to ensure the correctness and
completeness of the specification, thereby avoiding an arbitrary use of the basic
components. Furthermore, we demonstrate how the new OLAP profile is utilized
in MagicDraw, one of the leading UML development tools. The end result is an
OLAP Modeling Environment (OME) that should significantly reduce development
time, as well as improving the quality of the analytical interface for the end user.
iii

ACKNOWLEDGEMENTS
It is really an honour and a privilege to express my gratitude and indebtedness to
my supervisor, Todd Eavis for his priceless support, encouragement and inspiration.
His rich experience, wealth of knowledge, and critical and creative thinking has given
me direction and insight in pursuing this research. I treasure the invaluable support
and encouragement of my dear parents. I owe my loving thanks to my husband
Talal Basha and my sons Mohammed and Adnan. They have endured a lot from my
research without their kindness, support, understanding and encouragement it would
not be possible to complete this research. Also, I would like to take this opportunity
to personally thank all of my colleagues and friends who have been so supportive and
giving of their time, especially Ohoud Alshaibi and Reem Alnanih.
IV
Table of Contents
List of Figures ix
List of Tables xii
1 Introduction 1
1.1 A new UML-based model 3
1.1.1 The Object Constraint Language 5
1.2 A Prototype Implementation 5
1.2.1 Domain Specific Language extensions 6
1.3 Thesis Structure 7
2 Background Material 8
2.1 Introduction 8
2.2 Decision Support Systems 10
2.2.1 The Data Warehouse 11
2.2.2 Data Warehouse Architecture 13
2.2.3 The Star Schema 13
2.3 Online Analytical Processing 15
2.3.1 Core OLAP operations 16
2.4 The Multidimensional model 19
2.4.1 Hierarchies 20
v
2.4.2 Simple Hierarchies 21
Symmetric Hierarchies 22
Asymmetric Hierarchies 23
Generalized Hierarchies 24
Strict versus Non-Strict 26
2.4.3 Complex Hierarchies 27
Multiple Hierarchies 28
Parallel Hierarchies 30
2.5 Unified Modeling Language 32
2.5.1 Class Diagram 32
2.5.2 UML Profiling 34
2.5.3 Extensibility mechanisms 35
2.5.4 The Object Constraint Language 36
2.6 Related work 39
2.7 Conclusions 42
3 Multi-dimensional Modeling 45
3.1 Introduction 45
3.2 Motivation 47
3.2.1 Why OLAP Conceptual Modeling? 47
3.2.2 Why UML? 48
3.2.3 Why not ER? 49
3.2.4 WhyOCL? 50
3.3 Multi-dimensional modeling concepts 51
3.3.1 General definitions 52
3.3.2 Design guidelines 54
3.3.3 OLAP hierarchies 57
vi

3.3.4 Analysis criterion 60
3.3.5 Conformed dimension 61
3.3.6 Role playing dimension 63
3.3.7 Degenerate dimension 63
3.3.8 Measure values 64
3.3.9 Attribute 65
3.3.10 Time dimension 65
3.3.11 The global view 66
3.3.12 A UML perspective 67
3.3.13 Meta model 67
3.4 The multi-dimensional profile 69
3.4.1 Simple Stereotypes 71
3.4.2 Stereotyped Packages 73
3.5 Conclusion 83
4 OLAP Modeling Environment 85
4.1 Introduction 85
4.2 MagicDraw UML Tool 86
4.2.1 MagicDraw Custom Diagram Wizard 86
4.2.2 Creating domain-specific meta models 91
4.2.3 Validation in MagicDraw 95
4.3 Creating the OLAP Modeling Environment 95
4.3.1 Task One: Identify OLAP concepts and relationships 96
4.3.2 Task Two: Prepare UML OLAP hierarchy profile 96
4.3.3 Task Three: Define Validation Rules 99
4.3.4 Task Four: Define a Customization Layer 102
4.3.5 Task Five: Define the OLAP Diagram 104
vii

4.4 Case Study 105
4.4.1 Requirement Specification 105
4.4.2 Conceptual Design 106
4.5 Conclusions I l l
5 Conclusion and Future work 112
5.1 Summary 112
5.2 Future Work 114
5.2.1 XSLT conversion 114
5.2.2 Profile portability 115
5.3 Conclusions 115
Bibliography 117
vm
List of Figures
1.1 OMG organization 4
2.1 Worldwide total OLAP market size, in billions of dollars 9
2.2 The general DW/OLAP environment 14
2.3 A small three dimensional Star Schema 15
2.4 (a) A simple three dimensional OLAP cube, (b) Pivot, (c) Slice, (d)
Dice (e) Roll up (f) Drill down 18
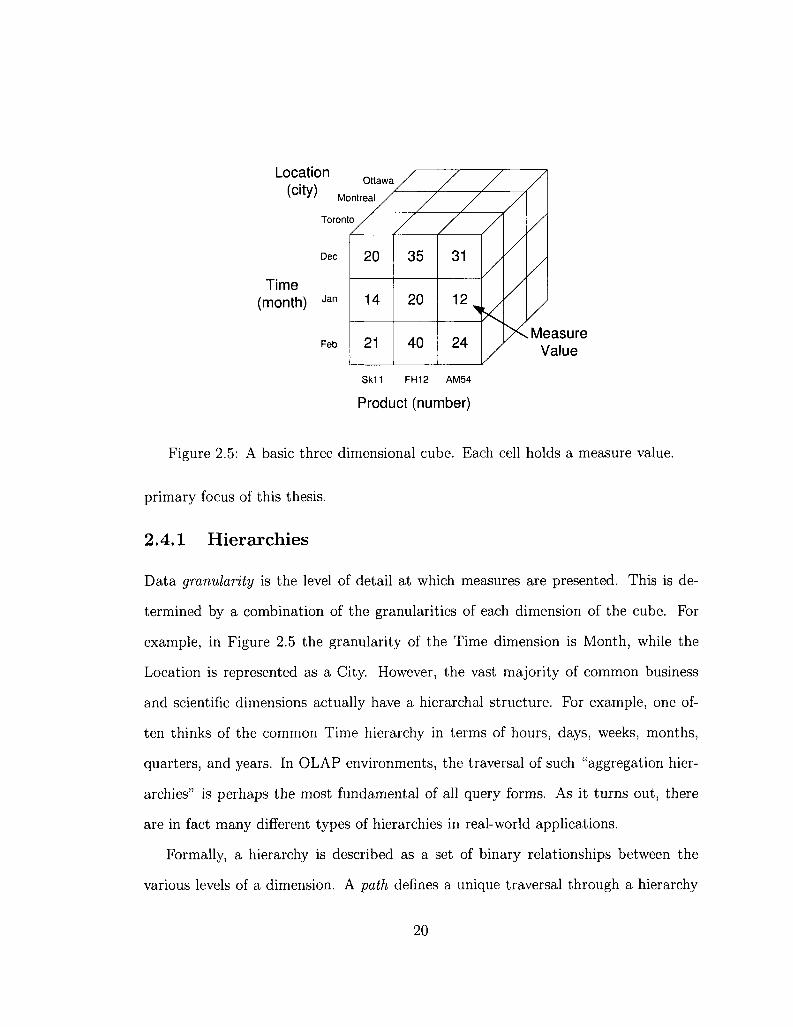
2.5 A basic three dimensional cube. Each cell holds a measure value. . . 20
2.6 A four level symmetric hierarchy 22
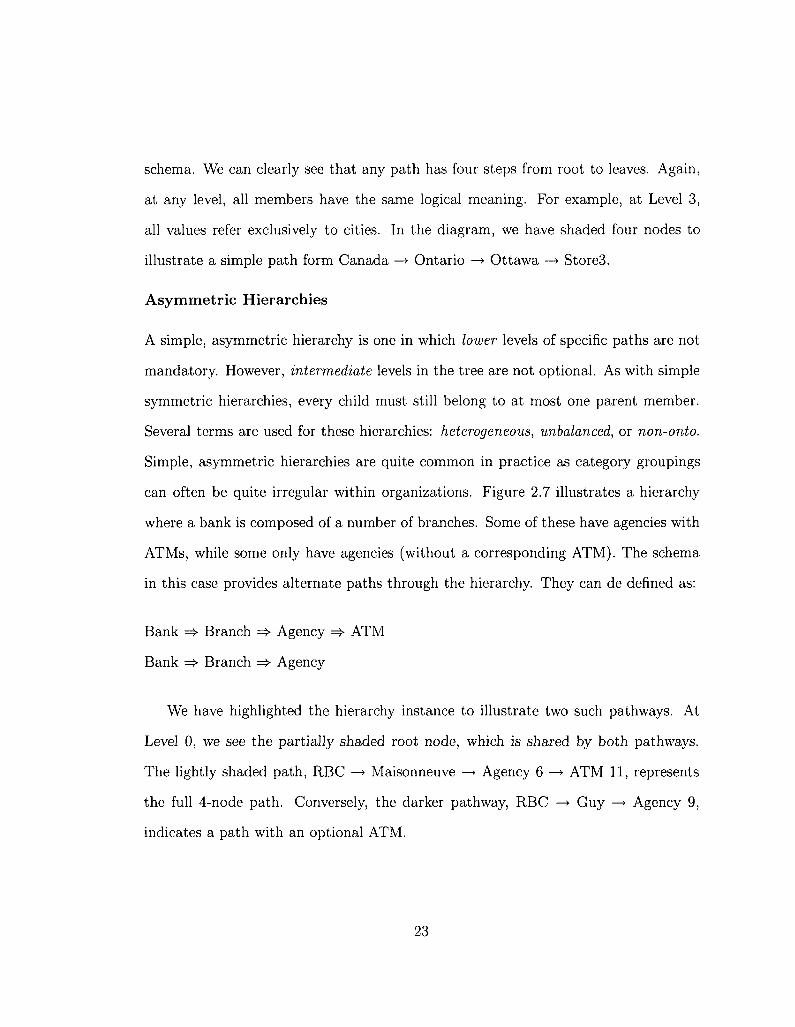
2.7 A four level asymmetric hierarchy 24
2.8 A five level generalized hierarchy 25
2.9 A four level ragged hierarchy 26
2.10 A four level non-strict hierarchy 27
2.11 A four level multiple inclusive hierarchy 28
2.12 A four level multiple alternative hierarchy 29
2.13 A four level parallel independent hierarchy 31
2.14 A four level parallel dependent hierarchy 31
2.15 A basic UML class diagram 33
2.16 (a) Package import (b) Element import (c) Package Merge 34
3.1 A simple stereotype diagram 52
ix
3.2 Different representations 56
3.3 Content of a Dimension package 58
3.4 Content of a hierarchy package 59
3.5 Content of a Conformed Package 62
3.6 Time dimension playing distinct roles 63
3.7 Content of the Time package 66
3.8 Content of a Schema package 67
3.9 Extension of the UML with multi-dimensional stereotypes 68
3.10 The meta model 71
3.11 Strict Symmetric package 74
3.12 Hierarchy icons for (a) Strict Symmetric (b) Strict Asymmetric (c)
Strict Generalized (d) Strict Ragged 74
3.13 Strict Asymmetric package 75
3.14 Strict Generalized package 77
3.15 Strict Ragged package 78
3.16 Hierarchy icons for (a) Non-strict Symmetric (b) Non-strict Asymmetric
(c) Non-strict Generalized (d) Non-strict Ragged 79
3.17 A non-strict version of a Simple Symmetric hierarchy 79
3.18 Multiple Inclusive package 80
3.19 Hierarchy icons for (a) Multiple Inclusive (b) Multiple Alternate (c)
Parallel Independent (d) Parallel Dependent 80
3.20 Multiple Alternative package 82
3.21 Parallel Independent package 82
3.22 Parallel dependent package 83
4.1 Specifying the diagram type and icon 87
4.2 Specifying the module 88
x
4.3 Specifying the associated toolbars 89
4.4 Specifying the associated toolbar buttons 90
4.5 Editing buttons 90
4.6 Smart manipulators 91
4.7 Specifying smart manipulators 92
4.8 UML properties 93
4.9 The customization layer 94
4.10 Validation 96
4.11 A work flow for creating DSML using customized UML profile . . . . 97
4.12 The basic hierarchy meta model 98
4.13 A detailed look at the "association" model 98
4.14 An illustration of the Hierarchy Profile 99
4.15 Multiple inclusive hierarchy constraints 101
4.16 Validation error for a double Root in a Strict Symmetric hierarchy. . 102
4.17 Validation suites 103
4.18 A customization of the Dimension Package 104
4.19 A customization dialog for the Level class 105
4.20 A screen shot for OME diagram 106
4.21 Content of the Calendar Time hierarchy 107
4.22 The Affiliation dimension 108
4.23 The Diffusion dimension 108
4.24 Fact and dimension relationships 109
4.25 Project schema 110
XI
List of Tables
2.1 Summary of standard data warehousing stereotypes 43
3.1 Summary of standard data warehousing stereotypes 70
3.2 UML/OCL properties for Simple hierarchies 76
3.3 UML/OCL properties for Complex hierarchies 81
4.1 Customization stereotype tags 94
4.2 Validation rule stereotype tags 95
4.3 UML profile for defining OLAP hierarchy structure 100
xn

Chapter 1
Introduction
Data warehouses are an essential component of data-driven decision support systems
(DSS) [20] and have become the focal point for decision support in organizations
today [33]. Moreover, empirical evidence suggests that DSS users can demonstrably
improve the quality of decision making by successfully implementing an enterprize
data warehouse [4]. In order to gain business insight from the data stored in data
warehouses, decision makers typically rely upon sophisticated On-line Analytical Pro
cessing (OLAP) applications that further process or manipulate the underlying data.
In fact, for OLAP tools alone, Fernandez-Medina and Piattini estimate the worldwide
market at 6 billion dollars in 2007, compared with just one billion dollars in 1996 [13].
In general, OLAP systems are based upon a multidimensional model that provides
managers with a business-oriented view of data. These multi-dimensional models
facilitate data navigation, analysis, and ultimately decision making, often through
the traversal of dimension or attribute hierarchies. In short, attribute hierarchies
allows users to assess core organizational metrics at varying levels of granularity.
Physically, of course, the underlying databases may structure data in any way
they see fit. For example, multi-dimensional OLAP (MOLAP) tools store data in a
1
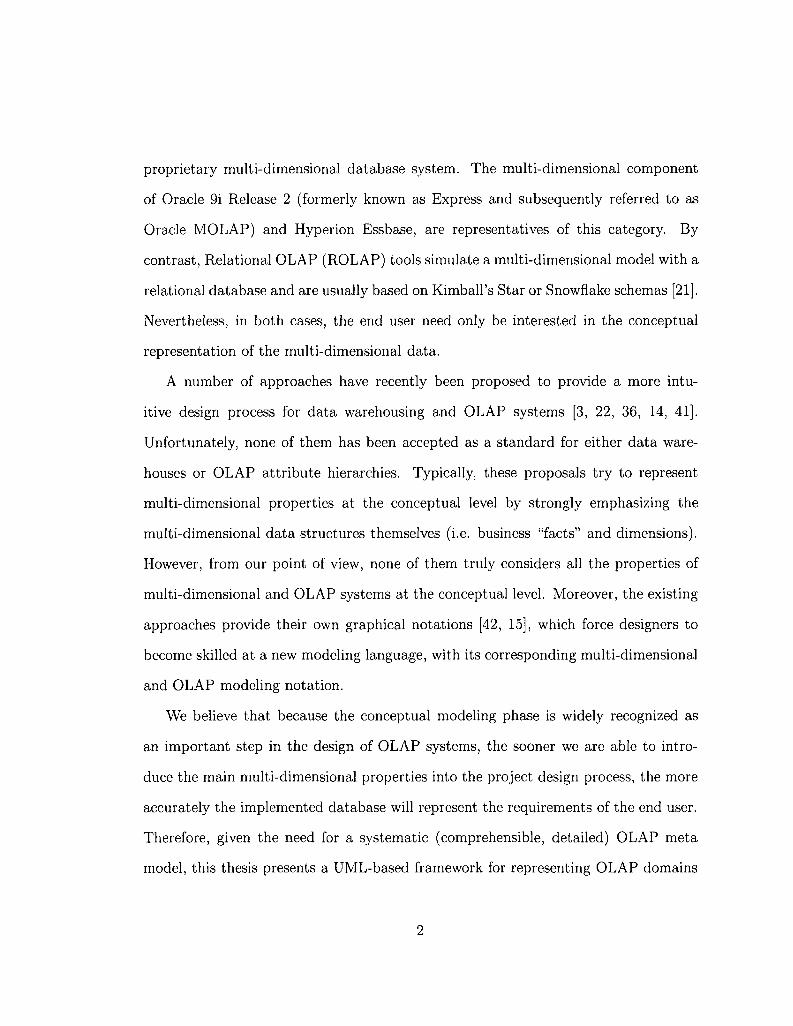
proprietary multi-dimensional database system. The multi-dimensional component
of Oracle 9i Release 2 (formerly known as Express and subsequently referred to as
Oracle MOLAP) and Hyperion Essbase, are representatives of this category. By
contrast, Relational OLAP (ROLAP) tools simulate a multi-dimensional model with a
relational database and are usually based on Kimball's Star or Snowflake schemas [21].
Nevertheless, in both cases, the end user need only be interested in the conceptual
representation of the multi-dimensional data.
A number of approaches have recently been proposed to provide a more intu
itive design process for data warehousing and OLAP systems [3, 22, 36, 14, 41].
Unfortunately, none of them has been accepted as a standard for either data ware
houses or OLAP attribute hierarchies. Typically, these proposals try to represent
multi-dimensional properties at the conceptual level by strongly emphasizing the
multi-dimensional data structures themselves (i.e. business "facts" and dimensions).
However, from our point of view, none of them truly considers all the properties of
multi-dimensional and OLAP systems at the conceptual level. Moreover, the existing
approaches provide their own graphical notations [42, 15], which force designers to
become skilled at a new modeling language, with its corresponding multi-dimensional
and OLAP modeling notation.
We believe that because the conceptual modeling phase is widely recognized as
an important step in the design of OLAP systems, the sooner we are able to intro
duce the main multi-dimensional properties into the project design process, the more
accurately the implemented database will represent the requirements of the end user.
Therefore, given the need for a systematic (comprehensible, detailed) OLAP meta
model, this thesis presents a UML-based framework for representing OLAP domains
2
explicitly defined at the conceptual level. To this end, UML is further enriched with
concepts relevant to multi-dimensional systems. Specifically, implementation issues
such as primary keys and data types are ignored, while instead we focus on the graph
ical representation of the hierarchical elements at the heart of the multi-dimensional
model.
1.1 A new UML-based model
Since the Unified Modeling Language (UML) is a general purpose visual modeling
paradigm that can be used across all major application domains and implementation
platforms, we propose its use for multi-dimensional modeling (rather than defining a
new modeling language). The UML specification defines UML as a graphical language
for visualizing, specifying, constructing and documenting the artifacts of software-
intensive systems [27]. The UML offers a standard way to write a system's blueprints,
including conceptual elements such as business processes and system functions, as well
as concrete components like programming language statements, database schemas,
and reusable software facilities. UML does this by essentially combining elements
from the three major 0 0 design methods: Booch's 0 0 Analysis and design [34],
Rumbaugh's OMT modeling [7], and Jacobson's Objectory [19].
UML unifies the methods used around the world and adopted by both industry
and academia as a standard language for describing software systems. This is reflected
by the fact that it is currently supported by hundreds of model-driven commercial
tools, which have been productively used in a great number of development projects.
Nevertheless, the fact that UML is a general purpose notation can limit its suitability
in specific domains such as data warehousing and OLAP. With UML 2.0, however,
3

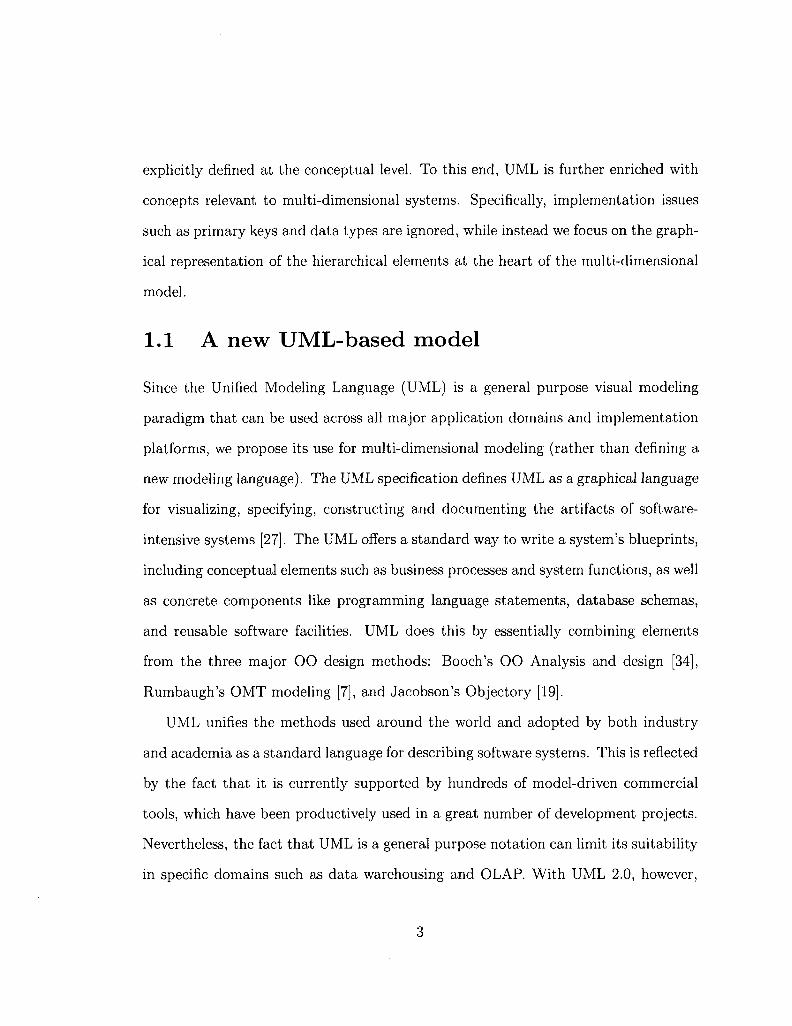
corresponds to f
M2 | UML Metamodel j „ b a s e d o n UML Diagrams J
corresponds to |
I is modeled using User Model (UML)
corresponds to f
MO I Real World J
Figure 1.1: OMG organization.
the underlying semantics have been defined more precisely, and the notation includes
a new set of diagrams and concepts which are more appropriate for modeling the
structure of OLAP hierarchies. Moreover, UML 2.0 provides extension mechanisms
to cover as many domains as possible (e.g., stereotypes, tagged definitions and con
straints). A consistent set of such extensions is called a UML profile. UML profiles
are used to model those aspects of systems or applications that are not directly de-
scribable by native UML elements. In fact, the UML profiling mechanism allows the
precise definition of a Meta Object Facility (MOF) based domain-specific language
that, in turn, allows the semantics of the basic UML elements to be extended and
refined. Figure 1.1 shows the classical OMG organization of models with MOF on
top of the hierarchy and UML at level M2.
In this thesis, we present an extension to the UML by creating a "customized"
UML profile. We do so by adding a customization layer, which essentially transforms
stereotypes into a meta class [37] for the coherent modeling of multi-dimensional do
mains in general, and OLAP aggregation hierarchies (i.e., the granularity of analysis)
in particular. This profile is defined by a set of stereotypes, constraints and tagged
values that represent multi-dimensional and OLAP properties at the conceptual level.
We further extend the model by grouping the core elements into UML packages. In
short, a package groups classes into higher level units, thereby creating different lev
els of abstraction and consequently simplifying and improving the coherency of the
final model. We note that previous approaches do not consider using packages for
modeling OLAP hierarchies.
1.1.1 The Object Constraint Language
As noted, data warehouses, multi-dimensional databases, and OLAP applications are
powerful tools for discovering crucial business information in strategic decision-making
processes. Given the importance of precision and clarity in this context, we further
make use of the Object Constraint Language (OCL) [28] to specify the constraints
or restrictions attached to the defined stereotypes. Simply put, OCL is a formal
language used to describe expressions on UML models. These expressions typically
specify invariant conditions that must hold for the system being modeled or queried.
Our extensions therefore make use of OCL for stating "well-formedness" rules, thereby
allowing us to prevent users from specifying arbitrary — and conceptually incorrect
— combinations of notational elements. We note that various research proposals
have previously used OCL in some capacity. However, to our knowledge, OCL has
not been used for the specification of OLAP hierarchies.
1.2 A Prototype Implementation
To ensure the correctness of the proposed conceptual model, we have developed a
relatively complete implementation of our new UML profile using the MagicDraw
5
case tool. We clearly demonstrate how the elements of the conceptual framework
can be specified within MagicDraw (though our methods should be applicable to
any standards-compliant case tool). Our profile provides a common language for
representing OLAP hierarchies in a flexible and intuitive manner. In total, some 24
UML stereotypes have been defined, including specializations of two Attribute model
elements, three Class model elements, one Comment model element, four Association
model elements, two Association Class model elements, and fifteen Package model
elements. The OLAP hierarchy extensions are based on the most semantically similar
construct in the UML meta model. In addition to the tags and constraints that have
been defined for the new environment, we have also included a set of new icons that
allow the user to intuitively manipulate the hierarchy packages.
1.2.1 Domain Specific Language extensions
Since the UML modeling environment is quite complex, applying stereotypes alone
does not completely hide low-level UML properties and terminology. Because it
is difficult to fully restrict the usage of standard UML elements to ensure model
correctness, we use Magic Draw's Domain Specific Language (DSL) engine to create
an "OLAP modeling" Environment (OME). In short, use of DSL helps to ensure the
efficient design of an easily maintained OLAP model by allowing the user to (i) define
the OLAP Hierarchy meta model, (ii) map this meta model to a UML profile, (iii)
define customizations for stereotypes, (iv) define OCL-based validation rules and (iv)
create a custom OLAP diagram. We have also defined a specific graphical notation for
stereotypes, as permitted by the UML specification. This notation makes the multi
dimensional schema more concise and readable. Ultimately, the DSL tools allow us to
create custom diagrams, custom specification dialogs, and custom real-time semantic
6
rules that further extend the power of the OME.
1.3 Thesis Structure
The remainder of this thesis is organized as follows. Chapter 2 provides an overview
of Online Analytical Processing, including a review of the fundamental OLAP oper
ations and server architectures, as well as UML and OCL. The chapter also presents
a classification of attribute hierarchies in the real-world. The succeeding chapters
present the core contributions of the thesis. Chapter 3 explains how we build upon
UML to define a new OLAP meta model and integrate the proposed elements into a
cohesive UML profile. The prototype implementation of the model is then fully illus
trated in Chapter 4. Finally, in Chapter 5, we offer conclusions and briefly describe
possible future work.
7
Chapter 2
Background Material
2.1 Introduction
Data warehousing and On-line Analytical Processing (OLAP) are two of the most
significant technologies in the business processing arena. Together, they are used in
a multitude of industries such as retail sales, telecommunications, financial services
and real estate [9]. Perhaps the simplest measure of the impact of these technologies
is their growth in market value over the past decade and a half. The OLAP Report,
an industry publication that tracks issues and trends in the DW/OLAP context,
publishes a yearly online review that attempts to approximate the sales volume for
Business Intelligence products [30]. In fact, the report deals exclusively with OLAP
tools and software and does not even include general-purpose database applications
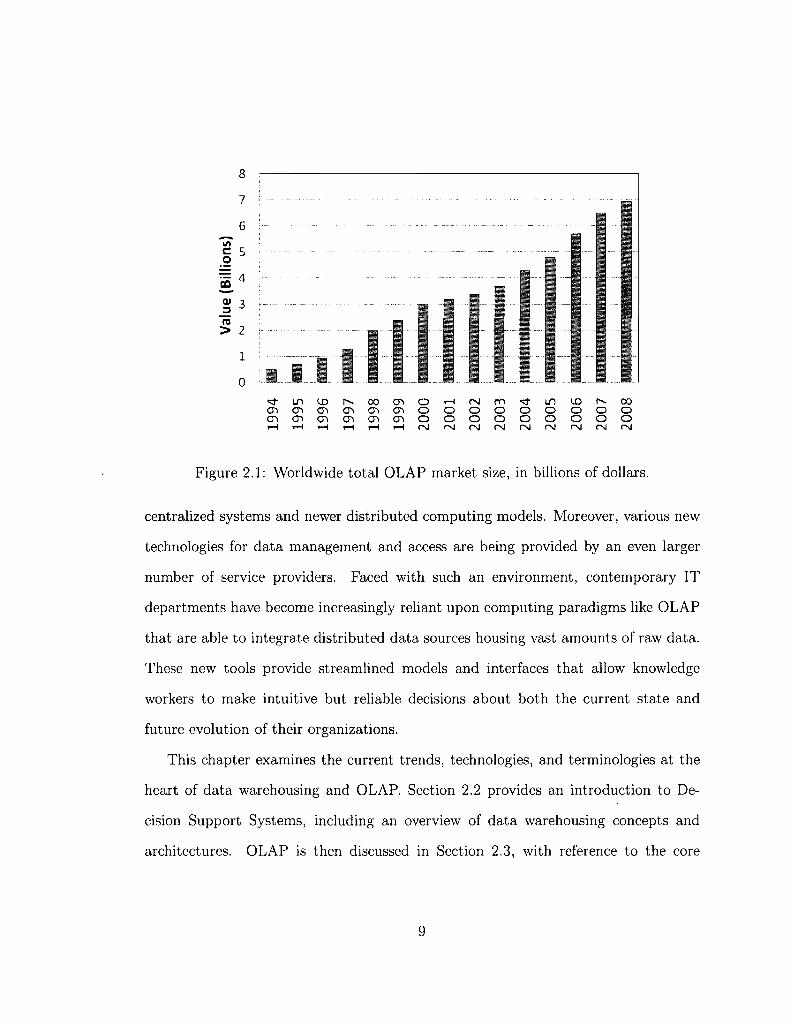
that are often used in data warehouse settings. In any case, as Figure 2.1 demon
strates, the value of the OLAP market has grown from just 500 million dollars in
1994 to almost 8 billion in 2008, a 16-fold increase.
Apart from the rise in sales volume, we note that another core theme in this
context is the increase in the complexity and sophistication of data warehousing in
general. Over the years, organizations have come to rely upon a broad mix of older
8
c r i c n c n c r i c r i c r i o o o o o o o o o c n c n c T i c n c r i c r i o o o o o o o o o ,—I r-1 tH 1—I 1 — I T — I I N r N f N N f M N t N O J r v l
Figure 2.1: Worldwide total OLAP market size, in billions of dollars.
centralized systems and newer distributed computing models. Moreover, various new
technologies for data management and access are being provided by an even larger
number of service providers. Faced with such an environment, contemporary IT
departments have become increasingly reliant upon computing paradigms like OLAP
that are able to integrate distributed data sources housing vast amounts of raw data.
These new tools provide streamlined models and interfaces that allow knowledge
workers to make intuitive but reliable decisions about both the current state and
future evolution of their organizations.
This chapter examines the current trends, technologies, and terminologies at the
heart of data warehousing and OLAP. Section 2.2 provides an introduction to De
cision Support Systems, including an overview of data warehousing concepts and
architectures. OLAP is then discussed in Section 2.3, with reference to the core
9
operations typically found in commercial OLAP products. In Section 2.4, we intro
duce the multi-dimensional data model that is at the heart of all OLAP applications.
A classification of real-world dimension hierarchies is provided in some detail. An
overview of some of the key elements of the Unified Modeling Language and the Ob
ject Constraint Language — at least as they relate to this thesis — is presented in
Section 2.5. Finally, Section 5 concludes the chapter with a brief summary.
2.2 Decision Support Systems
Decision Support Systems (DSS) are a specific class of enterprize software that sup
ports business and organizational decision-making activities. From the user's per
spective, they provide a clean, intuitive interface through which to view organiza
tional data. Underneath the end-user interface, however, we generally find complex
hardware/software combinations that support decision making by extracting and ma
nipulating key information from raw data, documents, XML, text, etc. Below, we
briefly review the three main DSS models, including OLAP which, of course, is the
focus of this research program.
• Information Processing. Here, attention is given to fundamental query
ing and reporting functions. Information processing systems accept queries —
whether ad-hoc or pre-defined — and processes data so as to provide the nec
essary information to decision makers. At this stage, only very simple analysis
is needed, and consists of operations such as extraction, sorting, and basic ag
gregation.
• OLAP. Online Analytical Processing extends the basic capabilities of Infor
mation Processing systems by permitting one to answer analytical queries of
10
a multi-dimensional or multi-attribute nature. OLAP tools allow users to
drill into the underlying data warehouse and analyze different dimensions (i.e.,
columns of interest) from a variety of perspectives and logical hierarchies. A
key OLAP concept is the importance of historical or time-based analysis. In
other words, users are typically interested in trends or analysis that span broad
time periods.
• Data Mining. Here, analysis focuses on relationships or patterns that have not
previously been identified. Data mining tends to be more of a data driven ap
proach, in contrast to OLAP, where the user generally initiates and directs the
process. Typical data mining operations are classification (defining the char
acteristics of a certain group), association (identifying relationships between
events), and clustering (identifying groups of items sharing particular charac
teristics) .
2.2.1 The Data Warehouse
The three forms of decision support listed above must of course rely on an underly
ing physical data management platform. Traditional database systems, often called
Online Transaction Processing (OLTP) applications, support the daily operational
needs of an organization, but are not well suited to the requirements of data analy
sis. In general, the main concern of these systems is to ensure fast access to data in
the presence of multiple users, which necessitates transaction processing, concurrency
control, and recovery techniques. Typically, operational data bases store very detailed
data and are usually highly normalized. In addition, they rarely maintain historical
or archived data. For these reasons, the operational DBMS may perform poorly if a
11

large number of detail records need to be retrieved and summarized rapidly.
Data warehouses were developed to better respond to the growing demands of
decision makers who wished to analyze the behavior of an organization as a whole.
In practice, a data warehouse is a physically distinct corporate database management
system (DBMS) that is designed to facilitate rapid queries, as well as the analysis of
multidimensional data. The data warehouse is the central data repository for virtually
all OLAP systems.
A slightly more formal definition was provided by W. H. Inmon, who described
it as a "subject-oriented, integrated time-variant, and non-volatile collection of data
in support of management's decision-making process." [18]. In short, Inmon's criteria
can be explained as follows:
• Subject oriented means that data in the database is organized so that all data
elements related to the same real-world entity or concept are fully integrated. In
other words, instead of seeing data as a collection of very detailed sales records,
the data warehouse deals with broader entities such as Customer, Products,
and Dates.
• Integrated implies that the data from multiple operational systems is captured,
cleaned, and combined into a single repository.
• Time variant indicates that changes in the database are tracked and recorded
so that reports can be produced showing theses changes over time.
• Non volatile suggests that data in the database is rarely modified or removed
by end users.
12

2.2.2 Data Warehouse Architecture
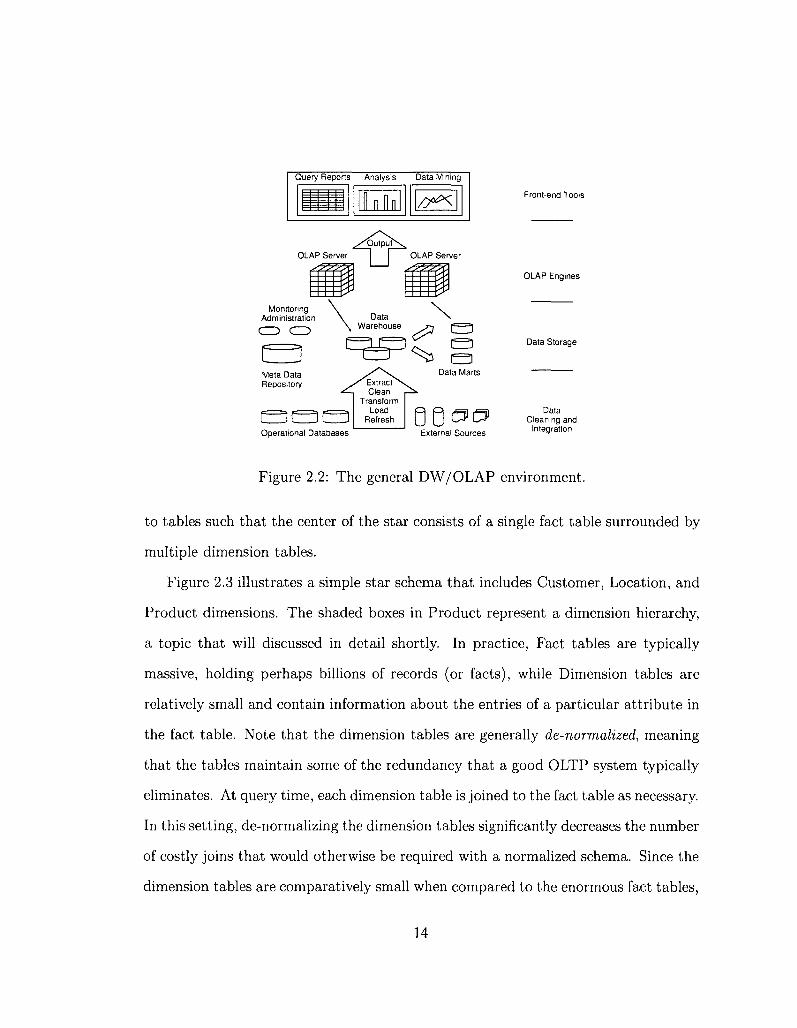
Data warehouses can be seen as a three-tier architecture [9, 16]. The canonical data
warehouse architecture is shown in Figure 2.2. The possible data sources are shown
at the bottom of the figure. Information is extracted from various legacy systems
and operational sources, and is then consolidated, summarized, and loaded into the
data warehouse using a process commonly known as ETL (Extract, Transform, and
Load). Strictly speaking, this first step is outside the scope of the warehouse proper
(i.e., it is not one the three tiers). At the first tier, we find the DW server, along with
several data maris. Essentially, each data mart is a small warehouse designed for a
specific department. At this stage, the data warehouse is fully loaded and contains
the data required for basic "decision support". The second tier houses the OLAP
server/engine that allows users to access and analyze data in the warehouse, typically
using more advanced techniques. Finally, the third tier includes the front end tools
that provide a graphical interface for top managers and decision makers.
2.2.3 The Star Schema
The Star Schema, proposed by Kimball [21], is perhaps the simplest and most in
tuitive logical model for data warehouse design. Because it can be mapped directly
to tables, it is ideally suited to the relational database management systems that
support virtually every modern data warehouse. The term "Star Schema" is derived
from the fact that a graphical depiction of the schema resembles a star. Star Schemas
consist of two basic table type: dimension tables and fact tables. In short, a dimen
sion is a DW "subject", such as Customer or Product, while a fact represents a key
DW process such as Sales. In the schema, logical dimensions and facts are mapped
13
•'Outputs
OLAP Server ~1 P OLAP Server
/ssss'
•<
s Monitoring
Administration
CD CD
Meta Data Repository
Data Warehouse
^^C s
Operational Databases
Front-end Tools
OLAP Engines
External Sources
Data Storage
Data Cleaning and
Integration
Figure 2.2: The general DW/OLAP environment.
to tables such that the center of the star consists of a single fact table surrounded by
multiple dimension tables.
Figure 2.3 illustrates a simple star schema that includes Customer, Location, and
Product dimensions. The shaded boxes in Product represent a dimension hierarchy,
a topic that will discussed in detail shortly. In practice, Fact tables are typically
massive, holding perhaps billions of records (or facts), while Dimension tables are
relatively small and contain information about the entries of a particular attribute in
the fact table. Note that the dimension tables are generally de-normalized, meaning
that the tables maintain some of the redundancy that a good OLTP system typically
eliminates. At query time, each dimension table is joined to the fact table as necessary.
In this setting, de-normalizing the dimension tables significantly decreases the number
of costly joins that would otherwise be required with a normalized schema. Since the
dimension tables are comparatively small when compared to the enormous fact tables,
14

Customer
customer_key
name
age
address ...more
Location
locationkey
store
city
state country ...more
^
Fact Table
location_key
product_key
customer_key
measure value
«"
Product
product_key
product_name
category
category_desc
type
type_desc ...more
Figure 2.3: A small three dimensional Star Schema
the redundancy produced by the de-normalization is of little interest in most OLAP
contexts.
2.3 Online Analytical Processing
The term OLAP was used first in 1992, when E. F. Codd — who produced the
relational data model in 1970 — delivered a report entitled "Providing OLAP (on
line analytical processing) to user-analysts: An IT mandate" [11]. In this paper,
Codd indicated twelve features that should be present in any OLAP application. The
following four points, taken from that report, are probably the most significant of the
12:
1. Multidimensional conceptual view. In contrast to relational database that
manipulate individual records or concepts, the focal point in OLAP is the rela
tionship between multiple dimensions.
15

2. Transparency. The end user should not have to worry about the details of
data access or conversions. In addition, OLAP systems should be part of open
systems that support heterogeneous data sources. Ultimately, the system should
present a single logical schema of the data.
3. Flexible reporting. Reporting must present data in a fully integrated manner,
and minimize any restrictions in the way that basic data elements of dimensions
are combined.
4. Unlimited dimensional and aggregation levels. A serious tool should
support more than just a few concurrent dimensions (Codd actually indicated
that 15-20 would be ideal)
We note that, despite Codd's influence in the database community, the impact
of the paper was less dramatic that it might otherwise have been due to Codd's
direct sponsorship by a commercial OLAP vendor (whose product, not coincidentally,
supported most of these features). Nevertheless, the four features listed above do serve
as a general blueprint for the kinds of OLAP applications that we commonly see in
the market.
2.3.1 Core OLAP operations
Although commercial OLAP systems may provide numerous functions for analysis
and reporting, there is a core set that is central to the OLAP paradigm. More so than
the formal definitions, such as the one given by Codd, they provide an intuitive sense
of the motivation behind multi-dimensional analysis. In the following list we briefly
describe these core functions, with reference to a series of accompanying diagrams.
Ultimately, each represents a new perspective on the "original" view of the small
16
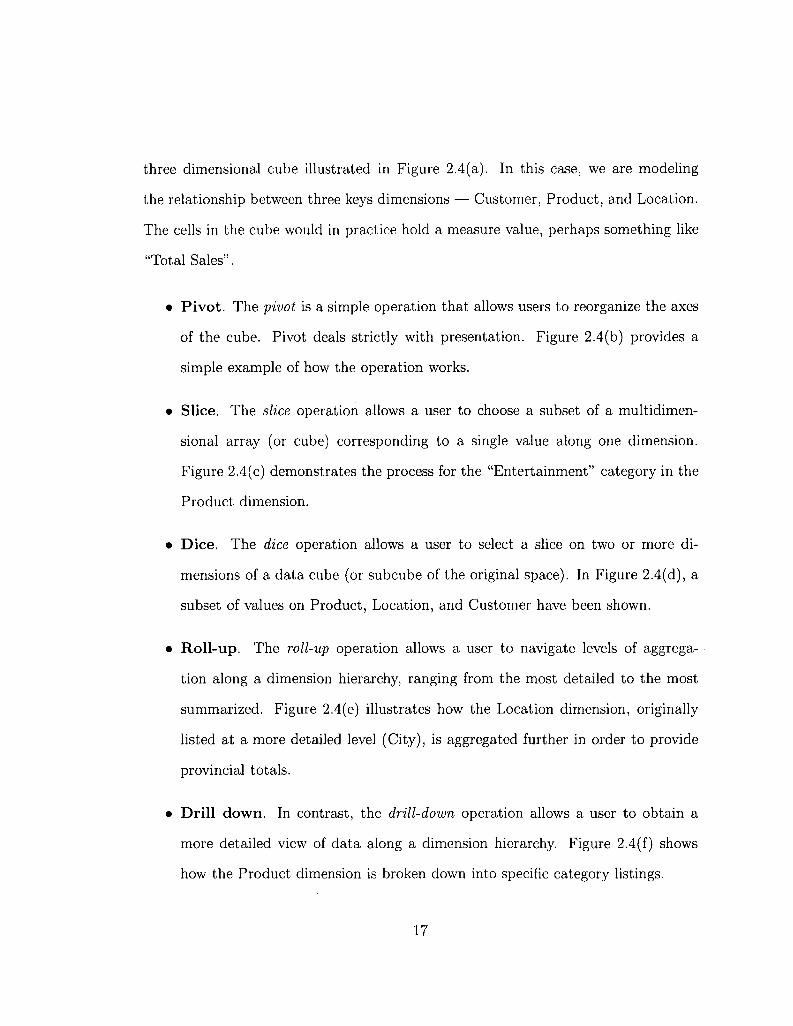
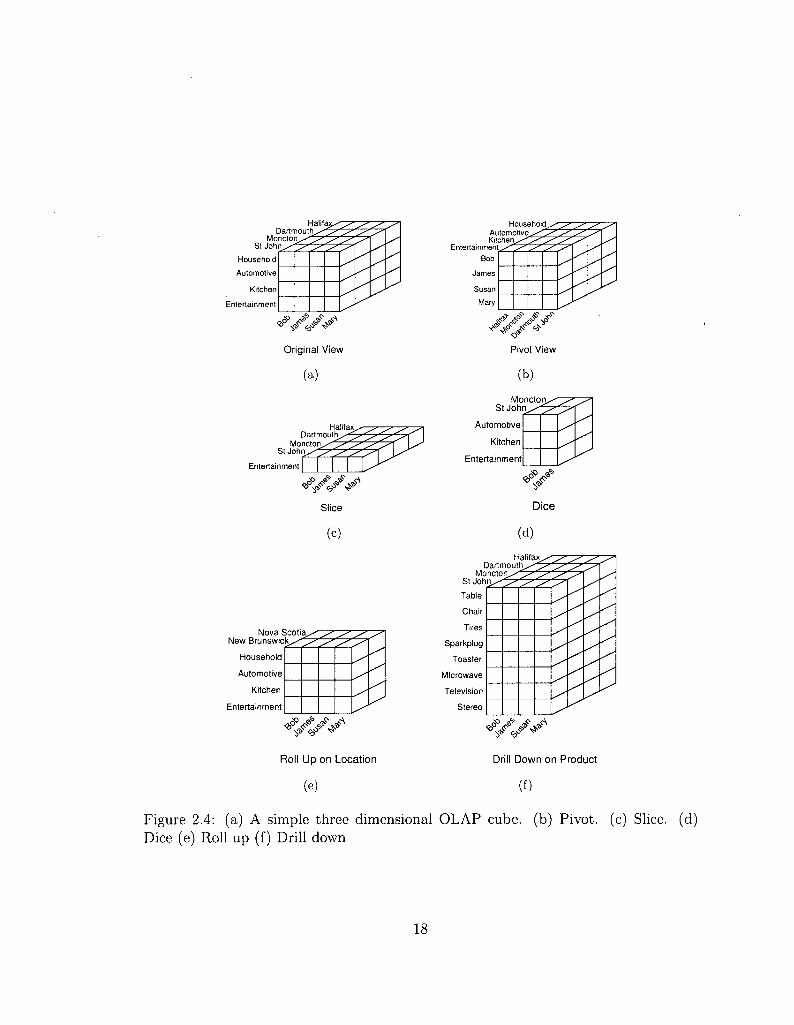
three dimensional cube illustrated in Figure 2.4(a). In this case, we are modeling
the relationship between three keys dimensions — Customer, Product, and Location.
The cells in the cube would in practice hold a measure value, perhaps something like
"Total Sales".
• Pivot. The pivot is a simple operation that allows users to reorganize the axes
of the cube. Pivot deals strictly with presentation. Figure 2.4(b) provides a
simple example of how the operation works.
• Slice. The slice operation allows a user to choose a subset of a multidimen
sional array (or cube) corresponding to a single value along one dimension.
Figure 2.4(c) demonstrates the process for the "Entertainment" category in the
Product dimension.
• Dice. The dice operation allows a user to select a slice on two or more di
mensions of a data cube (or subcube of the original space). In Figure 2.4(d), a
subset of values on Product, Location, and Customer have been shown.
• Roll-up. The roll-up operation allows a user to navigate levels of aggrega
tion along a dimension hierarchy, ranging from the most detailed to the most
summarized. Figure 2.4(e) illustrates how the Location dimension, originally
listed at a more detailed level (City), is aggregated further in order to provide
provincial totals.
• Drill down. In contrast, the drill-down operation allows a user to obtain a
more detailed view of data along a dimension hierarchy. Figure 2.4(f) shows
how the Product dimension is broken down into specific category listings.
17
St John
Household
Automotive
Kitchen
Entertainment
Household Automotive
^ «vw Original View
(a)
Halifax Dartmouth
Entertainment
Nova ! ^ ^ New B r u n s w i c k ^ - l ^ l ^ l ^ "
Household
Automotive
Kitchen
Entertainment
Roll Up on Location
(e)
Entertainment
Bob
Pivot View
(b)
Moncton St John
Automotive
Kitchen
Entertainment
Dice
(d)
Hal Dartmouth
M o n c t o r i ^ ^ 5 ' St John ^ ^ - ^ *
•$ <9
Drill Down on Product
(0
Figure 2.4: (a) A simple three dimensional OLAP cube, (b) Pivot, (c) Slice, (d) Dice (e) Roll up (f) Drill down
18
2.4 The Multidimensional model
Both data warehouses and OLAP systems are based on a multidimensional (MD)
model. Specifically, we logically represent data in a d-dimensional space such as the
one depicted in Figure 2.5. In this context, the MD model can be described as a data
abstraction allowing one to view aggregated data from a number of perspectives (i.e.,
dimensions). In fact, for a d-dimensional space, there are exactly 2d distinct dimen
sion combinations that represent the underlying Star Schema, each from a unique
perspective. In OLAP terminology, we refer to this as the data cube.
As previously noted, low level information is divided into facts and dimensions. An
individual fact represents an item or transaction of interest to the user. In the multi
dimensional data cube model, facts are aggregated into measures that are contained
within cells of the data cube. In Figure 2.5, one can see the measure values on the
front face of the cube. Simply put, a given measure represents a series of fact values
that have been aggregated for a given combination of dimensions. In the figure, for
example, if we assume that the measure represents Sales, then we can see that total
sales in December for Product Skl l in Toronto was 20 dollars.
We note that the MD model is logical in nature. In other words, it makes no
assumptions about how the data is physically stored. Advanced OLAP servers may
in fact take the data from the tables of the original Star Schema and further process
it. The new data may be stored in a series of new tables or even a multi-dimensional
array that represents a one-to-one mapping between the logicaLdata cube and the
physical storage. We refer to the first type of system as ROLAP (relational OLAP),
while the second is known as MOLAP (multi-dimensional OLAP). That being said,
the physical storage format is distinct from the conceptual design model, which is the
19
Location (city)
Ottawa
Montreal
Toronto
Dec
Time (month) Jan
Feb
20
14
21
35
20
40
31
12
24
Sk11 FH12 AM54
Product (number)
Measure Value
Figure 2.5: A basic three dimensional cube. Each cell holds a measure value,
primary focus of this thesis.
2.4.1 Hierarchies
Data granularity is the level of detail at which measures are presented. This is de
termined by a combination of the granularities of each dimension of the cube. For
example, in Figure 2.5 the granularity of the Time dimension is Month, while the
Location is represented as a City. However, the vast majority of common business
and scientific dimensions actually have a hierarchal structure. For example, one of
ten thinks of the common Time hierarchy in terms of hours, days, weeks, months,
quarters, and years. In OLAP environments, the traversal of such "aggregation hier
archies" is perhaps the most fundamental of all query forms. As it turns out, there
are in fact many different types of hierarchies in real-world applications.
Formally, a hierarchy is described as a set of binary relationships between the
various levels of a dimension. A path defines a unique traversal through a hierarchy
20

from the root level, the coarsest level of the hierarchy, to the leaf level, the finest
level of aggregation detail. Within a given path, the nodes directly associated on two
consecutive levels of the hierarchy are defined as the parent and child. The values at
a given level of the hierarchy are known as members. Finally, we often refer to the
analysis criterion of the hierarchy. This essentially refers to the conceptual purpose
or focus of the hierarchy. For example, the hierarchy might represent sub-divisions
of a dimension based upon geographical regions or organizational structure. Most
hierarchies have a single analysis criterion but as we shall see, it is possible to have
more than one.
In the following sections, the hierarchy forms commonly found in the real world
are briefly classified. This classification scheme is largely drawn from the framework
first defined by Malinowski et al. [44, 45].
2.4.2 Simple Hierarchies
A simple hierarchy is one that can be represented as a tree. Recall that a tree is
a directed, acyclic graph. We call the trees simple because, for a given leaf node,
hierarchies of this form can have only one "aggregation path" back to the root. In
other words, each specific level has an unambiguous meaning in terms of the type
of aggregation performed. All simple hierarchies have a single aggregation criterion.
Simple hierarchies can in fact be further sub-divided into the following three basic
categories:
1. Symmetric hierarchies.
2. Asymmetric hierarchies.
3. Generalized hierarchies.
21

Country Canada
Ontario Quebec
Toronto Ottawa Montreal
Store 1 Store 2
+ Store 3 Store 4
Gaspe
Store 5 Store 6
Figure 2.6: A four level symmetric hierarchy.
Symmetric Hierarchies
Simple, symmetric hierarchies contain levels and branches having a consistent depth.
Symmetric hierarchies are also known as homogeneous, balanced, or level-based. In
this kind of hierarchy, any path from the root to a leaf has exactly the same number of
nodes. All nodes in the hierarchy tree are mandatory. All parent members must have
at least one child member and a child member cannot belong to more than one parent
member. Figure 2.6 provides an example of a symmetric geographic hierarchy. On
the left of the diagram we see the schema that defines the four levels. By convention
we number the levels from the top downwards, staring from zero. So the coarsest
aggregations are Level 0 (Country), while the most detailed values are at Level 3
(Stores). The meaning and depth of each level must be consistently applied because
each level represents the same type of information. In the current case, the schema
can be represented as:
Country =>• Province => City => Store
On the right of the diagram is the instance of the hierarchy corresponding to the
22
schema. We can clearly see that any path has four steps from root to leaves. Again,
at any level, all members have the same logical meaning. For example, at Level 3,
all values refer exclusively to cities. In the diagram, we have shaded four nodes to
illustrate a simple path form Canada —> Ontario —> Ottawa —> Store3.
Asymmetric Hierarchies
A simple, asymmetric hierarchy is one in which lower levels of specific paths are not
mandatory. However, intermediate levels in the tree are not optional. As with simple
symmetric hierarchies, every child must still belong to at most one parent member.
Several terms are used for these hierarchies: heterogeneous, unbalanced, or non-onto.
Simple, asymmetric hierarchies are quite common in practice as category groupings
can often be quite irregular within organizations. Figure 2.7 illustrates a hierarchy
where a bank is composed of a number of branches. Some of these have agencies with
ATMs, while some only have agencies (without a corresponding ATM). The schema
in this case provides alternate paths through the hierarchy. They can de defined as:
Bank => Branch =» Agency => ATM
Bank =>• Branch => Agency
We have highlighted the hierarchy instance to illustrate two such pathways. At
Level 0, we see the partially shaded root node, which is shared by both pathways.
The lightly shaded path, RBC —> Maisonneuve —> Agency 6 —> ATM 11, represents
the full 4-node path. Conversely, the darker pathway, RBC —> Guy —> Agency 9,
indicates a path with an optional ATM.
23
Bank RBC
Branch Maisonneuve Sherbrooke
Agency
JE Agency 1
1 Agency 6
ATM
Agency 5
ATM 11
Agency 4
<3uy • ; ,
+ Agency 9
1 Agency 2
ATM 33 ATM 55
Figure 2.7: A four level asymmetric hierarchy.
Generalized Hierarchies
The simple generalized hierarchy is the most complex of the forms in this group be
cause it can contain multiple exclusive paths that share levels. The term "exclusive"
implies that, given a specific leaf node, the path back to the root is uniquely defined.
Note that all paths still represent one hierarchy and thus each level is labeled un
ambiguously. However, different branches of the hierarchy tree may be interpreted
differently at the same level. Figure 2.8 shows a generalized hierarchy tree that con
sists of the following schema:
Area => Branch =>• Category =$• Type => Customer
In this case, the lightly shaded path, Canada —> Montreal —> Investor —> Manager
—> Smith, might refer to customers who are people, while the second path, Canada —>
Ottawa —> Company —> Concrete —> KLH, might refer to corporate customers. Still,
it is important to understand that paths from the leaves back to the root are unique
in terms of the underlying schema. Moreover, we still have a single analysis criterion
24

Area
Branch
Category
Type
Customer
T
+ Manager
| r
Smith
I Montreal
i '
Investor
1 AN
< ' Doctor
< ' Moh
Canada 1
Ottawa
Engineering Concrete
MBC mm POG
Figure 2.8: A five level generalized hierarchy.
as both logical paths refer to a breakdown of the data by customer type (Company
or Individual).
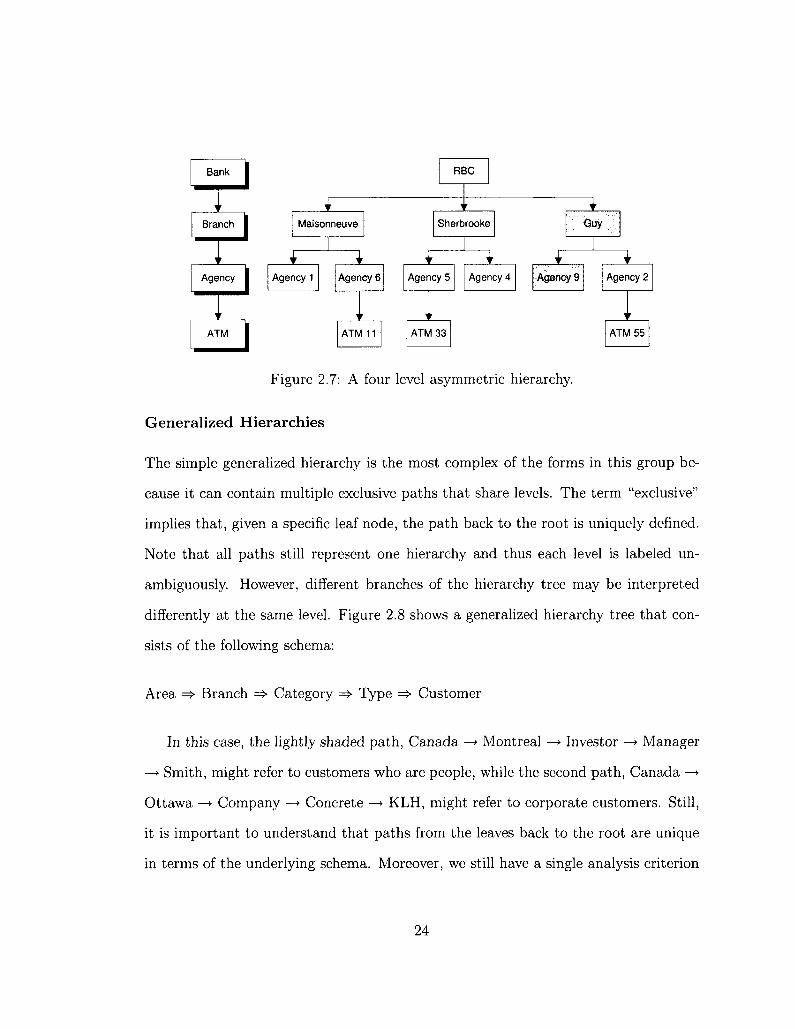
There is also a special form of the generalized hierarchy that is often seen in
practice. Known as the simple ragged or simple non-covering hierarchy, this form
of generalized hierarchy can contain optional intermediate nodes without including
additional levels. In this case, the branches have inconsistent depths because at least
one intermediate member in a branch level is unpopulated. However, the root and
the leaves are the same for all paths. In effect, the ragged hierarchy is like a cross
between an asymmetric (unbalanced) hierarchy and the regular generalized hierarchy.
Figure 2.9 represents a company with stores in different countries, with the hierarchy
indicating that some provinces have no sub-divisions into counties. Logically, this
results in two valid paths through the schema:
Country =>• Province =>• City =» Store
Country => Province => Store
25
Country
Province
City
Store
T
f Ontario
Toronto
v
Store 1
Canada
1 Ottawa
i r
Store 2
i r
Store 3
f
i Quebec
Montreal
1 Store 4
v
Store 5
v
Store 6
Figure 2.9: A four level ragged hierarchy.
In this case, the instance diagram presents the following two paths. Canada —>
Ontario —» Ottawa —> Store 2 represents the fully defined path. In contrast, the
darker nodes define the shorter path Canada —> Quebec —> Store 6, clearly indicating
that Store 6 is associated directly with the province, rather than a specific city.
Strict versus Non-Strict
A hierarchy is considered "strict" if one-to-many relationships exist between parent
and child nodes. If at least one many-to-many relationship exists between a parent
and a child in a hierarchy, then we refer to this type of hierarchy as "non-strict".
Again, non-strict hierarchies are very common in real life applications where, for
example, an employee could belong to more than one department. Note that it is
possible for the simple hierarchies discussed so far to be either strict or non-strict.
Figure 2.10 shows a non-strict hierarchy (simple, symmetric) with the following four
levels:
Area => Division ==> Department => Employee
26
Area USA
Division
Department
Employee
North
Sales r—i
John
Research Marketing
Smith
South
Accounting
Ali Sali
Purchasing
Sara/ Cindy
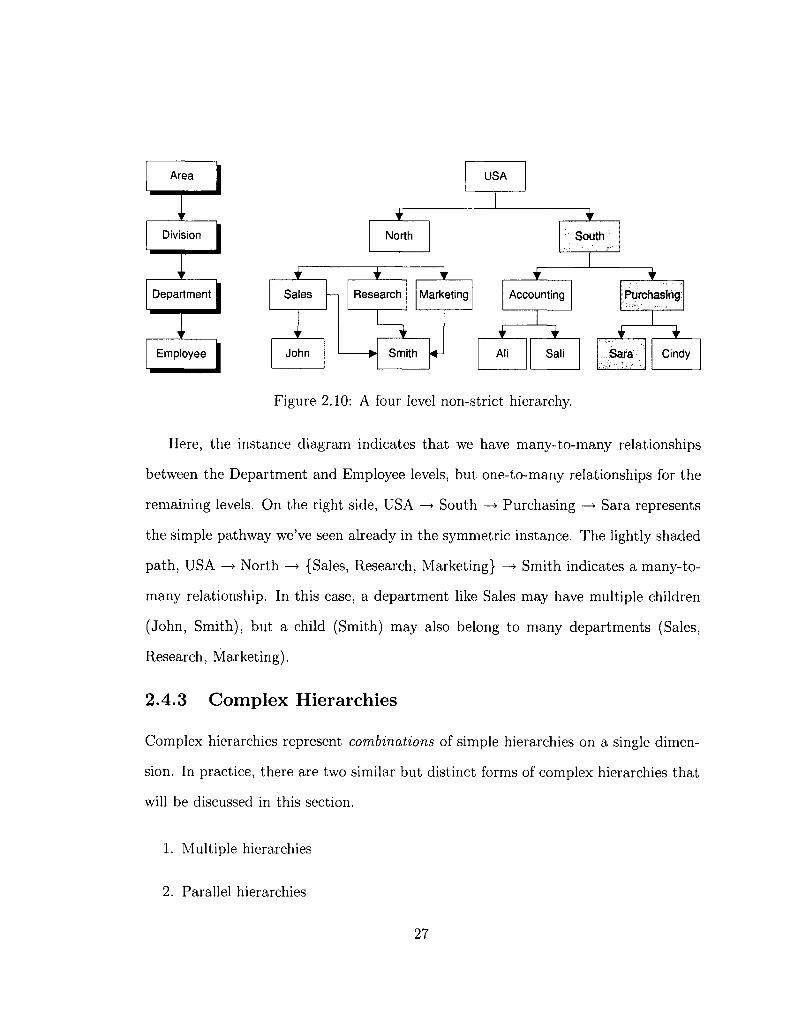
Figure 2.10: A four level non-strict hierarchy.
Here, the instance diagram indicates that we have many-to-many relationships
between the Department and Employee levels, but one-to-many relationships for the
remaining levels. On the right side, USA —> South —> Purchasing —> Sara represents
the simple pathway we've seen already in the symmetric instance. The lightly shaded
path, USA —> North —> {Sales, Research, Marketing} —> Smith indicates a many-to-
many relationship. In this C81S6, £1 department like Sales may have multiple children
(John, Smith), but a child (Smith) may also belong to many departments (Sales,
Research, Marketing).
2.4.3 Complex Hierarchies
Complex hierarchies represent combinations of simple hierarchies on a single dimen
sion. In practice, there are two similar but distinct forms of complex hierarchies that
will be discussed in this section.
1. Multiple hierarchies
2. Parallel hierarchies
27

Regional Commitee
Sport Association
Recreation Program
Sport Club
i '
Swimming i
Tennis
1
Committee
i Senior
l r\
< '
Children
Figure 2.11: A four level multiple inclusive hierarchy.
Multiple Hierarchies
In a multiple hierarchy, there are several simple hierarchies sharing one or more levels.
All such hierarchies share the root level, as well as a common analysis criterion.
However, a given child member within a multiple hierarchy can be associated with
multiple parent members that each belong to a distinct hierarchy.
Multiple hierarchies may be further specialized into inclusive or alternative. In a
multiple inclusive hierarchy, the measure represented by a fact must be distributed
between several hierarchies. An example will make this more clear. A simple mul
tiple inclusive hierarchy is shown in Figure 3.18. Here, Sport Clubs are associated
with Sport Associations and Recreation Programs. The schema would look like the
following:
Regional Committee =>• Sport Association =*> Sport Club
Regional Committee =>• Recreation Program => Sport Club
The instance diagram indicates how this might work in practice. If we assume
that the measure is Budget Expenses, then the figure tells us that part of the budget
for Club 1 comes from the Swimming Association — Committee A —> Swimming —>
28
Year ] 2009
Quarter I Week I Quarter 1 Quarter 2 Weekl
Month ] January
Day
February
Day1
May June
Day 31
Week 19
Day 133 Day 199 Day 254 Day 360
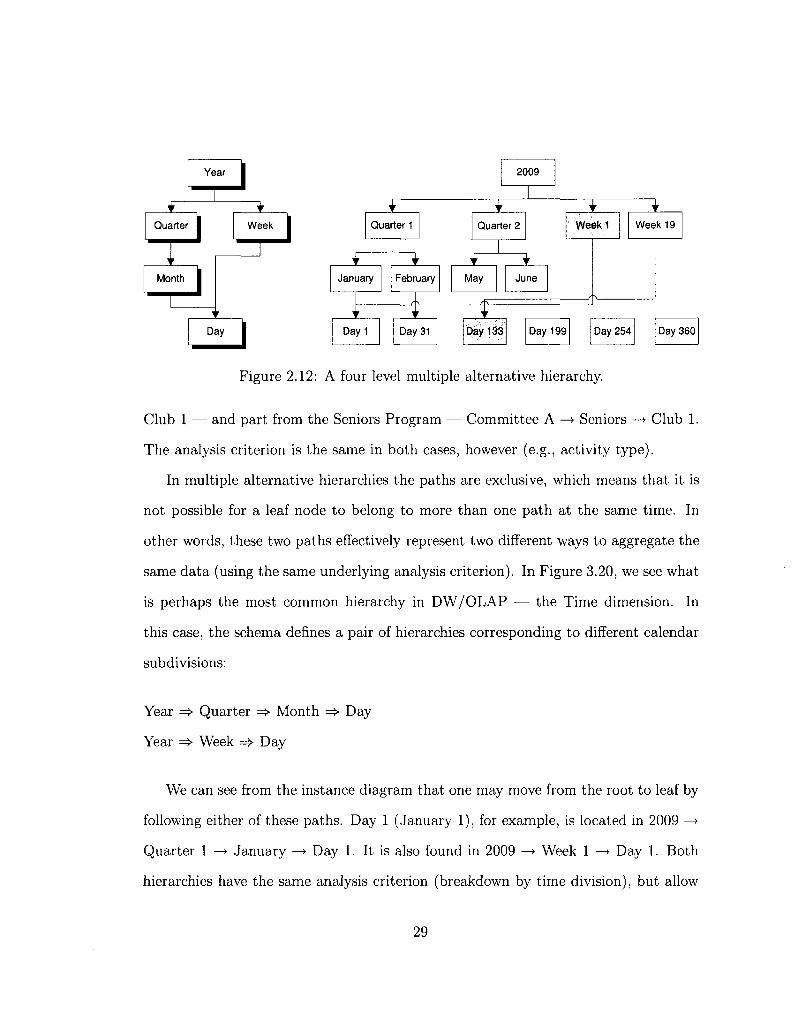
Figure 2.12: A four level multiple alternative hierarchy.
Club 1 — and part from the Seniors Program — Committee A —> Seniors —* Club 1.
The analysis criterion is the same in both cases, however (e.g., activity type).
In multiple alternative hierarchies the paths are exclusive, which means that it is
not possible for a leaf node to belong to more than one path at the same time. In
other words, these two paths effectively represent two different ways to aggregate the
same data (using the same underlying analysis criterion). In Figure 3.20, we see what
is perhaps the most common hierarchy in DW/OLAP — the Time dimension. In
this case, the schema defines a pair of hierarchies corresponding to different calendar
subdivisions:
Year => Quarter =>• Month => Day
Year => Week => Day
We can see from the instance diagram that one may move from the root to leaf by
following either of these paths. Day 1 (January 1), for example, is located in 2009 —>
Quarter 1 —• January —-> Day 1. It is also found in 2009 —> Week 1 —> Day 1. Both
hierarchies have the same analysis criterion (breakdown by time division), but allow
29

us to rollup or drill down on this data at differing granularities. The measure value
for Day 1, however, is never shared between the hierarchies, as was the case with the
inclusive hierarchy.
Parallel Hierarchies
A parallel hierarchy is a collection of simple hierarchies defined on the same dimen
sion but representing different analysis criteria. In practice, Parallel hierarchies can
be either independent or dependent. Parallel independent hierarchies do not share
levels. In other words, they represent non-overlapping sets of hierarchies. Figure 3.21
shows an example of a parallel independent hierarchy that is associated with multiple
analysis criteria. In the first case, measure values are aggregated into organizational
structure, while the second hierarchy breaks down data based upon geographical lo
cation. Note that the common leaf node implies that both hierarchies are using the
same underlying detail data (i.e., facts). The schema for this parallel hierarchy can
be described as follows:
Sales Region =>• Sales District =$• Store
Country => Province => City => Store
The instance diagram depicts the two independent analysis criteria. East —>
District 2 —> Store 19 represents an aggregation by organizational structure, while
Canada—> BC —> Victoria —> Store 42 would present an analysis simply by geographic
location.
A parallel dependent hierarchy is one in which component hierarchies share one or
more levels, even though distinct analysis criteria are employed. Figure 3.22 provides
an example. Here, the two analysis criteria are similar to the previous example
30

East Canada
^ District 2
v v
Store 19 Store 11
District 1
Store 21
QC BC
Montreal Victoria Vancouver
Store 23 Store 42 Store 45
Figure 2.13: A four level parallel independent hierarchy.
Country 1
L_ Region
^ " " i
Province 1
1 City J Section
V
Employee 1
J
1 < '
Gaspe
' ' John
Canada
' ' QC
' ' Montreal
1 ' Smith
,r; East'.'
T
Section 2
' ' Patric
T
Victoria
" Sali
West
1 BC
i r
Vancouver
i r
Sara
! ' Section 1
' ' Ali
Figure 2.14: A four level parallel dependent hierarchy.
(organizational structure and geographical location) but both hierarchies share Level
1 (Province). This gives rise to the two following schema elements:
Country => Province => City => Employee
Region =>• Province => Section => Employee
Here, the two shaded paths, Canada —» QC —> Gaspe —> John and East —> QC
—> Section 2 —> Patric, represent distinct aggregation pathways but share the QC
element.
31
2.5 Unified Modeling Language
In the following chapter, we will be discussing the application of UML and graphical
modeling tools to the design of sophisticated conceptual models for OLAP. We will
therefore use this section to present a very brief overview of UML concepts and related
technologies.
The Unified Modeling Language (UML) first appeared in the 1990s as an ef
fort to combine the best elements from various modeling systems proposed at that
time. UML was meant to be a unifying language enabling IT professionals to model
computer applications. The primary authors were Jim Rumbaugh, Ivar Jacobson,
and Grady Booch, who originally had their own competing methods (OMT, OOSE,
Booch). One reason UML has become a standard modeling language is because UML
is programming language independent. Moreover, the UML notation set is itself a
language and not simply a methodology. This aspect is important because a language,
as opposed to a methodology, can easily be integrated into any company's business
systems without necessitating extensive ideological of physical changes.
UML 2.0 defines thirteen types of diagrams that are partitioned into three broad
categories: structure diagrams, which include the Class diagram (our prime focus),
behaviour diagrams and interaction diagrams. In this introduction, we will attempt
to provide a general understanding of the Class diagram, including various graphical
elements that are available in MagicDraw, one of the leading UML design tools.
2.5.1 Class Diagram
The Class Diagram shows how different entities (e.g., people, things and data) are
related to one other. In short, it illustrates static structures within the environment,
32
0..* 1 ShoppingCart
-total +order() : void +cancel(): void
1
1 1
1..*
Purchase -quantity -price +add() : void
CreditCard
-issuer -cardNumber -expirtDate +aythorizeCharge() : void
0..* 1 Product
-name -description
Customer
-name -address
,
1
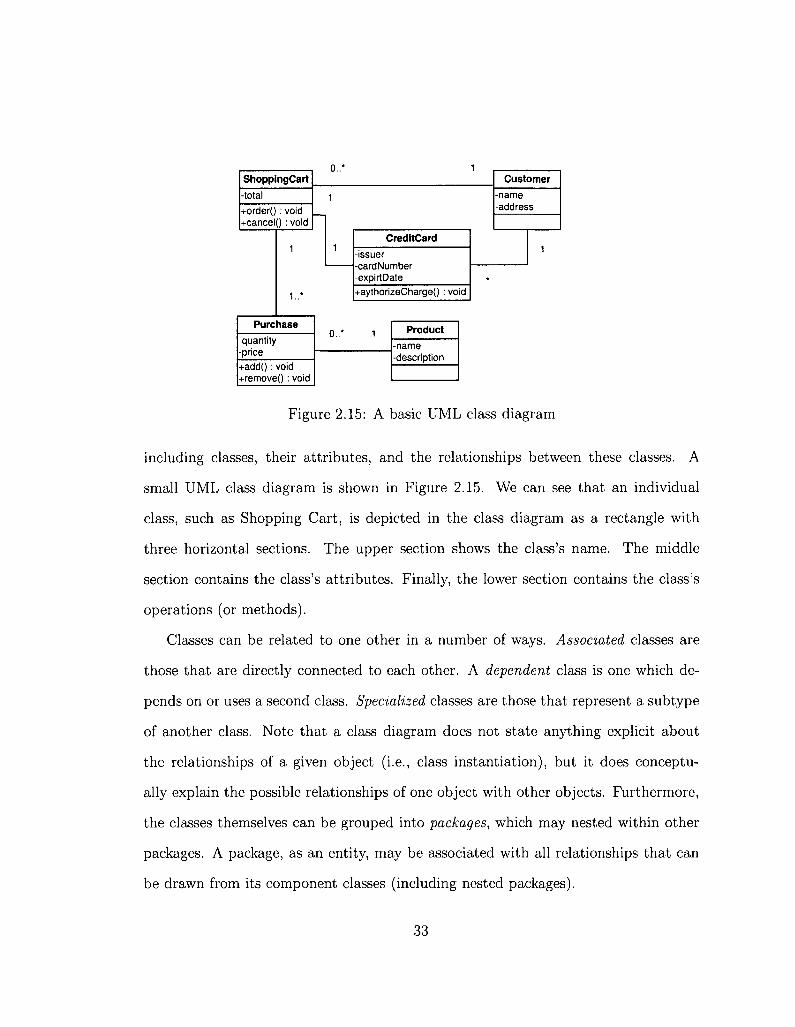
Figure 2.15: A basic UML class diagram
including classes, their attributes, and the relationships between these classes. A
small UML class diagram is shown in Figure 2.15. We can see that an individual
class, such as Shopping Cart, is depicted in the class diagram as a rectangle with
three horizontal sections. The upper section shows the class's name. The middle
section contains the class's attributes. Finally, the lower section contains the class's
operations (or methods).
Classes can be related to one other in a number of ways. Associated classes are
those that are directly connected to each other. A dependent class is one which de
pends on or uses a second class. Specialized classes are those that represent a subtype
of another class. Note that a class diagram does not state anything explicit about
the relationships of a given object (i.e., class instantiation), but it does conceptu
ally explain the possible relationships of one object with other objects. Furthermore,
the classes themselves can be grouped into packages, which may nested within other
packages. A package, as an entity, may be associated with all relationships that can
be drawn from its component classes (including nested packages).
33
•*" T * C j r Ivl
(a) (b) (c)
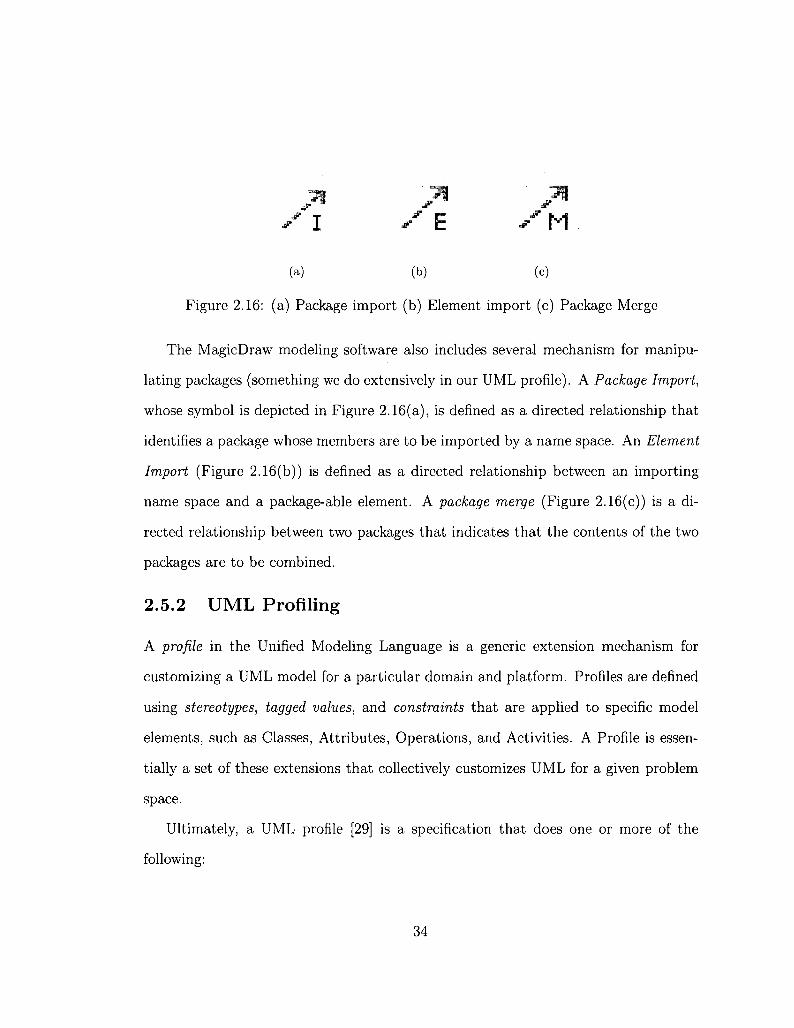
Figure 2.16: (a) Package import (b) Element import (c) Package Merge
The MagicDraw modeling software also includes several mechanism for manipu
lating packages (something we do extensively in our UML profile). A Package Import,
whose symbol is depicted in Figure 2.16(a), is defined as a directed relationship that
identifies a package whose members are to be imported by a name space. An Element
Import (Figure 2.16(b)) is defined as a directed relationship between an importing
name space and a package-able element. A package merge (Figure 2.16(c)) is a di
rected relationship between two packages that indicates that the contents of the two
packages are to be combined.
2.5.2 UML Profiling
A profile in the Unified Modeling Language is a generic extension mechanism for
customizing a UML model for a particular domain and platform. Profiles are defined
using stereotypes, tagged values, and constraints that are applied to specific model
elements, such as Classes, Attributes, Operations, and Activities. A Profile is essen
tially a set of these extensions that collectively customizes UML for a given problem
space.
Ultimately, a UML profile [29] is a specification that does one or more of the
following:
34

• Identifies a subset of the UML meta model.
• Specifies "well-formedness rules" beyond those specified by the identified subset
of the UML meta model. A "well-formedness rule" describes a set of constraints
written in UML's Object Constraint Language (OCL).
• Specifies "standard elements" beyond those specified by the identified subset of
the UML meta model. A "standard element" describes a standard instance of
a UML stereotype, tagged value, or constraint.
• Specifies semantics expressed in natural language.
• Specifies common model elements, expressed in terms of the profile.
2.5.3 Extensibility mechanisms
There are three common extensibility mechanisms, allowing one to customize or ex
tend the UML by adding new building blocks, creating new properties and specifying
new semantics. We refer to these extensions as stereotypes, tagged values, and con
straints.
Stereotypes allow one to extend the vocabulary of the UML to create new model
elements derived from existing elements, but that have specific properties that are
suitable for a problem domain. These elements are used for classifying or marking
the UML building blocks in order to introduce new building blocks that speak the
language of a domain and that look like primitive or basic model elements. For
example, when modeling a network, one might need to have symbols for representing
a hub and a router. Stereotypes also allow introducing new graphical symbols for
providing visual cues to the models that speak the vocabulary of a specific domain.
35

Graphically, a stereotype is rendered as a name enclosed by guillemots (<S») and
placed above the name of another element. Alternatively, the stereotyped element
can be rendered by using a new icon associated with that stereotype.
Tagged values are properties for specifying keyword value pairs of model elements,
where the keywords are attributes, allowing one to extend the properties of a UML
building block to create new information in the specification of that element. Tagged
values can be defined for existing model elements, or individual stereotypes, so that
everything with that stereotype has that tagged value. One should note that a tagged
value is not equal to a class attribute. Instead, a tagged value is regarded as being
a meta data, since its value applies to the element itself and not to its instances.
Graphically, a tagged value is rendered as a string enclosed by brackets ( ) placed
below the name of another model element. The string consists of a name (the tag),
a separator (the symbol =) , and a value (of the tag).
Constraints are properties for specifying semantics and/or conditions that must
be held true at all the times for the elements of a model. They allow one to extend the
semantics of UML building blocks by adding new rules, or by modifying existing rules.
For example, when modeling time systems, one may want to add information to the
model such as time deadlines. By making use of constrains, this timing requirement
can easily be captured. Graphically, a constraint is rendered as a string enclosed
by brackets ( ) placed near the associated element, or connected to the element by
dependency relationships.
2.5.4 The Object Constraint Language
With object-oriented modeling, a graphical model — like a class abstraction — is
not enough for a precise and unambiguous specification. As such, there is a need to
36
describe additional constraints about the objects in the model. While such constraints
are often described in natural language, experience has shown that this will always
result in ambiguities. In order to write unambiguous constraints, so called "formal
languages" have been developed. The disadvantage of traditional formal languages is
that they are only accessible to people with a fairly serious mathematical background.
The Object Constraint Language (OCL) has been developed in an attempt to address
this limitation.
OCL is a language that enables one to describe expressions and constraints on
object-oriented models. An expression is an indication or specification of a value and
can be used for the following purposes:
• To specify the initial value of an attribute or association end.
• To specify the derivation rule of an attribute or association end.
• To specify the body of an operation.
• To indicate an instance in a dynamic diagram.
• To indicate a condition in a dynamic diagram.
• To indicate an actual parameter value in a dynamic diagram.
• To indicate the type of constraint.
A constraint, on the other hand, is a restriction on one or more values of an
object-oriented model or system. In practice, a constraint can take the following
forms:
37

• An invariant is a constraint that states a condition that must always be met
by all instances of the class, type, or interface. An invariant is described using
an expression that evaluates to true if the invariant is met. Invariants must be
true all the time.
• A precondition to an operation is a restriction that must be true at the moment
that the operation is going to be executed.
• A postcondition to an operation is a restriction that must be true at the moment
that the operation has just ended its execution.
• A guard is a constraint that must be true before a state transition fires.
The context definition of an OCL expression specifies the model entity for which
the OCL expression is defined. Usually this is a class, interface, data type, or com
ponent. In terms of the UML standard, this is called a Classifier. The classifier is
always a specific element of the model and is usually defined in a UML diagram. This
element is called the "context of the expression". In addition, we must also be aware
of the contextual type of an expression. The contextual type defines the context,
or its container. It is important because OCL expressions are evaluated for a single
object which is always an instance of the contextual type. To distinguish between the
context and the instance for which the expression is evaluated, the latter is called the
contextual instance. Sometimes it is necessary to refer explicitly to the contextual
instance. The keyword self is used for this purpose.
38
2.6 Related work
Recently, several multi-dimensional data models have been proposed. A detailed
description of the previous proposals can be found in [2, 6]. In this section, we briefly
review several of the data models that we believe to be the most relevant to the work
discussed in this thesis.
Approaches that directly extend the classical ER model include the Multidimen
sional ER (M/ER) model by Sapia et al. [35, 35], the starER model by Tryforia et
al. [41], and the MultiDim model by Malinowski et al. [24]. A number of propos
als also provide some form of graphical notations. Models of this type include the
Dimensional-Fact (DF) model by Golfarelli et al. [15, 14], the model proposed by
Husemann et al. [17], and the Multidimensional Aggregation Cube (MAC) by Tsois
et al. [42]. We note, however, that their "proprietary" notations and/or non-OOP
models give them limited applicability in the OLAP context.
In fact, despite the fact that the dominant trend in data modeling is the 0 0
paradigm, only a few proposals using 0 0 multi-dimensional modeling exist. Included
in this group would be the Common Warehouse Metamodel (CWM) by the Object
Management Group (OMG) [26], the ADAPTed UML model proposed by Priebe
et al. [32], the Object-Oriented meta cube proposed by Nguyen et al. [5, 4], the
Yet Another Multidimensional Model (YAM2) by Abello et al. [3], and the Object
Oriented Multidimensional Model (OOMD) by Trujillo et al. [40]. Some of these use
UML as a language to express a meta schema [5, 4, 32], while others also extend the
UML vocabulary [22, 3, 26]. A summary of these approaches is given below.
The Object Management Group (OMG) [26] propose The Common Warehouse
Meta model (CWM) that is meant to standardize data warehousing and business
39

intelligence applications based on UML. Their Multidimensional Package serves as
a meta model for MOLAP tools. (In fact, some MOLAP tool-specific meta models,
such as Oracle MOLAP, are defined as extensions of this meta model.) In turn,
the OLAP Package describes the OLAP meta model, independent of any ROLAP or
MOLAP implementation. The OLAP package includes the concepts of a dimension
and a hierarchy and it is possible, in theory, to represent several different types of
hierarchies. Having said this, the CWM is extremely complex and would be difficult
to employ in its native form.
Priebe et al. [32] create a UML based notation named ADAPTed UML which
uses ADAPT symbols as stereotypes [8]. Elements introduced include cube, mea
sure, dimension level and dimension attribute. To connect cube and measures, UML
dependencies are drawn as associations with a defined navigability. The dimension
hierarchies are represented by aggregation elements. However, their approach only
supports symmetric hierarchies.
Binh et al. [5, 4] introduces a conceptual multidimensional data model and ap
plies a number of mathematical principles (e.g., partial order, partially ordered set,
minimal element) that dictate the form of hierarchical relationships. Data in the mul
tidimensional model is organized in the form of meta cubes. Their approach supports
symmetric and multiple hierarchies.
Abello et al. [3] propose a conceptual multidimensional model called YAM2 that
extends UML. They make use of the part-whole and specialization-generalization re
lationships to represent symmetric, multiple alternative and non-strict hierarchies.
YAM2 does not support asymmetric hierarchies because every object in an aggre
gation level must have the same structure. In addition, ragged hierarchies are not
40
directly supported in this model, though the authors suggest that they can be repre
sented in the schema by a part-whole relationship. YAM2 is one of the few approaches
that provides grouping (i.e., package-based) mechanisms to the model so as to avoid a
"flat", single layer design. Specifically, they divide the multi-dimensional model into
three levels: fact and dimensions, classification hierarchies, and the whole model.
However, they do not employ any packaging mechanism to reduce the complexity of
the hierarchies themselves.
TVujillo et al. [40] produce a conceptual model for data warehouse and OLAP
applications that does in fact utilize an Object-Oriented paradigm to model multi
dimensional elements like dimension classes and fact classes. In addition, they pro
pose a cube class as the basic structure so as to allow subsequent analysis of the data
stored in the system. A UML-based representation of this model is also described in
[22]. While this work represents, to our knowledge, the most sophisticated and most
accurate of the existing data warehousing models, it nonetheless treats the crucial
dimension hierarchies in a very generic way. Specifically, it considers hierarchies as
instances of directed acyclic graphs and allows designers to model real world hierar
chies in a very flexible way. That being said, such an abstract representation provides
relatively little support for the user as the final design is primarily ad hoc. Perhaps
this is acceptable in the context of that paper as the final target is expected to be
an SQL database, which does not have the ability to physically represent many of
the hierarchies discussed in this chapter. In our own research, this is not the case.
In particular, we expect the models developed with the proposed framework to even
tually populate the Sidera OLAP DBMS being developed by other members of this
research group. Sidera does, in fact, support complex hierarchies at a physical level
41

and, consequently, we must have the ability to intuitively identify the structure of
such aggregation models.
Still, the work defined in [40, 22] represents an important starting point for our
modeling research. Table ?? summarizes the stereotype definitions from these earlier
papers. We note that even when utilizing this small set of core stereotypes, we were
forced to re-write the associated OCL expressions due to differences in the UML 2.0
spec and the original 1.5 version.
2.7 Conclusions
Over the past couple of decades, data warehousing has emerged as a fundamental
component of contemporary enterprize-level decision support systems. In the major
ity of cases, sophisticated OLAP applications are layered on top of the data warehouse
so as to provide improved access and performance. Central to the OLAP paradigm
is the notion of the multi-dimensional data model, a logical representation of data
that highlights the relationships between key organizational subjects. In practice,
these subjects are subdivided into sometimes complex dimension hierarchies that, in
turn, allow users to aggregate and analyze detailed corporate data at different levels
of granularity.
This chapter presented an overview of the general area of decision support systems
and its primary components — Information systems, OLAP, and data mining — as
well as the underlying data warehouse architecture. Fundamental OLAP operations
were introduced and illustrated, along with explanations as to how these operations
are performed in order to provide meaningful measures of summarized multidimen
sional data. The concept of attribute hierarchies was then presented and the various
42

Name
Schema Package
Fact Package
Dimension Package Fact
Dimension
OID
Descriptor
Level Attribute
Measure
Rollup
Degenerate Fact
Base Class
Package
Package
Package
Class
Class
Attribute
Attribute
Attribute
Attribute
Association
Association Class
Description
Packages of this stereotype represent multi-dimensional Star Schemas Packages of this stereotype represent multi-dimensional facts Packages of this stereotype represent multi-dimensional dimensions Classes of this stereotype represent facts in multi-dimensional model Classes of this stereotype represent dimensions in multi-dimensional model Attributes of this stereotype represent OID attributes of levels in a multidimensional model Attributes of this stereotype represent attributes of levels in a multidimensional model Attributes of this stereotype represent descriptor attributes of levels in a multi-dimensional model Attributes of this stereotype represent attributes of a fact in a multidimensional model Associations of this stereotype represent associations between level Association classes of this stereotype represent association classes in multidimensional model
Table 2.1: Summary of standard data warehousing stereotypes
43

forms of hierarchies typically encountered in practical environments were defined. In
addition, a simple introduction for both UML and OCL has been included. In the
remainder of this thesis, we will build upon the concepts introduced in this chapter.
44

Chapter 3
Multi-dimensional Modeling
3.1 Introduction
Organizations today are facing complex challenges in terms of management and eco
nomic planning. As a result, IT departments have become increasingly reliant upon
software applications and systems that more thoroughly support their decision mak
ing objectives. DSS systems provide this functionality by collecting and integrating
vast amounts of distributed data and information and converting it into a form that
can be easily and intuitively analyzed [12].
Starting in the early 1990s, data warehouses began to emerge as the cornerstone
of DSS environments [25]. Soon after, more advance analytical tools, in the form of
OLAP servers and applications, were developed in order to allow users to query and
automatically aggregate data in the data warehouse. In part, OLAP tools provide a
logical interface to analytical data that is simply not present in the data warehouses
themselves. One element of this new interface is the support for complex dimension
hierarchies. That being said, most existing commercial applications only permit the
definition of simple hierarchies in which relationships between instances can be repre
sented as a balanced tree. For example, a single Day-Month-Year hierarchy is simple
45

in that every day is related to a month, which in turn is related to a year. However,
as discussed in the previous chapter, many of the hierarchies found in real-world sit
uations correspond to unbalanced trees or to more general graphs [24], and simply
cannot be modeled using the techniques available for balanced trees.
Given the above considerations, our focus in this thesis is upon expanding the
capabilities of conceptual design models for OLAP. In general, conceptual model
ing greatly facilitates communication between users and designers since conceptual
models do not require detailed knowledge about specific features of the underlying
implementation platform. Instead, the focus is placed squarely on user requirements.
Moreover, schemas defined using conceptual models can be mapped to various logical
models, such as relational, object-relational or object-oriented.
This chapter presents our conceptual multidimensional model that allows one to
represent data requirements for data warehousing and OLAP applications. Section
3.2 discusses the motivation for this work and adds justification for our use of UML
and OCL. Section 3.3 provides a general definition of the main properties and aspects
of multi-dimensional and OLAP hierarchy modeling. It describes how to utilize UML
to represent the major properties of OLAP at the conceptual level and provides
general design guidelines for designing a DW/OLAP system. In addition, a meta
model of our work is presented. The specification of a UML "Hierarchy" profile that
makes use of OCL to improve precision is then discussed in Section 3.4. In addition,
advanced aspects of modeling such as the use of degenerate dimensions and role-
playing dimensions are presented. Section 3.5 concludes the chapter with a concise
summary.
46
3.2 Motivation
Before presenting the details of our new model, we begin with a brief explanation
of our motivation for this area of research. We also explain why the UML profile
approach is well suited to this problem domain. In a related vein, we discuss the
significance of using OCL as a constraint language.
3.2.1 Why OLAP Conceptual Modeling?
Organizations across all fields of commerce and industry need to perform sophisti
cated data analysis in order to support their decision-making processes since these
decisions ultimately have significant effects on the organization's financially health
and solvency. Traditional databases are designed to support daily business operations,
where the focus is on both concurrent access by multiple users, as well as recovery tech
niques that guarantee data consistency. These highly normalized databases generally
perform poorly when executing complex queries against massive volumes of detail-
level transactions. Moreover, if an organization needs to be analyzed or assessed "as
a whole", data from different systems must be properly integrated. This integration
demands the design and implementation of a coordinated conceptual model. How
ever, this task is usually difficult to accomplish because of differences in structure,
definition, and content. In fact, [21] and [39] show that conceptual models designed
for traditional databases are poorly suited to the data warehouse/OLAP world.
The absence of a commonly accepted conceptual approach for data warehousing
and OLAP systems makes the modeling task difficult at present. Even though a
number of approaches have been proposed, none of them has been accepted as a
standard for either data warehousing in general or OLAP hierarchies in particular.
47

As a result, the area of conceptual design for OLAP applications is still very much at
the research stage. From our point of view, previous proposals attempt to represent
multi-dimensional properties at the conceptual level by directly emphasizing the pri
mary data structure (fact and dimensions). While this is important, it nevertheless
discounts the significance that dimension hierarchies play in the real world. In addi
tion, most of these models introduce non-standard graphical notation that is unlikely
to be adopted in practice.
The conceptual modeling phase is widely recognized as a crucial step in the design
of data warehouse and OLAP applications. Significant attention should be paid at the
modeling phase to perfectly (or at least effectively) transform the user's requirements
into error-free, understandable, and easily extendable OLAP schemas. The sooner a
designer is able to define a precise schema, the more accurately the implemented data
warehouse/OLAP system will represent the requirements and objectives of the user.
3.2.2 Why UML?
There are a number of reasons why we feel that UML is the ideal notational framework
for this type of research. We briefly summarize its strengths below:
1. UML is a modeling language that is already well understood by many database
designers. Therefore, learning a new language can often be avoided.
2. UML is a standard of the Object Management Group (OMG) and benefits from
OMG's extensive background in 0 0 (Object Oriented) analysis and design.
3. The 0 0 paradigm, which UML follows, is semantically richer than other paradigms
in that 0 0 models tend to be closer to the user's conception of the real world
48

4. UML can be easily extended and tailored to a specific domain. Due to the
use of the UML profiling mechanism, designers do not need to understand the
entire UML; instead, they can use the concepts (fact, dimension) with which
they normally work.
5. The UML profiling mechanism also restricts the set of UML elements that is
to be used in a given domain. This "specializes" these elements to capture the
semantics of data warehousing elements.
6. UML has been widely accepted by the scientific and industrial communities,
and there are many Computer Aided Software Engineering (CASE) tools that
support it.
7. The use of UML promotes the implementation of a common modeling language,
so that the vision of integration, reusability and inter-operability within an
enterprize's system can be achieved.
3.2.3 Why not ER?
Entity Relationship (ER) models have traditionally been one of the most widely
utilized data design models [10]. In fact, there are now many different extensions of
the traditional ER diagram [38]. Still, they are not appropriate for multi-dimensional
modeling due largely to their complexity in this setting. Several authors have pointed
out this problem. For instance, Ralph Kimball states the following [21]:
Entity Relation data models are a disaster for querying because they can
not be understood by users and they cannot be navigated usefully by
49

DBMS software. Entity Relation models cannot be used as the basis for
enterprize data warehouses.
3.2.4 Why OCL?
In [43], Warmer declares that "The combination of UML and OCL offers the best of
both worlds to the software developer". The motivation for this statement is that
while UML is capable of modeling a variety of distinct systems, it can often be ineffi
cient in doing so due to its wide-spectrum approach. This suggests a requirement for
a more cleanly integrated mechanism for specifying system and element constraints.
The Object Constraint Language (OCL) is suited to this role for the following reasons:
1. Using OCL with DW/OLAP UML meta models enriches the model with ad
ditional information that make the model complete, consistent, precise, more
detailed, and unambiguous.
2. OCL expressions can be verified by most CASE tools to ensure correctness and
consistency with other elements of the model.
3. Code generation becomes much more powerful with OCL.
4. An essential characteristic is that OCL is a typed language, so its expressions
can be checked during modeling and before execution [19]. Thus, errors in the
model can be removed at an early stage.
5. OCL is a declarative language which ensures that its expressions have no side
effects. Evaluating an OCL expression does not change the state of the system.
6. OCL can be used to write constraints and any expressions on elements.
50
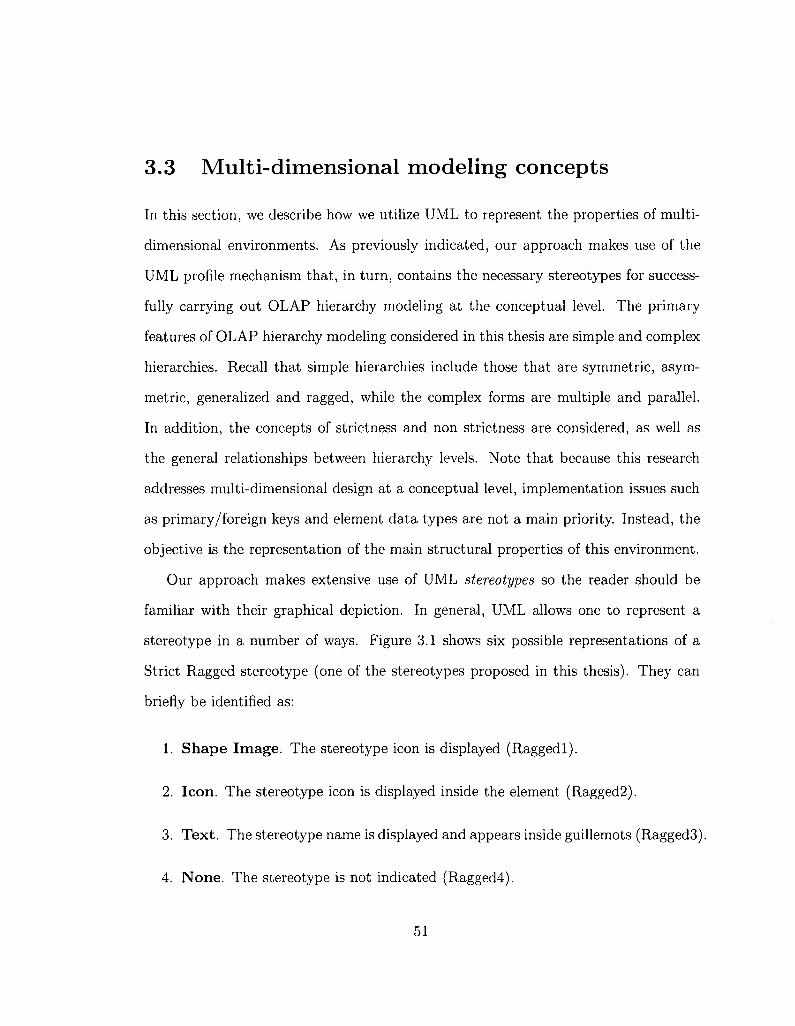
3.3 Multi-dimensional modeling concepts
In this section, we describe how we utilize UML to represent the properties of multi
dimensional environments. As previously indicated, our approach makes use of the
UML profile mechanism that, in turn, contains the necessary stereotypes for success
fully carrying out OLAP hierarchy modeling at the conceptual level. The primary
features of OLAP hierarchy modeling considered in this thesis are simple and complex
hierarchies. Recall that simple hierarchies include those that are symmetric, asym
metric, generalized and ragged, while the complex forms are multiple and parallel.
In addition, the concepts of strictness and non strictness are considered, as well as
the general relationships between hierarchy levels. Note that because this research
addresses multi-dimensional design at a conceptual level, implementation issues such
as primary/foreign keys and element data types are not a main priority. Instead, the
objective is the representation of the main structural properties of this environment.
Our approach makes extensive use of UML stereotypes so the reader should be
familiar with their graphical depiction. In general, UML allows one to represent a
stereotype in a number of ways. Figure 3.1 shows six possible representations of a
Strict Ragged stereotype (one of the stereotypes proposed in this thesis). They can
briefly be identified as:
1. Shape Image. The stereotype icon is displayed (Raggedl).
2. Icon. The stereotype icon is displayed inside the element (Ragged2).
3. Text. The stereotype name is displayed and appears inside guillemots (Ragged3).
4. None . The stereotype is not indicated (Ragged4).
51
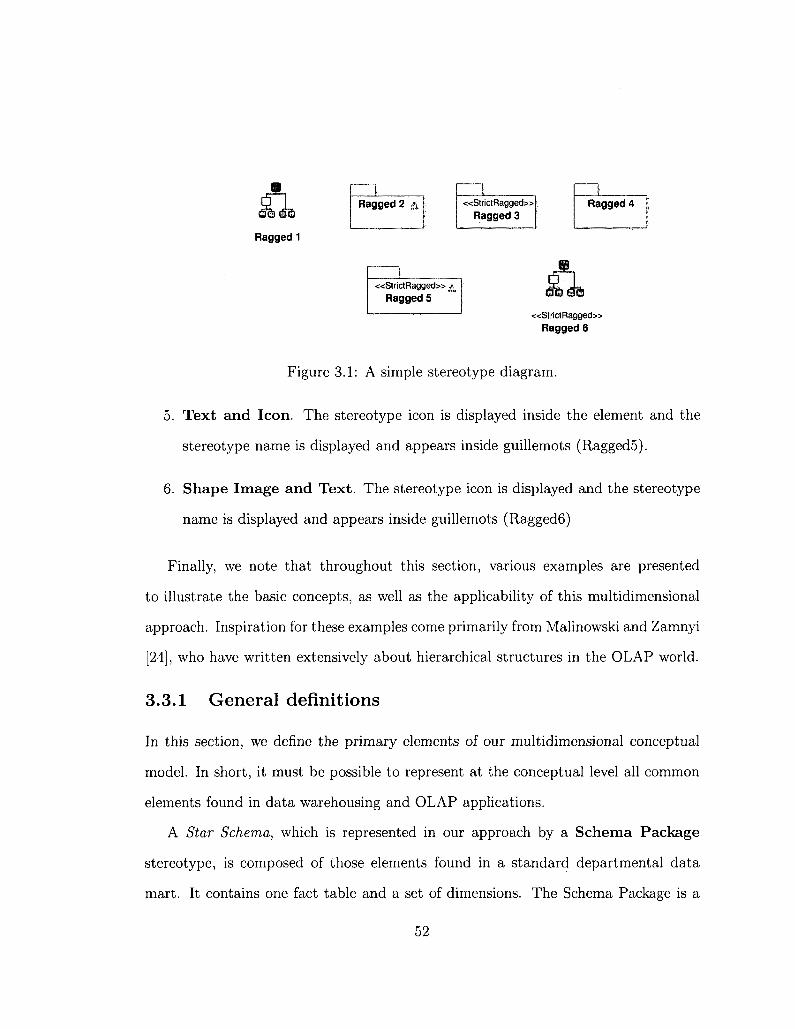
Ragged 1
~l Ragged 2 &
t «StrictRagged» ^
Ragged 5
I «StrictRagged»
Ragged 3
H Ragged 4
j ^ - i
&J» «StrictRagged»
Ragged 6
Figure 3.1: A simple stereotype diagram.
5. Text and Icon. The stereotype icon is displayed inside the element and the
stereotype name is displayed and appears inside guillemots (Ragged5).
6. Shape Image and Text. The stereotype icon is displayed and the stereotype
name is displayed and appears inside guillemots (Ragged6)
Finally, we note that throughout this section, various examples are presented
to illustrate the basic concepts, as well as the applicability of this multidimensional
approach. Inspiration for these examples come primarily from Malinowski and Zamnyi
[24], who have written extensively about hierarchical structures in the OLAP world.
3.3.1 General definitions
In this section, we define the primary elements of our multidimensional conceptual
model. In short, it must be possible to represent at the conceptual level all common
elements found in data warehousing and OLAP applications.
A Star Schema, which is represented in our approach by a Schema Package
stereotype, is composed of those elements found in a standard departmental data
mart. It contains one fact table and a set of dimensions. The Schema Package is a
52
specialization of the UML Package meta class.
A dimension, which is represented in our approach by a Dimension Package
stereotype, is an abstract concept that groups data sharing a common semantic mean
ing. The Dimension Package is also a specialization of the UML Package meta class.
A dimension is composed of a hierarchy or a set of hierarchies. The name of the
dimension is represented by a Dimension stereotype, which does not have any prop
erties. A Dimension is a specialization of the UML Class meta class. The stereotyped
class Dimension belongs to the stereotyped Dimension Package.
A hierarchy is composed of a set of levels. A level describes a set of real-world
concepts that have similar characteristics. Instances of a level are called members.
A level is divided into three main types — Root, Level, and Leaf — that are spe
cializations of the UML Class meta class. The relationships between these levels are
represented by a RollUpTo stereotype, which is a specialization of a UML Asso
ciation meta class. These associations are used for traversing from one level to the
next. The stereotyped RollUpTo association is characterized by the two roles c (child)
and p (parent), as well as cardinalities indicating the maximum and the minimum
number of members in one level that can be related to a member in another level.
In addition, a level has a set of properties that describe its characteristics, includ
ing the OID (Object ID), Descriptor and Level Attribute. These properties are
specializations of the UML Attribute meta class.
Finally, a fact is represented by a Fact Package stereotype, and expresses a focus
of analysis. It is a specialization of the UML Package meta class. A Fact Package
is composed of one stereotype, Fact, that is a specialization of the UML Class
meta class. A Fact is connected to a Dimension by a Dimensioning, which is a
53
specialization of a UML Association meta class. A Fact usually contains properties;
otherwise, it is described as fact-less [21]. These properties are represented by a
Measure stereotype, which is a specialization of the UML Attribute meta class.
These Measure attributes are analyzed as per the various perspectives presented by
the surrounding dimensions.
3.3.2 Design guidelines
Our experience has shown us that the design of an OLAP schema is not a haphazard
process. In general, a successful design is the result of adherence to an informal
"design algorithm." In the current case, we can describe a bottom-up process that
consists of nine distinct steps. We note, of course, that before beginning the UML
design, the designer must already have identified the facts, dimensions, and hierarchies
relevant to the given domain. Once that is done, the design phase proceeds as follows:
1. Step 1: Create a Hierarchy package that corresponds to the kind of hierarchy
that will be created. Possible Hierarchy packages include:
• Strict Symmetric
• Non-strict Symmetric
• Strict Asymmetric
• Non-strict Asymmetric
• Strict Generalized
• Non-strict Generalized
• Strict Ragged
• Non-strict Ragged
54
• Multiple Alternative
• Multiple Inclusive
• Parallel Dependent
• Parallel Independent
2. Design the levels of a hierarchy and the relationships between them. In prac
tice, we do this by specifying Root, Leaf, and Levels stereotypes and defining
RollUpTo stereotyped associations between them.
3. Relate the leaf level to a dimension. We do this with a stereotyped association
Hierarch that links a stereotyped Leaf class to the stereotyped Dimension class.
4. Create a Dimension Package to which the Dimension class and the Hierarchy
package belong.
5. Create a fact and its associated measure(s) by defining a stereotyped Class Fact
and stereotyped Attributes Measure .
6. Relate the fact to the dimensions. This is done with a Dimensioning stereo
type that defines an aggregation relationship between the stereotyped Fact and
Dimension classes.
7. Define a stereotyped Fact package. Then either place the corresponding Fact
class in this package or relate it to the package with a Dependency relationship.
8. Create a Schema package that represents the Star Schema of the relevant data
mart.
55

[\ "V" SchemaPackagel \ _ __ " °
l _ ^ ^ _ _ ^ ^ _ _ _ _ J < < g c h e m a p a c k a g e > >
SchemaPackagel / \
/ \
m* *
tv SchemaPackage2l «SchemaPackage» 1 SchemaPackage2
tP «FactPackage» «DimensionPackage»
FactPackage 1 DimensionPackagel
«FactPackage» n
FactPackage2 «DimensionPackage» 4£
DimensionPackage2
Figure 3.2: Different representations
9. Relate dimensions and facts to the corresponding schema. We do this either by
linking the Dimension package and the Fact package to the Schema package with
a stereotyped dependency relationship or by directly including these packages
in the Schema package.
We can see two possible "top level" views of the final result in Figure 3.2. On the
right hand side of the diagram, the "parent" schema package encapsulates both the
Fact and Dimension packages. Each of the three package folders are displayed with
the standard UML representation and the corresponding stereotype icon is placed in
the upper right corner of the package. On the left hand side of Figure 3.2, we see
an alternate representation of the new Star Schema. Here, the entire package symbol
has been collapsed into the corresponding stereotype icon and the linkages with the
Fact and Dimension packages are depicted using dependency relationships. In this
thesis, the first form of representing the stereotype has been adopted as it tends to
be more expressive, as well as intuitive for end users. Finally, we note as well that
the OLAP designer is free to annotate the core diagrams with UML notes in order to
add more detail, clarify points, describe concepts or characteristics.
56
3.3.3 OLAP hierarchies
The first two steps of the design algorithm have to be quite precise because the hier
archy levels of a dimension are ultimately the most important element of the schema
in terms of data analysis. In a sense, it is this ability to accurately and intuitively
drill down and roll up through hierarchies that defines the OLAP processing model
[31]. The primary prerequisite of course is that the sequence of relationships between
hierarchy levels has to be meaningful. In other words, an aggregation path between
hierarchy levels must have a valid sequence of roll up and/or drill down operations
that can be performed by traversing the path.
We note that in the current model a hierarchy package is used to group related
model elements of all types, including other packages. This packaging serves two
purposes. First, the integration of elements into a single package makes the hierarchy
easier to understand and navigate for end users. Second, packages are easier for the
user/system to validate separately. Many hierarchy packages, in fact, have a number
of common restrictions and considerations.
In turn, all hierarchy packages have a single "owner", which is the associated
Dimension Package. Therefore, the only relationships between Hierarchy packages
and Dimension Packages are Package Import and Dependency relationships. In effect,
a Hierarchy Package is a direct representation of a Dimension. We maintain the notion
of a distinct Dimension entity, however, since this is a core part of the conceptual
Star Schema model. In other words, users intuitively view a data mart as a Fact
table, surround by a series of key Dimensions, not a group of (complex) hierarchies.
Figure 3.3 illustrates how a dimension package encapsulates a given hierarchy, in this
case a Strict Generalized Hierarchy (discussed shortly).
57
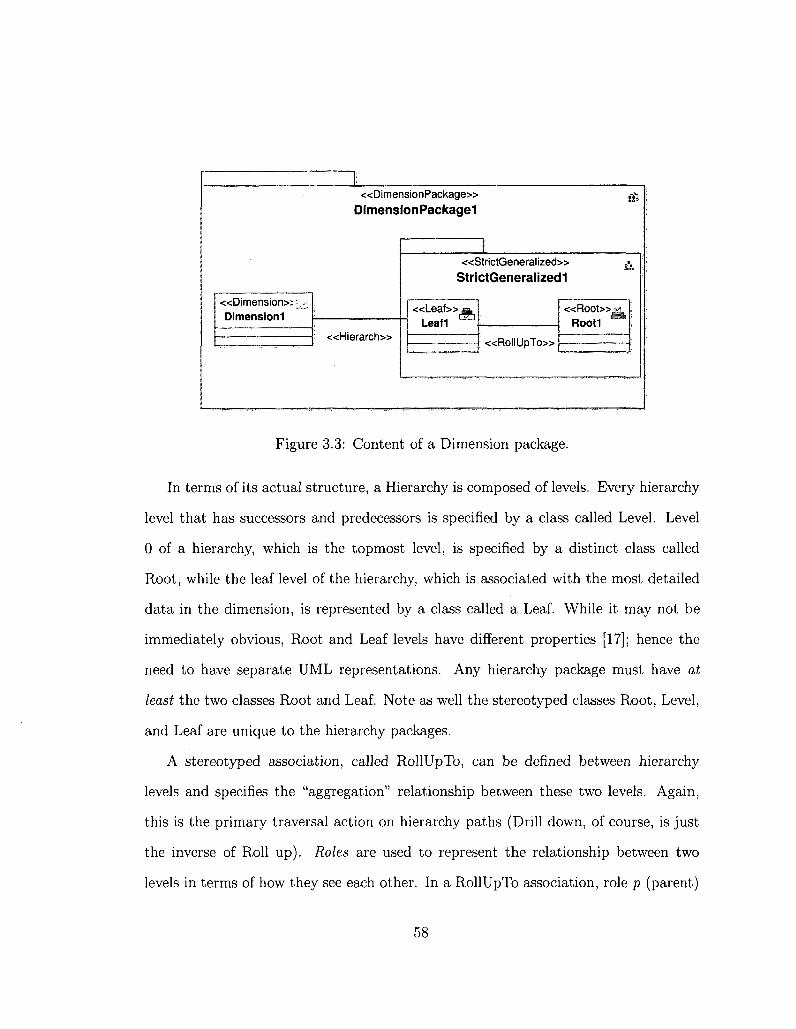
«Dimension>; \ ^ Dimensionl
1 «DimensionPackage»
DimensionPackagel
«Hierarch»
ifc
f «StrictGeneralized» ^ ;
StrictGeneralizedl
« L e a f » i « , Leafl
«RollUpTo»
<<Root>>£L Rootl
Figure 3.3: Content of a Dimension package.
In terms of its actual structure, a Hierarchy is composed of levels. Every hierarchy
level that has successors and predecessors is specified by a class called Level. Level
0 of a hierarchy, which is the topmost level, is specified by a distinct class called
Root, while the leaf level of the hierarchy, which is associated with the most detailed
data in the dimension, is represented by a class called a Leaf. While it may not be
immediately obvious, Root and Leaf levels have different properties [17]; hence the
need to have separate UML representations. Any hierarchy package must have at
least the two classes Root and Leaf. Note as well the stereotyped classes Root, Level,
and Leaf are unique to the hierarchy packages.
A stereotyped association, called RollUpTo, can be defined between hierarchy
levels and specifies the "aggregation" relationship between these two levels. Again,
this is the primary traversal action on hierarchy paths (Drill down, of course, is just
the inverse of Roll up). Roles are used to represent the relationship between two
levels in terms of how they see each other. In a RollUpTo association, role p (parent)
58
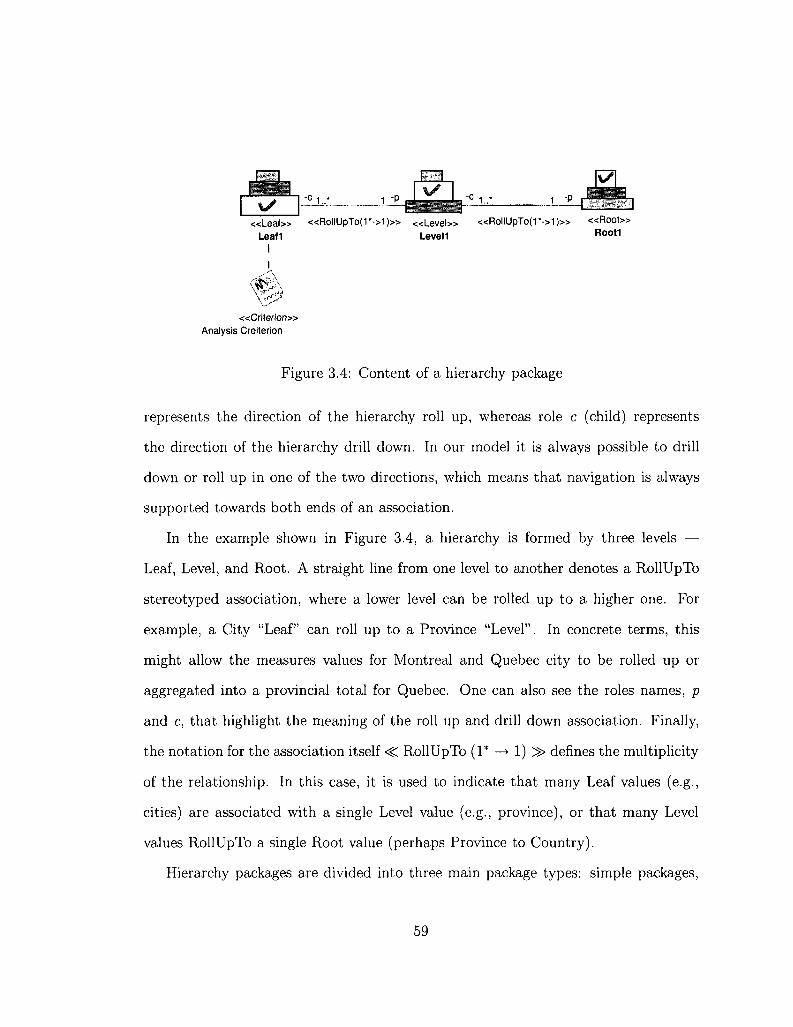
wm 1 -p _ L * 1 -p
« L e a f » «RollUpTo(1*->1)» «Leve l» «RollUpTo(1*->1)» « R o o t » Leafl Level! R o o t 1
I
\ ^ «Crilerion»
Analysis Creiterion
Figure 3.4: Content of a hierarchy package
represents the direction of the hierarchy roll up, whereas role c (child) represents
the direction of the hierarchy drill down. In our model it is always possible to drill
down or roll up in one of the two directions, which means that navigation is always
supported towards both ends of an association.
In the example shown in Figure 3.4, a hierarchy is formed by three levels —
Leaf, Level, and Root. A straight line from one level to another denotes a RollUpTo
stereotyped association, where a lower level can be rolled up to a higher one. For
example, a City "Leaf" can roll up to a Province "Level". In concrete terms, this
might allow the measures values for Montreal and Quebec city to be rolled up or
aggregated into a provincial total for Quebec. One can also see the roles names, p
and c, that highlight the meaning of the roll up and drill down association. Finally,
the notation for the association itself <C RollUpTo (1* —> 1) ^> defines the multiplicity
of the relationship. In this case, it is used to indicate that many Leaf values (e.g.,
cities) are associated with a single Level value (e.g., province), or that many Level
values RollUpTo a single Root value (perhaps Province to Country).
Hierarchy packages are divided into three main package types: simple packages,
59

multiple packages and parallel packages. Separate packages have been defined primar
ily because it simplifies the meta model and reduces constraint redundancy. Root,
Level and Leaf classes are the only classes that can be contained in all hierarchy
packages. A simple package, which is specialized into Strict and Non Strict, can
not contain any other type of package. A Multiple Hierarchy package is similar to a
Simple package but has a number of additional properties that are unique to the Mul
tiple Inclusive and Multiple Alternative hierarchy forms. Parallel Hierarchy packages
contain multiple simple hierarchies, each with a unique analysis criterion. This also
implies that a Parallel Hierarchy may have multiple hierarchy packages nested within
it.
3.3.4 Analysis criterion
This thesis represents analysis criteria in the model by attaching a stereotype Crite
rion comment to the Leaf class, as illustrated in Figure 3.4. Note that while the user
may visualize data being physically stored at each and every level of the dimension
hierarchy, this is usually not the case in practice. More likely, the DBMS server stores
data at leaf-level granularity, then dynamically aggregates data into higher levels at
query time. As such, it makes sense to associate the Criterion comment with the leaf
node since hierarchical analysis will be driven from this level. Our choice of using a
stereotyped UML Comment rather than a UML Note was taken for the following rea
son. A UML Comment is a meta class of UML, while a UML note is only notational.
This ultimately allows a UML Comment to serve as a reusable element of a model,
to be owned by any element, to carry a <C stereotype » , and to appear in the model
repository [23].
60

3.3.5 Conformed dimension
In practice, dimensions are often shared between Star Schemas [21]. In other words,
an organization might have half a dozen corporate data marts, each representing a
distinct business process (e.g., sales, inventory). Within these distinct data marts,
the same dimension could be used repeatedly. Dimensions like Time, Customer, or
Product would be common examples. While separate dimension hierarchies could
be defined for each of these schemas, doing so is not only wasteful, but increase the
likelihood of ambiguity and contradictions. Instead, we introduce the notion of a
stereotyped Conformed Dimension package. This package allows the user to define a
"reusable" hierarchy package once, then use the UML import mechanism to include
this Conformed dimension into any number of distinct schema packages.
Strictly speaking, a Conformed Package cannot physically belong to any one pack
age and cannot have a relationship with any package except for the import relation
ship. This model allows us to significantly reduce the complexity of modeling common
dimensions as we need not consider dependency relationships between two Schema
Packages indicate sharing [22]. In particular, we do not have to worry about circular
dependencies that might occur during the design process, nor the necessity to reduce
these dependencies by splitting, introducing a third intermediate package, or merging
packages [24]. In Figure 3.5, we see a simple Conformed Package representing the
Product dimension. In this case, it is composed of Product, Category and Brand
levels.
61

«ConformedPackage» •.«
« L e a f » j Product
-c 1..*
«StrictSymmetric» Product Hierarchy
-p
1
«RollUpTo(c1*->1p)>£
«Leve l» j2 i Category
-c
1..* «R0Ot» j
Brand «RollUpTo(c1*->1p)>i
«TimePackage» Calendar Hierarchy «StrictGeneralized»
Customer Hierarchy
Figure 3.5: Content of a Conformed Package
62

«Dimension>;^ .•_! Store
i
i
«Dimensioning>
c<Oimensioning»
{not-aggregated}
«Dimension>; •_.,•, Customer
j «Dimension>:•• ^ 1 s Product i
>
) isionmg»
« F a c t » m Sales
«Measure»-Quantity : Additive «Measure»-Amount: Additive «Measure»-Price: Nonadditive
(Role - "Order Date"}
«Dimensioning»
{Role = "Payment Date"}
«Dimensioning»
«Dimer sioning» «DegenerateDimension» m
Transaction
«Descriptor»-Transaction Numbet
«Oimension>;' .• Time
Figure 3.6: Time dimension playing distinct roles.
3.3.6 Role playing dimension
Sometimes a single dimension can be connected to a fact but play different roles.
Each role is uniquely represented by a Dimensioning association that is identified by
the tag Role. For example, Figure 3.6 shows a Time dimension that is associated
with more than one attribute of the Sales fact table. In particular, it can be used to
perform analysis by two distinct time values, Order Date and Payment Date. This is
represented in the figure by two distinct roles for this dimension.
3.3.7 Degenerate dimension
Often, attributes are included in a fact table solely to provide a more intuitive interface
for end users. Unlike normal fact tables attributes, these degenerate attributes do not
link the fact table with any of the dimensions in the Star Schema. Instead, they are
included in the fact table since they may be useful for grouping fact table records
63
during the aggregation process [24]. Common examples are attributes like line number
and order number that are found in the detailed fact record [34, 31].
To be able to represent these attributes, our model includes the stereotyped class
Degenerate Dimension. This class can only have an OID (Object ID) and one De
scriptor. For example, in Figure3.6, transaction number is housed in the Degenerate
dimension Transaction, a class having just a single descriptor, Transaction Number.
3.3.8 Measure values
In order to represent the various aggregation measures found in the fact table, three
data types have been defined: Additive, Semi-additive, and Non-additive. Additive
measure are the most common type of measure and describes the case whereby addi
tion can be used to aggregate attribute values along/up all hierarchies defined on a
dimension. The SUM aggregation function is applicable to these measures. Additive
measures are also called rate or flow measures. In contrast, semi- additive measures
are additive along some but not all dimensions. They are also called level or stock
measures. Finally, non-additive measures, as the name would suggest, cannot be
summarized using addition. They are often referred to as value-per-unit measures.
By default, measures within the Fact class are considered to be additive. For non
additive measures, additive rules are defined as OCL constraints near the Fact class
as a note. Figure3.6 illustrates the use of these measures in the Sales fact, where
Quantity and Amount are defined as additive and Price as nonadditive.
Occasionally, we find situations where the knowledge of the existence of a particu
lar combination of feature attributes is the only thing that is important. We refer to
this as a fact-less fact table [21]. For example, an analysis of student attendance might
be associated with the dimensions student, date, course room, and professor. What
64
is the relevant measure? Basically, it is a yes/no value. Our fact table could then
simply contain records identifying the valid dimension combinations for attendance.
3.3.9 At t r ibute
Four stereotyped Attributes are defined within the new model. OID (Object ID) is
an identifying attribute that is used for aggregation purposes. A Descriptor is simply
a label that represents the name of a level. Level Attribute provides descriptive
information about dimension instances. Finally, we also employ the Distribution
Attribute for defining measure distributions in the Multiple Inclusive package. The
OID and Descriptor attributes are particularly important for interfacing with OLAP
tools, since this information typically becomes part of the tool's meta data.
3.3.10 Time dimension
In a data warehouse, Time is the most common, and arguably most important,
dimension. Many forms of analysis involve either historical trends or inter-period
comparisons. For example, Inmon defines a data warehouse as "a subject-oriented,
integrated, time-variant, non-volatile collection of data in support of management's
decision" [18], while Kimball states that "The time dimension is the one dimension
virtually guaranteed to be present in every data warehouse because virtually ev
ery data warehouse is a time series" [21]. For this reason, our model pre-defines a
stereotyped Time hierarchy package composed of Year, Month, Week, Day and Time
stereotyped classes. Each includes tagged values called Type that define internal,
time-related representations. For example, the Time class contains the data types
hour, minute, second, and time. In addition, as per the work of Malinowski [24], we
also define an Instant, corresponding to a single, precisely defined point in time, and
65

«TimePackage»
Calendar {Temporal Type = Interval}
j P M ° «Rol lUpTo(cr->1p)» «Ro l lUpTo(c r ->1p)»„
J Month Q u a r t e r
Day" «RollUpTO(d *->1 p ) » w
Week
«RollUpTo
-P 1..*
'c1"->1p)»
«Rol lUpTo(cr->1p)» -p Year
Figure 3.7: Content of the Time package.
an Interval, which denotes an instant-to-instant time period.
We note that the Time hierarchy can only belong to a Dimension package or a
Conformed package. Figure 3.7 illustrates the main elements of the Time package.
Specifically, one can see how alternate aggregations are defined by the Year —> Quarter
—> Month —> Day and Year —> Week —> Day paths. This, in fact, is an example of a
Multiple Alternative hierarchy.
3.3.11 The global view
"Zooming out" allows one to see the entire Star Schema by looking at the Schema
Package and its constituent Dimension and Fact packages. With respect to the di
mension packages, an indicator signals to the user whether or not the package is
actually an imported entity from a conformed (i.e., shared) package. In Figure 3.8, a
typical "zoomed" Star Schema is shown.
66

A
DimensionPackagel
«SchemaPackage» SchemaPackagel
Qi FactPackagel
1
DimensionPackage2
X
DimensionPackage3
Figure 3.8: Content of a Schema package.
3.3.12 A UML perspective
In Figure 3.9, a portion of the UML meta model is presented to show where the
stereotypes fit. Ultimately, all the meta classes come from the Core Package, a sub-
package of the UML Foundation Package. In this figure, stereotypes unique to the
current work are colored in dark grey. Stereotypes identified by previous researchers
in the area [22] are unshaded.
3.3.13 Meta model
In practice, the designer is less concerned with UML packages than they are with
the conceptual meta model. Figure 3.10 illustrates the "big picture" for our new
0 0 meta model (the illustration is created as a UML class diagram), tying together
most of the elements discussed in this section. The model is "driven" by the OLAP
Hierarchy elements located in the center of the diagram. One can see how hierarchies
are constructed from Levels and contained within Dimensions. The levels themselves
67

Figure 3.9: Extension of the UML with multi-dimensional stereotypes.
68

are manufactured from Level, Root and Leaves, plus OIDs, Descriptors, and Level
Attributes. An individual level must have just one Descriptor and one OID, but can
have more than one Level Attribute. The Leaf can contain one or more Critera.
Root, Level and Leaf elements can only belong to a Dimension Package (through a
given hierarchy). A Dimension Package, in turn, can be composed of one or more
hierarchies.
In the bottom half of the diagram, we can see how hierarchy packages can be
defined as either Simple, Multiple or Parallel. Simple hierarchies can be specialized
into Strict or Non Strict. In turn, Strict hierarchies can be specialized into Strict
Symmetric, Strict Asymmetric, Strict Generalized, and Strict Ragged. Non-strict
can of course be specialized into Non-strict Symmetric, Non-strict Asymmetric, Non-
strict Generalized, and Non-strict Ragged. Multiple hierarchies can be specialized
into Multiple Inclusive and Multiple Alternative. Finally, Parallel hierarchies can
be specialized into Parallel Independent and Parallel Dependent. Note that each
OLAP hierarchy package must have RollUpTo associations with varying cardinalities,
depending on the hierarchy in question.
3.4 The multi-dimensional profile
In this section, we bring all of the preceding concepts and elements together in the
form of a UML profile. While much of the profile represents the new work described
in the preceding section, we re-iterate that we also utilize a handful of "standard"
stereotypes defined in the literature, most notably in [22]. We provide a short sum
mary of these stereotypes in Table 3.1. The remainder of this chapter will deal with
our own contributions to the new OLAP profile.
69

Name
Schema Package
Fact Package
Dimension Package Fact
Dimension
OID
Descriptor
Level Attribute
Measure
Rollup
Degenerate Fact
Base Class
Package
Package
Package
Class
Class
Attribute
Attribute
Attribute
Attribute
Association
Association Class
Description
Packages of this stereotype represent multi-dimensional Star Schemas Packages of this stereotype represent multi-dimensional facts Packages of this stereotype represent multi-dimensional dimensions Classes of this stereotype represent facts in multi-dimensional model Classes of this stereotype represent dimensions in multi-dimensional model Attributes of this stereotype represent OID attributes of levels in a multidimensional model Attributes of this stereotype represent attributes of levels in a multidimensional model Attributes of this stereotype represent descriptor attributes of levels in a multi-dimensional model Attributes of this stereotype represent attributes of a fact in a multidimensional model Associations of this stereotype represent associations between level Association classes of this stereotype represent association classes in multidimensional model
Table 3.1: Summary of standard data warehousing stereotypes
70
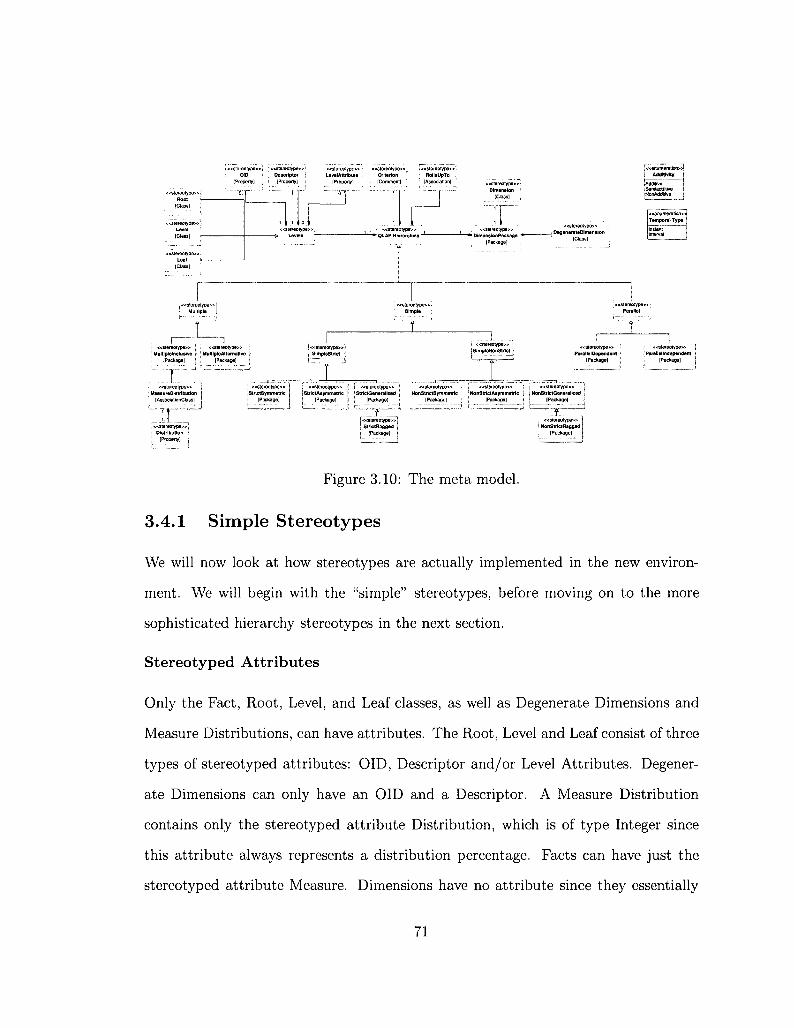
«siereoiype» Descriptor (Properly]
«Blereolype» • LevelAttrlbute •
[Properly]
1 «6lere01ype»; ; «8tere0lypB» Criterion ' : HollsUpTo , [Commentl 1 ' [Association]
«stefeotype> Root
[Class]
"Stereotype >
[Classl
<Estersotype> Leal
(Classl
y
O
: «stereotype» ; : «s1ereotype» , ; MultlplelnclusJve • j Multiple Alternative j
iPackage| \ \ [Package] !
:ateieoiype»;
« stereotype » Dimension
pass]
«stereoiype» " Dimension Package *
[Package]
: «stereoiype» | StrlctSymmetrtc i [Package)
T. :«stereotype»| ; Distribution [
[Property]
j«atereotype»i , SlrnpleStrict {
[Package] ( i [Package]
«Btereoiype» „. Degenerate Dimension -
(Classl
lAdcmtve Samiaddltive NonAddiltve
"ZTZZ | «stereotype>s j StrlctRagged
(Package]
«stereotype» j Parallel Dependent ;
(Package) ;
<<stereotype>? j HonSlrictOeneralized ! (Package]
«stereotype» | NonStrlclRagged |
[Package] |
i «8lereotype» | j Parallel Independent i
[Package] i
Figure 3.10: The meta model.
3.4.1 Simple Stereotypes
We will now look at how stereotypes are actually implemented in the new environ
ment. We will begin with the "simple" stereotypes, before moving on to the more
sophisticated hierarchy stereotypes in the next section.
Stereotyped Attributes
Only the Fact, Root, Level, and Leaf classes, as well as Degenerate Dimensions and
Measure Distributions, can have attributes. The Root, Level and Leaf consist of three
types of stereotyped attributes: OID, Descriptor and/or Level Attributes. Degener
ate Dimensions can only have an OID and a Descriptor. A Measure Distribution
contains only the stereotyped attribute Distribution, which is of type Integer since
this attribute always represents a distribution percentage. Facts can have just the
stereotyped attribute Measure. Dimensions have no attribute since they essentially
71
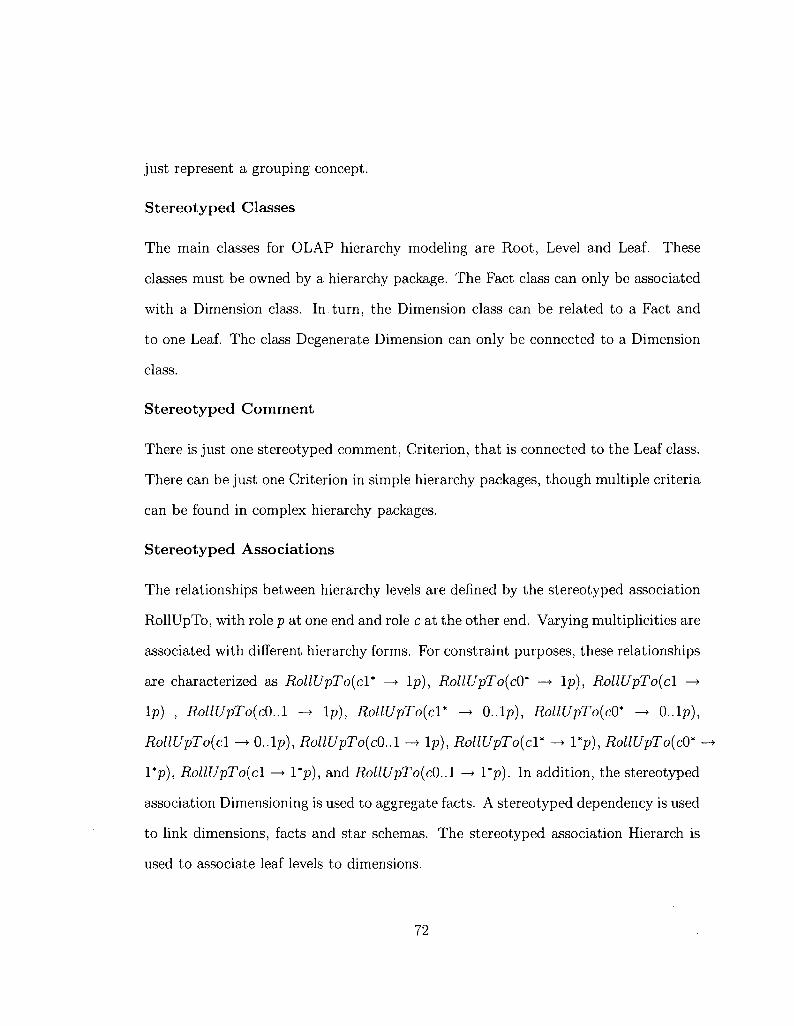
just represent a grouping concept.
Stereotyped Classes
The main classes for OLAP hierarchy modeling are Root, Level and Leaf. These
classes must be owned by a hierarchy package. The Fact class can only be associated
with a Dimension class. In turn, the Dimension class can be related to a Fact and
to one Leaf. The class Degenerate Dimension can only be connected to a Dimension
class.
Stereotyped Comment
There is just one stereotyped comment, Criterion, that is connected to the Leaf class.
There can be just one Criterion in simple hierarchy packages, though multiple criteria
can be found in complex hierarchy packages.
Stereotyped Associations
The relationships between hierarchy levels are defined by the stereotyped association
RollUpTo, with role p at one end and role c at the other end. Varying multiplicities are
associated with different hierarchy forms. For constraint purposes, these relationships
are characterized as RollUpTo(cV -> lp), RollUpTo{cO* - • lp), RollUpTo(cl -»
lp) , RollUpTo(c0..1 -> lp), RollUpTo(c\* - • 0..1p), RollUpTo{cO* - • 0..1p),
RollUpTo(cl - • 0..1p), RollUpTo{cO.A -> lp), RollUpTo(cl* - • l*p), RollUpTo(cO* -*
l*p), RollUpTo(cl —> l*p), and RollUpTo(c0..1 —> l*p). In addition, the stereotyped
association Dimensioning is used to aggregate facts. A stereotyped dependency is used
to link dimensions, facts and star schemas. The stereotyped association Hierarch is
used to associate leaf levels to dimensions.
72
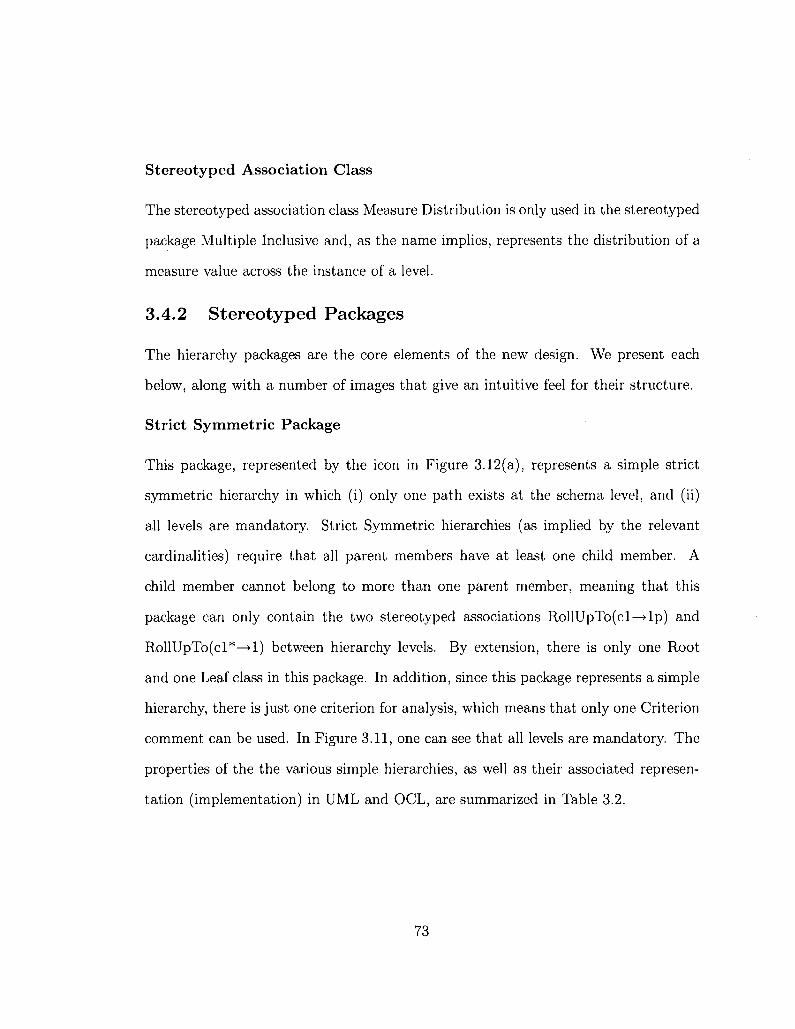
Stereotyped Association Class
The stereotyped association class Measure Distribution is only used in the stereotyped
package Multiple Inclusive and, as the name implies, represents the distribution of a
measure value across the instance of a level.
3.4.2 Stereotyped Packages
The hierarchy packages are the core elements of the new design. We present each
below, along with a number of images that give an intuitive feel for their structure.
Strict Symmetric Package
This package, represented by the icon in Figure 3.12(a), represents a simple strict
symmetric hierarchy in which (i) only one path exists at the schema level, and (ii)
all levels are mandatory. Strict Symmetric hierarchies (as implied by the relevant
cardinalities) require that all parent members have at least one child member. A
child member cannot belong to more than one parent member, meaning that this
package can only contain the two stereotyped associations RollUpTo(cl—>lp) and
RollUpTo(cl*—>1) between hierarchy levels. By extension, there is only one Root
and one Leaf class in this package. In addition, since this package represents a simple
hierarchy, there is just one criterion for analysis, which means that only one Criterion
comment can be used. In Figure 3.11, one can see that all levels are mandatory. The
properties of the the various simple hierarchies, as well as their associated represen
tation (implementation) in UML and OCL, are summarized in Table 3.2.
73

«StrictSymmetric» Location Hierarchy
JL %/
Store«RollUpTo(1 *->1 ) « P ^ ^ | R o l l U p T o ( 1 *->1 ) > T ~ t e <<RollUpTo(r->1 ) > S — ~
T\ «Criterion» * ,
Geo Location
Figure 3.11: Strict Symmetric package.
(a) (b) (d)
Figure 3.12: Hierarchy icons for (a) Strict Symmetric (b) Strict Asymmetric (c) Strict Generalized (d) Strict Ragged
74
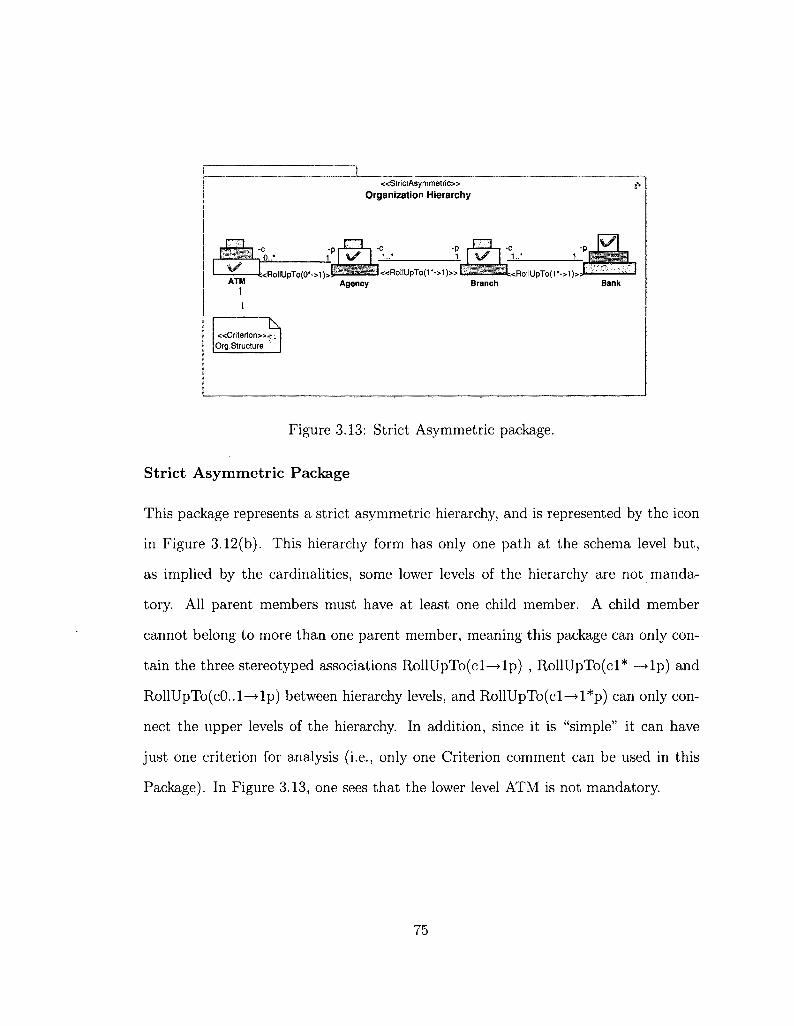
«StriotAsymmetrio»
Organization Hierarchy
p i g ;co,.- n %/
ATM I \
cRollUpTo(0*->1 j J S S E E a l ] «Ro!IUpTo(1 *->1 )> Agency
EZL W
B i : < l Branch
:RollUpTo(1*->1): Bank
" ^ «Cri ter ion»^, v
Org.Structure
Figure 3.13: Strict Asymmetric package.
Strict Asymmetric Package
This package represents a strict asymmetric hierarchy, and is represented by the icon
in Figure 3.12(b). This hierarchy form has only one path at the schema level but,
as implied by the cardinalities, some lower levels of the hierarchy are not manda
tory. All parent members must have at least one child member. A child member
cannot belong to more than one parent member, meaning this package can only con
tain the three stereotyped associations RollUpTo(cl—>lp) , RollUpTo(cl* —>lp) and
RollUpTo(c0..1—>lp) between hierarchy levels, and RollUpTo(cl—>l*p) can only con
nect the upper levels of the hierarchy. In addition, since it is "simple" it can have
just one criterion for analysis (i.e., only one Criterion comment can be used in this
Package). In Figure 3.13, one sees that the lower level ATM is not mandatory.
75

Properties
Account for the same analysis criterion Only one path All levels are mandatory
Some lower levels are not mandatory All paths represent one hierarchy Includes subtypes
Can contain multiple exclusive paths sharing some levels Can contain multiple exclusive paths sharing some levels
Root and Leaf are the same for all paths Non-strict hierarchies
Stereotype
Criterion comment
Root and Leaf classes RollUpTo{cl -* lp) , RollUpTo(cl* —» lp) associations RollUpTo{cO* -» lp) ,and RollUpTo(c0..1 —> lp) associations Root and Leaf classes
Generalization
XOR constraint
RollUpTo(cV -» lp), RollUpTo(cO* -> lp), RollUpTo(cl -> lp) , RollUpTo{c0..1 - • lp), RollUpTo{cV -> 0..1p), RollUpTo(cO* - • 0..1p),
•RollUpTo(cl - • 0..1p), and RollUPTo{c0..1 -* lp), Root and Leaf classes
RollUpTo{cl* -+ l*p), RollUpTo{cO* - • \*p), RollUpTo{cl -> l*p), and RollUpTo{c0..1 - • l*p)
OCL
Just one criterion
Just one Root and one Leaf Only these associations are allowed
Only these associations are allowed
Just one Root and one Leaf
Generalization can be used in Categorization package with RollUpTo associations At least two XOR constraints in Generalized package
Only these associations are allowed
Just one Root and one Leaf
Only these associations are allowed
Table 3.2: UML/OCL properties for Simple hierarchies
76
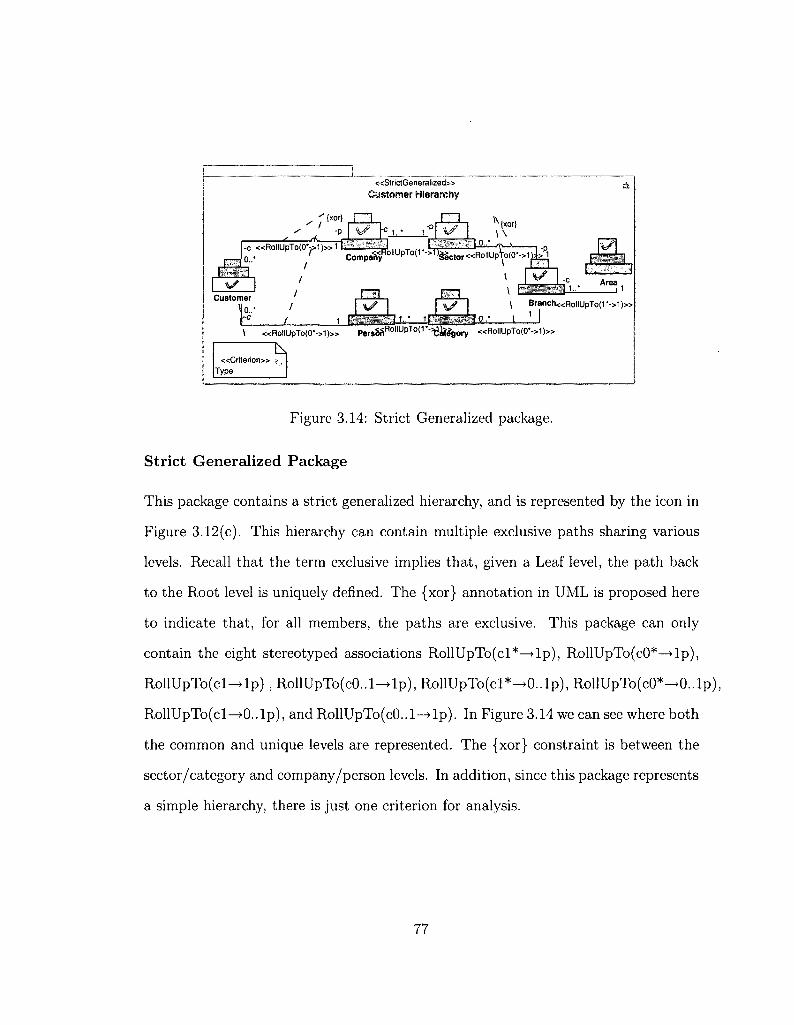
«StrictGeneralized»
Customer Hierarchy
•" / (xor) l~ l £11 lx(xor)
W -c «RoiiupTo(oyi)»i L L . f
.mm. Customer
/
°(1'->1)j>Mnr«RollUpTo(0-->1)J>P1
\
CompaW1 O H U p T o ( r"> 1 ,^ctor<<R^Up1ro(0' ->l} i>^ mm HML %/
EfTl \ ( '-«y -••i'l i..* Area ,
\ Branch«Rol lUpTo(r->1)»
1 K'.YV&BVI.LL: 1 ^ 1 1 '
\ «RollUpTo(0*->1)» Per»8aR o l l U p T o ' r- !6aWBory «RollUpTo(0'->1)»
T \ «Criterion>
Type
Figure 3.14: Strict Generalized package.
Strict Generalized Package
This package contains a strict generalized hierarchy, and is represented by the icon in
Figure 3.12(c). This hierarchy can contain multiple exclusive paths sharing various
levels. Recall that the term exclusive implies that, given a Leaf level, the path back
to the Root level is uniquely defined. The {xor} annotation in UML is proposed here
to indicate that, for all members, the paths are exclusive. This package can only
contain the eight stereotyped associations RollUpTo(cl*—>lp), RollUpTo(cO*—>lp),
RollUpTo(cl-^lp) , RollUpTo(c0..1-»lp), RollUpTo(cl*-»0..1p), RollUpTo(cO*->0..1p)
RollUpTo(cl—>0..1p), and RollUpTo(c0..1-->lp). In Figure 3.14 we can see where both
the common and unique levels are represented. The {xor} constraint is between the
sector/category and company/person levels. In addition, since this package represents
a simple hierarchy, there is just one criterion for analysis.
77
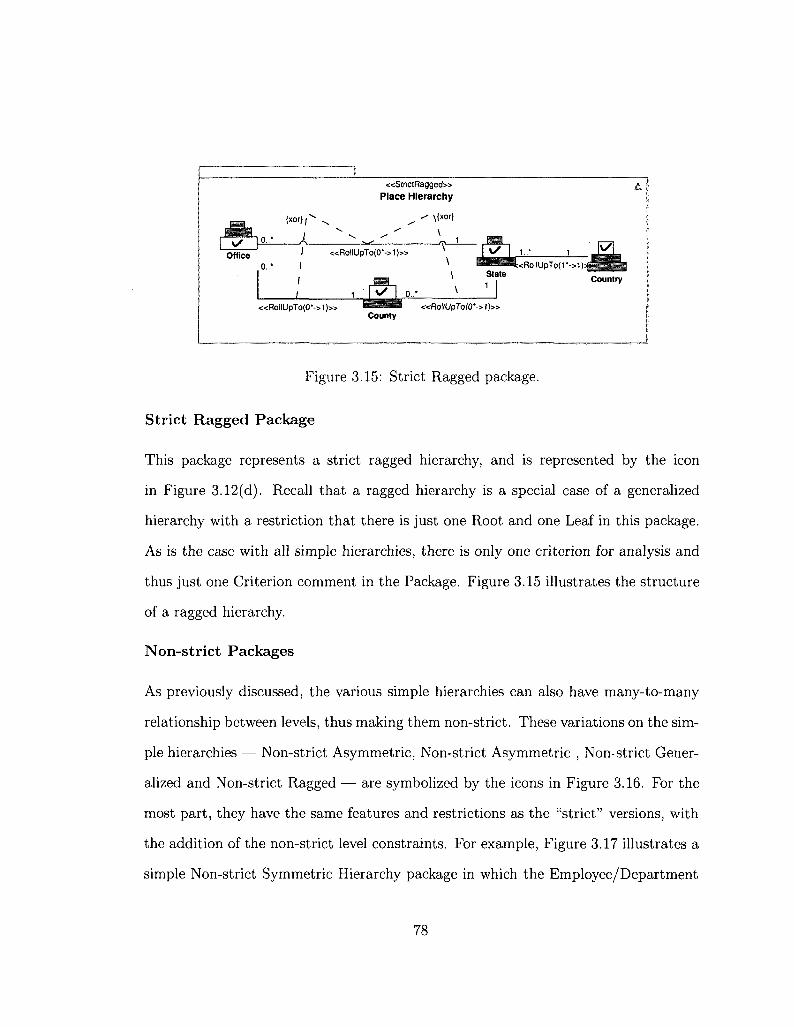
«StriotRagged» Place Hierarchy
\
<RollUpTo(1 *->1 ) = J H B H I \ State _
/ WW < I Country i,npn,°-- N I
«RollUpTo(0*->1)» MlBitiii «ROIIUPTO(0*->1)» County
Figure 3.15: Strict Ragged package.
Strict Ragged Package
This package represents a strict ragged hierarchy, and is represented by the icon
in Figure 3.12(d). Recall that a ragged hierarchy is a special case of a generalized
hierarchy with a restriction that there is just one Root and one Leaf in this package.
As is the case with all simple hierarchies, there is only one criterion for analysis and
thus just one Criterion comment in the Package. Figure 3.15 illustrates the structure
of a ragged hierarchy.
Non-strict Packages
As previously discussed, the various simple hierarchies can also have many-to-many
relationship between levels, thus making them non-strict. These variations on the sim
ple hierarchies — Non-strict Asymmetric, Non-strict Asymmetric , Non-strict Gener
alized and Non-strict Ragged — are symbolized by the icons in Figure 3.16. For the
most part, they have the same features and restrictions as the "strict" versions, with
the addition of the non-strict level constraints. For example, Figure 3.17 illustrates a
simple Non-strict Symmetric Hierarchy package in which the Employee/Department
0..'
Office «RollUpTo(0*->1)»
78

(a) (b) (c) (d)
Figure 3.16: Hierarchy icons for (a) Non-strict Symmetric (b) Non-strict Asymmetric (c) Non-strict Generalized (d) Non-strict Ragged
«NonStrictSymmetric» Employee Hierarchy
Employee \
RollUpTo(1*->1' -^fr%/
1..* 1..* «RollUpTo(1 *->1 )>>»»Bai<Ro|IUpTo(1 '->1 )>l
Department Division Area
" ^ «Criterion» j -
Employee
Figure 3.17: A non-strict version of a Simple Symmetric hierarchy.
aggregation relationship is defined as RollUpTo(cl* —> 1 * p). We will not list each
of the other Non-strict variations as their structure is quite similar.
Multiple Inclusive Package
This package defines the multiple inclusive hierarchy, and is represented by the icon
in Figure 3.19(a). Again, in a multiple inclusive hierarchy, several non-exclusive
simple hierarchies share levels. Just one Criterion can be used in this package since
these simple hierarchies account for the same analysis criterion. The stereotyped
association class Measure Distribution is proposed to represent the requirement to
define a distribution of the measure across the shared level(s). As seen in Figure 3.18
79

«Multiplelnclusive» Comitee Hierarchy
-P XZL «RollUpTo(1*->1)» 1
1..
^lWMi#I
Sport Club|
Recreation Program
t «MeasureDistribution»h- — -
MM. 1..
«RollUpTo(1*->1)>^P
Sport Association
«RollUpTo(1*->1)» 1
Regional Commitee 1 l " p
<RollUpTcl(1'-> '•>!)» «MeasureDistribution»
«Dislribution»-Sport Association = 45 «Distrlbution»-Recreation Program = 5|
Figure 3.18: Multiple Inclusive package.
cS (a) (b) (c) (d)
Figure 3.19: Hierarchy icons for (a) Multiple Inclusive (b) Multiple Alternate (c) Parallel Independent (d) Parallel Dependent
Measure Distribution is used between Sport Association and Recreation Program.
Table 3.3 summarizes the unique properties of complex hierarchies (Multiple and
Parallel) and how OCL and UML can be used to represent these properties.
Multiple Alternative Package
This package represents a multiple alternative hierarchy, and is represented by the
icon in Figure 3.19(b). Again, just one Criterion can be used in this package since
all included simple hierarchies account for the same analysis criterion. An example is
given in Figure 3.20, where two alternate Time hierarchies are illustrated. Unlike the
80
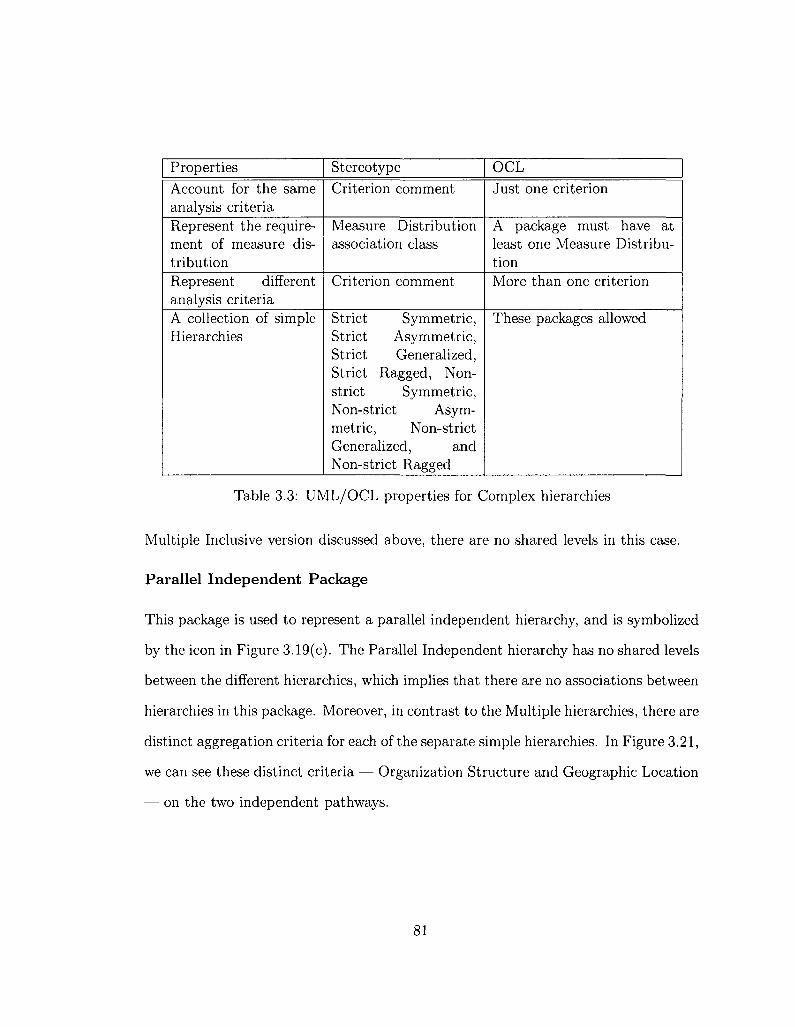
Properties
Account for the same analysis criteria Represent the requirement of measure distribution Represent different analysis criteria A collection of simple Hierarchies
Stereotype
Criterion comment
Measure Distribution association class
Criterion comment
Strict Symmetric, Strict Asymmetric, Strict Generalized, Strict Ragged, Non-strict Symmetric, Non-strict Asymmetric, Non-strict Generalized, and Non-strict Ragged
OCL
Just one criterion
A package must have at least one Measure Distribution More than one criterion
These packages allowed
Table 3.3: UML/OCL properties for Complex hierarchies
Multiple Inclusive version discussed above, there are no shared levels in this case.
Parallel Independent Package
This package is used to represent a parallel independent hierarchy, and is symbolized
by the icon in Figure 3.19(c). The Parallel Independent hierarchy has no shared levels
between the different hierarchies, which implies that there are no associations between
hierarchies in this package. Moreover, in contrast to the Multiple hierarchies, there are
distinct aggregation criteria for each of the separate simple hierarchies. In Figure 3.21,
we can see these distinct criteria — Organization Structure and Geographic Location
— on the two independent pathways.
81
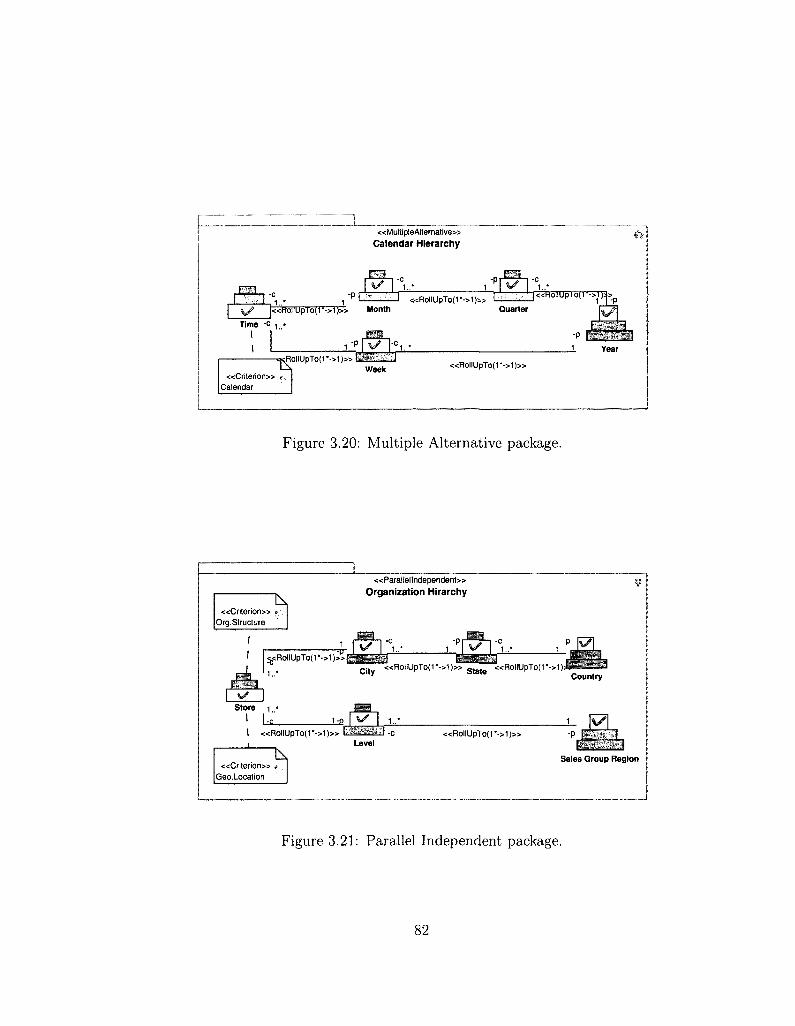
«MultipleAlternative»
Calendar Hierarchy M
%/ Bri.:. , T ^
^ / « H o i l U p I o ( r - > l ) » Month
-p I **; v I -c 1 U / 1..-
«RollUpTo(1 ->1)» I. :.-.•;•'•—i K 1 y -p Quarter
Time -c !
I I "
«RollUpTo(1 -->1)» BwSaSv'rVf l A Week
-P r>;'y;'g.sa _1 Year
«Cr i ter ion» t.. Calendar
«Rol lUpTo(r ->1)»
Figure 3.20: Multiple Alternative package.
T\ «Cr i te r ion» <
Org.Structure
«Parallellndependent»
Organization Hirarchy
1..* <,<RollUpTo(1*->1): ' . C i t y «Ro l lUpTo( r ->1 )» s t a t e «RollUpTo(1*->1):
Country
Store 1
_bB I ^ I «RoiiupTo(r->i)» KlSSSifciii~
_l Level «RollUpTo(1*->1)»
«Cr i te r ion» r Geo.Location
fe.':.:...-y.< Sales Group Region
Figure 3.21: Parallel Independent package.
82
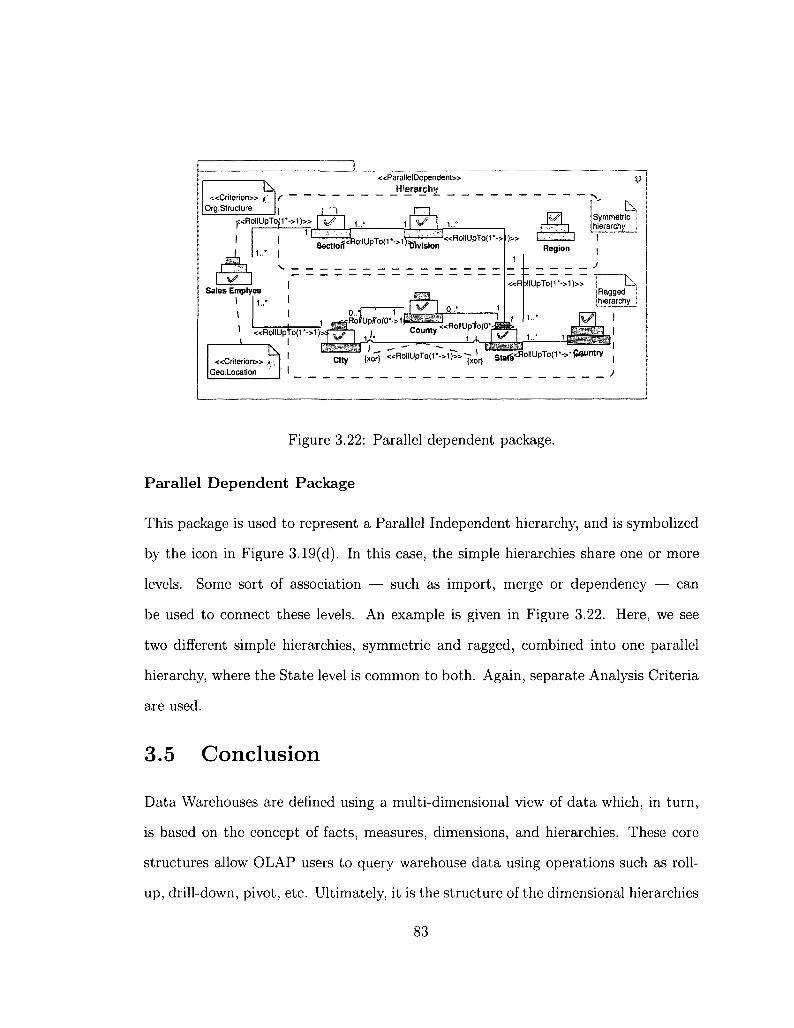
T \ «Cr i ter ion»
Org. Structure
f<RollUpTal1'->1)» I y ? I ,
I %}
«ParallelDependent»
_ _Hierarchj{_ _
i h ^ l 1..
Sales Emplyee I
^ « P T * ' - > © < M W , ' 1
r'"'my
p^o(r -> i )> f 1 « R o l l U p T o ( r - > 1 ) > i 7 ? I
j „ | JJiC—L^
of- '—— i y i o-- ; County
Region
1 Symmetric | [Nerarchy__j
I
I
J
«RbllUpTo(1 •->!)> Ragged \ hierarchy!
«Cr i ter ion» ,<-•, Geo. Location
^ ^ ( x o T ) «Rol lUpTo(f->1);>-(-J r ) S t t 6<Rol lUpTo(r->1 gauntry (
Figure 3.22: Parallel dependent package.
Parallel Dependent Package
This package is used to represent a Parallel Independent hierarchy, and is symbolized
by the icon in Figure 3.19(d). In this case, the simple hierarchies share one or more
levels. Some sort of association — such as import, merge or dependency — can
be used to connect these levels. An example is given in Figure 3.22. Here, we see
two different simple hierarchies, symmetric and ragged, combined into one parallel
hierarchy, where the State level is common to both. Again, separate Analysis Criteria
are used.
3.5 Conclusion
Data Warehouses are defined using a multi-dimensional view of data which, in turn,
is based on the concept of facts, measures, dimensions, and hierarchies. These core
structures allow OLAP users to query warehouse data using operations such as roll-
up, drill-down, pivot, etc. Ultimately, it is the structure of the dimensional hierarchies
83

that drives such analysis, as the particular definition permits analysis on the basis
of criteria such as company organization, geographic location, product category or
time. Despite their significance, however, current OLAP systems can support only a
limited number of the hierarchy forms commonly found in real-world applications.
In complex design environments such as this, graphical representations greatly fa
cilitate the understanding of application requirements. This chapter has presented a
conceptual multidimensional model based on a profile extension of the standard UML
notation. The proposal has built upon the hierarchies defined in [44, 45], taking into
account their differences at the schema level. The new profile essentially consists of
a series of new stereotypes that specialize packages, classes, and associations for the
OLAP domain. Where necessary, logical constraints are placed upon the elements
through the use of the OCL formal language. Both simple and complex hierarchies
have been considered. In the former case, simple hierarchies — including symmetric,
asymmetric, generalized, and ragged — allow the designer to model standard tree-
based hierarchies. Options for both strict and non-strict variations are provided. In
the latter case, complex hierarchies are specialized into multiple and parallel varia
tions, and allow the designer to incorporate multiple simple hierarchies into the same
conceptual structure.
As we will see in the next chapter, the new profile is integrated into the MagicDraw
development environment, one of the leading UML design tools. The addition of
new images and icons ultimately allows the designer to construct new models in an
intuitive, drag-and-drop manner.
84

Chapter 4
OLAP Modeling Environment
4.1 Introduction
In the previous chapter we described how we utilize UML to represent the properties
of multidimensional environments by mean of a UML profile that holds a collection
of defined stereotypes. A set of UML extension mechanisms (stereotypes, tagged
values and constraints) has been used for specializing UML elements to represent
various OLAP concepts. In the current chapter we will show how the profile defined
in Chapter 3 is used to create a more robust "OLAP Modeling Environment" (OME).
In other words, our objective is to incorporate the modeling theory into a development
environment that can be intuitively exploited by designers with a solid understanding
of OLAP fundamentals, but perhaps limited exposure to the nuances of UML.
This chapter is organized as follows. Section 4.2 provides a general overview of
the key features of the MagicDraw UML tool, including the use of domain specific
extensions. Section 4.3 discusses the implementation of the "OLAP modeling Envi
ronment" , followed in Section 4.4 by a small case study that shows how our design
guidelines are applied. Conclusions are then provided in Section 5.
85
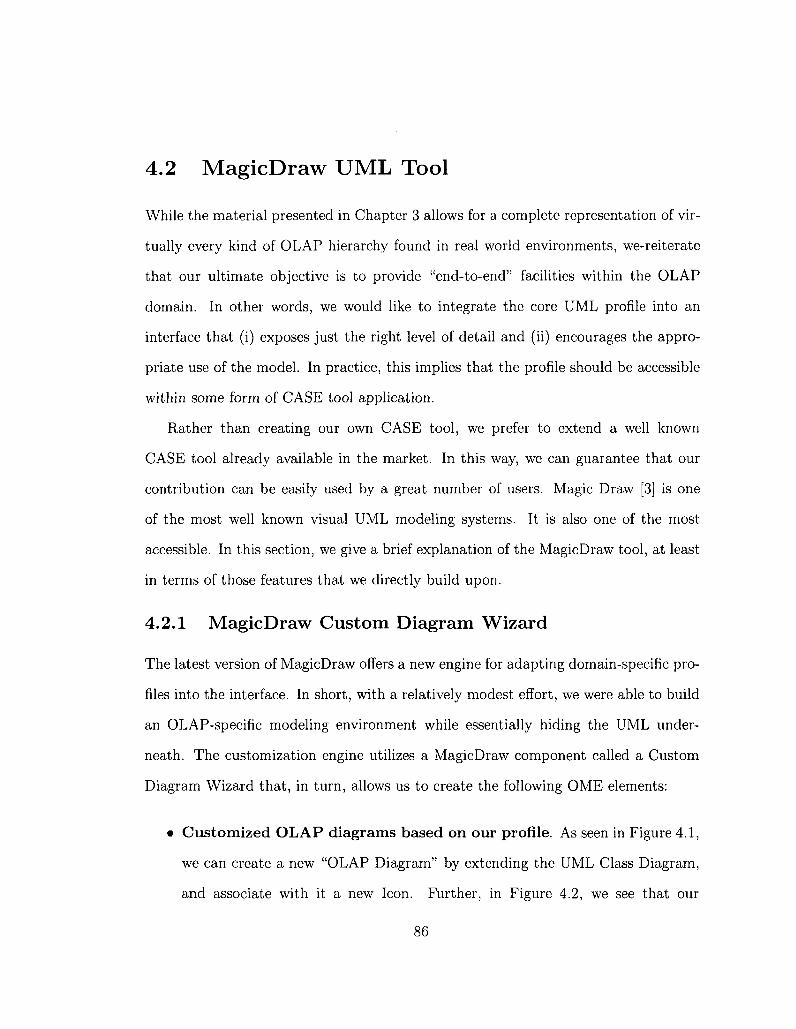
4.2 MagicDraw UML Tool
While the material presented in Chapter 3 allows for a complete representation of vir
tually every kind of OLAP hierarchy found in real world environments, we-reiterate
that our ultimate objective is to provide "end-to-end" facilities within the OLAP
domain. In other words, we would like to integrate the core UML profile into an
interface that (i) exposes just the right level of detail and (ii) encourages the appro
priate use of the model. In practice, this implies that the profile should be accessible
within some form of CASE tool application.
Rather than creating our own CASE tool, we prefer to extend a well known
CASE tool already available in the market. In this way, we can guarantee that our
contribution can be easily used by a great number of users. Magic Draw [3] is one
of the most well known visual UML modeling systems. It is also one of the most
accessible. In this section, we give a brief explanation of the MagicDraw tool, at least
in terms of those features that we directly build upon.
4.2.1 MagicDraw Custom Diagram Wizard
The latest version of MagicDraw offers a new engine for adapting domain-specific pro
files into the interface. In short, with a relatively modest effort, we were able to build
an OLAP-specific modeling environment while essentially hiding the UML under
neath. The customization engine utilizes a MagicDraw component called a Custom
Diagram Wizard that, in turn, allows us to create the following OME elements:
• Customized OLAP diagrams based on our profile. As seen in Figure 4.1,
we can create a new "OLAP Diagram" by extending the UML Class Diagram,
and associate with it a new Icon. Further, in Figure 4.2, we see that our
86
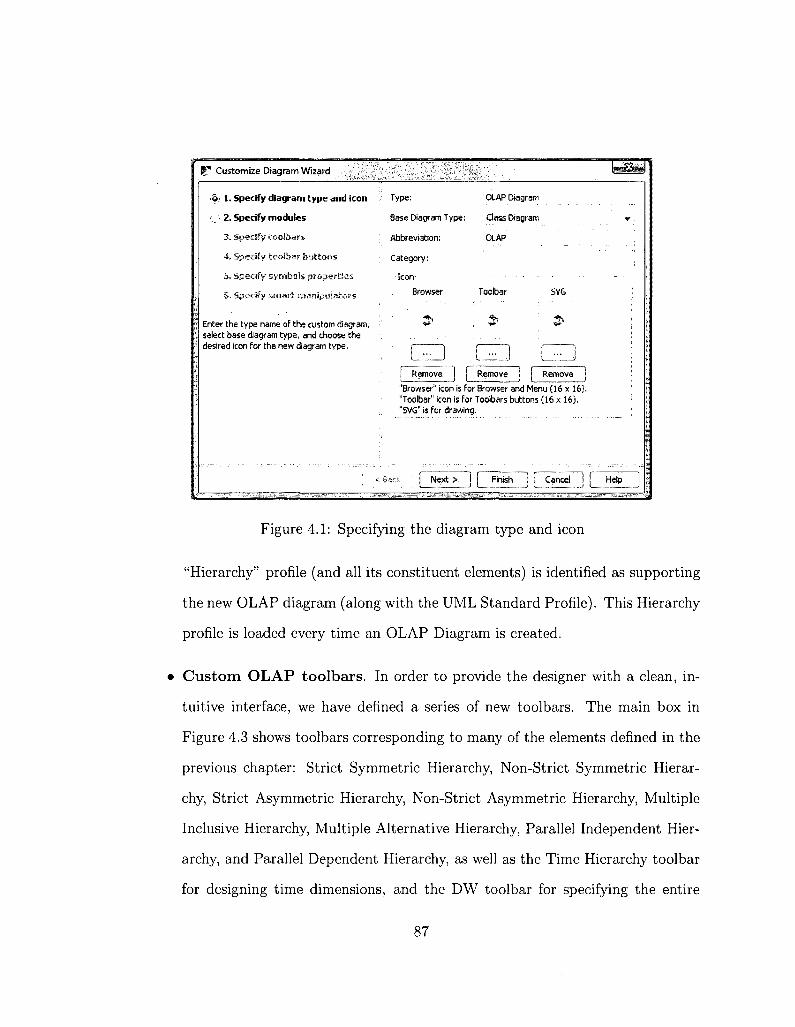
K" Customize Diagram Wizard
6 1. Specify diagram type and icon
':• 2. Specify modules
3. Specify toofcars
4. Specify toolbar buttons
5. Specify symbols properties
6. Specify smart manipulatore
Enter the type name of the custom diagram, select base diagram type, and choose the desired icon for the new diagram type.
Type;
Base Diagram Type
Abbreviation:
Category:
Icon-
Browser
^P
1 Remove 1
OLAP Diagram
: Class Diagram
OLAP
:
Toolbar SVG
| ... J | ... j 1 Remove Remove
"Browser" icon is for 8rowser and Menu (16 x 16) "Toolbar" icon is for Toolbars buttons (16x16). "SVG" is for drawing.
Figure 4.1: Specifying the diagram type and icon
"Hierarchy" profile (and all its constituent elements) is identified as supporting
the new OLAP diagram (along with the UML Standard Profile). This Hierarchy
profile is loaded every time an OLAP Diagram is created.
• Custom OLAP toolbars. In order to provide the designer with a clean, in
tuitive interface, we have defined a series of new toolbars. The main box in
Figure 4.3 shows toolbars corresponding to many of the elements defined in the
previous chapter: Strict Symmetric Hierarchy, Non-Strict Symmetric Hierar
chy, Strict Asymmetric Hierarchy, Non-Strict Asymmetric Hierarchy, Multiple
Inclusive Hierarchy, Multiple Alternative Hierarchy, Parallel Independent Hier
archy, and Parallel Dependent Hierarchy, as well as the Time Hierarchy toolbar
for designing time dimensions, and the DW toolbar for specifying the entire
87

§•" Customize Diagram Wizard
( j 1. Specify diagram type and icon
o 2. Specify modules
Q 3. Specify toolbars
4. Specify toolbar buttons
5. Spedfy symbols properties
6. Specify smart manipulators
Manage modules you want to use in the new diagram type.
Modules that will be used in new diagram type:
EgUML Standard ProFile.xml
Add Remove Diagram Stereotype
< Back Next > Finish Cancel Help
Figure 4.2: Specifying the module

I f Customize Diagram Wizard
• - I . Specify d iagram type and icon JTooibsr Open:L A d d T o c i b a r ' CS New Toolbar
j"*".. Common (from Any Diagram)
Pi- Profiling Mechanism (from Clai5 Diagram) I R^"0** JJJ C | a j ! D i a g r a m / f r o m artj,. Diagram)
*o Uje Case Diagram (from Static Diagram)
*% Implementation Diagram (from Static Diagram)
L Down gfe compos i te Structure Diagram ( f rom Static Diagram)
' l r In fo rmat ion Flows ( f rom Static Diagram)
' < Back ; [ Next > "j \ Finish I i" Cancel j ! Help ]
Figure 4.3: Specifying the associated toolbars
DW schema.
• Custom OLAP toolbar buttons for stereotyped element creation. Each
toolbar has its own buttons that are stereotyped based on the UML "Hierarchy"
profile. The Strict Asymmetric Hierarchy toolbar, for example, is shown in
Figure 4.4. Here, we see only buttons/icons relevant to that particular type
of hierarchy: Root, Level, Leaf, Criterion and several RollUpTo entries, each
corresponding to a distinct cardinality. Figure 4.5 illustrates the dialogue that
allows us to further customize each button.
• Custom smart manipulators. Smart manipulators are special symbols that
appear in a popup window when a stereotype is selected in the diagram. For
example, as illustrated in Figure 4.6, when selecting the stereotyped class Di
mension, the suggested relationship will be a Dimensioning association or a
Hierarch association. We see how to define the popups in Figure 4.7, where the
suggested relationships are Dimensioning and Association, and the suggested
•',. • 2 . Specify modules
•.©• 3 . Specify toolbars
4. Specify toofoar buttons
'>, Spec i fy sn-KH-S s'ii~:tr> £!«*.;!?'>?,*
Choose diagram toolbars.
t? „ _ - DW
j tt Strict Symmetric Hierarchy \ H Won Strict Symmetric Hierarchy | }"• Strict Asymmetric Hierarchy A Non Strict Asymmetric Hierarchy A Strict GeneraBzed Hierarchy 'f. Nan Strict Generalized Hierarchy
i i ; Multiple Inclusive Hierarchy •£; Multiple Alternative Hierarchy V ParaHel Independent Hierarchy V Parallel Dependent Hierarchy •!• Time Dimension
89

f " Customize Diagram Wizard jjMSHHffl
'". 1. Specify diagram type and icon
"• 2. Specify modules
•; 3. Specify toolbars
••©"• 4. Specify toolbar buttons
•['•5. Specify symbols properties
Choose diagram toolbars buttons you want to use in the diagram.
Toolbar: Strict Asymmetric Hierarchy
•- !*• Strict Asyinmetric - A Root - S f - e v e ! ™ * leaf
*?. Criterion $• RoBUpTo(cl->lp)
~-y» RollUpTo(cl*->lp) --^>RoOUpTo(cO.,l->lp)
< Back ] j Next > 1 { Finish ] | Cancel ] [ Help
C$ New Button
"3$ New Group
Cli Common
! !tBj! Cia;; Diagram
!§S ^;e ^ 3 i e Diagram
' $SBj Implementation Diagram
! $1$ Composite Structure Diagram
' yH Profiling Mechanism
I ijSj Information Flows
Figure 4.4: Specifying the associated toolbar buttons
I ' Edit Button
i general h Symbol Properties Stereotypes Element Properties j
Model Element Type: Association
Description; JRollUpTo(cl->lp)
Shortcut:
Icon
Toolbar
y "
R.e>nov» ;
It is recommended to use a scalable icons of size (16x16) for'
•" ! List as element
OK Cancel
Figure 4.5: Editing buttons
90

«Dimension» =
«Diffiension» «Dimensioning» ••'- • • " C »
«Fact» m
Figure 4.6: Smart manipulators
targets are Leaf and Fact.
4.2.2 Creating domain-specific meta models
In this research, we have proposed the use of UML to create an object-oriented
conceptual model for data warehousing and OLAP systems. Even though UML is a
general modeling language, it can, as we've seen, be customized to a specific problem
domain via the use of stereotypes, tagged values and constraints. However, because
UML is a general purpose notation, this same generic quality may limit its suitability
for OLAP modeling in that our new stereotypes only extend an existing element of
the UML language. Ultimately, the semantics and appearance of the element remains
the same. For example, if we apply a stereotype to a package, the stereotyped element
is still just a basic UML package that just has the additional properties defined by
the applied stereotype. In other words, applying stereotypes to an element does not
hide the various UML properties, such as those defined in Figure 4.8.
91
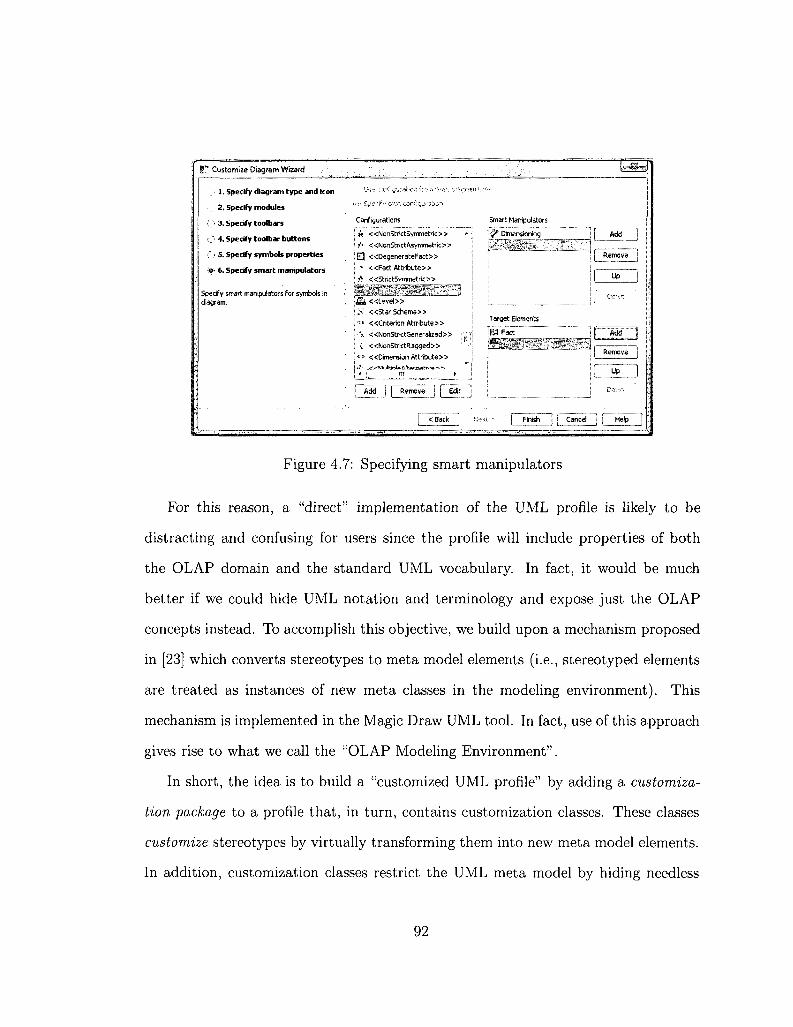
S * Customize Diagram Wizard
> I . Specify diagram type and icon
2. Specify modules
O 3- Specify toolbars
O 4. Specify toolbar buttons
O 5. Specify symbols properties
•:e>> 6. Specify smart manipulators
Specify smart manipulators for symbols in diagram.
1
Configurations Smart Manipulators
; « <<Non5trictSymmetric>> *•
\ f' «NonStrictAsynimetric>>
|FJ3 «DegenerateFact>>
1 f « F a c t Attribute>>
1 £• «St r i c t5vmmet r ic»
-£U « L e v e l > >
I v*" Dimensioning
I X «StarSchema>>
\'<* <<Cri ter ionAttr ibute»
\-\ <<NonStrictGeneralized>>
Target Elements
U Fact
1 i «NonSt r ic tRaaaed» , f £ i £ V , • . * . ,
j « * <<Dimension Attribute>>
! < 1 Err : •
[ Add j [ Remove j [ Edit
j < Back J j Finish j Cancel
W?$&B]
i Add "2
i Remove
I Up ~ ] •
I Remove J
i * J ,
] Help j :
Figure 4.7: Specifying smart manipulators
For this reason, a "direct" implementation of the UML profile is likely to be
distracting and confusing for users since the profile will include properties of both
the OLAP domain and the standard UML vocabulary. In fact, it would be much
better if we could hide UML notation and terminology and expose just the OLAP
concepts instead. To accomplish this objective, we build upon a mechanism proposed
in [23] which converts stereotypes to meta model elements (i.e., stereotyped elements
are treated as instances of new meta classes in the modeling environment). This
mechanism is implemented in the Magic Draw UML tool. In fact, use of this approach
gives rise to what we call the "OLAP Modeling Environment".
In short, the idea is to build a "customized UML profile" by adding a customiza
tion package to a profile that, in turn, contains customization classes. These classes
customize stereotypes by virtually transforming them into new meta model elements.
In addition, customization classes restrict the UML meta model by hiding needless
92

i * Items Filter k* •sSs
General
JW
i '£,
IS
.
-.
B - •• C j Properties •*
" f 1 L j Active Hyperlink , !
"'!..] 0 Applied Stereotype Instance ! ;
•••• [- j Q APPLIED_PROFILES
""!.;..! Q APPLIED_STEREOTYPES
"" [ ] [ j Client Dependency i 1
••- ! 1 Q Element Import ! " '
"' L J 0 Imported Member
•••• i " ! Q Member i
•••' n D SB "" [Zl Q Name Expression
j
CD 0 Namespace -'
• [ J L J Nested Package
' t 1 Q Nesting Package
• i l l 0 Owned Comment
> | | Q Owned Diagram
• 1 Q Owned Element
> ! j Q Owned Member
• 1 | Q Owned Rule
(press
...
i " I Q Owned Template Signature ~
SHIFT and click to select recursively)
| Select All ] [ UnselectAI
— OK j f Cancel ] [ Help
- J
Figure 4.8: UML properties
93
restricts
V
UMLMetamodel UML Profile Customization
Transforms into metamodel
Figure 4.9: The customization layer
Tag name
customizationTarget
representationText
usedUMLProperties
suggestedOwnedDiagrams suggestedOwnedTypes possibleOwners
Description
The stereotype for which the customization applies Alternative name to be used in the modeling environment Standard properties of the UML element to be used by the customized element Diagrams that should be suggested Elements that should be suggested Possible owners of the customized element
Table 4.1: Customization stereotype tags
parts and enabling certain rules that improve the usability of the interface (as previ
ously noted, hierarchy constraints are specified with OCL). Figure 4.9 illustrates how
the customization layer relates to the UML profile and UML meta model.
The customization layer itself is constructed primarily upon the <cCustomization3>
and <CvalidationRule;s> stereotypes. Briefly, a ^Cus tomiza t ion^ stereotype is used
for customizing the appearance of the stereotyped element. Table 4.2 includes the
properties (tags) of the -^Customization^ stereotype that have been used in our re
search. A <CvalidationRule» stereotype, on the other hand, represents a constraint
for validating the correctness and completeness of the user model. Table 4.2 summa
rizes the various properties (tags) of the <^validationRule3> stereotype.
94
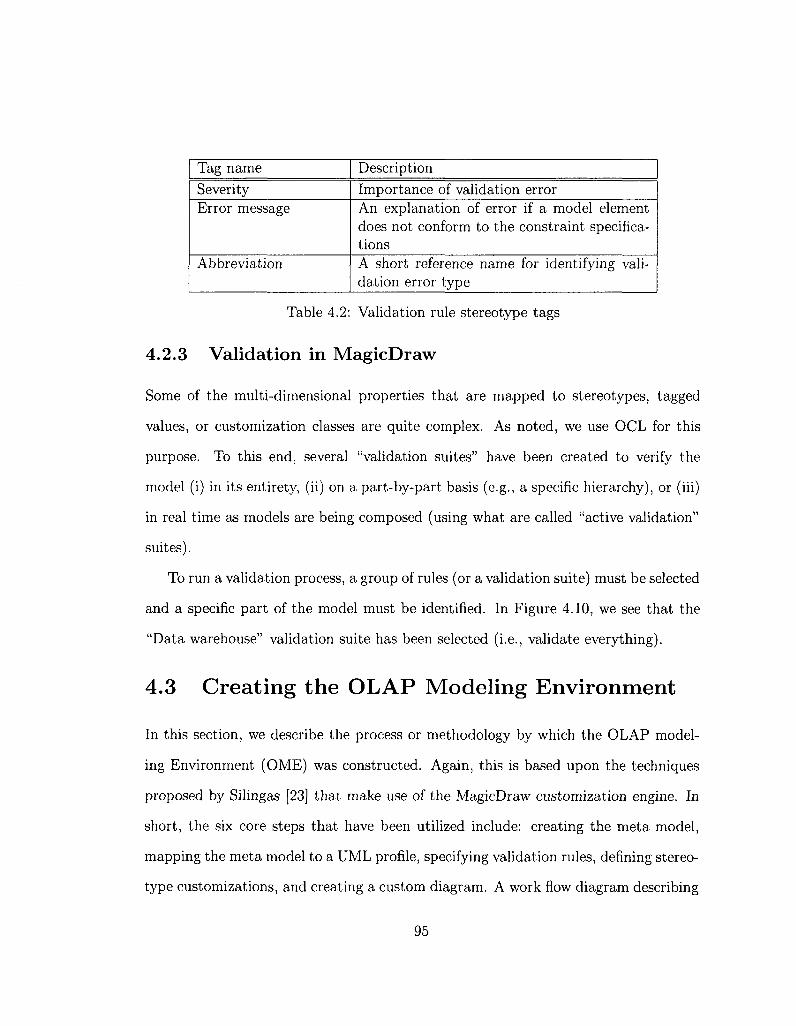
Tag name
Severity Error message
Abbreviation
Description
Importance of validation error An explanation of error if a model element does not conform to the constraint specifications A short reference name for identifying validation error type
Table 4.2: Validation rule stereotype tags
4.2.3 Validation in MagicDraw
Some of the multi-dimensional properties that are mapped to stereotypes, tagged
values, or customization classes are quite complex. As noted, we use OCL for this
purpose. To this end, several "validation suites" have been created to verify the
model (i) in its entirety, (ii) on a part-by-part basis (e.g., a specific hierarchy), or (iii)
in real time as models are being composed (using what are called "active validation"
suites).
To run a validation process, a group of rules (or a validation suite) must be selected
and a specific part of the model must be identified. In Figure 4.10, we see that the
"Data warehouse" validation suite has been selected (i.e., validate everything).
4.3 Creating the OLAP Modeling Environment
In this section, we describe the process or methodology by which the OLAP model
ing Environment (OME) was constructed. Again, this is based upon the techniques
proposed by Silingas [23] that make use of the MagicDraw customization engine. In
short, the six core steps that have been utilized include: creating the meta model,
mapping the meta model to a UML profile, specifying validation rules, defining stereo
type customizations, and creating a custom diagram. A work flow diagram describing
95
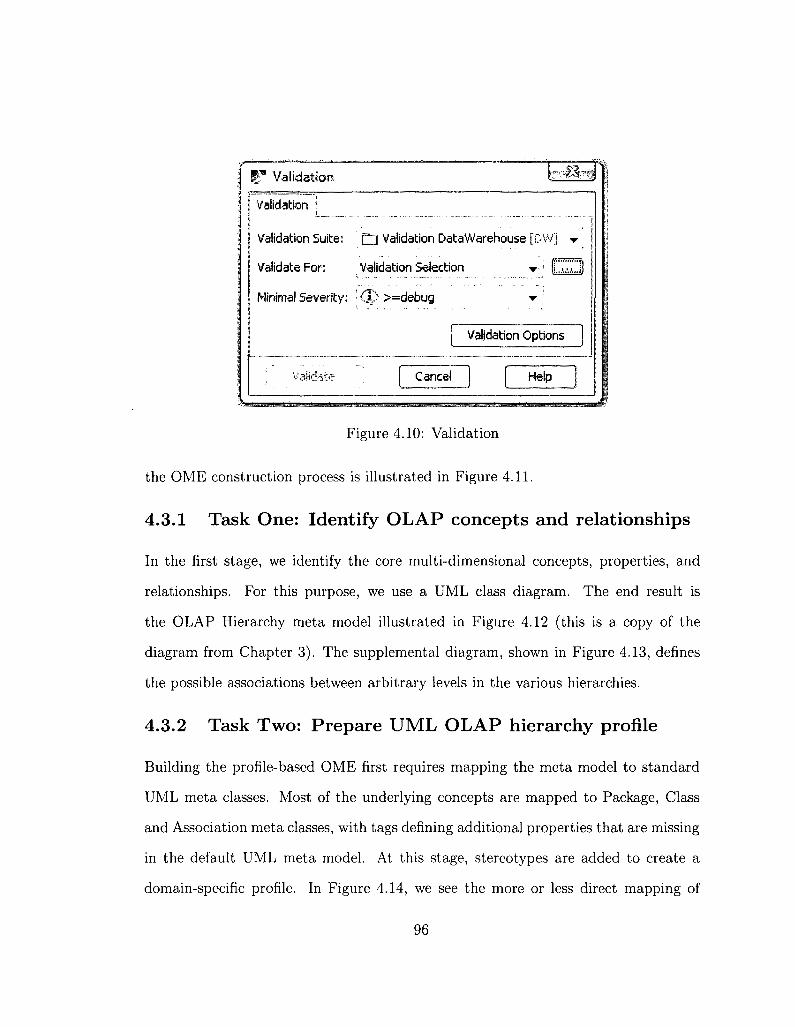
W Validation 1%,
Validation j
Validation Suite: Q Validation DataWarehouse [DW] •
Validate For: Validation Selection •»••> E Z l
Minimal Severity: ' CJ) >=debug • ;
Validation Options
validw Cancel Help
Figure 4.10: Validation
the OME construction process is illustrated in Figure 4.11.
4.3.1 Task One: Identify OLAP concepts and relationships
In the first stage, we identify the core multi-dimensional concepts, properties, and
relationships. For this purpose, we use a UML class diagram. The end result is
the OLAP Hierarchy meta model illustrated in Figure 4.12 (this is a copy of the
diagram from Chapter 3). The supplemental diagram, shown in Figure 4.13, defines
the possible associations between arbitrary levels in the various hierarchies.
4.3.2 Task Two: Prepare UML OLAP hierarchy profile
Building the profile-based OME first requires mapping the meta model to standard
UML meta classes. Most of the underlying concepts are mapped to Package, Class
and Association meta classes, with tags defining additional properties that are missing
in the default UML meta model. At this stage, stereotypes are added to create a
domain-specific profile. In Figure 4.14, we see the more or less direct mapping of
96
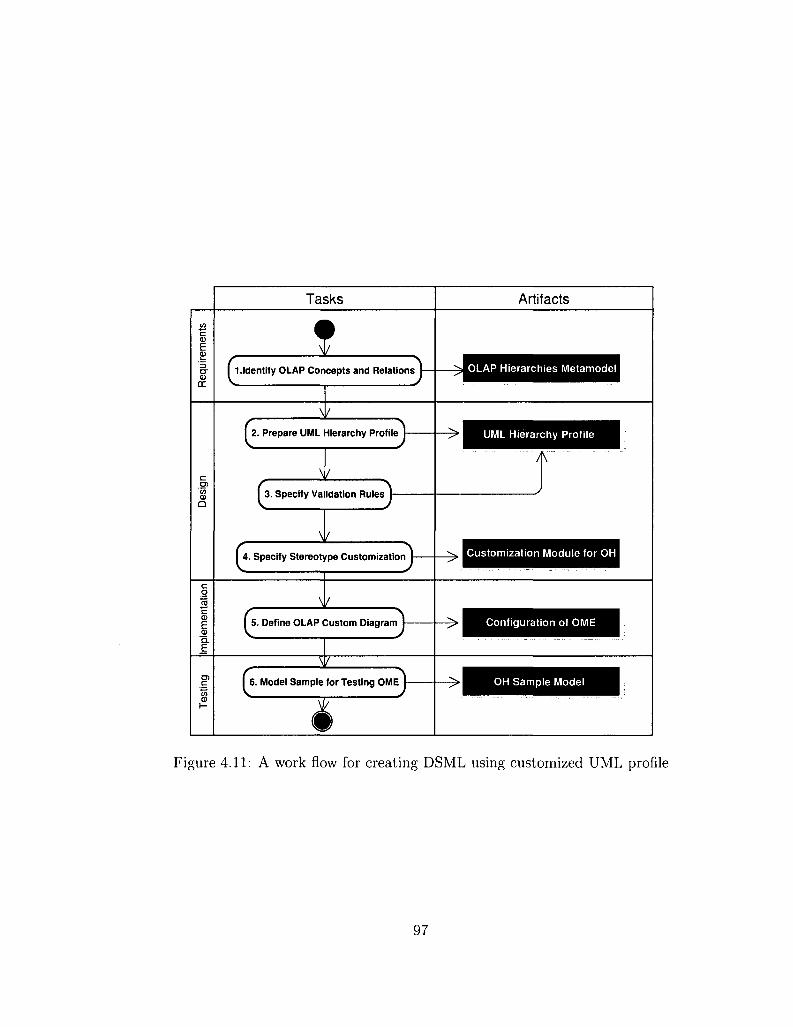
Tasks Artifacts
1 1.Identify OLAP Concepts and Relations OLAP Hierarchies Metamodel
JL 2. Prepare UML Hierarchy Profile - > UML Hierarchy Profile
...
JL 3. Specify Validation Rules
JL 4. Specify Stereotype Customization - > Customization Module for OH
±. 5. Define OLAP Custom Diagram
• > Configuration of OME
3E 6. Model Sample for Testing OME - > OH Sample Model
Figure 4.11: A work flow for creating DSML using customized UML profile
97

D M * * , I | D > n „ l » « M b « . | | OID ~ | | CrH.rt.n | [ R.BUpT. | | D ,m .nslon | |D,,gen<„„edDlm,,n8 lCT
] Mufttple 1
$ 1
Multiple Alternative) |Muttlplelnclustvej
i > | MeasureDlstri button J
< | Dlatrl
> Hill on |
MeasureDlstribution StrtctSym metric Strict Asymmetric StrlctGene rail zed NonStrtctSym metric NonStrlct Asymmetric NonSWctGenerallied
jf~ . ~ . StrtctHagged] | HonSirtct Ragged |
Figure 4.12: The basic hierarchy meta model
StrictSymmetric
IStrlctSymmetrlcM CO..l->lp
d*->l*p
C0..1->1*p |
|strictAsymmelrlc|d>—L-[ ct*->1p"
[NonSirictAaymmBtrte|*,
cl->1p
d'->1p
el->l*p
CV->1*p
c0..1->1'p
SlrictGeneralited;
d-»1p
| c0'->0..1p I
I d->0~1p~|
\ c0..1->0..1p~|
c0..1->1*p
cQ*->1p
o1->1*p
NonStrfctGeneralized M j - | c0..1->1p~
c0*->0..1p
J C0..1->0..1p |
I c1*->1*p
c0*->1*p
Figure 4.13: A detailed look at the "association" model
98
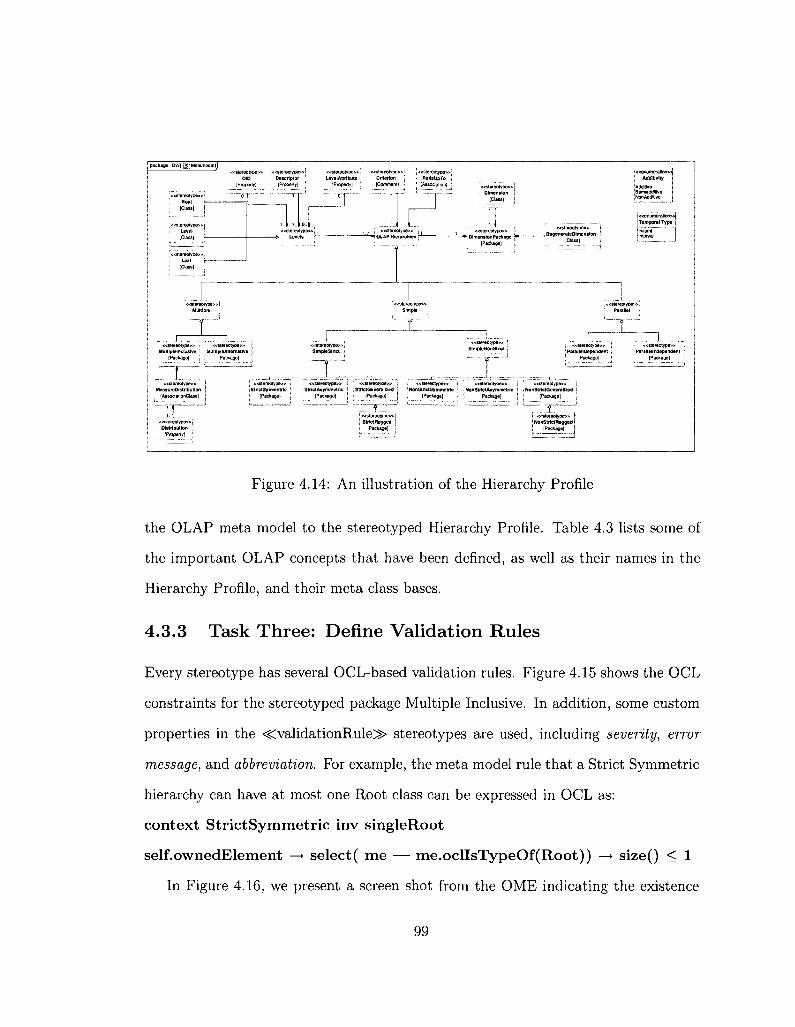
package DW( jj£ Melamodelij
<stereotype»'
[Class| j
<siereotype»j
<SlBreolyoo»,
[Property] :
d. | [Prop.
1 ,1
C
;«siereotype»: Criteria n [Common!)
• Rolls UpTo I ' (Association! j
|«steioolype»> - Dimension j
(Class) \
< ester eoiype» . Multlplelncluslve
[Packagel
«stefeotyoe» j . Multiple Alternative ;
|Package | I
TL.
Additive Semiadeliiive Nofi Additive
<esiB'eolype» i _ Degenerate Dl mention \
[Class) i
«stereolype» \ : Parallel Dependent , \ |Package| •
«ste'eotype» ' : Measure Distribution \
[AssoaationClass] j
< «Kereotype» : «siereotype» \ \ <«stereotype» \ | StrlctSy mrnetrlc • j Strict Asymmetric : j StrictGenerallzed \ \ [Package) \ |PacKage] ; ) [Package) j
<«siereotype» ' NonStrictSym metric ; [Packagel
«slereolyp9>> ; <<slereolype» jNonStrlctAsym metric ' I NonStrictGeneralteed i j | Package] j [Packagel
:«stereotype»; : Distribution
[Property! \
MStereotypeM j i StrlctRagged i ] |PackaQe) I
i «stereotype» J \ NonStrictRagged I ! [Packagel I
«6tereotype» . Para Hell ndependent ;
| Package ]
Figure 4.14: An illustration of the Hierarchy Profile
the OLAP meta model to the stereotyped Hierarchy Profile. Table 4.3 lists some of
the important OLAP concepts that have been defined, as well as their names in the
Hierarchy Profile, and their meta class bases.
4.3.3 Task Three: Define Validation Rules
Every stereotype has several OCL-based validation rules. Figure 4.15 shows the OCL
constraints for the stereotyped package Multiple Inclusive. In addition, some custom
properties in the <CvalidationRule^> stereotypes are used, including severity, error
message, and abbreviation. For example, the meta model rule that a Strict Symmetric
hierarchy can have at most one Root class can be expressed in OCL as:
context StrictSymmetric inv singleRoot
self.ownedElement —> select( me — me.oclIsTypeOf(Root)) —> size() < 1
In Figure 4.16, we present a screen shot from the OME indicating the existence
99
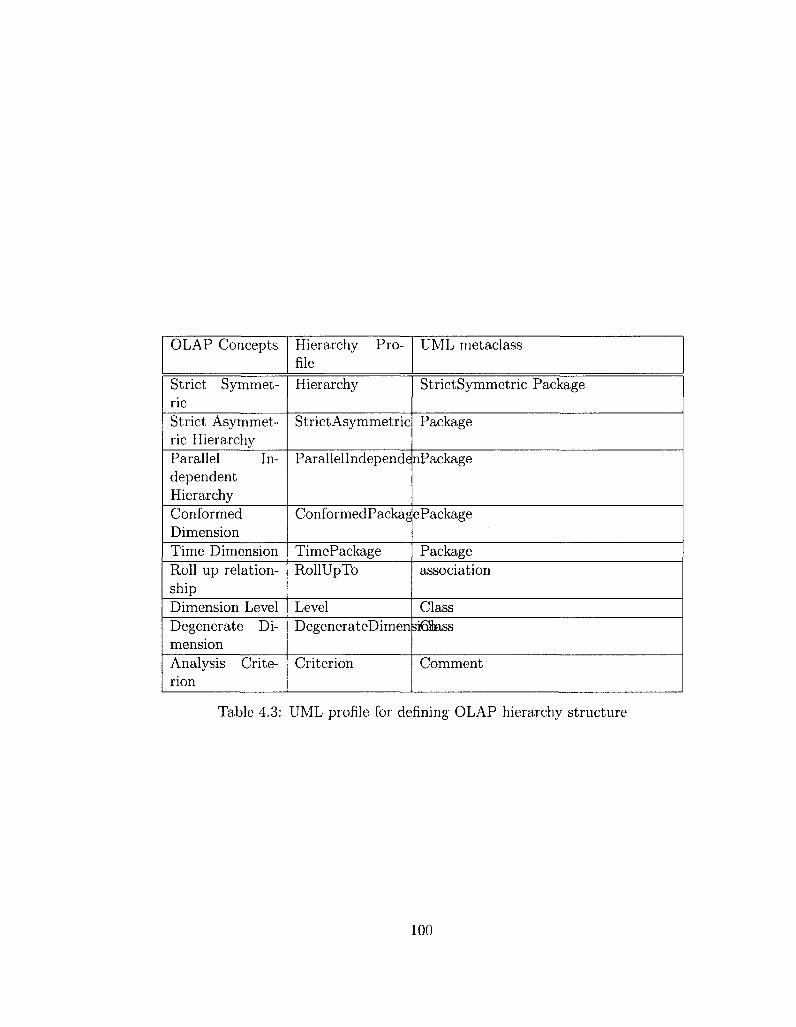
OLAP Concepts
Strict Symmetric Strict Asymmetric Hierarchy Parallel Independent Hierarchy Conformed Dimension Time Dimension Roll up relationship Dimension Level Degenerate Dimension Analysis Criterion
Hierarchy Profile
Hierarchy
Strict Asymmetric
Parallellndepende
ConformedPackag
TimePackage RollUpTo
Level DegenerateDimen
Criterion
UML metaclass
StrictSymmetric Package
Package
nPackage
e Package
Package association
Class 3i6fe,ss
Comment
Table 4.3: UML profile for defining OLAP hierarchy structure
100
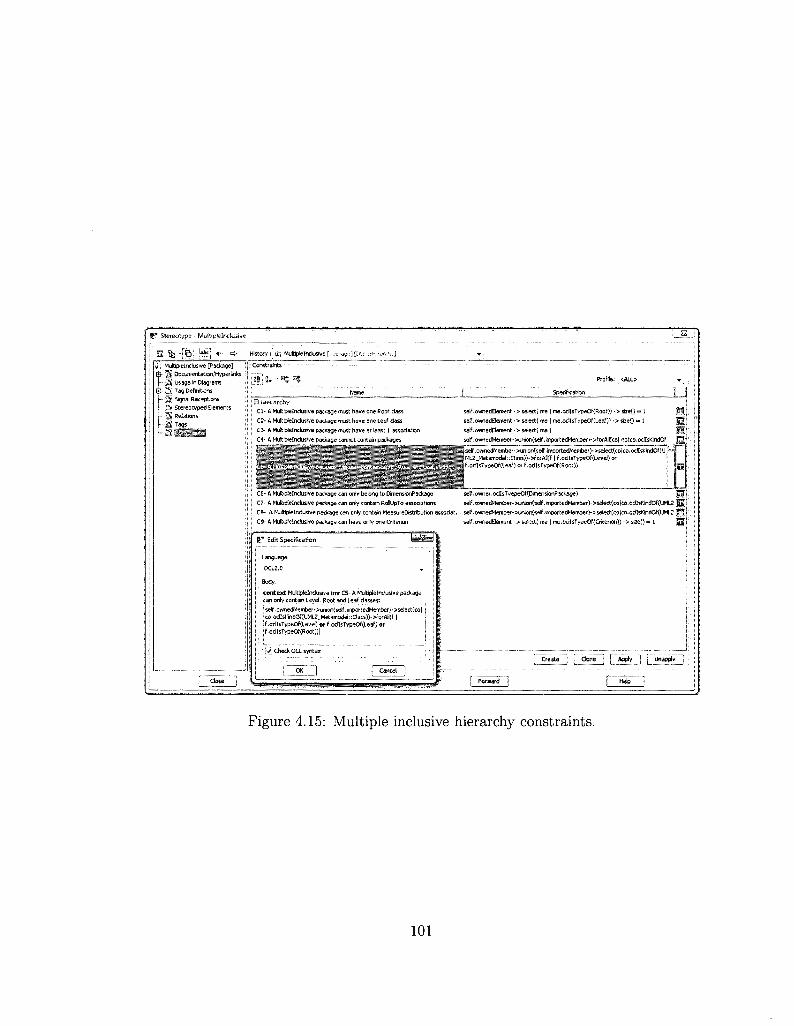
9* S tereot .pe f / J t i ^ W r clu^r
v.; Muftlplelnclusive [Package]
I*- X*X Documentation Hyperlinks
Q Usage <n Diagrams
i+r ^ Tag Definitions
13 Signal Receptions
fH- Stereotyped Elements
Q, Relations
Q Tags
5 'SO^
History :: *»*;, Multiplelncbstve f ;
; Constraints
Name Specification
Ct- A Multipielndusive package must have one Root class
CC- A Multiptelnelusrve package must have one Leaf dass
C3- A Mufcpielnclusrve package must have at least 1 association
C4- A Multipielndusive package cannot contain packages
C6- A Muitipielndusive package can only belong to Dimension?ackage
C7- A Mutlplelndusive package can only contain RollUpTo associations
C8- A MuttipSelndusive package can only contain MeasureDtstrfoution associat,
C9- A Muftiplelnclusive paclog* can have only one Criterion
self.ownedBement -> selectj me | me.edIsTypeOf{RootJ) -> sfie() = 1
self .ownedBement •> setect( me | me.oclIsTvpeOfCLeaf J) •> sizeQ ~ 1
self. ownedBement -> sdect( me I
se(f.a*necWembw*>unteriCself,importedHember)->forAlKco| notco.odlsKrtdOf
PseP.QwnecWerober->unlcf l fse!NnwtedMe^ ||ML2_Metamodel::C!ass))->forA8(f | f.odlsTvpeOf (Level) or j i j f .odIsTypeOf(Leaf! or f.oclIsTypeOf(Root)) |
B\* Edit Speciftcetia tel&isil
Language;
OCL2.C ,
Body:
. c o n t e x t Huftipielnclusive irrv C5- A Multipielndusive package can only contain Level, Root and Leaf classes; !setfownedMember->union(self.in^orteclMember;->select(Co| ;co,odIsKindOfCUMl2J'tetamocl^::Classj}->fc,rAll(f | i f.odlsTypeOf (Level) o r f .OvlIsTvpeOf(Leaf) o r !f.ocirsTypeOf(Raot)j|
5£ Check OCL syntax
L 0K 1
m\
seff.owner.odlsTvepeOfCDimensionPackage) (Eg):
self.ownedMember->un!on[setf ,impo(te*1ember)->setect(coico.ocBsi'jndOf(UML2 [ f | ) .
, s*lf .ownecW9mbefOunion(se[f.impwtedMeii*er>->se[ect(co|co.ocils^indOf(UML2 f|ySj :
self .ownedBement -> selectj me | me. cclIsTypeOf (Criterion)) -> sizeQ = 1 [ ^ 1 :
Create i i done Apply j ) Unapp.lv
Figure 4.15: Multiple inclusive hierarchy constraints.
101
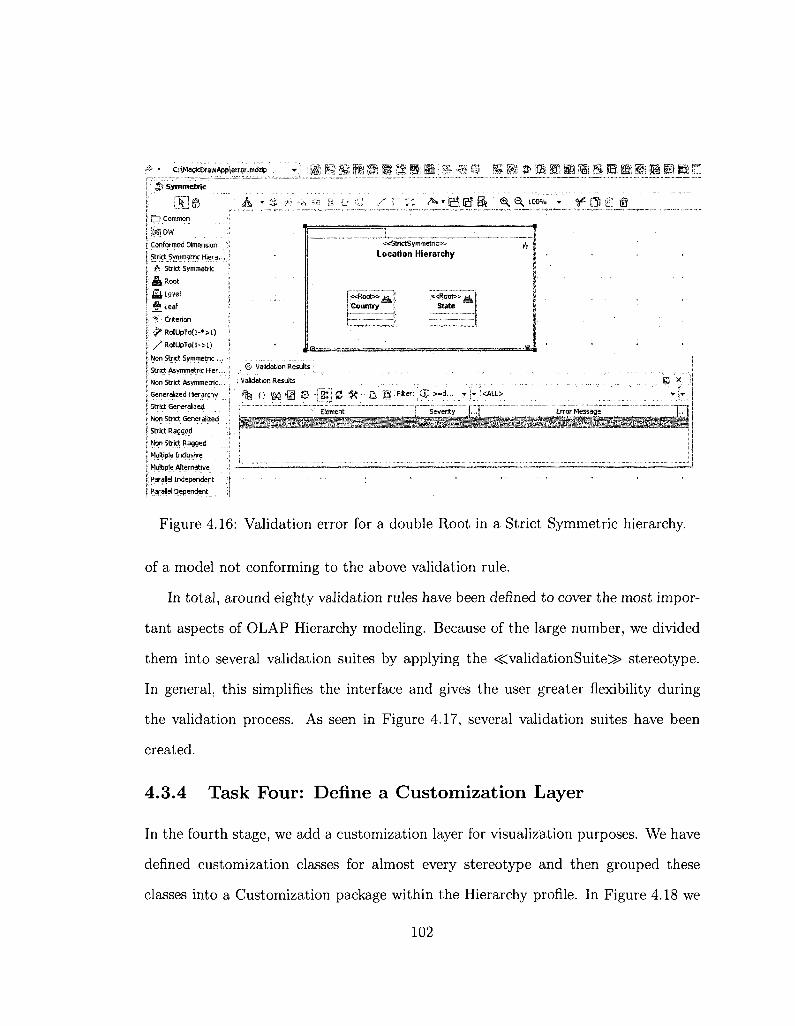
* • C:iMagrcBrawApplerror.m<tep -r' | ^ ' M ' fe It*"] © ^ I S S tt : IS" '11 ^ S S I S S ' I S
£s Symmetric Ei m m m ! m m B » C
I,' 65 <rl$» * •'•&• {.' }-. :/t.'.??.'?. &,.:S.<3li-.'^,i; ^.I5.f.
«StrictSymmetric» Location Hierarchy
[<<:R00t» I Country
;«Root» State
; © Validation Results ;
; Validation Results
' W IB © -[K] S #; •& l l j) Filter: ; { J > >=d... -r ! • ;<ALl>
'•' Element 1 Seventy
tteO ia* A T ^ y t i £ ^ ^ : &&KJKS*
Error Message
|i • Common
i; Conformed Dimension
j: Strict Symmetric Hiera...
I t\ Strict Symmetric
| & Root
• Si L?¥ e l
i jgueaf
j; '* • Criterion
|; J * RollUpTo(l-*>l)
f /RoliUpTo(l->lj
li Non Strict Symmetric ...
j: Strict Asymmetric Hier...
|; Non Strict Asymmetric...
:i Generalized Hierarchy
j; Strict Generalized
i: Non Strict Generalized
i; Strict Ragged
j; Non Strict Ragged
j: Multiple Inclusive
ji Multiple Afternative
I; Parallel Independent
j; Parallel Dependent
Figure 4.16: Validation error for a double Root in a Strict Symmetric hierarchy.
of a model not conforming to the above validation rule.
In total, around eighty validation rules have been denned to cover the most impor
tant aspects of OLAP Hierarchy modeling. Because of the large number, we divided
them into several validation suites by applying the <tCvalidationSuite3> stereotype.
In general, this simplifies the interface and gives the user greater flexibility during
the validation process. As seen in Figure 4.17, several validation suites have been
created.
4.3.4 Task Four: Define a Customization Layer
In the fourth stage, we add a customization layer for visualization purposes. We have
defined customization classes for almost every stereotype and then grouped these
classes into a Customization package within the Hierarchy profile. In Figure 4.18 we
102
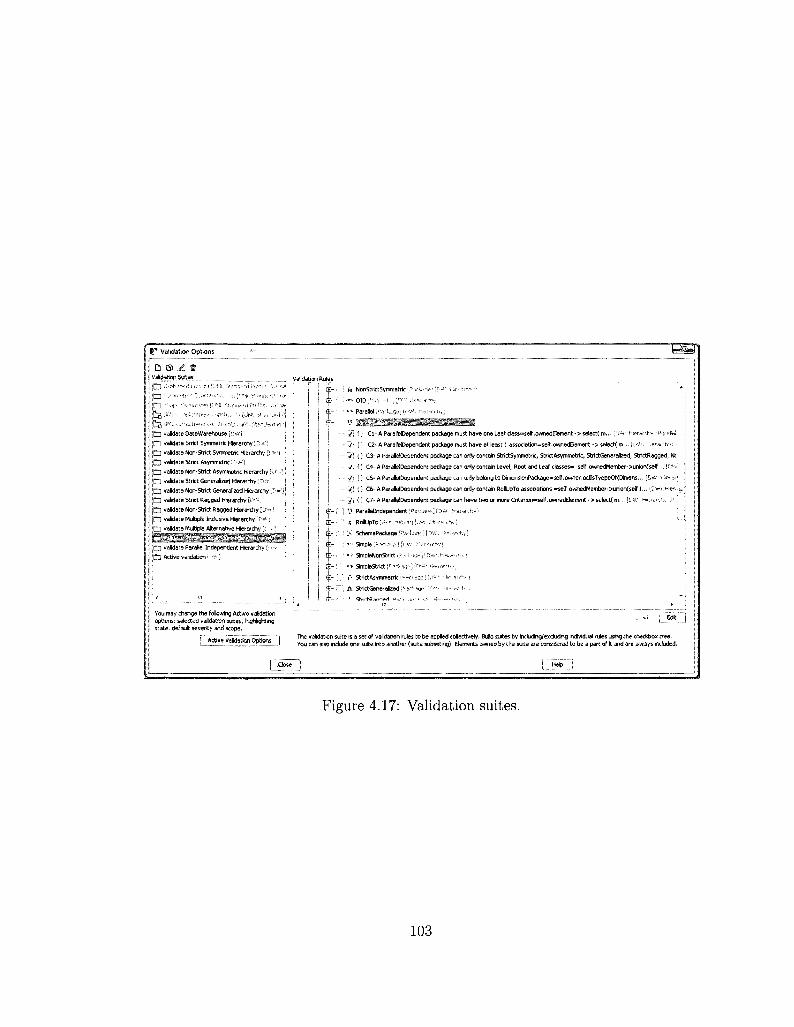
£ " Val idat ion Opt ions
D s> A e Vafidatioo Suftes
U
O
a J
| Q validate DataWarehouse
ir~| validate Strict Symmetric Hierarchy
| Q validate Non-Strict Symmetric Hierarchy \\ :\»:) -
[ £ j validate Strict Asymmetric U •->'}
| r~ l validate Won-Strict Asymmetric Hierarchy [UW'j!
JtT?i) validate Strict Generalized Hierarchy [")«¥) i
IC3 validate Non-Strict Generalized Hierarchy f r>v ' j '
J Q validate Strict Ragged Hierarchy [i.:"'~\; ;
\Cl validate Non-Strict Ragged Hierarchy [ D ' - !
J O validate Multiple Inclusive Hierarchy !.•>..*• •
IC.1 validate Muftipte Alternative Hierarchy '•'• U'1
JCD validate Parallel Independent Hierarchy (' ••'•••'
C~\ Actrve validation i '"".'•'}
You may change the following Active validation options: selected validation suSes, NghBghtftg state, default severity and scope.
n Rules
l> i ; NonStrlctSymmetric
OID
" Parallel
CJ- A ParalleiDependent package must have one Leaf class=self .ownedElement - > select( m..- 'DW .h»--r^f-J^ >'"i:;i!;
, i , C2-A ParalleiDependent package must have at least 1 association=self,owrtedElement -> select(m... [i-'-'.\ ?'!&*& •:?>•••
'] ( } O A ParalleiDependent package can only contain StrictSymmetric, StrictAsymmetric, StrictGenerafeed, StrictRagged, F
'i ( ) C4- A ParalleiDependent package can only contain Level, Root and leaf classes^ self.ownedMember->unlon(seIf.., f!.:
'} I} C5-A ParalleiDependent package can only belong to DimenslonPackage=self,owner,ocHsTyepeOf(Dffnens,.. (Sj«v.'H>f«
•j { } C6- A ParalleiDependent package can only contain RollUpTo associations =self .ovmedMember-xaTionCself . 1 , . . [ t> , ; : :K*:
'I i') C7- A ParalleiDependent package can have two or more Criterion=self .ownedEtement - > select( m... {V'---': *:":i <»'.<t,- .'•
1 ParalleFIndependent <»
RoUpTo
SchemaPackage [
* Simple ;>•'
» SimpteNonStrlrt
• SimpteStritt )
• StrictAsymmetric
', StrictGeneralized
Active Va&dation Options The validation suite is a set of validation rules to be applied collectively. Build suites by meSudirtg/exclud&ig Individual rules ushg the checkbox tree. You can also ffidude one suite into another (suite subseting), Elements ovmed by the sufte are considered to be a part of It and are always included.
f .Close [ H*lp
Figure 4.17: Validation suites.
103

«Customization» ^ CustomLevel
«Customization»
customizationTarget = fiiLevel *4.eaf SlRoot
hideMetatype - true possibleOwners =
i ; MultipleAlternative •£; Multiplelnclusive V ParallelDependent V Parallellndependent i" StriclAsymmetric l>. StriclGeneralized .*„ StriclRagged ^ StrictSymmetric
representationText = "Level" suggestedOwnedDiagrams = "OLAP Diagram" suggestedOwnedTypes =
.VT.OID
n Descriptor «»LevelAttribute
Figure 4.18: A customization of the Dimension Package
see the customization classes for the stereotyped class Level, as well as the stereo
typed Multiple and Parallel packages. In Figure 4.19 a customization dialog for the
stereotyped class Level, along with its stereotyped attributes, is illustrated.
4.3.5 Task Five: Define the OLAP Diagram
At this point we are able to define the OLAP diagram and assign icons by using the
MagicDraw Customized Diagram Wizard, as discussed previously. Together with the
various stereotype specifications, the new OLAP diagram provides the basis for simple
and intuitive OLAP design. From the user's perspective, much of the complexity of
the underlying UML vocabulary has been hidden. In its place is a "simple" design
environment, with the various components of the OLAP domain neatly organized
into a series of toolbars. In turn, each of these toolbars exposes a subset of OLAP
concepts that are constrained so as to limit the relationships that can be formed
between them. A sample screen shot of the resulting OME design environment is
«Customization» CustomMultiplePackages
«Cu3tomlzation» customizationTarget =
i; Multiplelnclusive • i ; MultipleAlternative
hideMetatype = true possibleOwners = is DimensionPackage suggestedOwnedDiagrams = "OLAP Diagram" suggestedOwnedTypes =
«&Root 4N-eaf ... MeasureDistribution
«Customization» CustomParallel Packages
«Customization»
customizationTarget = !.8 ParallelDependent V Parallellndependent
hideMetatype = true possibleOwners = vi DimensionPackage representationText = "Parallel Hierarchy" suggestedOwnedDiagrams = "OLAP Diagram" suggestedOwnedTypes =
SLevel * R o o t •fiLeal
104

B" Level - Customer "¥5=01
^Q !-;**<! =£> History : ^Si, Customer
ff'i ! '-i
-H -i -Ml
Documentation/Hyperlinks
Usage in Diagrams
Attributes
Ports
Operations
Signal Receptions
Behaviors
Template Parameters
Inner Elements
Relations
Tags
Constraints
Language Properties
0 Customer
Lfi'J zi
\B Leva! __
OID
Descriptor
Dimension Attribute
Properties: Standard • TO? Customize
^Customer
C23
Full name
first name
Name The name of the NamedElement.
Close Forward Help
Figure 4.19: A customization dialog for the Level class
presented in Figure 4.20.
4.4 Case Study
In this section, we use a modeling example from [34] to illustrate how the OME might
be used in practice. This simplified example models some of the activities of a typical
university. In short, this system is to be used by administrators to analyze their
position with respect to research and funding.
4.4.1 Requirement Specification
Requirement specification is generally the first step in the design process. It deter
mines what data should be available, how it should be organized, and the queries
that should be possible. At the simplest level, it would consist of the following:
105

File Edit Vie* Layout Diagrams Options Tools Analyre T««mworL Window Help
D TS Ul D B> & • <*> * f"" " CVMs.. 4e0f9««|ip\*apter 4.™feip - !&'" V ' ^ ; ftij p : f f j ^ 1? j
%. Co.. & Inhe..£« CM.. « H » . . J £s screenshot.
PP^SPas?* . . « . « • *
Si!-E-ts3 Data j Ep- « Haachy
i a--? - Rdationj I ! g - -&Oty • i ip"J3fc Country ! : fy-Q, County
! itiSs DNtwin ! I 51-A Region i I £ ] J £ Sates Emplyee j i $-£U Section ! j Q~£i State i i •--•*> Geo.locatl... t ) U.<; Org-Strurt,.. i !J1-Ct»-.:•-!. ;(.•.••..;.-.•:•../.••>
t^> Jaosn 2) Docum.. §3 F»opeit .
Zoom rJ1 n «
A
I :~ n 0 $5 ':< $ © ;# jg ® *$ e & i& S* 'B. & '•
"* * e3 ef & ^ o. loiw. - ^ c e t O Common
'§?.&'# Conformed Dimension
Strict Svrrtnietrk Hart..
fr Strict Symmetric
J^Root
filLevd
4 u r f
f- Critarton
& RoajpTo(l-*>l>
/P .o f t *To( l -> i ;
Nen Strict Syrnmetric
Strict Aiymraetrn tto-..
Non Stnct Asvrnmetric..
&ener jfeed Hwrpclw
Strict G*fwrjdli«J
Non Strict Garwrallzed
Strict Raised
ton Strict Ragged
Multiple Inclusive
Multiple Alternative
Parallel IndeiJendent
Parallel Dependent
wParsfieiDepantlerOs Hierarchy
3: *<RoftJpToO
tactta****™'-*1****
1 riWf)„...
I 0 * f 1 j 1 j^^nulfprotO'-.i
I " ^. ' I-.I
<*RQlWpTo(T.»1)»» s^,g#tffttoro(V.*i jCaumry
Figure 4.20: A screen shot for OME diagram
1. Identify users: Here, we identify the key decision makers in the university
setting. For example, who are the people responsible for research activities,
promotion, evaluation, and strategic analysis?
2. Determine analytical requirements: In the current case, the general goal
is to understand the effect of participation by the university's faculty in inter
national forums such as projects and conferences.
4.4.2 Conceptual Design
Analysis of the user's requirements leads directly to the development of a multi
dimensional schema. For our example, the schema has several dimensions: Calendar-
Time, Diffusion and Affiliation. The Affiliation dimension is included to represent
the fact that researchers may be associated with several departments. The Diffusion
106

CalendarTime
«DimensionPackage»
CalendarTime Dimension
«MultipleAlternative»
CalendarTime Hierarchy <?4
>M 1
«l_evel» ,9,11 Month RollUpTo(1*->1)>
«Level» JgL r j Quarter 1 - * <RollUpTo(r->1)»
:RollUpro(1 •->!):
1..*
-=P-*«RollUpTo<1*->1)»£ T
«Level» m* Week
«Roo t» j Year
«Cr i ter ion» .», Calendar
«RollUpTo(1*->1)»
Figure 4.21: Content of the Calendar Time hierarchy
dimension effectively indicates whether a conference was national or international.
As per the user requirements, the CalendarTime dimension is represented as a
Multiple Alternative hierarchy. The stereotyped package MultipleAlternative is cre
ated. The Root level is Year, the Leaf level is Time, and the intermediate Levels are
Quarter, Week and Month. In Figure 4.21 the relationships between these levels are
specified with the appropriate RollUpTo associations. A similar process is followed
for each of the two remaining dimensions. The Affiliation dimension is created as
a Non-strict Asymmetric hierarchy (Figure 4.22), while the Diffusion dimension is
denned as a Strict Symmetric hierarchy (Figure 4.23).
Along with the three dimensions, we must of course define the primary Fact class.
In our case, the fact is Conference Participation and is associated with four measures
as indicated in Figure 4.24, including Registration cost, Traveling cost, Lodging cost.
Dimensions are then linked to the corresponding fact measure with Dimensioning as
sociation. The full model is represented by the Conference Schema package illustrated
107
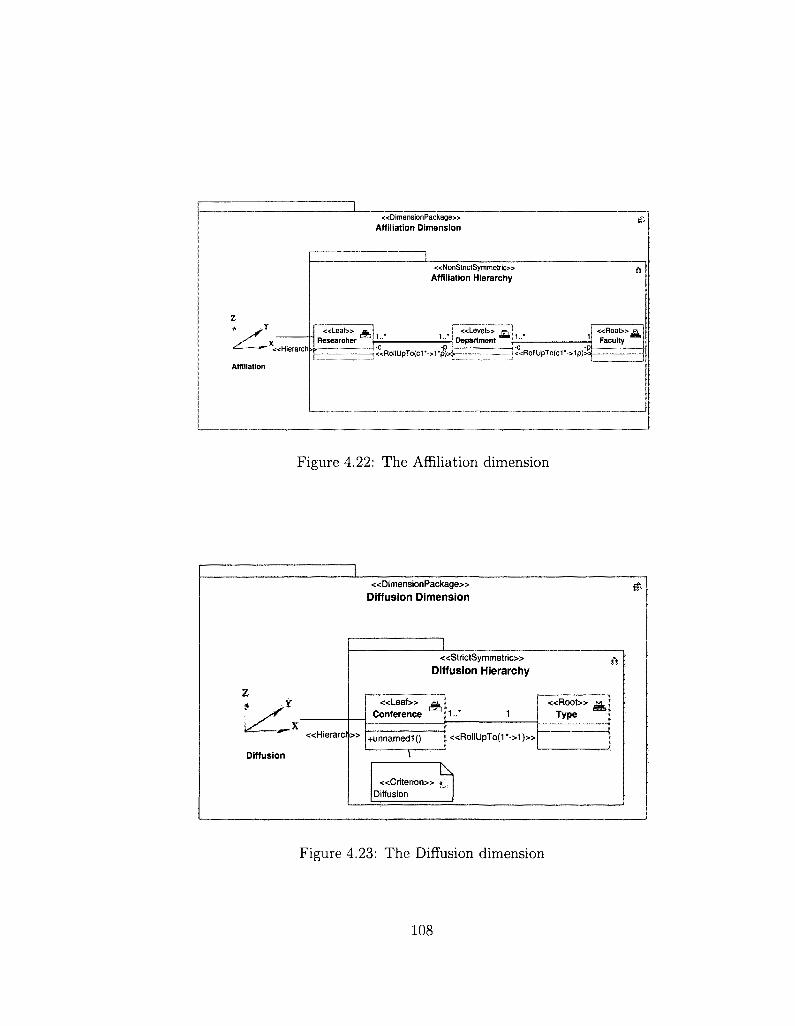
1
z
"—'"" •**"" «Hierarch
Affiliation
«DimensionPackage» Affiliation Dimension
i «NonStrictSymmetric»
Affiliation Hierarchy
«Leaf» j» j «Level» &, - _ . eft f1„* 1..* _ . J£i
Researcher I Department 1..*
«RollUpTo(c1
«•
1
, ^
ft
«Roo t» CT Faculty
Figure 4.22: The Affiliation dimension
Diffusion
«DimensionPackage» Diffusion Dimension
«Hierarcn»
«StrictSymmetric» Diffusion Hierarchy
«Leaf» Conference a
+unnamed1() «RollUpTo(1*->1)»
« R o o t » Type
T\ «Criter ion» £,
Diffusion
it-
Figure 4.23: The Diffusion dimension
108

«Dimension>;-,.• Diffusion
h «Dime
1 «FactPackage»
Conference Participation Fact
0..*
nsioning»
« F a c t » ga Conference Participation
«Measure»-Registration cost «Measure»-Traveling cost «Measure»-Lodging cost
" <>::• )
«Dimer sioning»
1 «Dimension» ;.,-
Affiliation
,0." 1
«Dimensoning»
«Dimension» v . CalendarTime
Figure 4.24: Fact and dimension relationships
in Figure 4.25. (Note that it includes an additional University Structure package)
Finally, given the new model, we note that end users should now be able to resolve
queries such as:
• The cost related to participation of researchers in international conferences.
• The cost of participation during various periods of time, including calendar and
academic years.
• The number of projects in each department or research centre.
• The salary earned by researchers participating in a given project.
• The numbers of projects and researchers available during various time periods.
109

«SchemaPackage»
Project Schema
« T i m ePackag e> >
Calendar Dimension
«Root». Year J « L e a ! » ,5,
Month L i J
«:<Dimension» Caledar Time
«DimensionPackage»
Affiliation Dimension
«NonStr ic tSymmetr ic»
J « R o o t » J | Department
:Rd|IUpTo(c1'->1
« L © a ( » j Researcher L
«Fae tPackage»
Project Fact
« F a c t » Project Participation
i n i m Q «o i m i . i n n^~ l« f : ec tA t t r i bu te» -Sa la ry : Additive ^Dimensioning** L < F a c tA t l r i bu ie» -No hours : Additi «FactAt t r ibu le»-No hours: Additive!
«Dimension>: Affi l iation
«Dimens ionPackage»
Diffusion Dimension
IL
«Dimenaion>; •.
Diffusion
< <StrictSy m m et ric >:
« L e a l » g Projecl ^
:<R6TOpTo(cl
« D i m en sion Packag e*>
Structure Dimension
« D i m e m i o n i n g »
« Dimension*; ^
Structure
«Parailetlndependents;
« C r r t e r i o n » *
[organization
« L e a f » &, Project ^
« R o o t »
Research Center
« C r i t e r i o n » *•:„ affiliation
Figure 4.25: Project schema
110
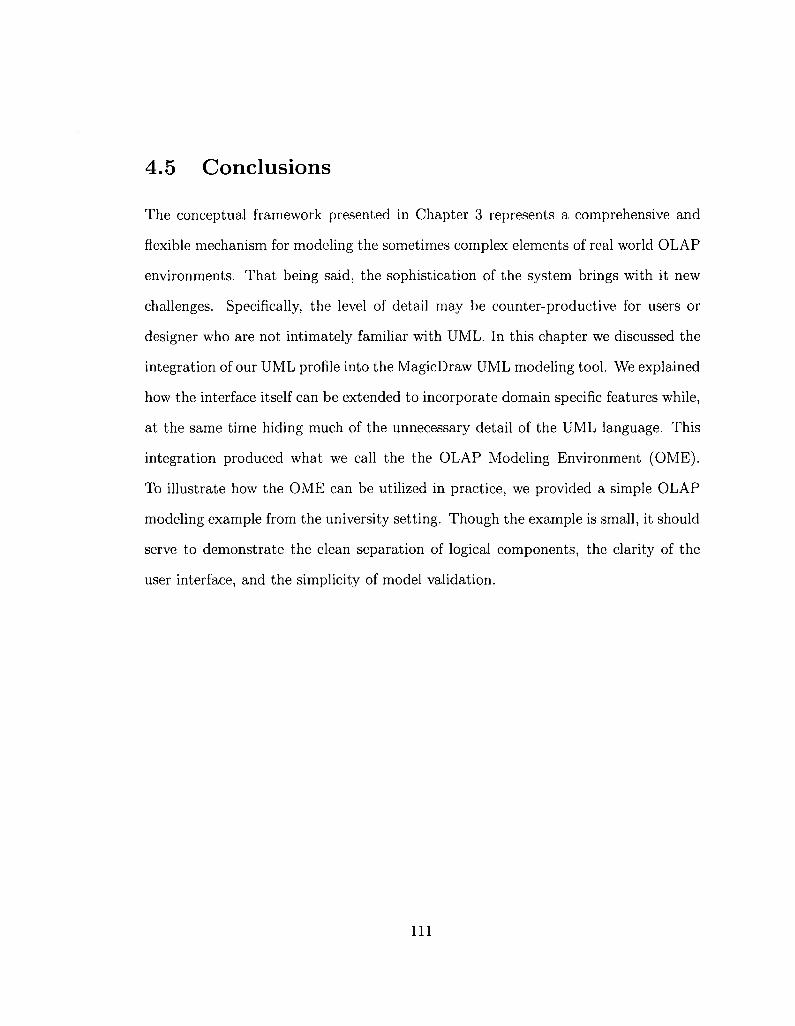
4.5 Conclusions
The conceptual framework presented in Chapter 3 represents a comprehensive and
flexible mechanism for modeling the sometimes complex elements of real world OLAP
environments. That being said, the sophistication of the system brings with it new
challenges. Specifically, the level of detail may be counter-productive for users or
designer who are not intimately familiar with UML. In this chapter we discussed the
integration of our UML profile into the MagicDraw UML modeling tool. We explained
how the interface itself can be extended to incorporate domain specific features while,
at the same time hiding much of the unnecessary detail of the UML language. This
integration produced what we call the the OLAP Modeling Environment (OME).
To illustrate how the OME can be utilized in practice, we provided a simple OLAP
modeling example from the university setting. Though the example is small, it should
serve to demonstrate the clean separation of logical components, the clarity of the
user interface, and the simplicity of model validation.
I l l
Chapter 5
Conclusion and Future work
5.1 Summary
Data warehouse and Online Analytical Processing (OLAP) applications are used by
countless organizations to assist in the decision making process. Reliable decisions
cannot be made, however, if data is not accessible in an intuitive format that en
courages meaningful analysis. Ultimately, success depends — at least in part — on
a conceptual representation that accurately represents the relationships between core
organization elements and processes. In the world of data warehouses and Online An
alytical processing, we refer to this representation as a multidimensional (MD) model.
Recently, a significant amount of research has been undertaken in the OLAP area in
general, and in multidimensional modeling in particular. However, to date there is
no commonly agreed upon conceptual model for representing multidimensional data.
Perhaps more importantly, in spite of the wide acceptance of the Object-Oriented
paradigm, very few researchers have considered 0 0 mechanisms in this context. Even
fewer have addressed the structure of OLAP hierarchies, the driving element behind
a great deal of OLAP processing.
In this thesis, we have proposed a conceptual multidimensional model that is able
112

to express data requirements for data warehouse and OLAP systems. Using our
model, designers can better represent the analytical requirements of decision mak
ers than would otherwise be possible with conventional Unified Modeling Language
(UML) facilities. Our model has been defined as a profile extension of classical UML.
Considerable effort has been made to ensure that the profile maps intuitively to real
world OLAP domains. In other words, our goal is to maintain semantic equivalency.
As such, the profile contains the stereotypes, tagged values, and constraints that
expose the unique properties of OLAP environments. Furthermore, the Object Con
straint Language (OCL) has been used to define restrictions and limitations that help
to prevent arbitrary and inappropriate uses of the core elements.
Given the relatively large number of hierarchies, some of which are quite involved,
the "learning curve" for this environment can still be quite high. Consequently, we
have integrated the profile into MagicDraw, one of the most commonly used UML
design tools. By extending the native interface and including various customization
classes, we have produced an intuitive development UI we call the OLAP Model
ing Environment (OME). Ultimately, the OME provides a clean interface for OLAP
design, one that encourages users — through exposed toolbars and icons — to use
the underlying elements in a logically and semantically correct fashion. Should the
designer still go astray, a number of validation suites have been incorporated into the
OME in order to validate the logical correctness of the design.
We concluded the discussion of the research with a case study that utilized the
OME (and the OLAP profile) to design the conceptual model for a small university
system. While limited in scope, the example should give the reader some sense of
how analytical requirements can be mapped into a clear, intuitive model by using the
113

framework we have provided.
5.2 Future Work
The work presented in this thesis essentially represents the first stage of a larger
project. We briefly highlight two future projects that are expected to extend this
work.
5.2.1 XSLT conversion
As previously noted, this work is associated with the Sidera Server, a "shared noth
ing" parallel OLAP server that provides high performance analytics for enterprize-
level data warehouses. Unlike conventional warehouses and OLAP servers that often
utilize relational storage, Sidera is built upon an OLAP-specific storage engine. In
other words, it natively supports not only OLAP hierarchies, but the processing
logic needed to traverse them efficiently. The physical representation of the data, of
course, is defined with a database schema. Currently, the XML-based language for
this schema is being developed by additional graduate students in the Sidera lab. As
one would expect, its structure corresponds more or less directly to the conceptual
model described in this thesis. Unfortunately, creating the schema for such a database
is non-trivial. Doing so manually would be both very time consuming and very error
prone.
For this reason, we would prefer to create a round-trip development model that
allows the conceptual model to be exported in a format that is natively understood
by the Sidera server. In principle, this is quite possible, as evidenced by the fact that
many current modeling tools allow database models to be exported as SQL, the native
114
language of relational database systems. While there is no native export facilities for
Sidera's custom schema, it is possible to export UML models into XML Metadata
Interchange (XMI). The objective at that point would be to convert the raw, and
very verbose, XMI into a new XML format, namely our own database schema. To
accomplish this we expect to utilize Extensible Style Sheet Language Transformations
(XSLT) as a mechanism for converting from one XML format to another. Specifically,
we would create a (very large) XSL Style Sheet that the XSLT processor would use
as a guide. The end result would be a true "round trip" design process.
5.2.2 Profile portability
Though we have utilized MagicDraw in this thesis, it is but one of a number of popular
design tools (e.g., the Rational applications). Ideally, we would like to allow designers
to use the tool of their choice. The XSLT transformations described above are part
of this process, in that any standards compliant UML tool can produce XMI. Given
a common modeling profile, the output of any tool should be exportable to Sidera.
In terms of the profile itself, we note that major UML tools also have the ability
to import UML models as well. Of course, any UI extensibility mechanism will be
unique to each software application (e.g., toolbars). Nevertheless, we expect that
with a modest effort, we should be able to port our model to several of the leading
design tools.
5.3 Conclusions
Though the work initially being performed in parallel as part of the Sidera project
had progressed nicely, it had become apparent that the complexity of the conceptual
115

model would make manual schema design quite difficult. What was needed was
an intuitive, but accurate, conceptual model that could serve as the starting point
for OLAP system. In searching through the literature, it was also clear however
that no such standard model existed. For this reason, we began work on a formal
model that could support development of not only general purpose data warehouses,
but hierarchy-driven OLAP applications as well. In this thesis, we have explored
both the form and rational of a robust conceptual model for contemporary OLAP
environments. We have also shown how the theoretical elements can be integrated
into design tools that dramatically streamline the process. To our knowledge, this
is the most comprehensive attempt to provide round-trip schema engineering in the
OLAP domain.
116
Bibliography
[1] Alberto Abell, Jos Samos, and Flix Saltor. Benefits of an object-oriented mul
tidimensional data model. In Proceedings of the International Symposium on
Objects and Databases, pages 141-152, 2000.
[2] Alberto Abello, Jose Samos, and Felix Saltor. A framework for the classification
and description of multidimensional data models. In Proceedings of the 12th
International Conference on Database and Expert Systems Applications, pages
668-677, 2001.
[3] Alberto Abello, Jose Samos, and Felix Saltor. YAM2 (Yet Another Multidimen
sional Model): An Extension of UML. In Proceedings of the 2002 International
Symposium on Database Engineering and Applications, pages 172-181, 2002.
[4] Nguyen Thanh Binh and A. Min Tjoa. Conceptual multidimensional data model
based on object-oriented metacube. In Proceedings of the 2001 ACM symposium
on Applied computing, pages 295-300, 2001.
[5] Nguyen Thanh Binh, A. Min Tjoa, and Roland Wagner. An object oriented
multidimensional data model for OLAP. In Proceedings of the First International
Conference on Web-Age Information Management, pages 69-82, 2000.
[6] Markus Blaschka, Carsten Sapia, Gabriele Hofling, and Barbara Dinter. Finding
your way through multidimensional data models. In Proceedings of the 9th In
ternational Workshop on Database and Expert Systems Applications, page 198,
117

1998.
[7] Grady Booch. Object-oriented analysis and design with applications. Benjamin-
Cummings Publishing Co., Inc, 1993.
[8] Dan Bulos and Sarah Forsman. Getting started with adapt. Technical report,
Symmetry Corporation; San Rafael, 1998.
[9] Surajit Chaudhuri and Umeshwar Dayal. An overview of data warehousing and
OLAP technology. ACM SIGMOD Record, 26:65-74, 1997.
[10] Peter Pin-Shan Chen. The entity-relationship modeltoward a unified view of
data. In ACM Transactions on Database Systems, pages 9-36, 1976.
[11] E. F. Codd, S. B. Codd, and C. T. Salley. Providing OLAP (on-line analytical
processing) to user-analysts: An IT mandate. Technical report, E.F. Codd and
Associates, 1992.
[12] C.J. Date. An Introduction to Database Systems. John Wiley and Sons, 2003.
[13] E. Fernndez-Medina and M. Piattini. Designing secure database for OLS. In
Proceedings of Database and Expert Systems Applications: 14th International
Conference, pages 886-895, 2003.
[14] Matteo Golfarelli, Dario Maio, and Stefano Rizzi. The dimensional fact model:
a conceptual model for data warehouses. International Journal of Cooperative
Information Systems, 7:215-247, 1998.
[15] Matteo Golfarelli and Stefano Rizzi. A methodological framework for data ware
house design. In Proceedings of the 1st ACM international workshop on Data
warehousing and OLAP, pages 3-9, 1998.
[16] Jiawei Han and Micheline Kamber. Data Mining: Concepts and Techniques.
Morgan Kaufmann, 2006.
118

[17] Bodo Husemann, Jens Lechtenbrger, and Gottfried Vossen. Conceptual data
warehouse design. In Proceedings of the 2ed International Workshop on Design
and Management of Data Warehouses, pages 3-9, 2000.
[18] William H. Inmon. Building The Data Warehouse. John Wiley and Sons, 2002.
[19] Ivar Jacobson. Object-Oriented Software Engineering: A Use Case Driven Ap
proach. Addison Wesley Longman Publishing, 2004.
[20] Jan Jurjens. UMLsec: Extending UML for secure systems development. In Pro
ceedings of the 5th International Conference on The Unified Modeling Language,
pages 412-425, 2002.
[21] Ralph Kimball and Margy Ross. The Data Warehouse Toolkit. Addison-Wesley,
2002.
[22] Sergio Lujan-Mora, Juan Trujillo, and Il-Yeol Song. A UML profile for mul
tidimensional modeling in data warehouses. Data and Knowledge Engineering,
59:725-769, 2006.
[23] No Magic. MagicDraw UML, 2009. http://www.magicdraw.com/.
[24] Elzbieta Malinowski and Esteban Zimnyi. Advanced Data Warehouse Design:
From Conventional to Spatial and Temporal Applications. Springer Publishing,
2008.
[25] Hamid R. Nemati, David M. Steiger, Lakshmi S. Iyer, and Richard T. Herschel.
Knowledge warehouse: An architectural integration of knowledge management,
decision support, artificial intelligence and data warehousing. Decision Support
Systems, 33:143-161, 2002.
[26] Object Management Group (OMG). Common warehouse metamodel (cwm),
2003. http://www.omg.org/spec/CWM/1.1/.
119

[27] Object Management Group (OMG). Unified modeling language (UML) specifi
cation 2.0, 2005.
[28] Object Management Group (OMG). Object constraint language (OCL) specifi
cation 2.0, 2006. http://www.orag.Org/spec/0CL/2.0/.
[29] Object Management Group (OMG). The unified modeling language profile
specifications, 2009. ht tp: / /www.omg.org/ technology/documents/profi le_
catalog.htm.
[30] Nigel Pendse and Carsten Bange. The OLAP report, 2009. http://www.
olaprepor t .com/.
[31] Elaheh Pourabbas and Maurizio Rafanelli. Characterization of hierarchies and
some operations in OLAP environment. In Proceedings of the 2nd ACM Inter
national Workshop on Data Warehousing and OLAP, pages 54-59, 1999.
[32] Torsten Priebe and Gunther Pernu. Metadaten-gestu tzer data-warehouse
entwurfmit ADAMTed UML. In Proceedings of 5th Internationale Tagung
Wirtschaftsinformatik, page 2001, 2001.
[33] Torsten Priebe and Gunther Pernul. A pragmatic approach to conceptual mod
eling of OLAP security. In Proceedings of the 20th International Conference on
Conceptual Modeling: Conceptual Modeling, pages 311-324, 2001.
[34] James Rumbaugh, Michael Blaha, William Premerlani, Frederick Eddy, and
William Lorensen. Object-oriented modeling and design. Prentice-Hall, Inc, 1991.
[35] Carsten Sapia. On modeling and predicting query behaviour in OLAP systems.
In Proceedings of International Workshop on Design and Management of Data
Warehouses, pages 1-10, 1999.
120

[36] Carsten Sapia, Markus Blaschka, Gabriele Hofling, and Barbara Dinter. Ex
tending the E/R model for the multidimensional paradigm. In Proceedings of
the Workshops on Data Warehousing and Data Mining: Advances in Database
Technologies, pages 105-116, 1998.
[37] Darius Silingas, Ruslanas Vitiutinas, Andrius Armonas, and Lina Nemuraite.
Domain specific modeling environment based on UML profiles. To be published
in Information Technologies, 2009.
[38] Bernhard Thalheim. Entity-relationship Modeling Foundations of Database Tech
nology. Springer, 2000.
[39] Riccardo Torlone. Conceptual multidimensional models, pages 69-90, 2003.
[40] Juan Trujillo, Manuel Palomar, Jaime Gomez, and 11 Yeol Song. Designing data
warehouses with OO conceptual models. Computer, 34:66-75, 2001.
[41] Nectaria Tryfona, Frank Busborg, Jens G. Borch, and Christiansen. starER: a
conceptual model for data warehouse design. In Proceedings of the 2nd ACM
international workshop on Data warehousing and OLAP, pages 3-8, 1999.
[42] Aris Tsois, Nikos Karayannidis, and Timos K. Sellis. MAC: Conceptual data
modeling for OLAP. In Proceedings of the International Workshop on Design
and Management of Data Warehouses, page 2001, 2001.
[43] Jos B. Warmer and Anneke G. Kleppe. The Object Constraint Language: Precise
Modeling with UML. Addison-Wesley, 1999.
[44] Esteban Zimnyi and Elzbieta Malinowski. OLAP hierarchies: A conceptual
perspective. In Proceedings of the 16th International Conference on Advanced
Information Systems Engineering, pages 477-491, 2004.
121

[45] Esteban Zimnyi and Elzbieta Malinowski. Hierarchies in a conceptual model:
From conceptual modeling to logical representation. Data KNowledge Engineer
ing, 59:348-377, 2006.
122