a universal child allowance to reduce poverty and improve
TRANSCRIPT

A Universal Child Allowance to Reduce
Poverty and Improve Child Development

A plan to reduce poverty and
income instability among
children in the United States
Hirokazu Yoshikawa, New York University
US Partnership on Mobility from Poverty
Webinar, November 22, 2016

Overview
I. A universal child allowance: A proposal to reduce poverty and income
instability among children in the United
States
II. A randomized experiment to test the
impact of an unconditional cash transfer in the first three years of life:
Proposal and pilot study results

Research Team, Child Allowance
H. Luke Shaefer, University of Michigan
Greg Duncan, University of California Irvine
Kathryn Edin, Johns Hopkins University
Irwin Garfinkel, Columbia University
David Harris, Children’s Research and Education Institute
Timothy Smeeding, University of Wisconsin Madison
Jane Waldfogel, Columbia University
Christopher Wimer, Columbia University
Hirokazu Yoshikawa, New York University

Research Team, Poverty and Early
Child Development
Greg J. Duncan, University of California Irvine
Kimberly Noble, Columbia University
Katherine Magnuson, University of Wisconsin
Lisa Gennetian, New York University
Hirokazu Yoshikawa, New York University

SUMMARY I
Child poverty in the U.S. remains stubbornly high
We spend $96 billion on cash support for children -- in the
form of the Federal Income Tax child exemption and Child
Tax Credit. A family with two children receives more than
$4,000 per year from these tax provisions if their annual
income is around $100,000 and more than $3,000 if their income is $250,000 or higher.
Families with no or very low taxable income receive
nothing.

SUMMARY II
A stable source of income could reduce material hardship and improve child health and development
Proposals currently considered include reforming the Child Tax Credit – making it fully refundable e.g. (Center for Budget and Policy Priorities) so it phases in earlier, reaches lower-income families
We propose a universal, monthly child allowance to provide all children with a dependable cash income floor including the poorest families in America
Present data that focuses on very young children as a particularly important group to consider for such income support

CHANGES IN THE SAFETY NET
The U.S. has increased its financial commitment to
fighting poverty substantially over the past half century
through refundable tax credits and in-kind aid
More aid is now directed to low-income working families,
when they are working
Less aid to families who are unable to maintain stable
employment
One quarter of TANF dollars goes toward basic assistance
Other uses include child care subsidies and state EITCs.
Very little is spent on helping recipients find work

PRELIMINARY – DO NOT CITE OR QUOTE
26
Special thanks to Elaine Maag for estimates of the total expense of the child tax exemption and child tax credit

PRELIMINARY – DO NOT CITE OR QUOTE
26
This
Is >
Than
These
combined

PRELIMINARY – DO NOT CITE OR QUOTE
27
Figure 2 Child income poverty rates, 2012a
Share (%) of children (0-17) that live in households with an equivalised post-tax and transfer
income of less than 50 percent of the national annual median equivalised post-tax and transfer household income
a) Data for Canada refer to 2011
b) The statistical data for Israel are supplied by and under the responsibility of the relevant Israeli authorities. The use of such data by the OECD is without prejudice to the status of the Golan Heights, East Jerusalem and Israeli settlements in the West Bank under the terms of international law.
c) Footnote by Turkey: The information in this document with reference to « Cyprus » relates to the southern part of the Island. There is no single authority representing both Turkish and Greek Cypriot people on the Island. Turkey recognizes the Turkish Republic of Northern Cyprus (TRNC). Until a lasting and equitable solution is found within the context of United Nations, Turkey shall preserve its position concerning the “Cyprus issue”
d) Footnote by all the European Union Member States of the OECD and the European Commission: The Republic of Cyprus is recognized by all members of the United Nations with the exception of Turkey. The information in this document relates to the area under the effective control of the Government of the Republic of Cyprus
Sources:
OECD Income Distribution Database
0
5
10
15
20
25
30
Poverty rate (%)
Children (0-17) (↗ ) Total population
Countries with some form of a child allowance: Austria, Belgium,
Canada, Denmark, Finland, France, Germany, Iceland, Ireland,
Luxembourg, the Netherlands, Norway, Sweden, Switzerland and the
U.K.

WHY A MONTHLY CHILD ALLOWANCE?
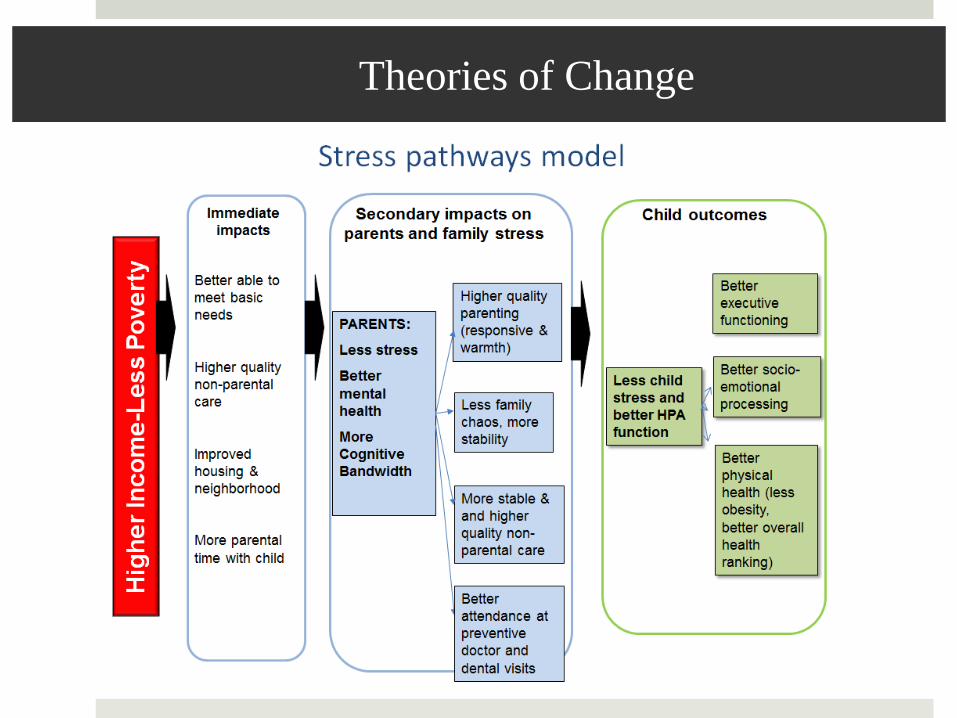
Increased income may allow parents to increase investments in their children, improving child health and development
Increased income may reduce family and environmental stress, which can improve child health and development
Poverty can compromise parents’ cognitive “bandwidth,” with detrimental consequences for cognitive tasks and decision-making
Emerging evidence finds that families well up the economic ladder face substantial intra-year volatility in income and expenses
Conceptual linkages between income and the child development are strongly suggestive that a form of dependable monthly income support would have substantial benefits

BASING POLICY ON PRINCIPLES
The child allowance should be universal, recognizing that all families incur substantial expenses when raising children
The allowance should be accessible and of sufficient frequency to meet short-term cash needs. We propose monthly distribution
Payments should be adequate for a family to address basic needs of children—we recommend $250/ month
Families with younger children should be eligible for larger payments
Per-child payments should decline with additional children
CONSENSUS
IMPORTANT CONSIDERATIONS

PRELIMINARY – DO NOT CITE OR QUOTE
15
Today’s children are tomorrow’s citizens. The better children in our country do, the
more they can contribute economically, socially, and culturally to our country throughout their
lifetimes. Providing a universal public child benefit is a material and symbolic expression of our
common interest in their welfare. Local and state governments in the United States recognized
this common interest by leading the world throughout most of the 19th and 20th centuries in the
public provision of universal elementary and secondary education. These investments in the
education of all of our nation’s children are one reason why the United States is now the richest
large nation on earth (Garfinkel, Rainwater and Smeeding 2010; Goldin and Katz, 2009).
Recognizing that raising children is a costly endeavor for families, the U.S. federal
income tax system already allows parents—except for those with the lowest and highest
incomes—to receive a credit of $1,000 per child from their taxes owed. Families may further
deduct up to $4,000 per child from their taxable
income, but again families with very low incomes do
not benefit. For recipient families, this tax credit and
exemption are economically equivalent to a child
allowance consisting of a single annual payment. Our
proposed child allowance payments would be more
generous, would be paid monthly and would include
families from both the poorest and the wealthiest
families.
Some argue that benefits should be focused
only on children in poor families, excluding those with higher incomes. The poorest families are
clearly the neediest. Programs limited to the poor, like SNAP and TANF, relieve poverty and
Three proposed versions of a child
allowance
Simple: Monthly payments of $250 per
child per month for all children under
age 18.
Tiered: Monthly payments of $300 per
child under age 6, $250 per child age 6-
17.
Tiered and Equivalized: Monthly
payments of $300 for the first child
under age 6 and $250 for the first child
age 6-17, with a reduction in these
benefit levels as the number of children
in the household increases.
In each case, payments would be taxed
at the marginal tax rate of the unit
claiming the child.

POVERTY EFFECTS (CPS ASEC)
PRELIMINARY – DO NOT CITE OR QUOTE
28

POVERTY EFFECTS (CPS ASEC) PRELIMINARY – DO NOT CITE OR QUOTE
29
Table 1: Cost Estimates of Universal Child Allowance Proposals (in billions)
Total Direct
Cost
Cost
Savings* Net Cost of CA:
Universal $250/mo. CA $192 $96 $96
Tiered $250/$300/mo. CA $204 $96 $108
Tiered and equivalized CA $165 $96 $69
* Cost savings are the estimated results of eliminating the CTC, ACTC, and also the child
exemption under federal tax law. Estimates provided by Elaine Maag at the Urban Institute’s Tax
Policy Center, 2016.

PAYING FOR IT
PRELIMINARY – DO NOT CITE OR QUOTE
29
Table 1: Cost Estimates of Universal Child Allowance Proposals (in billions)
Total Direct
Cost
Cost
Savings* Net Cost of CA:
Universal $250/mo. CA $192 $96 $96
Tiered $250/$300/mo. CA $204 $96 $108
Tiered and equivalized CA $165 $96 $69
* Cost savings are the estimated results of eliminating the CTC, ACTC, and also the child
exemption under federal tax law. Estimates provided by Elaine Maag at the Urban Institute’s Tax
Policy Center, 2016.
TPC estimates that the net cost of the Lee-Rubio Refundable CTC
expansion would be $130 in 2015
http://www.taxpolicycenter.org/publications/preliminary-analysis-family-fairness-and-opportunity-tax-
reform-act/full

II. A Randomized Experiment to
Test the Impact of Cash Income
in the First Three Years of Life

Science-to-policy need
Random assignment study of the direct effect of income
Focused on first years of life
costs of raising children largely borne by families
subsidies for basic baby needs minimal
children’s development is most sensitive to environmental influence
Although evidence base strongly suggests benefits of income support for young children, there is a critical gap in causal, experimental evidence for the very youngest children, the group for whom parents share a particularly high burden of costs.

Research questions
Is there a causal effect of income in the first 3 years of life?
What is the magnitude during early childhood--a period of the most rapid and foundational growth in brain architecture?
What are the (parent well being and family functioning) mechanisms by which income may impact the earliest years of child development?
Does such an effect exist on biological and neurological processes? Is this a necessary ingredient to more enduring positive effects on cognitive development through childhood?

First RCT of income support for
poor families with infants and toddlers
National Experiment
Sample 1000 poor mothers; ~250 per site
(Prospective sites: NYC, New Orleans, Omaha, St.
Paul/MN)
Intervention $333/month for 40 months ($4000/year)
Control $20/month for 40 months ($240/year)
Payment
Monthly reload on debit card; no restrictions
Data Collection Birth, age 1, 2 and 3
Outcomes of interest Household economic circumstances, work, child care
Family functioning, parenting
Children’s developmental outcomes: Cognitive, emotional
and brain development

Predictable unconditional cash payments
In the context of CCTs and comparable cash transfer schemes where payment is often uncertain
High frequency of intra-year income dips at the lowest end of the income spectrum, nearly double that of middle-income households with children
Qualitative portraits on the challenges of meeting monthly consumption needs, juggling
Disbursed on a debit card with a text reminder on the day of the child’s birth date, creating another source of random variation within the month

Developmental Theory of change H
igh
er
Inco
me
Stress
pathway
Child cognitive,
socio-emotional
and brain
development
Investment
pathway

Theories of Change
Theories of Change

Data Collection Birth Age 1
phone
interview
Age 2
home
visit
Age 3
lab
visit
Household economic behavior X X X X
Housing and neighborhoods X X X X
Parental employment X X X X
Nonparental care X X X
Parenting X X X
Maternal relationships X X X X
Maternal physical and mental
health
X X X X
Home environment X X X
Complexity of linguistic input
(videotaped interaction)
X
Maternal working memory X X
CHILD OUTCOMES:
Language, memory, executive
functions,
socio-emotional, pre-academic, brain function (high density
EEG/ERP)
X

Pilot Experiment
NYC Pilot
Sample 30 income eligible mothers in NYC (Columbia University
Medical Center), recruited in summer 2014
Intervention $100/month for 12 months ($1200 total)
Control $20/month for 12 months ($240 total)
Payment
Monthly reload on debit card
Data Collection Birth, 6-9 months, 12 months
Outcomes of
interest
Recruitment and retention rates; debit card activation,
problems, and frequency/type of transactions; some
parent outcomes; qualitative perceptions of finances,
budgeting, card usefulness, etc.

NYC pilot: Baseline characteristics
Average maternal age: 25.9 years
Socioeconomic characteristics
Average maternal education: 12.3 years
Average family income: $22,311
Racial/ethnic characteristics
47% Black/African American, 13% White, 40% other or declined to answer
70% Hispanic/Latina, 30% Not Hispanic/Latina

Did random assignment work?
.25
.41
-.25
-.29
.25
-1.00 -0.50 0.00 0.50 1.00
Mother's age
Mother's education
Income at baseline
Child birthweight
Gestational age
Reassuringly random (non statistically significant) differences at
baseline between the two groups

Retention rates at 12 months
Intervention group (N=15):
Completed: 12
2 moved out of state; 1 lost contact
Control group (N=15):
Completed: 13
1 moved out of state
1 moved within state but lost contact
~83% ERR, with very light touch retention strategy

Debit card use
All participants used card within one month of recruitment/activation
Funds are typically spent within two weeks
First time use of debit card for 21% of participants
Few documented problems, of the 1,112 transactions:
27 declines due to insufficient funds
6 PIN resets
11 reports of stolen/lost card
3 login; 3 card locked
2 fraudulent charges

Debit card: Patterns of weekly transactions
$0.00
$25.00
$50.00
$75.00
$100.00
Experimental Control

Debit card:
1112 transactions by type over 12 months
0
20
40
60
80
100
120
140
160
Experimental
Control

Preliminary: Experimental impacts from the pilot study
Standardized differences between families receiving $100 vs.
$20/month (n=28)
.59
.33
.70
.44
.81
.60
-1.00 -0.50 0.00 0.50 1.00
Household chaos (reverse scale)
Parenting stress (reverse scale)
Mother-child activities
Child expenditures
Child care expenditures
Center-based care use
Consistent family process advantages for the $100/month households

Qualitative interviews: Even in small amounts,
the money makes a big difference
“The money from the card really helped me out, it really, really
helped me out, especially [one] month that we didn’t have the
food stamps; we didn’t have anything at all.”
“Anything that I need, I just use it on. Or sometimes if I run out
of my food stamps I’ll use it”
“I was able to put at least some of [it] toward [baby’s] expenses,
which are huge, especially these first few years…because there’s
so many things at once.”

Even in small amounts,
savings is in the picture
Now it's just like I try to forget about it so it's there just for an
emergency, 'cause you never know when you're just stuck,
stranded somewhere with no money.”
“Well like that always comes right around my Payday or before.
Like before you know how you – it's like the day before or two
days before payday, between paydays it's a long stretch. Right
now like I need to hold some money in that – I don't have to
borrow from nobody I have the $20.00 here, so it always came in
handy. That's what I like about it.”

CONCLUDING REMARKS
Through the child tax exemption and child tax credit, our nation recognizes the societal benefit to supporting parents in raising children
But our biggest policies exclude the lowest (and highest) income families, and are not equitable
Principles of stable cash income flow for all families, including those not receiving benefits from CTC and tax exemption – met by a universal child allowance
It would complement our work-based safety net and would dramatically reduce poverty
Strong rationale for higher levels of support in early childhood

Acknowledgements
Child Allowance Proposal:
Authors thank the Annie E. Casey Foundation, Century Foundation,
the Institute for Research on Poverty (IRP) at the University of
Wisconsin, The JPB Foundation, NICHD, Russell Sage Foundation, and
Washington Center for Equitable Growth for support. The views
expressed in this paper represent those of the authors alone.
Testing the Impact of Cash Income in the First Three Years of Life
We thank the Annie E. Casey Foundation, the W.K. Kellogg
Foundation, the Jacobs Foundation, the Sherwood Foundation, and
the Smith-Richardson Foundation for support.

Acknowledgements: Testing the Impact of
Income on Early Child Development Project
We thank the Annie E. Casey Foundation, the W.K. Kellogg
Foundation, the Jacobs Foundation, the Sherwood Foundation, and
the Smith-Richardson Foundation for support.