a user-centered and autonomic multi-cloud … · architecture for high performance computing...
TRANSCRIPT

A User-Centered and Autonomic Multi-Cloud
Architecture for High Performance Computing
Applications
Alessandro Ferreira Leite
To cite this version:
Alessandro Ferreira Leite. A User-Centered and Autonomic Multi-Cloud Architecture for HighPerformance Computing Applications. Computer Science [cs]. Paris-Sud XI, 2014. English.<tel-01097295>
HAL Id: tel-01097295
https://hal.inria.fr/tel-01097295
Submitted on 19 Dec 2014
HAL is a multi-disciplinary open accessarchive for the deposit and dissemination of sci-entific research documents, whether they are pub-lished or not. The documents may come fromteaching and research institutions in France orabroad, or from public or private research centers.
L’archive ouverte pluridisciplinaire HAL, estdestinee au depot et a la diffusion de documentsscientifiques de niveau recherche, publies ou non,emanant des etablissements d’enseignement et derecherche francais ou etrangers, des laboratoirespublics ou prives.
Université Paris-Sud
Ecole Doctorale d’Informatique de Paris-SudINRIA SACLAY ÎLE-DE-FRANCE/LABORATORIE DE RECHERCHE
EN INFORMATIQUE
Discipline : Informatique
En Cotutelle Internationale avecUniversité de Brasília, Brésil
Thèse de doctoratSoutenue le 2 décembre 2014 par
Alessandro FERREIRA LEITE
A User-Centered and AutonomicMulti-Cloud Architecture for High
Performance Computing Applications
Composition du jury :
Rapporteurs : M Christophe CÉRIN Professeur (Université Paris 13)
M Jean-Louis PAZAT Professeur (INSA Rennes)
Examinateurs :
Mme Christine FROIDEVAUX Professeur (Université Paris-Sud 11)
Mme Célia GHEDINI RALHA Professeur (Université de Brasília)
Mme Christine MORIN Directrice de Recherche (INRIA, IRISA)
Directrices de thèse : Mme Christine EISENBEIS Directrice de Recherche (INRIA, LRI, UPSud)
Mme Alba MELO Professeur (Université de Brasília)
Co-directeur de thèse : M Claude TADONKI Chargé de Recherche (Mines ParisTech)


To my family and my parents
To my niece and my nephews

Acknowledgements
First, I would like to thank my supervisors for their support and advices. Next, Iwould like to thank my thesis’s reviewers Christophe Cérin and Jean-Louis Pazat, andthe members of my thesis committee: Christine Froidevaux, Célia Ghedini Ralha, andChristine Morin. I appreciate all yours comments and questions.
Additionally, I would like to thank the professors Vander Alves, Genaína Rodrigues, LiWeigang, and Jacques Blanc for their comments, suggestions, and discussions.
Next, I am very thankful to Katia Evrat and Valérie Berthou for kindly helping me invarious administrative works. In addition, I am grateful to the authors that sent me theirpapers when I requested them.
After, I would like to thank all my team members in INRIA, especially Michael Kruseand Taj Muhammad Khan. I also thank my friends Cícero Roberto, Antônio Junior, ÉricSilva, André Ribeiro, Francinaldo Araujo, Emerson Macedo, and the former Logus’s team.Moreover, I would like to thank the people I collaborated with during the last years.
I further acknowledge the financial assistance of CAPES/CNPq through the programscience without borders (grant 237561/2012-3) during the year of 2013, and CampusFrance/INRIA (project Pascale) during the period of February to July and November toDecember 2014.
Last but not least, I would like to thank my parents and my family for their uncondi-tional support and patience.
iii


Abstract
Cloud computing has been seen as an option to execute high performance computing (HPC)applications. While traditional HPC platforms such as grid and supercomputers offer a stableenvironment in terms of failures, performance, and number of resources, cloud computing offerson-demand resources generally with unpredictable performance at low financial cost. Furthermore,in cloud environment, failures are part of its normal operation. To overcome the limits of a singlecloud, clouds can be combined, forming a cloud federation often with minimal additional costs forthe users. A cloud federation can help both cloud providers and cloud users to achieve their goalssuch as to reduce the execution time, to achieve minimum cost, to increase availability, to reducepower consumption, among others. Hence, cloud federation can be an elegant solution to avoidover provisioning, thus reducing the operational costs in an average load situation, and removingresources that would otherwise remain idle and wasting power consumption, for instance. However,cloud federation increases the range of resources available for the users. As a result, cloud or systemadministration skills may be demanded from the users, as well as a considerable time to learnabout the available options. In this context, some questions arise such as: (a) which cloud resourceis appropriate for a given application? (b) how can the users execute their HPC applications withacceptable performance and financial costs, without needing to re-engineer the applications tofit clouds’ constraints? (c) how can non-cloud specialists maximize the features of the clouds,without being tied to a cloud provider? and (d) how can the cloud providers use the federationto reduce power consumption of the clouds, while still being able to give service-level agreement(SLA) guarantees to the users? Motivated by these questions, this thesis presents a SLA-awareapplication consolidation solution for cloud federation. Using a multi-agent system (MAS) tonegotiate virtual machine (VM) migrations between the clouds, simulation results show that ourapproach could reduce up to 46% of the power consumption, while trying to meet performancerequirements. Using the federation, we developed and evaluated an approach to execute a hugebioinformatics application at zero-cost. Moreover, we could decrease the execution time in 22.55%over the best single cloud execution. In addition, this thesis presents a cloud architecture calledExcalibur to auto-scale cloud-unaware application. Executing a genomics workflow, Excaliburcould seamlessly scale the applications up to 11 virtual machines, reducing the execution time by63% and the cost by 84% when compared to a user’s configuration. Finally, this thesis presentsa software product line engineering (SPLE) method to handle the commonality and variabilityof infrastructure-as-a-service (IaaS) clouds, and an autonomic multi-cloud architecture that usesthis method to configure and to deal with failures autonomously. The SPLE method uses extendedfeature model (EFM) with attributes to describe the resources and to select them based on theusers’ objectives. Experiments realized with two different cloud providers show that using theproposed method, the users could execute their application on a federated cloud environment,without needing to know the variability and constraints of the clouds.
Keywords: Autonomic computing; High performance computing (HPC); Cloud federation; Soft-ware Product Line Engineering, Variability Management of Cloud Infrastructure
v


Résumé
Le cloud computing a été considéré comme une option pour exécuter des applications de calculhaute performance (HPC). Bien que les plateformes traditionnelles de calcul haute performance tellesque les grilles et les supercalculateurs offrent un environnement stable du point de vue des défaillances,des performances, et de la taille des ressources, le cloud computing offre des ressources à la demande,généralement avec des performances imprévisibles mais à des coûts financiers abordables. En outre, dansun environnement de cloud, les défaillances sont perçues comme étant ordinaires. Pour surmonter leslimites d’un cloud individuel, plusieurs clouds peuvent être combinés pour former une fédération declouds, souvent avec des coûts supplémentaires légers pour les utilisateurs. Une fédération de clouds peutaider autant les fournisseurs que les utilisateurs à atteindre leurs objectifs tels la réduction du tempsd’exécution, la minimisation des coûts, l’augmentation de la disponibilité, la réduction de la consommationd’énergie, pour ne citer que ceux-là. Ainsi, la fédération de clouds peut être une solution élégante pouréviter le sur-approvisionnement, réduisant ainsi les coûts d’exploitation en situation de charge moyenne,et en supprimant des ressources qui, autrement, resteraient inutilisées et gaspilleraient ainsi de énergie.Cependant, la fédération de clouds élargit la gamme des ressources disponibles. En conséquence, pourles utilisateurs, des compétences en cloud computing ou en administration système sont nécessaires,ainsi qu’un temps d’apprentissage considérable pour maîtrises les options disponibles. Dans ce contexte,certaines questions se posent : (a) Quelle ressource du cloud est appropriée pour une application donnée ?(b) Comment les utilisateurs peuvent-ils exécuter leurs applications HPC avec un rendement acceptableet des coûts financiers abordables, sans avoir à reconfigurer les applications pour répondre aux normeset contraintes du cloud ? (c) Comment les non-spécialistes du cloud peuvent-ils maximiser l’usage descaractéristiques du cloud, sans être liés au fournisseur du cloud ? et (d) Comment les fournisseurs de cloudpeuvent-ils exploiter la fédération pour réduire la consommation électrique, tout en étant en mesure defournir un service garantissant les normes de qualité préétablies ? À partir de ces questions, la présentethèse propose une solution de consolidation d’applications pour la fédération de clouds qui garantitle respect des normes de qualité de service. On utilise un système multi-agents (SMA) pour négocierla migration des machines virtuelles entre les clouds. Les résultats de simulations montrent que notreapproche pourrait réduire jusqu’à 46% la consommation totale d’énergie, tout en respectant les exigencesde performance. En nous basant sur la fédération de clouds, nous avons développé et évalué une approchepour exécuter une énorme application de bioinformatique à coût zéro. En outre, nous avons pu réduirele temps d’exécution de 22,55% par rapport à la meilleure exécution dans un cloud individuel. Cettethèse présente aussi une architecture de cloud baptisée « Excalibur » qui permet l’adaptation automatiquedes applications standards pour le cloud. Dans l’exécution d’une chaîne de traitements de la génomique,Excalibur a pu parfaitement mettre à l’échelle les applications sur jusqu’à 11 machines virtuelles, ce qui aréduit le temps d’exécution de 63% et le coût de 84% par rapport à la configuration de l’utilisateur. Enfin,cette thèse présente un processus d’ingénierie des lignes de produits (PLE) pour gérer la variabilité del’infrastructure à la demande du cloud, et une architecture multi-cloud autonome qui utilise ce processuspour configurer et faire face aux défaillances de manière indépendante. Le processus PLE utilise le modèleétendu de fonction (EFM) avec des attributs pour décrire les ressources et les sélectionner en fonction desobjectifs de l’utilisateur. Les expériences réalisées avec deux fournisseurs de cloud différents montrent qu’enutilisant le modèle proposé, les utilisateurs peuvent exécuter leurs applications dans un environnement declouds fédérés, sans avoir besoin de connaître les variabilités et contraintes du cloud.
Mots-clés: Calcul Autonomique; Calcul Haute Performance (HPC); Cloud Federation; Ligne de ProduitsLogiciels; Modèles de Variabilité
vii

Resumo
A computação em nuvem tem sido considerada como uma opção para executar aplicações de altodesempenho. Entretanto, enquanto as plataformas de alto desempenho tradicionais como grid e su-percomputadores oferecem um ambiente estável quanto à falha, desempenho e número de recursos, acomputação em nuvem oferece recursos sob demanda, geralmente com desempenho imprevisível à baixocusto financeiro. Além disso, em ambiente de nuvem, as falhas fazem parte da sua normal operação. Noentanto, as nuvens podem ser combinadas, criando uma federação, para superar os limites de uma nuvemmuitas vezes com um baixo custo para os usuários. A federação de nuvens pode ajudar tanto os provedoresquanto os usuários das nuvens a atingirem diferentes objetivos tais como: reduzir o tempo de execução deuma aplicação, reduzir o custo financeiro, aumentar a disponibilidade do ambiente, reduzir o consumode energia, entre outros. Por isso, a federação de nuvens pode ser uma solução elegante para evitar osub-provisionamento de recursos ajudando os provedores a reduzirem os custos operacionais e a reduzir onúmero de recursos ativos, que outrora ficariam ociosos consumindo energia, por exemplo. No entanto, afederação de nuvens aumenta as opções de recursos disponíveis para os usuários, requerendo, em muito doscasos, conhecimento em administração de sistemas ou em computação em nuvem, bem como um tempoconsiderável para aprender sobre as opções disponíveis. Neste contexto, surgem algumas questões, taiscomo: (a) qual dentre os recursos disponíveis é apropriado para uma determinada aplicação? (b) comoos usuários podem executar suas aplicações na nuvem e obter um desempenho e um custo financeiroaceitável, sem ter que modificá-las para atender as restrições do ambiente de nuvem? (c) como os usuáriosnão especialistas em nuvem podem maximizar o uso da nuvem, sem ficar dependente de um provedor?(d) como os provedores podem utilizar a federação para reduzir o consumo de energia dos datacenters e aomesmo tempo atender os acordos de níveis de serviços? A partir destas questões, este trabalho apresentauma solução para consolidação de aplicações em nuvem federalizadas considerando os acordos de serviços.Nossa solução utiliza um sistema multi-agente para negociar a migração das máquinas virtuais entresas nuvens. Simulações mostram que nossa abordagem pode reduzir em até 46% o consumo de energia eatender os requisitos de qualidade. Nós também desenvolvemos e avaliamos uma solução para executaruma aplicação de bioinformática em nuvens federalizadas, a custo zero. Nesse caso, utilizando a federação,conseguimos diminuir o tempo de execução da aplicação em 22,55%, considerando o seu tempo de execuçãona melhor nuvem. Além disso, este trabalho apresenta uma arquitetura chamada Excalibur, que possibilitaescalar a execução de aplicações comuns em nuvem. Excalibur conseguiu escalar automaticamente aexecução de um conjunto de aplicações de bioinformática em até 11 máquinas virtuais, reduzindo o tempode execução em 63% e o custo financeiro em 84% quando comparado com uma configuração definida pelosusuários. Por fim, este trabalho apresenta um método baseado em linha de produto de software para lidarcom as variabilidades dos serviços oferecidos por nuvens de infraestrutura (IaaS), e um sistema que utilizadeste processo para configurar o ambiente e para lidar com falhas de forma automática. O nosso métodoutiliza modelo de feature estendido com atributos para descrever os recursos e para selecioná-los combase nos objetivos dos usuários. Experimentos realizados com dois provedores diferentes mostraram queutilizando o nosso processo, os usuários podem executar as suas aplicações em um ambiente de nuvemfederalizada, sem conhecer as variabilidades e limitações das nuvens.
Palavras-chave: Computação Autonômica; Computação de Alto Desempenho; Federação de Nuvens;Linha de Produto de Software; Modelo de Features
ix

Contents
List of Figures xvii
List of Tables xxi
Listings xxii
List of Abbreviations xxiii
1 Introduction 11.1 Motivation . . . . . . . . . . . . . . . . . . . . . . . . . . . . . . . . . . . . 11.2 Objectives . . . . . . . . . . . . . . . . . . . . . . . . . . . . . . . . . . . . 31.3 Thesis Statement . . . . . . . . . . . . . . . . . . . . . . . . . . . . . . . . 41.4 Contributions . . . . . . . . . . . . . . . . . . . . . . . . . . . . . . . . . . 41.5 Publications . . . . . . . . . . . . . . . . . . . . . . . . . . . . . . . . . . . 61.6 Thesis Outline . . . . . . . . . . . . . . . . . . . . . . . . . . . . . . . . . . 7
I Background 9
2 Large-Scale Distributed Systems 102.1 Evolution . . . . . . . . . . . . . . . . . . . . . . . . . . . . . . . . . . . . 11
2.1.1 The 1960s . . . . . . . . . . . . . . . . . . . . . . . . . . . . . . . . 112.1.2 The 1970s . . . . . . . . . . . . . . . . . . . . . . . . . . . . . . . . 122.1.3 The 1980s . . . . . . . . . . . . . . . . . . . . . . . . . . . . . . . . 132.1.4 The 1990s . . . . . . . . . . . . . . . . . . . . . . . . . . . . . . . . 132.1.5 2000-2014 . . . . . . . . . . . . . . . . . . . . . . . . . . . . . . . . 152.1.6 Timeline . . . . . . . . . . . . . . . . . . . . . . . . . . . . . . . . . 16
2.2 Cluster Computing . . . . . . . . . . . . . . . . . . . . . . . . . . . . . . . 172.3 Grid Computing . . . . . . . . . . . . . . . . . . . . . . . . . . . . . . . . . 19
2.3.1 Architecture . . . . . . . . . . . . . . . . . . . . . . . . . . . . . . . 202.4 Peer-to-peer . . . . . . . . . . . . . . . . . . . . . . . . . . . . . . . . . . . 21
2.4.1 Architecture . . . . . . . . . . . . . . . . . . . . . . . . . . . . . . . 232.4.2 Unstructured P2P Network . . . . . . . . . . . . . . . . . . . . . . 242.4.3 Structured P2P Network . . . . . . . . . . . . . . . . . . . . . . . . 242.4.4 Hybrid P2P Network . . . . . . . . . . . . . . . . . . . . . . . . . . 262.4.5 Hierarchical P2P Network . . . . . . . . . . . . . . . . . . . . . . . 272.4.6 Comparative View of P2P Structures . . . . . . . . . . . . . . . . . 28
xi

2.5 Cloud Computing . . . . . . . . . . . . . . . . . . . . . . . . . . . . . . . . 292.5.1 Characteristics . . . . . . . . . . . . . . . . . . . . . . . . . . . . . 302.5.2 Drawbacks . . . . . . . . . . . . . . . . . . . . . . . . . . . . . . . . 32
2.6 Summary . . . . . . . . . . . . . . . . . . . . . . . . . . . . . . . . . . . . 34
3 A Detailed View of Cloud Computing 363.1 Technologies Related to Cloud Computing . . . . . . . . . . . . . . . . . . 37
3.1.1 Virtualization . . . . . . . . . . . . . . . . . . . . . . . . . . . . . . 373.1.1.1 Definition . . . . . . . . . . . . . . . . . . . . . . . . . . . 373.1.1.2 Techniques . . . . . . . . . . . . . . . . . . . . . . . . . . 383.1.1.3 Live Migration . . . . . . . . . . . . . . . . . . . . . . . . 393.1.1.4 Workload and Server Consolidation . . . . . . . . . . . . . 39
3.1.2 Service-Level Agreement . . . . . . . . . . . . . . . . . . . . . . . . 413.1.3 MapReduce . . . . . . . . . . . . . . . . . . . . . . . . . . . . . . . 43
3.1.3.1 Definition . . . . . . . . . . . . . . . . . . . . . . . . . . . 433.1.3.2 Characteristics . . . . . . . . . . . . . . . . . . . . . . . . 44
3.2 Cloud Organization . . . . . . . . . . . . . . . . . . . . . . . . . . . . . . . 453.2.1 Architecture and Service Model . . . . . . . . . . . . . . . . . . . . 453.2.2 Deployment Model . . . . . . . . . . . . . . . . . . . . . . . . . . . 473.2.3 Cloud Federation . . . . . . . . . . . . . . . . . . . . . . . . . . . . 48
3.2.3.1 Definition . . . . . . . . . . . . . . . . . . . . . . . . . . . 483.2.3.2 Classification . . . . . . . . . . . . . . . . . . . . . . . . . 493.2.3.3 Challenges . . . . . . . . . . . . . . . . . . . . . . . . . . 51
3.3 Cloud Standards and Metrics . . . . . . . . . . . . . . . . . . . . . . . . . 533.3.1 Cloud Standards . . . . . . . . . . . . . . . . . . . . . . . . . . . . 533.3.2 Cloud Metrics . . . . . . . . . . . . . . . . . . . . . . . . . . . . . . 54
3.4 IaaS Cloud Computing Systems . . . . . . . . . . . . . . . . . . . . . . . . 553.4.1 Architecture . . . . . . . . . . . . . . . . . . . . . . . . . . . . . . . 553.4.2 Using an IaaS Cloud Service . . . . . . . . . . . . . . . . . . . . . . 57
3.5 Cloud Computing Architectures . . . . . . . . . . . . . . . . . . . . . . . . 603.5.1 Centralized Systems . . . . . . . . . . . . . . . . . . . . . . . . . . 60
3.5.1.1 Claudia . . . . . . . . . . . . . . . . . . . . . . . . . . . . 603.5.1.2 SciCumulus . . . . . . . . . . . . . . . . . . . . . . . . . . 603.5.1.3 Cloud-TM . . . . . . . . . . . . . . . . . . . . . . . . . . . 613.5.1.4 mOSAIC . . . . . . . . . . . . . . . . . . . . . . . . . . . 633.5.1.5 TClouds . . . . . . . . . . . . . . . . . . . . . . . . . . . . 633.5.1.6 FraSCAti . . . . . . . . . . . . . . . . . . . . . . . . . . . 633.5.1.7 STRATOS . . . . . . . . . . . . . . . . . . . . . . . . . . 653.5.1.8 COS . . . . . . . . . . . . . . . . . . . . . . . . . . . . . . 663.5.1.9 Rafhyc . . . . . . . . . . . . . . . . . . . . . . . . . . . . . 663.5.1.10 JSTaaS . . . . . . . . . . . . . . . . . . . . . . . . . . . . 68
3.5.2 Decentralized Systems . . . . . . . . . . . . . . . . . . . . . . . . . 683.5.2.1 Reservoir . . . . . . . . . . . . . . . . . . . . . . . . . . . 683.5.2.2 Open Cirrus . . . . . . . . . . . . . . . . . . . . . . . . . . 693.5.2.3 CometCloud . . . . . . . . . . . . . . . . . . . . . . . . . 703.5.2.4 Contrail . . . . . . . . . . . . . . . . . . . . . . . . . . . . 71
xii

3.5.2.5 OPTIMIS . . . . . . . . . . . . . . . . . . . . . . . . . . . 723.5.3 Comparative View . . . . . . . . . . . . . . . . . . . . . . . . . . . 73
3.6 Summary . . . . . . . . . . . . . . . . . . . . . . . . . . . . . . . . . . . . 73
4 Autonomic Computing 764.1 Definition . . . . . . . . . . . . . . . . . . . . . . . . . . . . . . . . . . . . 774.2 Properties . . . . . . . . . . . . . . . . . . . . . . . . . . . . . . . . . . . . 774.3 Architecture . . . . . . . . . . . . . . . . . . . . . . . . . . . . . . . . . . . 794.4 Autonomic Computing Systems . . . . . . . . . . . . . . . . . . . . . . . . 80
4.4.1 V-MAN . . . . . . . . . . . . . . . . . . . . . . . . . . . . . . . . . 804.4.2 Sunflower . . . . . . . . . . . . . . . . . . . . . . . . . . . . . . . . 804.4.3 Market-based . . . . . . . . . . . . . . . . . . . . . . . . . . . . . . 814.4.4 Component-Management Approach . . . . . . . . . . . . . . . . . . 824.4.5 Snooze . . . . . . . . . . . . . . . . . . . . . . . . . . . . . . . . . . 824.4.6 Cloudlet . . . . . . . . . . . . . . . . . . . . . . . . . . . . . . . . . 834.4.7 Distributed VM Scheduler . . . . . . . . . . . . . . . . . . . . . . . 834.4.8 Thermal Management Framework . . . . . . . . . . . . . . . . . . . 854.4.9 SmartScale . . . . . . . . . . . . . . . . . . . . . . . . . . . . . . . 854.4.10 SLA Management . . . . . . . . . . . . . . . . . . . . . . . . . . . . 864.4.11 Comparative View . . . . . . . . . . . . . . . . . . . . . . . . . . . 87
4.5 Summary . . . . . . . . . . . . . . . . . . . . . . . . . . . . . . . . . . . . 87
5 Green Computing 895.1 Energy-Aware Computing . . . . . . . . . . . . . . . . . . . . . . . . . . . 905.2 Green Data Centers . . . . . . . . . . . . . . . . . . . . . . . . . . . . . . . 92
5.2.1 Green Data Center Benchmarks . . . . . . . . . . . . . . . . . . . . 925.2.1.1 The Green500 Initiative . . . . . . . . . . . . . . . . . . . 935.2.1.2 The Green Index . . . . . . . . . . . . . . . . . . . . . . . 935.2.1.3 SPECpower . . . . . . . . . . . . . . . . . . . . . . . . . . 945.2.1.4 JouleSort . . . . . . . . . . . . . . . . . . . . . . . . . . . 945.2.1.5 Comparative View . . . . . . . . . . . . . . . . . . . . . . 94
5.3 Green Performance Indicators . . . . . . . . . . . . . . . . . . . . . . . . . 955.3.1 The Approach of Stanley, Brill, and Koomey . . . . . . . . . . . . . 95
5.3.1.1 Overview . . . . . . . . . . . . . . . . . . . . . . . . . . . 955.3.1.2 Metrics . . . . . . . . . . . . . . . . . . . . . . . . . . . . 955.3.1.3 Final Remarks . . . . . . . . . . . . . . . . . . . . . . . . 97
5.3.2 The Green Grid Approach . . . . . . . . . . . . . . . . . . . . . . . 975.3.2.1 Overview . . . . . . . . . . . . . . . . . . . . . . . . . . . 975.3.2.2 Metrics . . . . . . . . . . . . . . . . . . . . . . . . . . . . 985.3.2.3 Final Remarks . . . . . . . . . . . . . . . . . . . . . . . . 99
5.4 Summary . . . . . . . . . . . . . . . . . . . . . . . . . . . . . . . . . . . . 99
II Contributions 100
6 Power-Aware Server Consolidation for Federated Clouds 1016.1 Introduction and Motivation . . . . . . . . . . . . . . . . . . . . . . . . . . 102
xiii

6.2 Design of the Proposed Solution . . . . . . . . . . . . . . . . . . . . . . . . 1036.3 Experimental Results . . . . . . . . . . . . . . . . . . . . . . . . . . . . . . 106
6.3.1 Modifications in CloudSim . . . . . . . . . . . . . . . . . . . . . . . 1066.3.2 Simulation Environment . . . . . . . . . . . . . . . . . . . . . . . . 1076.3.3 Scenario 1: workload submission to a single data center under power
consumption threshold . . . . . . . . . . . . . . . . . . . . . . . . . 1076.3.4 Scenario 2: distinct workload submission to different overloaded
data centers . . . . . . . . . . . . . . . . . . . . . . . . . . . . . . . 1096.4 Related Work . . . . . . . . . . . . . . . . . . . . . . . . . . . . . . . . . . 1096.5 Summary . . . . . . . . . . . . . . . . . . . . . . . . . . . . . . . . . . . . 113
7 Biological Sequence Comparison at Zero-Cost on a Vertical Public CloudFederation 1147.1 Introduction and Motivation . . . . . . . . . . . . . . . . . . . . . . . . . . 1157.2 Biological Sequence Comparison . . . . . . . . . . . . . . . . . . . . . . . . 116
7.2.1 The Smith-Waterman Algorithm . . . . . . . . . . . . . . . . . . . 1177.3 Design of our Federated Cloud Architecture . . . . . . . . . . . . . . . . . 118
7.3.1 Task Generation with MapReduce . . . . . . . . . . . . . . . . . . . 1207.3.2 Smith-Waterman Execution . . . . . . . . . . . . . . . . . . . . . . 120
7.4 Experimental Results . . . . . . . . . . . . . . . . . . . . . . . . . . . . . . 1217.5 Related Work . . . . . . . . . . . . . . . . . . . . . . . . . . . . . . . . . . 1257.6 Summary . . . . . . . . . . . . . . . . . . . . . . . . . . . . . . . . . . . . 126
8 Excalibur: A User-Centered Cloud Architecture for Executing ParallelApplications 1288.1 Introduction and Motivation . . . . . . . . . . . . . . . . . . . . . . . . . . 1298.2 Architecture Overview . . . . . . . . . . . . . . . . . . . . . . . . . . . . . 130
8.2.1 Scaling Cloud-Unaware Applications with Budget Restrictions andResource Constraints . . . . . . . . . . . . . . . . . . . . . . . . . . 132
8.2.2 Reducing Data Movement to Reduce Cost and Execution Time . . 1338.2.3 Reducing Job Makespan with Workload Adjustment . . . . . . . . . 1348.2.4 Making the Cloud Transparent for the Users . . . . . . . . . . . . . 134
8.3 Experimental Results . . . . . . . . . . . . . . . . . . . . . . . . . . . . . . 1368.3.1 Scenario 1: execution without auto-scaling and based on users’
preferences . . . . . . . . . . . . . . . . . . . . . . . . . . . . . . . . 1398.3.2 Scenario 2: execution with auto-scaling . . . . . . . . . . . . . . . . 140
8.4 Related Work . . . . . . . . . . . . . . . . . . . . . . . . . . . . . . . . . . 1418.5 Summary . . . . . . . . . . . . . . . . . . . . . . . . . . . . . . . . . . . . 143
9 Resource Selection Using Automated Feature-Based Configuration Man-agement in Federated Clouds 1459.1 Introduction . . . . . . . . . . . . . . . . . . . . . . . . . . . . . . . . . . . 1469.2 Motivation and Challenges . . . . . . . . . . . . . . . . . . . . . . . . . . . 1499.3 Multi-Objective Optimization . . . . . . . . . . . . . . . . . . . . . . . . . 1519.4 Feature Modeling . . . . . . . . . . . . . . . . . . . . . . . . . . . . . . . . 1549.5 Proposed Model . . . . . . . . . . . . . . . . . . . . . . . . . . . . . . . . . 157
9.5.1 Cloud Computing Model . . . . . . . . . . . . . . . . . . . . . . . . 158
xiv

9.5.1.1 Instance Type Model . . . . . . . . . . . . . . . . . . . . . 1589.5.1.2 Disk Model . . . . . . . . . . . . . . . . . . . . . . . . . . 1589.5.1.3 Virtual Machine Image Model . . . . . . . . . . . . . . . . 1599.5.1.4 Instance Model . . . . . . . . . . . . . . . . . . . . . . . . 159
9.5.2 Cost Model . . . . . . . . . . . . . . . . . . . . . . . . . . . . . . . 1609.5.2.1 Networking and Storage Cost . . . . . . . . . . . . . . . . 1609.5.2.2 Instance Cost . . . . . . . . . . . . . . . . . . . . . . . . . 160
9.6 Modeling IaaS Clouds Configuration Options with Feature Model . . . . . 1619.7 Experimental Results . . . . . . . . . . . . . . . . . . . . . . . . . . . . . . 162
9.7.1 Scenario 1: simple . . . . . . . . . . . . . . . . . . . . . . . . . . . 1709.7.2 Scenario 2: compute . . . . . . . . . . . . . . . . . . . . . . . . . . 1709.7.3 Scenario 3: compute and memory . . . . . . . . . . . . . . . . . . . 173
9.8 Related Work . . . . . . . . . . . . . . . . . . . . . . . . . . . . . . . . . . 1739.8.1 Virtual Machine Image Configuration . . . . . . . . . . . . . . . . . 175
9.8.1.1 SCORCH . . . . . . . . . . . . . . . . . . . . . . . . . . . 1759.8.1.2 VMI Provisioning . . . . . . . . . . . . . . . . . . . . . . . 1759.8.1.3 Typical Virtual Appliances . . . . . . . . . . . . . . . . . 177
9.8.2 Virtual Machine Image Deployment . . . . . . . . . . . . . . . . . . 1779.8.2.1 Virtual Appliance Model . . . . . . . . . . . . . . . . . . . 1779.8.2.2 Composite Appliance . . . . . . . . . . . . . . . . . . . . . 177
9.8.3 Deploying PaaS Applications . . . . . . . . . . . . . . . . . . . . . 1799.8.3.1 HW-CSPL . . . . . . . . . . . . . . . . . . . . . . . . . . 1799.8.3.2 SALOON . . . . . . . . . . . . . . . . . . . . . . . . . . . 179
9.8.4 Configuration options of multi-tenant applications . . . . . . . . . . 1809.8.4.1 Multi-Tenant Deployment . . . . . . . . . . . . . . . . . . 1809.8.4.2 Capturing Functional and Deployment Variability . . . . . 1809.8.4.3 Configuration Management Process . . . . . . . . . . . . . 1829.8.4.4 Service Line Engineering Process . . . . . . . . . . . . . . 183
9.8.5 Infrastructure Configuration . . . . . . . . . . . . . . . . . . . . . . 1849.8.5.1 AWS EC2 Service Provisioning . . . . . . . . . . . . . . . 184
9.8.6 Comparative View . . . . . . . . . . . . . . . . . . . . . . . . . . . 1849.9 Summary . . . . . . . . . . . . . . . . . . . . . . . . . . . . . . . . . . . . 188
10 Dohko: An Autonomic and Goal-Oriented System for Federated Clouds18910.1 Introduction and Motivation . . . . . . . . . . . . . . . . . . . . . . . . . . 19010.2 System Architecture . . . . . . . . . . . . . . . . . . . . . . . . . . . . . . 191
10.2.1 Client Layer . . . . . . . . . . . . . . . . . . . . . . . . . . . . . . . 19110.2.2 Core Layer . . . . . . . . . . . . . . . . . . . . . . . . . . . . . . . . 19310.2.3 Infrastructure Layer . . . . . . . . . . . . . . . . . . . . . . . . . . 19610.2.4 Monitoring Cross-Layer . . . . . . . . . . . . . . . . . . . . . . . . 19710.2.5 Autonomic Properties . . . . . . . . . . . . . . . . . . . . . . . . . 197
10.2.5.1 Self-Configuration . . . . . . . . . . . . . . . . . . . . . . 19810.2.5.2 Self-Healing . . . . . . . . . . . . . . . . . . . . . . . . . . 19810.2.5.3 Context-Awareness . . . . . . . . . . . . . . . . . . . . . . 199
10.2.6 Executing an Application in the Architecture . . . . . . . . . . . . 20010.3 Experimental Results . . . . . . . . . . . . . . . . . . . . . . . . . . . . . . 201
xv

10.3.1 Experimental Setup . . . . . . . . . . . . . . . . . . . . . . . . . . . 20110.3.2 Scenario 1: application deployment . . . . . . . . . . . . . . . . . . 20510.3.3 Scenario 2: application execution . . . . . . . . . . . . . . . . . . . 20610.3.4 Scenario 3: application deployment and execution with failures . . . 206
10.4 Related Work . . . . . . . . . . . . . . . . . . . . . . . . . . . . . . . . . . 20910.5 Summary . . . . . . . . . . . . . . . . . . . . . . . . . . . . . . . . . . . . 211
11 Conclusion 21211.1 Overview . . . . . . . . . . . . . . . . . . . . . . . . . . . . . . . . . . . . . 21211.2 Summary of the Contributions . . . . . . . . . . . . . . . . . . . . . . . . . 21311.3 Threat to Validity . . . . . . . . . . . . . . . . . . . . . . . . . . . . . . . . 21711.4 Perspectives . . . . . . . . . . . . . . . . . . . . . . . . . . . . . . . . . . . 21811.5 Summary . . . . . . . . . . . . . . . . . . . . . . . . . . . . . . . . . . . . 219
Bibliography 220
xvi

List of Figures
2.1 Computing landmarks in five decades . . . . . . . . . . . . . . . . . . . . . 172.2 Tompouce: an example of a medium-scale cluster . . . . . . . . . . . . . . 182.3 Tianhe-2 architecture and network topology . . . . . . . . . . . . . . . . . 182.4 Foster’s grid computing model . . . . . . . . . . . . . . . . . . . . . . . . . 192.5 Hourglass grid architecture . . . . . . . . . . . . . . . . . . . . . . . . . . . 202.6 Globus Toolkit 3 architecture . . . . . . . . . . . . . . . . . . . . . . . . . 212.7 Globus Toolkit 4 architecture . . . . . . . . . . . . . . . . . . . . . . . . . 222.8 Different use of P2P systems . . . . . . . . . . . . . . . . . . . . . . . . . . 232.9 Generic P2P architecture . . . . . . . . . . . . . . . . . . . . . . . . . . . . 242.10 Example of a lookup operation in Chord . . . . . . . . . . . . . . . . . . . 272.11 A cloud computing system . . . . . . . . . . . . . . . . . . . . . . . . . . . 302.12 A vision of grid, P2P, and cloud computing characteristics overlaps . . . . 31
3.1 Example of virtualization . . . . . . . . . . . . . . . . . . . . . . . . . . . . 383.2 Example of workload consolidation using virtual machines . . . . . . . . . 403.3 Example of an SLA structure . . . . . . . . . . . . . . . . . . . . . . . . . 423.4 MapReduce execution flow . . . . . . . . . . . . . . . . . . . . . . . . . . . 443.5 Cloud computing architecture . . . . . . . . . . . . . . . . . . . . . . . . . 453.6 Cloud service model considering the customers’ viewpoint . . . . . . . . . . 463.7 Hybrid cloud scenario . . . . . . . . . . . . . . . . . . . . . . . . . . . . . . 483.8 An example of the cloud federation approach . . . . . . . . . . . . . . . . . 493.9 Difference between multi-clouds and federated clouds . . . . . . . . . . . . 503.10 Categories of federation of clouds: vertical, horizontal, inter-cloud, cross-
cloud, and sky computing . . . . . . . . . . . . . . . . . . . . . . . . . . . 503.11 A horizontal cloud federated scenario with three clouds . . . . . . . . . . . 523.12 A generic IaaS architecture . . . . . . . . . . . . . . . . . . . . . . . . . . . 583.13 Storage types usually available in IaaS clouds . . . . . . . . . . . . . . . . 583.14 Claudia architecture . . . . . . . . . . . . . . . . . . . . . . . . . . . . . . 613.15 SciCumulus architecture . . . . . . . . . . . . . . . . . . . . . . . . . . . . 623.16 Cloud-TM architecture . . . . . . . . . . . . . . . . . . . . . . . . . . . . . 623.17 mOSAIC architecture . . . . . . . . . . . . . . . . . . . . . . . . . . . . . . 643.18 TClouds architecture . . . . . . . . . . . . . . . . . . . . . . . . . . . . . . 653.19 FraSCAti architecture . . . . . . . . . . . . . . . . . . . . . . . . . . . . . 653.20 Stratos architecture . . . . . . . . . . . . . . . . . . . . . . . . . . . . . . . 663.21 COS architecture . . . . . . . . . . . . . . . . . . . . . . . . . . . . . . . . 673.22 Rafhyc architecture . . . . . . . . . . . . . . . . . . . . . . . . . . . . . . . 67
xvii
3.23 Cloud bursting architecture . . . . . . . . . . . . . . . . . . . . . . . . . . 683.24 Reservoir architecture . . . . . . . . . . . . . . . . . . . . . . . . . . . . . . 693.25 Open Cirrus architecture . . . . . . . . . . . . . . . . . . . . . . . . . . . . 703.26 CometCloud architecture . . . . . . . . . . . . . . . . . . . . . . . . . . . . 713.27 Contrail architecture . . . . . . . . . . . . . . . . . . . . . . . . . . . . . . 723.28 OPTIMIS architecture . . . . . . . . . . . . . . . . . . . . . . . . . . . . . 73
4.1 Architecture of an autonomic element . . . . . . . . . . . . . . . . . . . . . 794.2 Sunflower architecture . . . . . . . . . . . . . . . . . . . . . . . . . . . . . 814.3 Control loop of a component management cloud system . . . . . . . . . . . 824.4 Snooze architecture . . . . . . . . . . . . . . . . . . . . . . . . . . . . . . . 834.5 Cloudlet architecture . . . . . . . . . . . . . . . . . . . . . . . . . . . . . . 844.6 DVMS control loop . . . . . . . . . . . . . . . . . . . . . . . . . . . . . . . 844.7 Thermal-aware autonomic management architecture . . . . . . . . . . . . . 854.8 SmartScale architecture . . . . . . . . . . . . . . . . . . . . . . . . . . . . 86
5.1 Taxonomy of power and energy management techniques . . . . . . . . . . . 915.2 Green metrics categorization of Stanley, Brill, and Koomey . . . . . . . . . 965.3 The Green Grid Metrics . . . . . . . . . . . . . . . . . . . . . . . . . . . . 97
6.1 Agents of the cloud market . . . . . . . . . . . . . . . . . . . . . . . . . . . 1046.2 Detailed view of a data center . . . . . . . . . . . . . . . . . . . . . . . . . 1046.3 Case study 1: power consumption with 2 data centers under limited power
consumption . . . . . . . . . . . . . . . . . . . . . . . . . . . . . . . . . . . 1086.4 Case study 2: power consumption of two overloaded data centers under
limited power consumption . . . . . . . . . . . . . . . . . . . . . . . . . . . 110
7.1 Comparing two biological sequences . . . . . . . . . . . . . . . . . . . . . . 1177.2 Example of a Smith-Waterman similarity matrix . . . . . . . . . . . . . . . 1187.3 Federated cloud architecture to execute MapReduce applications . . . . . . 1197.4 Type of the messages exchanged in our multi-cloud architecture . . . . . . 1197.5 Comparing protein sequences with a genomics database on multiple clouds 1217.6 Smith-Waterman execution following the MapReduce model . . . . . . . . 1217.7 Execution time for 24 sequence comparisons with the Uniprot/SwissProt
database . . . . . . . . . . . . . . . . . . . . . . . . . . . . . . . . . . . . . 1237.8 Sequential execution time for the longest sequence (Q9UKN1) with SSEARCH
compared with the standalone execution time in Amazon EC2 . . . . . . . 1247.9 GCUPS of 24 query sequences comparison with the database UniProtKB/Swiss-
Prot using our SW implementation . . . . . . . . . . . . . . . . . . . . . . 124
8.1 Excalibur: services and layers . . . . . . . . . . . . . . . . . . . . . . . . . 1318.2 A DAG representing a workflow application with 4 tasks, where one of
them, T3, is composed of three independent subtasks . . . . . . . . . . . . 1328.3 Executing an application using the Excalibur cloud architecture . . . . . . 1378.4 The Infernal-Segemehl workflow . . . . . . . . . . . . . . . . . . . . . . . . 1398.5 Infernal’s target hits table . . . . . . . . . . . . . . . . . . . . . . . . . . . 1398.6 Cost and execution time of the Infernal-Segemehl workflow on the cloud,
when allocating the resources based on users’ preferences . . . . . . . . . . 140
xviii
8.7 Monetary cost and execution time of the Infernal-Segemehl workflow on thecloud with the auto-scaling enabled . . . . . . . . . . . . . . . . . . . . . . 142
8.8 Scaling the Infernal-Segemehl workflow . . . . . . . . . . . . . . . . . . . . 142
9.1 An engineering method to handle clouds’ variabilities . . . . . . . . . . . . 1489.2 Average network bandwidth of the Amazon EC2 instance c3.8xlarge when
created with the default configuration; and using an internal (private) andan external (public) address for data transfer . . . . . . . . . . . . . . . . . 150
9.3 Multi-objective optimization problem evaluation mapping . . . . . . . . . . 1529.4 Pareto optimality for two objectives . . . . . . . . . . . . . . . . . . . . . . 1539.5 Example of a feature model with And, Optional, Mandatory, Or, and Alter-
native features . . . . . . . . . . . . . . . . . . . . . . . . . . . . . . . . . . 1569.6 Abstract extended feature model of IaaS clouds . . . . . . . . . . . . . . . 1639.7 Our process to select and to deploy the resources in the clouds . . . . . . . 1649.8 Example of the abstract extended feature model instantiated to represent
two products of Amazon EC2 . . . . . . . . . . . . . . . . . . . . . . . . . 1669.9 Example of an abstract extended feature model instantiated to represent
two products of GCE . . . . . . . . . . . . . . . . . . . . . . . . . . . . . . 1679.10 UnixBench score for one, two, four, and eight virtual cores for the general
instance types of Amazon EC2 and Google Compute Engine (GCE) . . . . 1699.11 Instance types that offer at least 4 vCPU cores and 4GB of RAM memory
with a cost of at most 0.5 USD/hour . . . . . . . . . . . . . . . . . . . . . 1719.12 Instance types in the Pareto front that offer at least 4 vCPU cores and 4GB
of RAM memory with a cost of at most 0.5 USD/hour . . . . . . . . . . . 1719.13 Instance types suggested by the system that offer at least 4 vCPU cores
and 4GB of RAM memory with a cost of at most 0.5 USD/hour . . . . . . 1729.14 Instance types that offer at least 16 CPU cores and 8GB of RAM memory
with a cost of at most 1.0 USD/hour . . . . . . . . . . . . . . . . . . . . . 1729.15 The solutions with the minimal cost (best solutions) when requested at
least 16 CPU cores and 8GB of RAM memory with a cost of at most 1.0USD/hour . . . . . . . . . . . . . . . . . . . . . . . . . . . . . . . . . . . . 173
9.16 Instance types that offer at least 16 CPU cores and 90GB of RAM memorywith a cost of at most 2 USD/hour . . . . . . . . . . . . . . . . . . . . . . 174
9.17 Instance types in the Pareto front that offer at least 16 CPU cores and90GB of RAM memory, with a cost of at most 2 USD/hour . . . . . . . . . 174
9.18 SCORCH MDE process . . . . . . . . . . . . . . . . . . . . . . . . . . . . 1769.19 MDE approach for VMI configuration . . . . . . . . . . . . . . . . . . . . . 1769.20 Virtual appliance model . . . . . . . . . . . . . . . . . . . . . . . . . . . . 1789.21 Composite appliance model . . . . . . . . . . . . . . . . . . . . . . . . . . 1789.22 HW-CSPL’s feature model . . . . . . . . . . . . . . . . . . . . . . . . . . . 1799.23 SALOON framework . . . . . . . . . . . . . . . . . . . . . . . . . . . . . . . 1809.24 Feature model showing external and internal variability options of a multi-
tenant SaaS application . . . . . . . . . . . . . . . . . . . . . . . . . . . . 1819.25 A model for managing configuration options of SaaS applications . . . . . . 1829.26 A configuration process model and its stages . . . . . . . . . . . . . . . . . 1839.27 A service line engineering method . . . . . . . . . . . . . . . . . . . . . . . 183
xix

9.28 Extended feature model for EC2, EBS, and S3 services . . . . . . . . . . . 185
10.1 Design and main modules of an autonomic architecture for multiple clouds 19210.2 Structure of the hierarchical P2P overlay connecting two clouds . . . . . . 19710.3 The autonomic properties implemented by our architecture . . . . . . . . . 19810.4 Example of super-peer failure and definition of a new super-peer . . . . . . 19910.5 Interaction between the architecture’s module when submitted an applica-
tion to execute . . . . . . . . . . . . . . . . . . . . . . . . . . . . . . . . . 20210.6 Workflow to create one virtual machine in the cloud . . . . . . . . . . . . . 20310.7 Configuration time of the virtual machines on the clouds . . . . . . . . . . 20610.8 SSEARCH’s execution time on the clouds to compare 24 genomics query
sequences with the UniProtKB/Swiss-Prot database . . . . . . . . . . . . . 20710.9 Execution time of the SSEARCH application to compare 24 genomics query
sequences with the UniProtKB/Swiss-Prot database in a multi-cloud scenario20810.10Deployment and execution time of the experiments . . . . . . . . . . . . . 20810.11Execution time of the application on the clouds with three different type of
failures . . . . . . . . . . . . . . . . . . . . . . . . . . . . . . . . . . . . . . 209
xx
List of Tables
2.1 Comparative view of the P2P overlay networks . . . . . . . . . . . . . . . . 28
3.1 A summary of some cloud standards . . . . . . . . . . . . . . . . . . . . . 543.2 Some metrics to evaluate an IaaS cloud . . . . . . . . . . . . . . . . . . . . 563.3 Comparative view of some cloud architectures . . . . . . . . . . . . . . . . 74
4.1 Autonomic computing systems . . . . . . . . . . . . . . . . . . . . . . . . . 88
5.1 Energy efficiency benchmarks and metrics . . . . . . . . . . . . . . . . . . 95
6.1 Comparative view of cloud server consolidation strategies . . . . . . . . . . 113
7.1 Configuration of the clouds to execute the SW algorithm . . . . . . . . . . 1227.2 Query sequences compared to the UniprotKb/Swiss-Prot genomics database1227.3 Comparative view of the approaches that implement SW in HPC platforms 127
8.1 Resources used to execute the Infernal-Segemehl workflow . . . . . . . . . 1398.2 Comparative view of user-centered cloud architectures . . . . . . . . . . . . 143
9.1 Using group cardinality in feature model diagrams . . . . . . . . . . . . . . 1569.2 Notation of the model . . . . . . . . . . . . . . . . . . . . . . . . . . . . . 1579.3 Amazon EC2 instance types and their cost in the region of Virginia . . . . 1659.4 Google Compute Engine (GCE) instance types and their cost in the US region1689.5 Benchmark applications . . . . . . . . . . . . . . . . . . . . . . . . . . . . 1689.6 Three users’ requirements to select the clouds’ resources . . . . . . . . . . 1709.7 Instance types in the Pareto front considering a demand for 16 CPU cores
and 8GB of RAM memory with a cost of at most 1.0 USD/hour . . . . . . 1719.8 Characteristics of the instance types that offer at least 16 CPU cores and
90GB of RAM memory . . . . . . . . . . . . . . . . . . . . . . . . . . . . . 1739.9 Comparative view of cloud variability models . . . . . . . . . . . . . . . . . 187
10.1 Main operations implemented by the key-value store . . . . . . . . . . . . . 19610.2 Setup of the application . . . . . . . . . . . . . . . . . . . . . . . . . . . . 20310.3 Users’ requirements to execute the SSEARCH in the cloud . . . . . . . . . 20510.4 Instance types that met the users’ requirements to execute the SSEARCH 20510.5 Financial cost for executing the application on the cloud considering different
requirements . . . . . . . . . . . . . . . . . . . . . . . . . . . . . . . . . . . 20710.6 Comparison of the cloud architectures considering their autonomic properties210
xxi

Listings
3.1 Counting the number of occurrence of each word in a text using MapReduce [98] 438.1 Example of a splittable file format (i.e., FASTA file) . . . . . . . . . . . . . 1338.2 Example of a JSON with three genomics sequences . . . . . . . . . . . . . 1338.3 Defining a genomics analysis application . . . . . . . . . . . . . . . . . . . 1348.4 Defining a Twitter analysis application . . . . . . . . . . . . . . . . . . . . 1348.5 Excalibur: example of a YAML file with the requirements and one applica-
tion to be executed on the cloud . . . . . . . . . . . . . . . . . . . . . . . . 1368.6 Users’ description of the Infernal-Segemehl workflow . . . . . . . . . . . . . 13810.1 Structure of an application descriptor . . . . . . . . . . . . . . . . . . . . . 19310.2 An example of a deployment descriptor generated by the provisioning module19410.3 Example of one script with three variability points . . . . . . . . . . . . . . 19510.4 Application descriptor with the requirements and one application to be
executed in one cloud . . . . . . . . . . . . . . . . . . . . . . . . . . . . . . 20110.5 An application descriptor with one SSEARCH description to be executed
in the cloud . . . . . . . . . . . . . . . . . . . . . . . . . . . . . . . . . . . 204
xxii
List of Abbreviations
AE Autonomic Element
AM Autonomic Manager
API Application Programming Interface
AT Allocation Trust
AWS Amazon Web Services
BPEL Business Process Execution Language
CA Cloud Availability
CDMI Cloud Data Management Interface
CE Cost-Effectiveness
CERA Carbon Emission Regulator Agency
CIMI Cloud Infrastructure Management Interface
CK Configuration Knowledge
Clafer Class feature reference
CloVR Cloud Virtual Service
CLSP Cloud Service Provider
CLU Cloud User
CORBA Common Object Request Broker Architecture
CP Constraint Programming
CPE Compute Power Efficiency
CSP Constraint Satisfaction Problem
DAG Directed Acyclic Graph
DAOP Dynamic Aspect-Oriented Programming
DCD Data Center Density
DCeP Data Center Energy Productivity
DCiE Data Center Infrastructure Efficiency
DCOM Distributed Computing Object Model
DCPE Data Center Performance Efficiency
DFS Distributed File System
DHT Distributed Hash Table
xxiii
DMTF Distributed Management Task Force
DPM Dynamic Power Management
DSL Domain Specific Language
DSTM Distributed Software Transaction Memory
DTM Distributed Transaction Memory
DVFS Dynamic Voltage and Frequency Scaling
EC2 Elastic Compute Cloud
ECA Event-Condition-Action
ECU Elastic Computing Unit
EFM Extended Feature Model
EPP Electric Power Provider
FAP Federated Application Provisioning
FM Feature Model
FODA Feature-Oriented Domain Analysis
GAE Google App Engine
GCE Google Compute Engine
GCEUs Google Compute Engine Units
GCUP Billions of Cell Updates per Second
GGF Global Grid Forum
GHG Greenhouse Gas
GPI Green Performance Indicator
GUI Graphical User Interface
HPC High Performance Computing
HTTP Hypertext Transfer Protocol
IaaS Infrastructure-as-a-Service
IC Instance Capability
IE Instance Efficiency
IM Infrastructure Manager
IOPS Input/Output Operations per Second
IPT Instance Performance Trust
ISP Instance Sustainable Performance
JSON JavaScript Object Notation
KPI Key Performance Indicator
MAS Multi-Agent System
MDE Model-Driven Engineering
ME Managed Element
MIMD Multiple Instruction Multiple Data
xxiv

MOOP Multi-Objective Optimization Problem
MPI Message Passing Interface
MPP Massively Parallel Processor
MQS Message Queue System
MTC Many Task Computing
MTRA Mean Time to Resource Acquisition
NAS Network-Attached Storage
NC Network Capacity
NIST National Institute of Standards and Technology
OCCI Open Cloud Computing Interface
OD Outage Duration
OGF Open Grid Forum
OGSA Open Grid Service Architecture
OGSI Open Grid Service Infrastructure
OS Operating System
OVF Open Virtualization Format
P2P Peer-to-peer
PaaS Platform-as-a-Service
PC Personal Computer
PLE Product Line Engineering
PLR Packet Lost Ratio
PUE Power Usage Effectiveness
PVM Parallel Virtual Machine
QoS Quality of Service
RE Resource Efficiency
REST Representational State Transfer
RMI Java Remote Method Invocation
RPC Remote Procedure Call
RRT Resource Release Time
SaaS Software-as-a-Service
SC Storage Capacity
SCA Service Component Architecture
SCORCH Smart Cloud Optimization for Resource Configuration Handling
SDA Service Discovery Agent
SDAR Storage Data Access Ratio
SGE Sun Grid Engine
SIMD Single Instruction Multiple Data
xxv
SLA Service-Level Agreement
SNIA Storage Networking Industry Association
SOA Service-Oriented Architecture
SOAP Simple Object Access Protocol
SOOP Single-Objective Optimization Problem
SPEC Standard Performance Evaluation Corporation
SPL Software Product Line
SPLE Software Product Line Engineering
SS Self-Scheduling
SSD Solid-State Disk
SSO Single Sign-On
SW Smith-Waterman
TGI The Green Index
TM Transactional Memory
TVA Typical Virtual Appliance
VA Virtual Appliance
VI Virtual Infrastructure
VM Virtual Machine
VMI Virtual Machine Image
VMM Virtual Machine Monitor
W3C World Wide Web Consortium
WfMS Workflow Management System
WSDL Web Service Definition Language
WSLA Web Service Level Agreement
WSRF Web Service Resource Framework
WWW World-Wide Web
XML Extensible Markup Language
XMPP Extensible Messaging and Presence Protocol
YAML YAML Ain’t Markup Language
xxvi
Chapter 1
Introduction
Contents
1.1 Motivation . . . . . . . . . . . . . . . . . . . . . . . . . . . . . . 1
1.2 Objectives . . . . . . . . . . . . . . . . . . . . . . . . . . . . . . . 3
1.3 Thesis Statement . . . . . . . . . . . . . . . . . . . . . . . . . . . 4
1.4 Contributions . . . . . . . . . . . . . . . . . . . . . . . . . . . . . 4
1.5 Publications . . . . . . . . . . . . . . . . . . . . . . . . . . . . . . 6
1.6 Thesis Outline . . . . . . . . . . . . . . . . . . . . . . . . . . . . 7
1.1 Motivation
Cloud computing is a recent paradigm for provisioning of computing infrastructure,platform and/or software. It provides computing resources through a virtualized infras-tructure, letting applications, computing power, data storage and network resources to beprovisioned, and remotely managed over private networks or over the Internet [154, 307].Hence, cloud computing enhances collaboration, agility, scalability, and availability to endusers and enterprises.
Furthermore, the clouds offer different features, enabling resource sharing (e.g., in-frastructure, platform and/or software) among cloud providers and cloud users in apay-as-you-go model. These features have been used for many objectives such as (a) todecrease the cost of ownership, (b) to increase the capacity of dedicated infrastructureswhen they run out of resources, (c) to reduce power consumption and/or carbon footprint,and (d) to respond effectively for changes in the demand. However, the access to thesefeatures depends on the levels of abstraction (i.e., cloud layer). The levels of abstraction areusually defined as being: infrastructure-as-a-service (IaaS), platform-as-a-service (PaaS),and software-as-a-service (SaaS). While IaaS offers low-level access to the infrastructure,including virtual machines (VMs), storages, and network, PaaS adds a layer above the IaaSinfrastructure, offering high-level primitives to help the users on developing native cloudapplications. In addition, it also provides services for application deployment, monitoring,
1
Chapter 1. Introduction
and scaling. Finally, SaaS provides the applications, and manages the whole computingenvironment.
In this context, the users interested in the cloud face the problem of choosing low-levelservices to execute ordinary applications, thus, being responsible for managing the com-puting resources (i.e., VMs) or choosing high-level services needing to develop native cloudapplications, in order to delegate the management of the computing environment to cloudproviders. These two options exist, because the clouds often target Web applications,whereas users’ applications are usually batch-oriented performing parameter sweeps. There-fore, deploying and executing an application in the cloud is still a complex task [179, 392].For instance, to execute an application using the cloud infrastructure, the users must firstselect a virtual machine (VM), configure all necessary applications, transfer all data, andfinally, execute their applications. Learning this process can require days or even weeks, ifthe users are unfamiliar with system administration, without guarantees of meeting theirobjectives. Hence, this can represent a barrier to use the cloud infrastructure.
Moreover, with the number of cloud providers growing, the users have the challenge ofselecting an appropriate cloud and/or resource (e.g.,VM) to execute their applications. Thisrepresent a difficult task because there is a wide range of resources offered by the clouds.Furthermore, these resources are usually suited for different purposes, and they often havemultiple constraints. Since clouds can fail, or may have scalability limits, a cloud federationscenario should be considered, increasing the work and the difficulties in using clouds’infrastructures. Some questions that arise in this context are: (a) which resources (VMs)are suitable for executing a given application; (b) how to avoid under and over-provisioningtaking into account both resources’ characteristics and users’ objectives (e.g., performanceat lower cost), without being tied to a cloud provider; and (c) how a non-cloud specialist maymaximize the usage of the cloud infrastructure without re-engineering their applicationsto the cloud environment.
Although some efforts have been made to reduce the cloud’s complexity, most ofthem target software developers and are not straightforward for inexperienced users [179].Besides that, cloud services usually run on large-scale data centers and demand a hugeamount of electricity. Nowadays, the electricity cost can be seen as one of the majorconcerns of data centers, since it is sometimes nonlinear with the capacity of the datacenters, and it is also associated with a high amount of carbon emission (CO2). Theprojections considering the data center energy-efficiency [142, 201, 202] show that thetotal amount of electricity consumed by data centers in the next years will be extremelyhigh, and it is like to overtake the airlines industry in terms of carbon emissions.
Additionally, depending on the efficiency of the data center infrastructure, the numberof watts that it requires can be from three to thirty times higher than the number of wattsneeded for computations [330]. And it has a high impact on the total operation costs [31],which can be over 60% of the peak load. Nevertheless, energy-saving schemes that result intoo much degradation of the system performance or in violations of service-level agreement(SLA) parameters would eventually cause the users to move to another cloud provider.Thus, there is a need to reach a balance between the energy savings and the costs incurredby these savings in the execution of the applications.
In this context, we advocate the usage of cloud federation to seamlessly distribute theservices workload across different clouds, according to some objectives (e.g., to reduce energyconsumption) without incurring in too much degradation of performance requirements
2
Chapter 1. Introduction
defined between cloud providers and cloud users. Moreover, we advocate a declarativeapproach where the users describe their applications and objectives, and submit it to asystem that automatically: (a) provisions the resources; (b) sets up the whole computingenvironment; (c) tries to meet the users’ requirements such as performance at reduce cost;and (d) handles failures in a federated cloud scenario.
1.2 Objectives
Following a goal-oriented strategy, this thesis aims to investigate the usage of federatedclouds considering different viewpoints. It considers the point of views of the: (a) cloudproviders, (b) experienced software developers, (c) ordinary users, and (d) multipleusers’ profiles (i.e., system administrators, unskilled and skilled cloud users, and softwaredevelopers). To achieve the main goal, this thesis considers the following four sub-goals.
1. reducing power consumption: the cloud services usually execute in big datacenters that normally contain a large number of computing nodes. Thus, the cost ofrunning these services may have a major impact on the total operational cost [31]due to the amount of energy demanded by such services. In this scenario, we aimto investigate the use of a cloud federation environment to help cloud providers onreducing power consumption of the services, without having a great impact in qualityof service (QoS) requirements.
2. execution of a huge application at reduced-cost: most of the clouds providesome resources at low financial costs. These resources normally have limited comput-ing capacity and small amount of RAM memory. Moreover, they are heterogeneouswith regard to the cloud layer (i.e., PaaS and IaaS), requiring different strategies touse and to connect them. Thus, we want to investigate if a federated execution usingexclusively the cheapest resources of each cloud can achieve an acceptable executiontime.
3. reducing the execution time of cloud-unaware applications: some of theusers applications were designed to execute in a single and dedicated resource withalmost predictable performance. Hence, these applications do not fit the cloud model,where resource failures and performance variation are part of its normal operation.However, most of these applications have parts that can be executed in parallel.In other words, these applications comprise parts of independent tasks. In thisscenario, we aim to investigate the execution of cloud-unaware applications takinginto account the financial cost and trying to reduce their execution time withoutusers’ intervention.
4. automate the tasks of selection and configuration of clouds resources fordifferent kinds of users: nowadays, the users interested in the clouds face twomajor problems. One is knowing what are the available resources including theirconstraints and characteristics. Another is the required skill to select, to configure,and to use these resources taking into account different objectives such as performanceand cost. In this context, one of our goal is to investigate how to help the users on
3

Chapter 1. Introduction
dealing with these problems, requiring minimal users’ intervention to configure asingle or a federated cloud environment.
1.3 Thesis Statement
In 1992, Smarr and Catlett [326] introduced the concept of metacomputing. Metacom-puting refers to the use of distributed computing resources connected by the networks.Thus creating a virtual supercomputer – the metacomputer. In this case, they advocatedthat the users must be unaware of the metacomputer or even any computer, since themetacomputer has the capacity to obtain whatever computing resources are necessary.
Based on this vision, our thesis statement is that:
Cloud computing is an interesting model for implementing a metacomputer due toits characteristics such as on-demand, pay-per-usage, and elasticity. Moreover, thecloud model focuses on delivering computing services rather than computing devices;i.e., in the cloud, the users are normally unaware of the computing infrastructure.Altogether, the cloud model can increase resource federation and reduce the effortsto democratize the access to high performance computing (HPC) environments atreduced cost.
Besides that, we ask the following research questions in this thesis:
can the cloud federation be used to reduce power consumption of data centers,without incurring into several performance penalties for the users?
can software developers use the clouds to speed up the execution of a native-cloudapplication at reduced-cost, without being locked to any cloud provider?
can inexperienced users utilize a cloud environment to execute cloud-unaware ap-plications, without having to deal with low-level technical details, having both anacceptable execution time and a financial cost, and without having to change theirapplications to meet cloud’s constraints?
is there a method to support automatic resource selection and configuration on cloudfederation, and that offers a level of abstraction suitable for different users’ profiles?
1.4 Contributions
To tackle the introduced sub-goals this thesis makes the following five contributions:
1. Power-Aware Server Consolidation for Federated Clouds: we propose andevaluate a power and SLA-aware application consolidation solution for cloud federa-tions [215]. To achieve this goal, we designed a multi-agent system (MAS) for serverconsolidation, taking into account service-level agreement (SLA), power consumption,and carbon footprint. Different for similar solutions available in the literature, in oursolution, when a cloud is overloaded its data center needs to negotiate with other
4

Chapter 1. Introduction
data centers before migrating the workload (i.e., VM). Simulation results show thatour approach can reduce up to 46% of the power consumption, while trying to meetperformance requirements. Furthermore, we show that federated clouds can providean adequate solution to deal with power consumption in clouds. In this case, cloudproviders can use the computing infrastructure of other clouds according to theirobjectives. This work was published in [215].
2. Biological Sequence Comparison at Zero-Cost on a Vertical Public CloudFederation: we propose and evaluate an approach to execute a huge bioinformaticsapplication on a vertical cloud federation [214]. This approach has two maincomponents: (i) an architecture that can transparently connect and manage multipleclouds, thus creating a multi-cloud environment and (ii) an implementation of aMapReduce version of the bioinformatics application in this architecture. Thearchitecture and the application were implemented and executed in five publicclouds (Amazon EC2, Google App Engine, Heroku, OpenShift, and PiCloud), usingonly their free-quota. In our tests, we executed an application that did up to 12million biological comparisons. Experimental results show that (a) our federatedapproach could reduce the execution time in 22.55% over the best stand-alonecloud execution; (b) we could reduce the execution time from 5 hours and 44minutes (SSEARCH sequential tool) to 13 minutes (our Amazon EC2 execution);and (c) federation can enable the execution of huge applications in clouds at noexpense (i.e., using only the free-quota). With this work, it became clear that ourarchitecture could federate real clouds and it could execute a real application. Eventhough the architecture proposed was very effective, it was application-specific (i.e.,Mapreduce application). Moreover, it became clear for us that configuration tasksare complex in a real cloud environment, and they often require advanced computingskills. So, we decided to investigate generic architectures and models that did notimpose complex configuration tasks for the users. This work was published in [214].
3. Excalibur: A User-Centered Cloud Architecture for Executing ParallelApplications: we propose and evaluate a cloud architecture, called Excalibur.This architecture has three main objectives [217]: (a) provide a platform for highperformance computing applications in the cloud for users without cloud skills;(b) dynamically scale the applications without user intervention; and (c) meet theusers requirements such as high performance at reduced cost. Excalibur comprisesthree main components: (i) an architecture that sets up the cloud environment; (ii) anauto-scaling mechanism that tries to reduce the execution time of cloud-unawareapplications. In this case, the auto-scaling solution focuses on applications thatwere developed to be executed sequentially, but that have parts that can be executedin parallel; (iii) a domain specific language (DSL) that allows the users to describethe dependencies between the applications based on the structure of their data (i.e.,input and output). We executed a complex genomics cloud-unaware application inour architecture, which was deployed on Amazon EC2. The experiments showed thatthe proposed architecture could dynamically scale this application up to 11 instances,reducing the execution time by 63% and the cost by 84% when compared to theexecution in a configuration specified by the users. In this case, the execution timewas reduced from 8 hours and 41 minutes to 3 hours and 4 minutes; and the cost was
5

Chapter 1. Introduction
reduced from 78 USD to 14 USD. With this work, the advantages of auto-scaling inclouds became clear to us. Furthermore, we showed that it was possible to execute acomplex cloud-unaware application in the cloud. This work was published in [217].
4. Resource Selection Using Automated Feature-Based Configuration Man-agement in Federated Clouds: we propose and evaluate a model to handle thevariabilities of IaaS clouds. The model uses extended feature model (EFM) withattributes to describe the resources and their characteristics and to select appro-priate virtual machine based on users’ objectives. We implemented the model in asolver (i.e., Choco [178]) considering the configurations of two different clouds (Ama-zon EC2 and Google Compute Engine (GCE)). Experimental results showed thatusing the proposed model, the users can get an optimal configuration with regard totheir objectives without needing to know the constraints and variabilities of eachcloud. Moreover, our model enabled application deployment and reconfiguration atruntime in a federated cloud scenario without requiring the usage of virtual machineimage (VMI).
5. Dohko: An Autonomic and Goal-Oriented System for Federated Clouds:we propose and evaluate an autonomic and goal-oriented system for federated clouds.Our system implements the autonomic properties: self-configuration, self-healing,and context-awareness. Using a declarative strategy, in our system, the users specifytheir applications and requirements (e.g., number of CPU cores, maximal finan-cial cost per hour, among others), and the system automatically (a) selects theresources (i.e., VMs) that meet the constraints using the model proposed in con-tribution 4; (b) configures and installs the applications in the clouds; (c) handlesresource failures; and (d) executes the applications. We executed a genomics applica-tion (i.e., SSEARCH, September 2014) to compare up to 24 biological sequences withthe UniProtKB/Swiss-Prot (September 2014) in two different cloud providers (i.e.,Amazon EC2 and GCE) and considering different scenarios (e.g., standalone (i.e.,single cloud) and multiple clouds). Experimental results show that our system couldtransparently connect different clouds and configure the whole execution environ-ment, requiring minimal users intervention. Moreover, by employing a hierarchicalmanagement organization (i.e., a hierarchical P2P overlay), our system was ableto handle failures and to organize the nodes in a way that reduced inter-cloudcommunication.
1.5 Publications
1. Alessandro Ferreira Leite, Claude Tadonki, Christine Eisenbeis, Tainá Raiol, MariaEmilia M. T. Walter, and Alba Cristina Magalhães Alves de Melo. Excalibur: Anautonomic cloud architecture for executing parallel applications. In 4th InternationalWorkshop on Cloud Data and Platforms, pages 2:1–2:6, Amsterdam, Netherlands,2014
2. Alessandro Ferreira Leite and Alba Cristina Magalhães Alves de Melo. Executinga biological sequence comparison application on a federated cloud environment. In
6
Chapter 1. Introduction
19th International Conference on High Performance Computing (HiPC), pages 1-9,Bangalore, India, 2012
3. Alessandro Ferreira Leite and Alba Cristina Magalhães Alves de Melo. Energy-awaremulti-agent server consolidation in federated clouds. In Mazin Yousif and LutzSchubert, editors, Cloud Computing, volume 112 of Lecture Notes of the Institute forComputer Sciences, Social Informatics and Telecommunications Engineering, pages72–81. 2013
4. Alessandro Ferreira Leite, Hammurabi Chagas Mendes, Li Weigang, Alba CristinaMagalhães Alves de Melo, and Azzedine Boukerche. An architecture for P2P bag-of-tasks execution with multiple task allocation policies in desktop grids. ClusterComputing, 15(4), pages 351-361, 2012
1.6 Thesis Outline
This thesis is organized in two parts: background and contributions.In the first part, we present the concepts and recent developments in the domain of
large-scale distributed systems. In this case, it comprises the following chapters:
chapter 2: we provide an historical perspective of concepts, mechanisms and toolsthat are landmarks in the evolution of large-scale distributed systems. Then, wepresent the most representative types of these systems: clusters, grids, P2P systems,and clouds.
chapter 3: we discuss the practical aspects related to cloud computing, such asvirtualization, service-level agreement (SLA), MapReduce, and cloud computingarchitectures.
chapter 4: we describe autonomic computing. First, we present the definition ofautonomic systems, followed by the autonomic properties. Then, we present theconcepts related to the architecture of autonomic systems. Finally, some autonomicsystems for large-scale distributed systems are presented and compared.
chapter 5: we present the concept of energy-aware computing, providing informationabout green data centers followed by a discussion about green performance indicators.
In the second part, we present the contributions of this thesis, and it is organized asfollows:
chapter 6: we present the first contribution of this thesis: a server consolidationapproach to reduce power consumption in cloud federations. First, we presentthe proposed multi-agent system (MAS) server consolidation strategy for federatedclouds. Then, the experimental results are discussed followed by the related work inthis area. Finally, we present final considerations.
7
Chapter 1. Introduction
chapter 7: in this chapter, we describe the seconds contribution of this thesis: ourapproach to execute the Smith-Waterman (SW) algorithm in a cloud federation withzero-cost. First, we provide a brief introduction for biological sequence comparisonfollowed by a description of the Smith-Waterman algorithm. Next, we presentthe proposed architecture and the experimental results realized in a public cloudfederation scenario. Finally, we discuss some of the related works that have executedthe SW algorithm in different platforms followed by final considerations.
chapter 8: in this chapter, we describe the third contribution of this thesis: acloud architecture to help the users on reducing the execution time of cloud-unawareapplications. First, we present our cloud architecture. After, experimental resultsare discussed followed by a discussion of similar cloud architecture available in theliterature. Finally, we present final considerations.
chapter 9: this chapter presents the fourth contribution of this thesis: a model tohandle the variabilities of IaaS clouds. First, it presents the motivation and challengesaddressed by our model followed by an overview of multi-objective optimizationproblem (MOOP) and feature modeling. Next, the proposed model is presented.After, it describes the experimental results followed by the related works. Finally, itpresents final considerations.
chapter 10: in this chapter, we present the fifth contribution of this thesis: anautonomic cloud architecture. First, we present the proposed architecture and itsmain components, followed by a description of its autonomic properties. Then,experimental results are discussed. Next, a comparative view of some importantfeatures of cloud architectures is presented. Finally, we present final considerations.
chapter 11: in this chapter, we summarize the overall manuscript, and we presentthe limitations and future directions.
8
Part I
Background
9

Chapter 2
Large-Scale Distributed Systems
Contents
2.1 Evolution . . . . . . . . . . . . . . . . . . . . . . . . . . . . . . . 11
2.1.1 The 1960s . . . . . . . . . . . . . . . . . . . . . . . . . . . . . . 11
2.1.2 The 1970s . . . . . . . . . . . . . . . . . . . . . . . . . . . . . . 12
2.1.3 The 1980s . . . . . . . . . . . . . . . . . . . . . . . . . . . . . . 13
2.1.4 The 1990s . . . . . . . . . . . . . . . . . . . . . . . . . . . . . . 13
2.1.5 2000-2014 . . . . . . . . . . . . . . . . . . . . . . . . . . . . . . 15
2.1.6 Timeline . . . . . . . . . . . . . . . . . . . . . . . . . . . . . . . 16
2.2 Cluster Computing . . . . . . . . . . . . . . . . . . . . . . . . . 17
2.3 Grid Computing . . . . . . . . . . . . . . . . . . . . . . . . . . . 19
2.3.1 Architecture . . . . . . . . . . . . . . . . . . . . . . . . . . . . 20
2.4 Peer-to-peer . . . . . . . . . . . . . . . . . . . . . . . . . . . . . . 21
2.4.1 Architecture . . . . . . . . . . . . . . . . . . . . . . . . . . . . 23
2.4.2 Unstructured P2P Network . . . . . . . . . . . . . . . . . . . . 24
2.4.3 Structured P2P Network . . . . . . . . . . . . . . . . . . . . . . 24
2.4.4 Hybrid P2P Network . . . . . . . . . . . . . . . . . . . . . . . . 26
2.4.5 Hierarchical P2P Network . . . . . . . . . . . . . . . . . . . . . 27
2.4.6 Comparative View of P2P Structures . . . . . . . . . . . . . . . 28
2.5 Cloud Computing . . . . . . . . . . . . . . . . . . . . . . . . . . 29
2.5.1 Characteristics . . . . . . . . . . . . . . . . . . . . . . . . . . . 30
2.5.2 Drawbacks . . . . . . . . . . . . . . . . . . . . . . . . . . . . . 32
2.6 Summary . . . . . . . . . . . . . . . . . . . . . . . . . . . . . . . 34
10
Chapter 2. Large-Scale Distributed Systems
Over the years, we have observed a considerable increase in the demand for powerfulcomputing infrastructures. This demand has been satisfied by aggregating resourcesconnected through a network, forming large-scale distributed systems. These systemsnormally appear to users as a single system or computer [88, 341]. One example is theInternet, where the users use different services to communicate and to share information,without needing to know about its computing infrastructure.
Large-scale distributed systems can be defined as systems that coordinate a big numberof geographically distributed and mostly heterogeneous resources to deliver scalable serviceswithout having a centralized control. Scalability is an important characteristic of large-scaledistributed systems since it guarantees that even if the number of users, nodes or thesystem workload increases, these systems can still deliver their services without noticeableeffect on performance or on administrative complexity [192]. Examples of such systemsare the SETI@home [370], the LHC Computing Grid [33], among others.
In this context, this chapter presents the evolution of computing systems from the1960s until today. Then, the most common large-scale systems are discussed: clusters,grids, P2P systems, and clouds.
2.1 Evolution
Nowadays, we observe an astonishing level of complexity, interoperability, reliability,and scalability of large-scale distributed systems. This is due to concepts, models, andtechniques developed in the last 50 years in many research domains, including computerarchitecture, networking, and parallel/distributed computing. In this section, we presenta general landscape of events and the main landmarks that contributed to our currentdevelopment state. It must be noted that this is not intended to be an exhaustive list. Inorder to give a historical perspective, this section is organized in subsections that describethe main developments in each decade.
2.1.1 The 1960s
The 1960s was a period of innovative ideas that could not become reality because ofseveral technological barriers. It was also the decade of the first developments in the areasof supercomputing and networking.
In the 1960s, some researchers conceived the idea of the computer as a utility. Theyenvisioned a world where the computer was not an expensive machine restricted to someorganizations, but a public utility as the telephone system. This idea was exposed byJohn McCarthy in 1961 at a talk at the MIT Centennial [132]. In 1962, J. C. L. Lickliderproposed the Galactic Network concept [226], where a set of globally interconnectedcomputers could be used by anyone to quickly access data and programs. Even thoughthese ideas became popular in the 1960s, many technological barriers were encounteredthat prevented their implementation at that time.
Still in the 1960s, the CDC 6000 series was designed by Seymour Cray as the first super-computer, composed of multiple functional units and one or two CPUs. This was a multiple
11

Chapter 2. Large-Scale Distributed Systems
instruction multiple data (MIMD) machine, according to Flynn’s categorization [118]. Inthe late 1960s, the CDC 8600 had 4 CPUs, with a shared memory design.
In 1962, the first wide-area network experiment was made, connecting a computer inMassachusetts to a computer in California, using telephone lines. In 1969, the ARPANETwas created, aiming to connect computing nodes in several Universities in the US, makinguse of the recently developed packet switching theory.
In 1965, IBM announced the System 370/67, introducing the usage of a software layercalled virtual machine monitor (VMM) that enabled to share the same computer amongseveral operating systems and computing environments [138, 146].
The concepts involved in the client/server model were first proposed in 1969, where theserver was named server-host and the client was named using-host. In this early model,both client and server were physical machines.
2.1.2 The 1970s
The 1970s can be seen as the decade where some ideas proposed in the 1960s startedto be implemented. One of the main landmarks of this decade is the Internet.
In the early 1970s, Seymour Cray left CDC to create his own company, using a differentapproach to build supercomputers. The idea was to exploit the single instruction multipledata (SIMD) categorization [118], named vector processing at that time. It replicated theexecution units, instead of the whole CPU. The Cray-1 Machine, released in 1976, couldoperate by blocks of 64 operands (SIMD capability), attaining 250 MFlops (millions offloating-point operations per second).
Still in the 1970s, computers started to be connected by networks, using the ARPANET.In 1972, a large demonstration of the ARPANET took place, using electronic mails as themain application. In addition, the concept of open-architecture network was proposed,where individual networks might be separately designed and then connected by a standardprotocol. A packet radio program that used the open-architecture concept was calledInternetting at DARPA. In 1973, the first Ethernet network was installed at the XeroxPalo Alto Research Center. Telnet (remote login) and ftp (file transfer) protocols wereproposed in 1972 and 1973, respectively. In 1974, Cerf and Kahn published their paperpresenting the TCP protocol [72]; and the term Internet was coined to describe a globalTCP/IP network.
The combination of the time-sharing vision and the decentralization of computerinfrastructures led to the concept of distributed systems in the late 1970s. A distributedsystem can be defined as a collection of autonomous computers connected by a networkthat appears to its users as a single system. In this system, computers communicatewith each other using messages that are sent over the network, and this communicationprocess is hidden from the users [88, 134, 341]. Transparency is a very important point inthis definition. It means that users and applications should interact with a distributedsystem in the same way as they interact with a standalone system. Other importantcharacteristics are scalability, availability and interoperability which, respectively, enabledistributed systems to be relatively easy to expand or scale; to be continuously available,even though some parts are unavailable; and to establish communication among differenthardware and software platforms.
12

Chapter 2. Large-Scale Distributed Systems
2.1.3 The 1980s
The 1980s observed a rapid development in supercomputing, networking and distributedsystems. The World-Wide Web (WWW) was proposed in this decade.
In the 1980s, Cray continued to release supercomputers based on vector processing and,in 1988, the first supercomputer to attain a sustained rate of 1 gigaflop was a Cray-YMP8,composed of 8 CPUs, capable of operating simultaneously on 64 operands each. Still in the1980s, several companies focused on shared memory MIMD supercomputers. The companyThinking Machines built the CM-2 (Connection Machine) hypercube supercomputer, oneof the first so-called massively parallel processors (MPPs), composed of 65,536 (1-bitcheck) processing elements with local memory. In 1989, the CM-2 with 65,536 processingelements attained 2.5 gigaflops.
In 1983, the TCP/IP protocol was adopted by the ARPANET, replacing the previousNCP protocol. In 1985, the TCP/IP protocol was used by several networks, including theUSENET, BITNET and NSFNET. In 1989, Berners-Lee [39, 40] proposed a new protocolbased on hypertext. This protocol would become the World-Wide Web (WWW) in 1991.
With the advent of personal computers (PCs) and workstations, the client-server modelgained popularity in the late 1980s, being mainly used for file sharing. Still in the 1980s,important concepts in distributed systems such as event ordering, logical clocks, globalstates, Byzantine faults and leader election were proposed [88].
In the 1980s, it became clear that a distributed system must comprise different providersand that it should be independent from the communication technology. Initially, this wasa difficult objective to achieve since the communication in a distributed system was mostlyimplemented using low-level socket primitives. Socket programming is complex and requiresa deep understanding of the underlying network protocols. To bypass these difficulties,the remote procedure call (RPC) was proposed in 1983 [47], enabling functions that belongto the same program to be performed by remote computers, as if they were running locally.This represented a great advancement and RPC was the base for the CORBA and Webservices.
2.1.4 The 1990s
In the 1990s, great technological advances and intelligent design choices made it possibleto break the teraflop performance barrier. It was also the decade of the widespread adoptionof the Internet. Metacomputing, grid computing and cloud computing were proposedin the 1990s. At this decade, the researchers also began to consider the use of virtualmachines to overcome some limitations of the x86 architecture and operating systems [301].
The idea of cluster computing became very popular in the 1990s. Clusters consisted ofcommodity components connected in order to build a supercomputer. In 1993, the Beowulfproject was able to connect 8 PCs (DX4 processors) with the 10Mbit Ethernet, using theLinux operating system. The number of PCs connected grew quickly and the 10MbitEthernet was replaced by Fast Ethernet. One of the reasons for the success of clusters wasthe development of programming environments such as parallel virtual machine (PVM)and message passing interface (MPI). In 1997, clusters were included among the fastest 500machines at the Top 500 list (top500.org), with a sustained performance of 10 gigaflops.
13
Chapter 2. Large-Scale Distributed Systems
Still in the 1990s, research on supercomputing continued and, in 1997, the ASCI Redmachine, with 4,510 MIMD computing nodes was the first supercomputer to attain 1teraflop of sustained performance.
In 1992, more than a million computers were connected to the Internet. In 1993,the first graphic browser, called Mosaic, was introduced [254]. The World Wide WebConsortium (W3C) was created in 1994 to promote and to develop standards for the Web.
Originated in 1991, the Common Object Request Broker Architecture (CORBA)was one of the first attempts to create a standard for distributed objects managementin distributed systems [88]. However, due to some ambiguities in its specification, itsadoption was slow and its implementation complex. The ambiguities were solved inthe second version of Common Object Request Broker Architecture (CORBA) in 1998,however the advent of other technologies as the Java Remote Method Invocation (RMI)and the Extensible Markup Language (XML) led to the decline of CORBA.
The Distributed Computing Object Model (DCOM) came out in 1993. It was restrictedto the Windows platform and, beyond that, such as CORBA, the usage of Distributed Com-puting Object Model (DCOM) over the Internet imposed some administrative challenges,as it required the opening of some doors in the firewall, since both CORBA and DCOMdid not use the HTTP protocol.
In 1994, the Representational State Transfer (REST) was proposed as a model forcommunicating Web concepts while developing the HTTP specification. REST is anarchitecture style for Web applications that aims to minimize latency and network com-munication, and to maximize scalability and independence of applications [114]. Inpractice, REST provides a semantics interface based on the actions (e.g., GET, POST,PUT, DELETE) of the HTTP protocol rather than on arbitrary or application-specificinterfaces to manipulate resources only exchanging the representations. Moreover, RESTinteractions are stateless, which decouple the meaning of a message from the state of aconversation. This architecture style has influenced many Web standards, and nowadaysit is widely adopted by the enterprises.
The global degree of maturity achieved by the Internet in the 1990s made possible theappearance of several advanced distributed computing paradigms. In 1992, a paradigmcalled Metacomputing [326] was proposed. Its main idea was to create a supercomputer byconnecting computers spread over the world in a transparent way via a network environment.Later, in 1995, the term grid computing was conceived to denote a new infrastructureof distributed computing that allows consumers to obtain resources on-demand in anadvanced scope [125]. The grid paradigm can be seen as an evolution of metacomputingcombined with utility computing, where not only processing power is shared but also otherresources such as databases, specific equipments and softwares, among others. Inspiredby the electrical power grid because of its pervasiveness, ease of use and reliability, themotivation of grid computing was initially driven by large-scale resource sharing anddata-intensive scientific applications that require more resources than they provided by asingle computer [125]. In 1995, the Information-Wide-Area-Year (I-WAY) project [124]was one of the first projects to demonstrate the power of distributed supercomputing.Furthermore, the Globus Project (toolkit.globus.org/alliance/news/prGAannounce.html)was established to develop standards for grid’s middlewares [124].
Simultaneously with the growing research interest in grid systems, peer-to-peer (P2P)systems have evolved. A P2P system can be seen as a system where the nodes (peers)
14

Chapter 2. Large-Scale Distributed Systems
organize themselves into different topologies and operate without any central control [14].One of the first successful P2P systems was the Napster file sharing system, proposedin 1999. Another type of P2P system, that harnesses computer power to solve complexproblems, was also proposed in the 1990s. In 1999, the SETI@home project started, andit could connect millions of computers through the Internet [12].
In 1997, the term cloud computing was used by Chellappa in a talk about a newcomputing paradigm [74]. Cloud computing was indeed proposed in the late 1990s aimingto shift the location of the computing infrastructure, platform and/or software systems tothe network in order to reduce costs associated with resource management (hardware andsoftware) [154]. In cloud computing, data and programs are usually stored and executedin huge data centers, with hundreds or thousands of machines.
In 1998, the VMware company was founded, introducing a system that virtualizes thex86 architecture providing full isolation of a guest operating system [54]. Virtualizationwould become a fundamental concept in cloud computing.
In 1999, the salesforce.com system was one of the first systems to provide a software-as-a-service (SaaS) cloud solution to manage sales activities. Also, in 1999, an extensionfor the HTTP protocol was proposed, and it became the HTTP/1.1 [115]. Such extensionprovided a model for the WWW, defining how it should work; and it became the foundationfor the Web services architecture.
2.1.5 2000-2014
The first years of the 21st century observed extraordinary advancements in supercom-puting and cloud computing.
From 2000 to 2014, research on supercomputing continued obtaining astonishingresults. Supercomputing infrastructures are nowadays normally composed of clusters,where the nodes contain general-purpose processors combined with accelerators, and highperformance networks. In 2008, the IBM RoadRunner supercomputer was the first toachieve 1 petaflop of sustained performance, with 6,912 Opteron processors combined with12,960 PowerXCell accelerators. In 2011, the K Computer attained 10 petaflops, with705,024 Sparc64 cores. In the latest supercomputer Top500 list, released in June 2014,the fastest supercomputer is the Tianhe-2, attaining 33.8 petaflops with 3,120,000 cores,in a hybrid design containing general-purpose Intel Xeon processors and Intel Xeon Phiaccelerators.
The interoperability issues presented by CORBA and DCOM were mainly solvedthrough the specification of Web services in 2000. The term Web service was defined bythe W3C in 2004, describing its interoperability and naming the Web Service DefinitionLanguage (WSDL) format and the SOAP (Simple Object Access Protocol) protocol. Webservices are technology-independent and they use HTTP as the communication layer [51].In this case, services are described using WSDL, enabling the interoperability betweendistinct programming languages. Nowadays, Web services are the predominant model indistributed computing.
From 2000 to now, cloud computing received a lot of attention from the industry andacademia since it aims to reduce the costs of managing hardware/software infrastructures.Clouds are similar to grids since they also employ distributed resources to achieve thecomputing objectives. However, in grid computing, the resources, which can be provided
15

Chapter 2. Large-Scale Distributed Systems
as utility, are allocated to applications for a period of time, paying for the whole period.Instead, cloud computing normally uses on-demand resource provisioning, eliminatingover-provisioning, since the users pay for what they use [388].
The term autonomic computing was proposed in 2001 [162], referring to self-managementsystems. These systems could adapt themselves for changes in the computing environmen-t/infrastructure.
MapReduce [98] is a programming model proposed in 2004 as a solution to be used byGoogle for large-scale data processing, and lately available for the general public throughthe open source Apache Hadoop (hadoop.apache.org), in 2005. Hadoop provides a parallelprogramming model, a distributed file system, a collection of tools for managing largedistributed systems, and coordination services for distributed applications. With ApacheHadoop, the developers often do not need to be aware of data distribution and failures asthey are seamless delivered by Hadoop.
In 2006, Amazon created its Elastic Compute Cloud (EC2) as a commercial cloudsystem, using the pay-per-use model.
Clouds are having success owing to the fact that the underlying infrastructure iscompletely transparent to the users. Beyond that, clouds exhibit good scalability, allowingusers to run complex applications in the cloud infrastructure. In 2014, the Amazon WebServices (AWS) is the largest cloud hosting company in the world. It provides services inmany geographic regions, including Australia, Brazil, Ireland, Japan, Singapore, and theUS. AWS can also be used as a supercomputer. In the supercomputer Top500 list, releasedin June 2014, it appears in the 76th position, attaining 593.5 Teraflops with 26,496 cores.
2.1.6 Timeline
Figure 2.1 presents the main landmarks of each decade. As can be seen, the advancesin computing in five decades are astonishing. For instance, in the beginning of the1970s, the supercomputers could perform 250 millions of floating point operations persecond (MFlops). In 2014, the fastest supercomputer performs 33.8 quadrillions ofoperations per second (PFlops).
These advances are also owing to the improvements in networking that started as away to decrease the cost to build and to operate the computers as well as to increase datasharing and collaboration.
It is also important to notice that some concepts were proposed in a visionary way.One example is the concept of utility computing, proposed in the 1960s but incorporatedto grids and clouds only in the 1990s.
Nowadays, due to the utility model (i.e., cloud computing), the users can provisiona cluster with reasonable performance paying comparatively few dollars per cores perhour. For instance, a cluster with 30, 000 cores distributed across different Amazon datacenters costs $1279/hour (0.043 USD per cores by hour) [91]. In this model, the developerswith innovative ideas for new Internet services no longer require large capital outlays inhardware to deploy their services or the human expense to operate it. Moreover, companieswith large batch-oriented tasks can get results as quickly as their programs can scale, sinceusing 1,000 servers for one hour costs no more than using one server for 1,000 hours. Thiselasticity of resources, without paying a premium for large scale, is unprecedented in thehistory of computer science [20].
16

Chapter 2. Large-Scale Distributed Systems
The success of cloud computing is also due to the advances in virtualization technologies,which hides the physical infrastructure from the users and often leads to increase resourceutilization, and in programming models as MapReduce [98] and its public availableimplementation Apache Hadoop.
In the context of cloud computing, there are still many challenges to be addressed.First, cloud providers should agree and support cloud standards to enable full porta-bility and interoperability of data and applications among the clouds. Second, basedon standardization, the clouds should be combined to increase performance and/or todecrease operational costs. Third, similar to the electrical power grid, that often providerselectricity with a well known variation, the clouds should deliver services with near constantperformance, defined according to the resource type. Nowadays, to achieve this, the usershave to distribute their applications across multiple clouds [269, 376] and to optimizedifferent parameters manually. Finally, cloud tools should be created to allow the userswithout any cloud skill to maximize the cost/benefit ratio of the cloud.
- First supercomputer
- First WAN
- Concept of utility
computing
- First virtual machine
monitor
- First SIMD supercomputer
- ARPANET
- Internet (TCP, telnet, ftp)
- First gigaflop computer
- WWW
- PCs
- Advanced concepts in
distributed systems
- First teraflop computer
- Internet browser
- CORBA and DCOM
- REST
- Grid computing
- P2P computing
- Cloud computing
- Virtualization of the
x86 architecture
- First petaflop computer
- Web service
- Autonomic computing
- MapReduce
- Hadoop
- Public cloud systems
1960s 1970s 1980s 1990s 2000-2014
Figure 2.1: Computing landmarks in five decades
2.2 Cluster Computing
A cluster is set of dedicated computing nodes connected by a dedicated and high-speed local-area network. Cluster computing systems are often built to deliver high-performance capabilities with a good price/performance ratio, running compute intensiveapplications [341].
In general, clusters use a master/slave architecture, where the master node is responsiblefor providing an interface to the users, for distributing the tasks to the slaves, and formanaging the execution of the tasks. Slave nodes, on the other hand, are responsible forexecuting the assigned tasks. Furthermore, the nodes in a cluster are often homogeneouswith the same operating system and they belong to a single organization.
Figure 2.2 shows the architecture of the Tompouce cluster, which is a high-performancemedium-scale cluster maintained by INRIA Saclay (www.inria.fr/en/centre/saclay). Ithas a master node and twenty compute nodes connected by two InfiniBand and onegigabit Ethernet networks. In Tompouce, each node has two six-core Intel Xeon processors,thereby 240 cores.
Clusters can be categorized in three classes [55]: high-availability (HA), load-balancing,and compute clusters.
A high-availability (HA) cluster aims to improve the availability of the services providedby the cluster and to avoid single-points of failure. In this case, it operates employing
17

Chapter 2. Large-Scale Distributed Systems
Master node
Dell R710
Scientific Linux
Parallel libs
(Hadoop, MPI,
python, etc.)
Management
application
Scientific Linux
Component of
the parallel
application
Scientific Linux
Component of
the parallel
application...
20x compute nodes Dell R510
Scientific Linux
NFS Storage
Node (Dell R510)
Scientific Linux Scientific Linux
FhGFS Filesystem
FhGFS 01
Dell R720FhGFS 02
Dell R720
Giga Ethernet network
Infiniband network
Figure 2.2: Tompouce: an example of a medium-scale cluster
redundant nodes, which are used when a system component fails. In load-balancing clusters,multiple computers are connected to share the computational workload to improve theoverall performance of the system. Compute clusters, on the other hand, are designedto provide supercomputing capabilities, often executing message passing interface (MPI)applications.
Nowadays, clusters are being built with an astonishing number of cores, and theyrepresent up to 84% of the fastest machines listed in the Top500 list, released in June2014. In this list, the number one (Tianhe-2, or TH-2) is a cluster of 16,000 nodes,each one comprising two Intel Ivy Bridge processors and three Xeon Phi coprocessorboards (Figure 2.3(a)), counting 3,120,000 cores [225]. These nodes are connected bya proprietary interconnection called the TH Express-2 interconnect network. The THExpress-2 is an optoelectronics hybrid transport technology organized as a fat tree networkwith 13,576 ports at the top level (Figure 2.3(b)), which allows it to achieve high throughputand low latency.
(a) Node architecture (b) Tianhe-2 organization
Figure 2.3: The Tianhe-2 compute node architecture and its network topology [225]
18
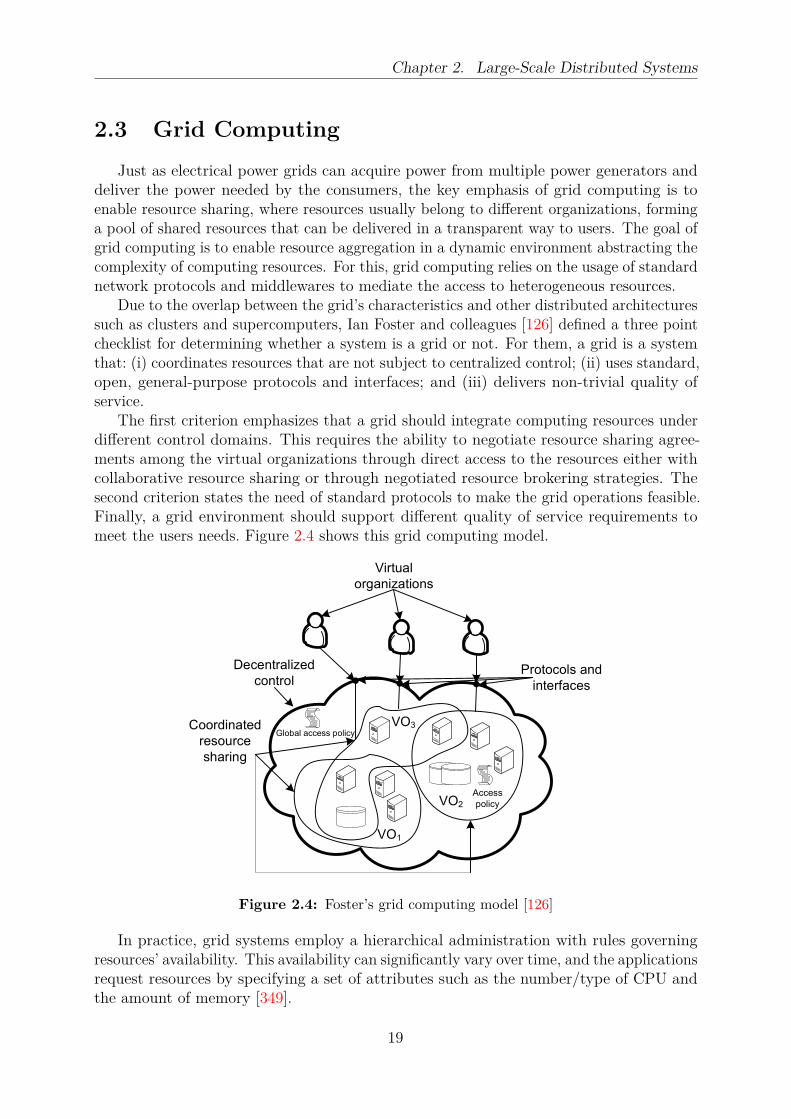
Chapter 2. Large-Scale Distributed Systems
2.3 Grid Computing
Just as electrical power grids can acquire power from multiple power generators anddeliver the power needed by the consumers, the key emphasis of grid computing is toenable resource sharing, where resources usually belong to different organizations, forminga pool of shared resources that can be delivered in a transparent way to users. The goal ofgrid computing is to enable resource aggregation in a dynamic environment abstracting thecomplexity of computing resources. For this, grid computing relies on the usage of standardnetwork protocols and middlewares to mediate the access to heterogeneous resources.
Due to the overlap between the grid’s characteristics and other distributed architecturessuch as clusters and supercomputers, Ian Foster and colleagues [126] defined a three pointchecklist for determining whether a system is a grid or not. For them, a grid is a systemthat: (i) coordinates resources that are not subject to centralized control; (ii) uses standard,open, general-purpose protocols and interfaces; and (iii) delivers non-trivial quality ofservice.
The first criterion emphasizes that a grid should integrate computing resources underdifferent control domains. This requires the ability to negotiate resource sharing agree-ments among the virtual organizations through direct access to the resources either withcollaborative resource sharing or through negotiated resource brokering strategies. Thesecond criterion states the need of standard protocols to make the grid operations feasible.Finally, a grid environment should support different quality of service requirements tomeet the users needs. Figure 2.4 shows this grid computing model.
VO1
VO3
VO2
Coordinated
resource
sharing
Decentralized
control Protocols and
interfaces
Virtual
organizations
Global access policy
Access
policy
Figure 2.4: Foster’s grid computing model [126]
In practice, grid systems employ a hierarchical administration with rules governingresources’ availability. This availability can significantly vary over time, and the applicationsrequest resources by specifying a set of attributes such as the number/type of CPU andthe amount of memory [349].
19
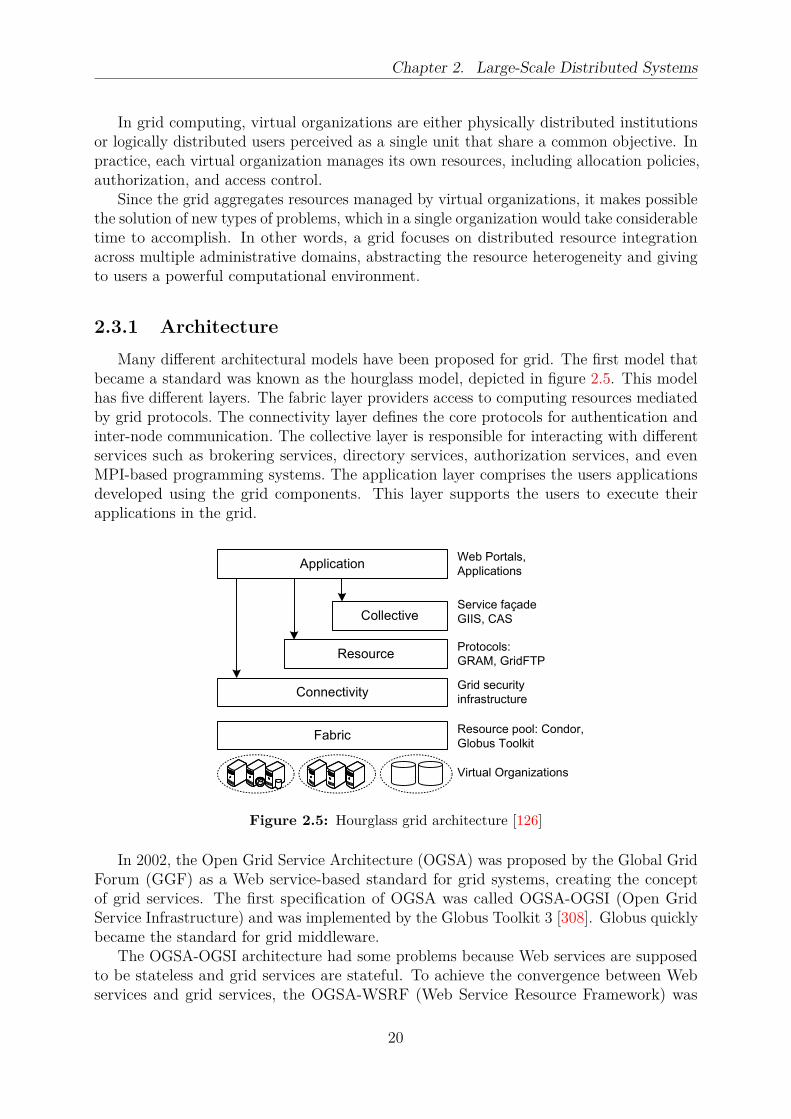
Chapter 2. Large-Scale Distributed Systems
In grid computing, virtual organizations are either physically distributed institutionsor logically distributed users perceived as a single unit that share a common objective. Inpractice, each virtual organization manages its own resources, including allocation policies,authorization, and access control.
Since the grid aggregates resources managed by virtual organizations, it makes possiblethe solution of new types of problems, which in a single organization would take considerabletime to accomplish. In other words, a grid focuses on distributed resource integrationacross multiple administrative domains, abstracting the resource heterogeneity and givingto users a powerful computational environment.
2.3.1 Architecture
Many different architectural models have been proposed for grid. The first model thatbecame a standard was known as the hourglass model, depicted in figure 2.5. This modelhas five different layers. The fabric layer providers access to computing resources mediatedby grid protocols. The connectivity layer defines the core protocols for authentication andinter-node communication. The collective layer is responsible for interacting with differentservices such as brokering services, directory services, authorization services, and evenMPI-based programming systems. The application layer comprises the users applicationsdeveloped using the grid components. This layer supports the users to execute theirapplications in the grid.
Fabric
Connectivity
Resource
Collective
Application
Resource pool: Condor,
Globus Toolkit
Grid security
infrastructure
Protocols:
GRAM, GridFTP
Service façade
GIIS, CAS
Web Portals,
Applications
Virtual Organizations
Figure 2.5: Hourglass grid architecture [126]
In 2002, the Open Grid Service Architecture (OGSA) was proposed by the Global GridForum (GGF) as a Web service-based standard for grid systems, creating the conceptof grid services. The first specification of OGSA was called OGSA-OGSI (Open GridService Infrastructure) and was implemented by the Globus Toolkit 3 [308]. Globus quicklybecame the standard for grid middleware.
The OGSA-OGSI architecture had some problems because Web services are supposedto be stateless and grid services are stateful. To achieve the convergence between Webservices and grid services, the OGSA-WSRF (Web Service Resource Framework) was
20

Chapter 2. Large-Scale Distributed Systems
proposed and it was implemented by the Globus Toolkit 4 [122]. In 2014, the most recentversion of globus is the Globus Toolkit 5, which has added mainly incremental updatesto Globus Toolkit 4. The figures 2.6 and 2.7 show the difference between Globus Toolkit3 (OGSA-OGSI) and Globus Toolkit 4 (OGSA-WSRF).
Hosting Environment
Grid Service Container
User-Defined Services
Base Services
System-Level Services
OSGI Reference Implementation Security Infrastructure
Web Service Engine
Core GT component
Outside of the core infrastructure
Figure 2.6: Globus Toolkit 3 architecture [308]
2.4 Peer-to-peer
Peer-to-peer (P2P) systems and grids are distributed computing systems driven bythe need of resource sharing, but targeting different communities. While the main targetof grid computing is the scientific community, the target of P2P systems is the generaluser. Grids are usually used for complex scientific applications, which are time critical andrequire some quality of service (QoS) guarantees. On the other hand, P2P applicationsare normally content-sharing, IP communication, and cycle stealing available at the edgesof the Internet and without QoS guarantees [14].
Peer-to-peer systems are defined as distributed systems where the nodes (peers) au-tonomously organize the system topology and respond to external usage in a decentralizedfashion to share resources without any central control [14].
Although there are differences between grid and P2P systems, their advantages canbe combined to increase scalability or to decrease maintenance costs. For instance, gridresource discovery can be implemented with P2P structures due to their scalability andself-management properties.
In P2P systems, there is no notion of clients or servers since all nodes are equal, andthus can be both client and server. In another words, in a P2P system, the role of the peersis symmetric. This symmetric role property helps, in many cases, to reduce communicationoverhead or to avoid bottlenecks.
Although in the strictest definition P2P systems are totally distributed, sometimes nodeswith specialized functions can be used for specific tasks or communication management (e.g.,
21

Chapter 2. Large-Scale Distributed Systems
Core GT component: public interfaces frozen between incremental releases; best effort support
Contribution/Tech Preview: public interfaces may change between incremental releases
Communication
Authorization
Delegation
Authentication
Authorization
Pre-WS
Authentication
Authorization
Data
Replication
OSGA-DAI
Reliable
File
Transfer
GridFTP
Replica
Location
Credential
Management
Community
Scheduler
Framework
Grid
Telecontrol
Protocol
Workspace
Management
Grid
Resource
Allocation &
Management
Pre-WS Grid
Resource
Allocation &
Management
WebMDS
Index
Trigger
Monitoring &
Discovery
(MDS2)
Python
WS Core
C
WS Core
Java
WS Core
C Common
Libraries
eXtensible
IO
(XIO)
Deprecated Component: not supported; will be dropped in a future release
WS
Components
Non-WS
Components
SecurityData
Management
Execution
Management
Information
Services
Common
Runtime
Globus Toolkit version 4 (GT4)
Figure 2.7: Globus Toolkit 4 architecture [122]
22

Chapter 2. Large-Scale Distributed Systems
system bootstrapping or to obtain a global encryption key) since the system does notrely on one or more global centralized nodes for its basic operation. However, it must benoted that a system that uses a node to maintain a global index and depends on it tooperate (e.g., searching through the index) cannot be defined as a P2P system.
P2P systems have been used for different purposes and different kinds of applications,as shown in figure 2.8. In P2P systems, every node potentially contributes to the system.In this case, when the number of nodes increases, the capacity of the system also increases,because of additional resources brought by the new nodes. Even though there may existdifferences in the resources provided by each node, such nodes have the same functionalcapacity and responsibility in the system. In addition, P2P systems eliminate the singlepoint of failure by employing a decentralized architecture [14]. Furthermore, P2P systemsrequire minimum management, since they are often self-organized systems and they do notdepend on dedicated servers to manage the system. However, unlike centralized systems,in which the decision point to access the resources is concentrated in a single node, P2Psystems provide access to resources located across the network. This requires efficientalgorithms to distribute and to locate data in the presence of a highly transient populationof nodes.
Peer-to-peer
Systems
Peer-to-peer
Applications
Peer-to-peer
InfrastructuresRouting and
Location
Anonymity
Reputation
ManagementP2P File
Exchange
P2P Content
Publishing and
Storage
Communication
and Collaboration
Internet Service
Support
Distributed
Computation
Figure 2.8: Different use of P2P systems [14]
2.4.1 Architecture
A P2P architecture relies on a network of connected nodes built on top of an underlyingnetwork, known as overlay network [347] (Figure 2.9). The underlying network refers tothe physical network used by the nodes to route their communication packets. The overlaynetwork is responsible for providing P2P services (e.g., data storage) for the applicationsbuilt on top of it, and it is independent of the physical network. It also ensures that anynode can access any object by routing requests through the nodes, exploiting knowledgeat each of them to locate an object. According to Touch [347], the tasks of an overlaynetwork are: (i) to route requests to objects; (ii) to insert and to remove objects; (iii) toplace the nodes in the network; and (iv) to maintain the network. In this context, thedesign of an overlay network is crucial for the operation of the system as it may affect itsscalability, performance, fault-tolerance, self-management, and security. A P2P application
23

Chapter 2. Large-Scale Distributed Systems
uses the overlay network to provide services for the users such as content distribution,instant messaging, among others.
Application layer
Overlay network layer
Underlying network layer
Figure 2.9: Generic P2P architecture [14]
A P2P overlay can be classified as: unstructured, structured, hybrid, and hierarchical.These types of P2P overlays are discussed in sections 2.4.2 to 2.4.5.
2.4.2 Unstructured P2P Network
Unstructured P2P networks form arbitrary topologies. Each node joins the networkfollowing some basic local rules to establish connectivity with other nodes. The networkcan use flooding as the mechanism to send queries across the overlay with a limited scopeor more sophisticated strategies such as random walks [136, 234], gossiping, and routingindices [350]. In an unstructured P2P network, when a node receives a query, it matchesit locally against its own content and sends a list of all content matching the query to therequesting node. If there is no match, the query is sent to some neighbor using, for instance,flooding. Flooding techniques are effective for locating highly replicated objects and theyare resilient to highly-transient node populations. However, they are not scalable as theload of each node and the size of the system increases linearly with the number of queries.In general, an unstructured P2P overlay has the following advantages: (i) it supportscomplex queries since all searches are performed locally; (ii) it is self-organized and resilientto either node failures or nodes frequently joining and leaving the network [175, 235],which is known as churn; (iii) it is easy to built since it does not impose any constraintabout the topology [77]; and (iv) it has lower maintenance overhead, especially in thepresence of a high churn rate.
On the other hand, the disadvantages of unstructured P2P overlays are: (i) they cannotguarantee on locating an object, even though the object exists in the network. This is dueto the strategy used for searching an object. In other words, as the size of the networkis unknown, the overlay limits the number of nodes that a searching message can beforwarded to; and (ii) they are not scalable due to high message overhead [14].
Examples of unstructured P2P overlay are: Publius [361], FreeHaven [101], Gnutella(rfc-gnutella.sf.net), FreeNet (freenetproject.org), and BitTorrent (bittorrent.com).
2.4.3 Structured P2P Network
Even though unstructured P2P overlays are simple and easy to deploy, they sufferfrom low query processing efficiency. Unlike unstructured P2P overlays, structured P2Poverlays impose constraints on the topology and on data placement to enable efficient
24

Chapter 2. Large-Scale Distributed Systems
resource discovery. In these systems, when a node joins the system, it follows some strictprocedures to set up its position in the system according to the topology used.
The constraints imposed by structured P2P networks allow an efficient and accurateresource discovery. In particular, these systems can guarantee that if a resource exists inthe system, it will be found with at most O(log n) messages where n is the number ofnodes in the system [14]. This resolves the issues of resource discovery and scalability ofthe unstructured P2P systems. Nevertheless, structured P2P systems require considerableefforts to maintain them in a consistent state, which makes structured P2P overlaysvulnerable in a churn scenario. In addition, as some structured P2P overlays are unawareof the underlying network due to random key assignment, one logical hop can correspondto multiple physical hops.
In general, structured P2P systems can be classified in three categories based on thedistributed data structure used: distributed hash table (DHT) based system, skip listbased system, and tree based system [360].
A distributed hash table based system uses a DHT to organize the nodes and to indexthe data. In this case, each resource is identified by a key obtained by a uniform hashingfunction [184] such as SHA-1. The key space is divided among the nodes, where each nodeis responsible for one partition of the key space and for storing the data or a pointer tothem locally. As a result, DHT-based systems support efficient exact match queries anduniform load distribution among the nodes, which ensures good performance. Nevertheless,the disadvantages of DHT-based overlays are: (i) the lookup latency in the DHT-basedoverlays can affect the performance of the applications running on them; (ii) they do notprovide anonymity since they map resources directly to nodes and store this information forrouting purpose; and (iii) they cannot support range queries since the uniform distributiondestroys the data ordering. DHT-based systems can be based on several structures such asrings as in Chord [332], a multi-dimensional grid such as in CAN [291], a Plaxton mesh asin Tapestry [391] and Pastry [302], or a XOR-based metric such as in Kademlia [241].
Skip list based systems employ the Skip list [285] structure to place the nodes and topartition the data. In these systems, each level has many lists and a node participates ina list at each level. As result, these systems preserve the order of the data, supportingboth exact match queries and range queries. Moreover, unlike DHT-based systems, skip-list-based systems can inflate or deflate without needing to know the size of the system todetermine the range key values of the nodes. Example of skip list based systems are SkipGraph [21], SkipNet [150], and SkipIndex [384].
Tree based systems use different tree types to index the data to support range queriesefficiently. Examples of the tree types employed by these systems are binary prefix tree asin P-Grid [2], multi-way trees as in [223], balanced trees as in BATON [171], B+trees asin P-ring [89, 90], and R-trees as in [172, 221, 252].
In section 2.4.3, we describe Chord [332], one of the DHT-based P2P overlays mostused in the literature and also used in this doctoral thesis.
Chord
Chord [332] organizes the nodes in a one-dimensional circle according to their identifier.It uses a consistent hash function [184] to assign an m − bit identifier to each node anddata. The identifier space is a circle of numbers from 0 to 2m − 1, where m is the number
25
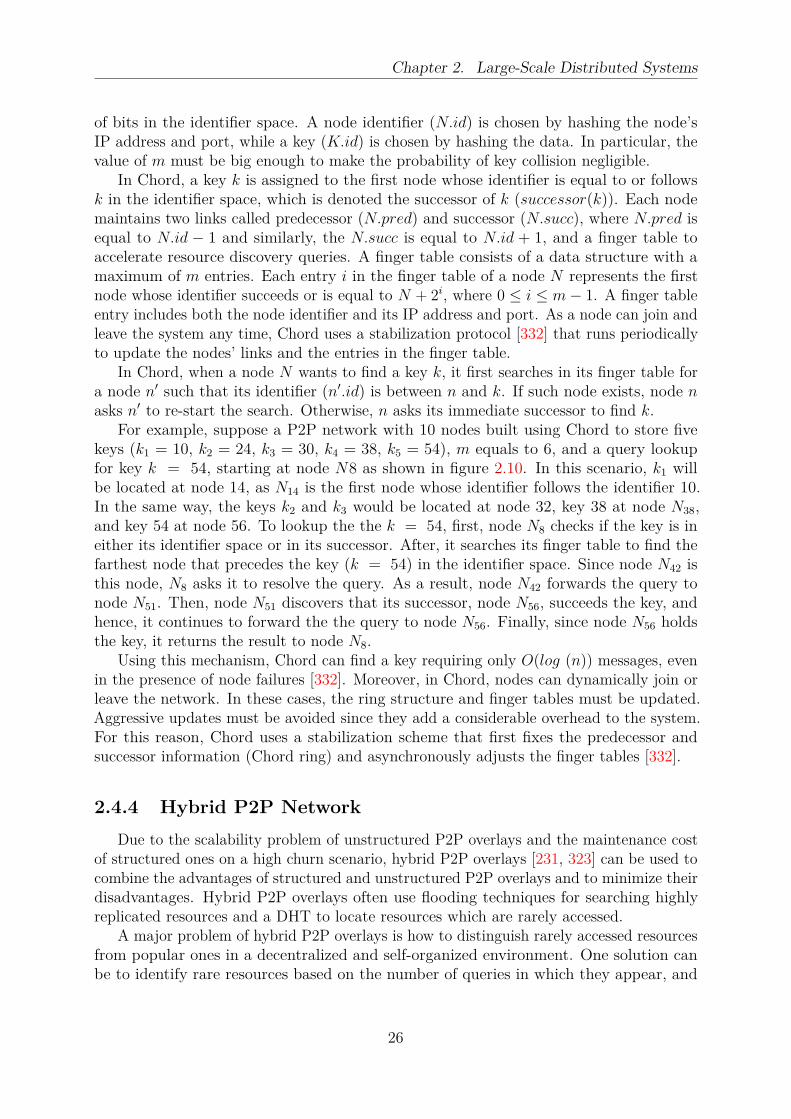
Chapter 2. Large-Scale Distributed Systems
of bits in the identifier space. A node identifier (N.id) is chosen by hashing the node’sIP address and port, while a key (K.id) is chosen by hashing the data. In particular, thevalue of m must be big enough to make the probability of key collision negligible.
In Chord, a key k is assigned to the first node whose identifier is equal to or followsk in the identifier space, which is denoted the successor of k (successor(k)). Each nodemaintains two links called predecessor (N.pred) and successor (N.succ), where N.pred isequal to N.id − 1 and similarly, the N.succ is equal to N.id + 1, and a finger table toaccelerate resource discovery queries. A finger table consists of a data structure with amaximum of m entries. Each entry i in the finger table of a node N represents the firstnode whose identifier succeeds or is equal to N + 2i, where 0 ≤ i ≤ m − 1. A finger tableentry includes both the node identifier and its IP address and port. As a node can join andleave the system any time, Chord uses a stabilization protocol [332] that runs periodicallyto update the nodes’ links and the entries in the finger table.
In Chord, when a node N wants to find a key k, it first searches in its finger table fora node n′ such that its identifier (n′.id) is between n and k. If such node exists, node nasks n′ to re-start the search. Otherwise, n asks its immediate successor to find k.
For example, suppose a P2P network with 10 nodes built using Chord to store fivekeys (k1 = 10, k2 = 24, k3 = 30, k4 = 38, k5 = 54), m equals to 6, and a query lookupfor key k = 54, starting at node N8 as shown in figure 2.10. In this scenario, k1 willbe located at node 14, as N14 is the first node whose identifier follows the identifier 10.In the same way, the keys k2 and k3 would be located at node 32, key 38 at node N38,and key 54 at node 56. To lookup the the k = 54, first, node N8 checks if the key is ineither its identifier space or in its successor. After, it searches its finger table to find thefarthest node that precedes the key (k = 54) in the identifier space. Since node N42 isthis node, N8 asks it to resolve the query. As a result, node N42 forwards the query tonode N51. Then, node N51 discovers that its successor, node N56, succeeds the key, andhence, it continues to forward the the query to node N56. Finally, since node N56 holdsthe key, it returns the result to node N8.
Using this mechanism, Chord can find a key requiring only O(log (n)) messages, evenin the presence of node failures [332]. Moreover, in Chord, nodes can dynamically join orleave the network. In these cases, the ring structure and finger tables must be updated.Aggressive updates must be avoided since they add a considerable overhead to the system.For this reason, Chord uses a stabilization scheme that first fixes the predecessor andsuccessor information (Chord ring) and asynchronously adjusts the finger tables [332].
2.4.4 Hybrid P2P Network
Due to the scalability problem of unstructured P2P overlays and the maintenance costof structured ones on a high churn scenario, hybrid P2P overlays [231, 323] can be used tocombine the advantages of structured and unstructured P2P overlays and to minimize theirdisadvantages. Hybrid P2P overlays often use flooding techniques for searching highlyreplicated resources and a DHT to locate resources which are rarely accessed.
A major problem of hybrid P2P overlays is how to distinguish rarely accessed resourcesfrom popular ones in a decentralized and self-organized environment. One solution canbe to identify rare resources based on the number of queries in which they appear, and
26

Chapter 2. Large-Scale Distributed Systems
+32
+16
+8
+4
+2
+1
N8's Finger table
N8 +1
N8 + 2
N8 + 4
N8 + 8
N8 + 16
N8 + 32
N14
N14
N14
N21
N32
N42
1
8
14
21
32
38
42
48
51
56
Where is the key 54?
Figure 2.10: Example of the lookup for the key k = 54 starting at the node N8 and m = 6 [332]
using a DHT to cache them. Another solution is gossiping historical summary statistics ofreplicated resources [231].
Many approaches have been proposed to build hybrid P2P overlays. For instance,Castro and colleagues [65] use search and data placement strategies of unstructured overlayson a structured overlay to implement complex queries with a smaller number of messagesand with a higher rate of success response queries.
2.4.5 Hierarchical P2P Network
Hierarchical P2P overlays introduce layers to reduce the network load. To keepthe P2P advantages such as self-organization and decentralization, hierarchical P2Poverlays distinguish the nodes as super-peers and leaf-nodes. In this case, peers with alarge amount of physical resources such as CPU and network bandwidth are elected assuper-peers and they are responsible for defining a set of services for peers with fewerresources, i.e., the leaf-nodes or ordinary nodes [336, 395]. Ordinary peers are connected toa super-peer that acts as a proxy for them. Super-peers contact other super-peers on behalfof their peers through flooding [336], gossiping [208, 228], or through a DHT [8, 64, 161, 250].For example, Hui and colleagues use a DHT to organize the nodes in small clusters managedby a head node (i.e., super-peer) to minimize the maintenance overhead of the structuredoverlay. In this case, each cluster has one head node and k inner nodes. A head nodeis responsible for maintaining a link for both its inner nodes (i.e., leaf-nodes) and forother head nodes. Inner nodes of different clusters communicate through their head nodes.In other words, when an inner node wants to communicate with a node outside its owncluster, it sends a message for its super-peer that first identifies the super-peer of suchnode, then it forwards the message for it. Other approaches [148, 270, 377] use a ring
27

Chapter 2. Large-Scale Distributed Systems
to organize the super-peers and a tree to place the ordinary peers, and some [323] areinterested in mutual anonymity and content ownership.
Super-peers can be dynamically elected according to the network load, since only thesuper-peers are involved in advertising, discovering, and resource selection [26]. Manyhierarchical overlays have been proposed such as TOPLUS [131], and Chordella [161].
2.4.6 Comparative View of P2P Structures
Table 2.1 presents a comparative view of the P2P structures discussed in section 2.4.In the first column we show the P2P structure. The second column shows the scalability ofthe structure considering the number of messages to find a resource. In the third column,the robustness of the P2P structure is presented, considering a network under highly churnscenario. Finally, the last two columns present if the given structure requires maintenanceprocedures to work properly, and if it supports range queries.
Table 2.1: Comparative view of the P2P overlay networks
Network ScalabilityRobustness
Maintenance Rangestructure (hops) operations queries
Unstructured O(n) High No NoStructured O(log n) Low Yes Yes
Hybrid O(log n) High Yes YesHierarchical O(log n) High Yes Yes
Scalability is an import characteristic of P2P systems and unstructured P2P systemslack this property, due to the network overhead by flooding messages. Although someimprovements have been made to reduce this overhead, such as random walks [136, 234],gossiping, and routing [350] indices, they increase the response time without guarantees offinding the resources. On the other hand, structured networks are more scalable, but theyincur a high cost of maintenance under a churn scenario.
As P2P systems are expected to be formed of ephemeral nodes, this is a serious concernfor structured P2P systems. In these systems, nodes must be notified periodically toupdate their view about the system. The result is an increase in the network traffic, if theinterval between two notifications is small, or outdated information if the interval is toolarge. Although this is not a crucial problem for content-sharing P2P applications [14],it can be an issue if the structured P2P system is used as resource discovery in a gridenvironment, for instance.
These issues can be solved with hybrid P2P systems, since they often use unstructuredtechniques for searching replicated resources and a DHT to locate rare resources. Nev-ertheless, there is the cost of propagate the queries statistics to identify rare resources.Furthermore, some nodes may become overloaded due to the high number of messages toprocess or due to their limited computational capacity. The solution may be the use ofhierarchical P2P networks since they decrease the number of messages by employing theconcept of super-peers.
28

Chapter 2. Large-Scale Distributed Systems
Moreover, with the exception of unstructured P2P systems, where each node answersthe queries using only its own data, P2P systems can be used for resource discovery inlarge-scale distributed systems since they can process queries efficiently [349].
2.5 Cloud Computing
Many cloud computing definitions have been proposed over the last years. One reasonfor the existence of different perceptions about cloud computing is that cloud computingis not a new technology, but a new operational model that brings together a set of existingtechnologies in a different way [353, 386].
The National Institute of Standards and Technology (NIST) defines cloud computingas [243]:
A model for enabling convenient, on-demand network access to a shared pool ofconfigurable computing resources (e.g., networks, servers, storage, applications, andservices) that can be rapidly provisioned and released with minimal managementeffort or service interaction.
To Foster and colleagues [121], cloud computing is:
A large-scale distributed computing paradigm that is driven by economies ofscale, in which a pool of abstracted, virtualized, dynamically-scalable, managedcomputing power, storage, platforms, and services are delivered on-demand toexternal customers over the Internet.
Finally, Buyya and colleagues [56] define cloud computing as:
A type of parallel and distributed system consisting of a collection of inter-connected and virtualized computers that are dynamically provisioned and presentedas one or more unified computing resource(s) based on service-level agreementsestablished through negotiation between the service provider and consumers.
These three definitions focus on certain aspects of cloud computing such as resourcesharing, virtualization and provision. In the NIST [243] definition, cloud computingis characterized by the idea of elastic capacity and the illusion of infinite computingresources, available through network access that can be easily provisioned with minimalmanagement effort or negotiation with the service provider. In this definition, cloudcomputing is a specialization of the distributed computing paradigm that differs fromtraditional distributed computing because it can be encapsulated as an abstract entitythat delivers different levels of services to customers outside the cloud and that is drivenby economies of scale, dynamically configured with on-demand delivery.
Even though there are considerable differences among the cloud computing definitions,most of them state that a cloud computing system should have (i) pay-per-use capabilities,(ii) elastic capacity and the illusion of infinite resources, (iii) self-service, and (iv) abstractor virtualized resources.
In this thesis, we consider a definition that is mainly based on [56] and [121], wherecloud computing is a type of distributed system that dynamically provisions virtualized
29
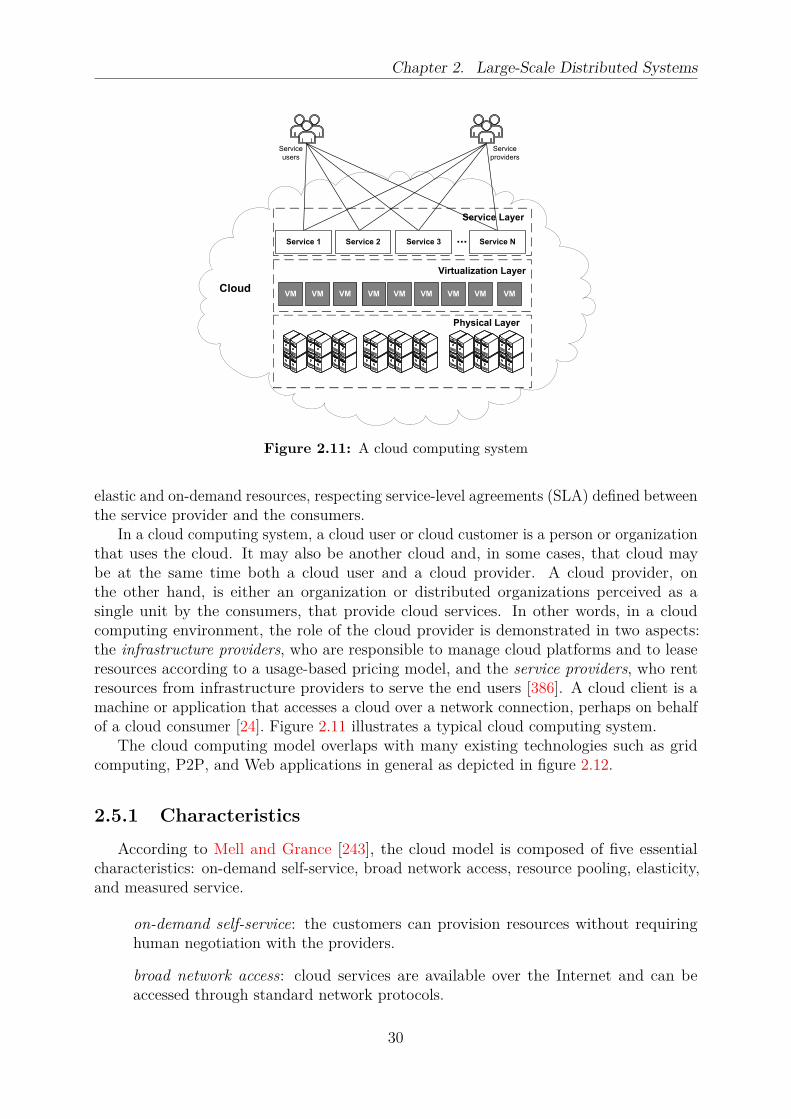
Chapter 2. Large-Scale Distributed Systems
Physical Layer
Virtualization Layer
Service Layer
...
Cloud
Service 1 Service 2 Service 3 Service N
VM VM VM VM VM VM VM VM VM
Service
users
Service
providers
Figure 2.11: A cloud computing system
elastic and on-demand resources, respecting service-level agreements (SLA) defined betweenthe service provider and the consumers.
In a cloud computing system, a cloud user or cloud customer is a person or organizationthat uses the cloud. It may also be another cloud and, in some cases, that cloud maybe at the same time both a cloud user and a cloud provider. A cloud provider, onthe other hand, is either an organization or distributed organizations perceived as asingle unit by the consumers, that provide cloud services. In other words, in a cloudcomputing environment, the role of the cloud provider is demonstrated in two aspects:the infrastructure providers, who are responsible to manage cloud platforms and to leaseresources according to a usage-based pricing model, and the service providers, who rentresources from infrastructure providers to serve the end users [386]. A cloud client is amachine or application that accesses a cloud over a network connection, perhaps on behalfof a cloud consumer [24]. Figure 2.11 illustrates a typical cloud computing system.
The cloud computing model overlaps with many existing technologies such as gridcomputing, P2P, and Web applications in general as depicted in figure 2.12.
2.5.1 Characteristics
According to Mell and Grance [243], the cloud model is composed of five essentialcharacteristics: on-demand self-service, broad network access, resource pooling, elasticity,and measured service.
on-demand self-service: the customers can provision resources without requiringhuman negotiation with the providers.
broad network access: cloud services are available over the Internet and can beaccessed through standard network protocols.
30
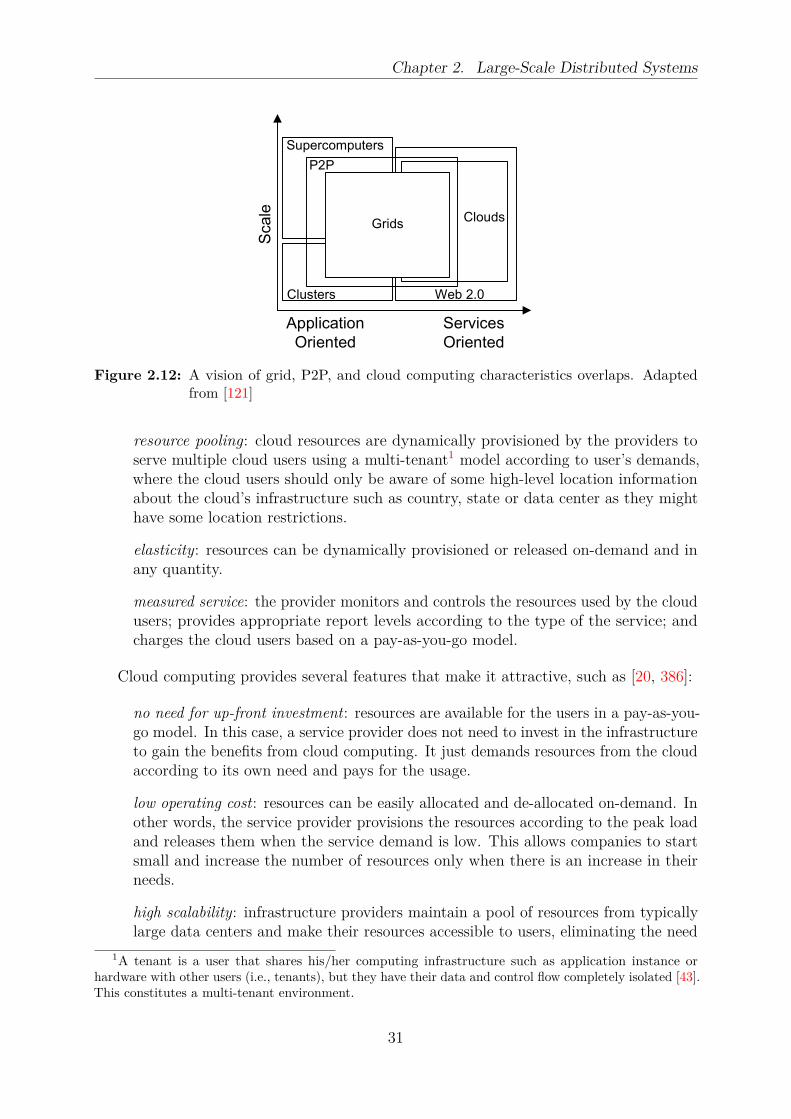
Chapter 2. Large-Scale Distributed Systems
Scale
Web 2.0
CloudsGrids
Supercomputers
Clusters
Application
Oriented
Services
Oriented
P2P
Figure 2.12: A vision of grid, P2P, and cloud computing characteristics overlaps. Adaptedfrom [121]
resource pooling: cloud resources are dynamically provisioned by the providers toserve multiple cloud users using a multi-tenant1 model according to user’s demands,where the cloud users should only be aware of some high-level location informationabout the cloud’s infrastructure such as country, state or data center as they mighthave some location restrictions.
elasticity: resources can be dynamically provisioned or released on-demand and inany quantity.
measured service: the provider monitors and controls the resources used by the cloudusers; provides appropriate report levels according to the type of the service; andcharges the cloud users based on a pay-as-you-go model.
Cloud computing provides several features that make it attractive, such as [20, 386]:
no need for up-front investment: resources are available for the users in a pay-as-you-go model. In this case, a service provider does not need to invest in the infrastructureto gain the benefits from cloud computing. It just demands resources from the cloudaccording to its own need and pays for the usage.
low operating cost: resources can be easily allocated and de-allocated on-demand. Inother words, the service provider provisions the resources according to the peak loadand releases them when the service demand is low. This allows companies to startsmall and increase the number of resources only when there is an increase in theirneeds.
high scalability: infrastructure providers maintain a pool of resources from typicallylarge data centers and make their resources accessible to users, eliminating the need
1A tenant is a user that shares his/her computing infrastructure such as application instance orhardware with other users (i.e., tenants), but they have their data and control flow completely isolated [43].This constitutes a multi-tenant environment.
31

Chapter 2. Large-Scale Distributed Systems
to plan far ahead for provisioning, and achieving high scalability in a relatively easyway.
easy access: services hosted in the cloud are generally web-based and easily accessiblethrough a variety of devices with Internet connections.
reduced business risk: in this case, a service provider shifts its business risk to theinfrastructure provider, which often has better expertise and is better equipped formanaging these risks.
To Foster and colleagues [121], the factors that contributed to the growing interests incloud computing are:
1. the rapid decrease in hardware cost, the increase in computing power and stor-age capacity, combined with the advent of multi-core architectures and modernsupercomputers consisting of hundreds of thousands of cores.
2. the exponentially growing data size in scientific instrumentation/simulation andInternet publishing and archiving.
3. the wide-spread adoption of services computing and Web 2.0 applications.
Cloud computing is also gaining popularity because it helps companies to reduce costsand carbon footprint. Cloud data centers generally employ virtualization techniques toprovide computing resources as utilities and virtual machine (VM) technologies for serverconsolidation inside big data centers, containing a large number of computing nodes. Torealize the potential of cloud computing, cloud providers have to ensure flexibility intheir services to meet different usage pattern requirements, allowing on-demand accessto resources, with no need for the user to provision or maintain resources. At the sametime, cloud providers aim to maximize the resources utilization and to reduce energyconsumption, for instance.
2.5.2 Drawbacks
There are still many problems concerning cloud computing such as [46, 144, 167, 338,364, 365]:
lack of appropriate cloud simulation and testing tools: before moving his/her infras-tructure to the cloud, the service provider should be able to simulate it and reasonabout the advantages/disadvantages of this movement. In a similar way, the end usershould also be able to simulate the execution of his/her application in a controlledcloud environment. So far, there are few simulation tools for clouds [58, 198, 329, 372]and they are not prepared to simulate real-world scenarios.
reduced performance stability: since clouds use virtualized resources, which areallocated to the application in a totally transparent way, big performance variationscan occur [167]. This is particularly problematic when running scientific applicationsthat take days or even weeks to execute.
32
Chapter 2. Large-Scale Distributed Systems
data lock-in and standardization: the lack of standardized APIs can restrict datamigration between different cloud providers and often prevents data sharing orrestricts the user to save data in a different format. This can easily lock a user toa particular cloud provider. In some situations, the data are physically stored indistributed locations and only the cloud provider has full control over the data. Forinstance, it is often the case where only the cloud provider has access to logs andthe ability to remove data physically. One way to deal with the data lock-in issuecan be using independent data representation and adopting standard data importand export functionality [275]. Google has attempted to address this issue throughits data liberation front (dataliberation.org) whose goal is to allow data movementinto/outside the Google infrastructure [117]. Other ways can be [156] (i) usingAPIs that have different implementations; (ii) choosing an application model thatcan run on multiple clouds (e.g., MapReduce); (iii) manually decoupling the cloud-specific code of the application designed for each cloud provider from the applicationlogic layer; (iv) creating widespread standards and APIs; and (v) using vendor-independent cloud abstraction layer. Cloud standardization is difficult since thereare many barriers to adopt standard APIs and protocols [275, 276] such as (i) cloudproviders are often creating facilities to avoid losing their users to other cloudproviders; (ii) cloud providers offer differentiated services and they want to haveunique services to attract more users; (iii) cloud providers usually do not easily agreeon standards; (iv) standards take years to be developed and to be adopted globally;(v) there are various standards being developed simultaneously and agreement onwhich one to adopt may be difficult, if not impossible, to attain; and (vi) the cloudcomputing model requires multiple standards, rather than one overarching set ofstandards.
reduced number of effective energy-efficient solutions: since the cloud applications areexecuted in big data centers, power usage becomes a major concern. Even thoughthe industry and academy are starting to investigate energy-efficient proposals forcloud computing environments, an effective and integrated solution to this problemis yet to be conceived.
reduced security: security is a difficult issue [257, 338] for many reasons. First,a cloud environment may have heterogeneous hardware and software resources.Second, the cloud works on employing a shared model, where services are spreadacross multiple providers. This can lead to ownership and compliance concerns.Finally, the delivery and deployment model of cloud computing may result in securitybreaks such as incorrect data isolation level. To some extent, virtualization achievesresource homogeneity, but as cloud services are shared by different users, data andapplication might break down, compromising its confidentiality and/or integrity.Security breaks can occur intercepting inter-host or multi-domain communicationmessages, VM migrations, preparing malicious VM images, failure in multi-tenancyimplementations, malicious service implementation, among others [185, 338]. Also,a cloud service can involve different providers. For instance, a user can subscribe toone cloud provider, that is subscribed to another cloud provider, which utilizes theinfrastructure of a third cloud provider. In this scenario, the guarantee of trust andsecurity properties can be affected since each cloud provider has normally distinct
33
Chapter 2. Large-Scale Distributed Systems
security policies in a manner that the user does not have guarantees that his/herdata are protected among cloud services interactions. In addition to that, there is alack of transparency about security assurances [185].
data integrity: several researches reported internal and external data threats for dataintegrity in the cloud that resulted in data loss [364]. Also, some providers discardrarely accessed data [364], decreasing their availability.
2.6 Summary
In this chapter, we discussed many important aspects of several types of large-scaledistributed systems. First, we briefly presented the main landmarks of the last fifty yearsthat led to the current state of these systems. Then, cluster, grid, P2P, and cloud computingsystems were briefly discussed, considering their characteristics and architectures.
While grid applications are often built to provide services for moderated-size com-munities assuming a stable environment to be able to deliver non-trivial qualities ofservices, P2P systems are designed to offer limited services to a huge number of partici-pants in an unstable, unpredictable, and often untrusted environment. These distinctionsare associated to the goals of each environment.
Grid computing was driven by the need for more compute power [126], aggregatingpowerful resources distributed across different virtual organizations, normally universitiesand research institutes, to enable collaboration in a specific domain.
A P2P system, on the other hand, was driven by the need to decrease costs withthe use of commodity computing resources autonomously organized, employing ad-hoccommunications to increase collaboration among the peers [14]. This not only decreases thecost, but also allows information to be disseminated effectively in a large-scale scenario [360].
A consequence of these communities characteristics is that early grid computing didnot address scalability and self-management as priorities [126, 360]. Furthermore, theparticipants in a grid environment are trustful, usually not large, and they have incentivesto collaborate following well-defined policies. This enhances the resource’s ability to deliverthe expected quality of service but with a higher cost to manage the resources.
P2P computing became popular offering mass-culture services (e.g., file-sharing) withanonymity guarantees, and executing highly parallel applications (e.g., SETI@home [370])that scale in presence of thousands of nodes with intermittent participations and highlyvariable behaviors [123]. In contrast to grids, the number of participants in a P2P systemis very large (e.g., hundred of thousands [12]) and the participants do not need to betrustful.
In the last decade, we observed a convergence between grid computing and P2Psystems [123], aiming to provide the best characteristics of each paradigm. More specifically,many grid environments began to employ P2P decentralized techniques to deal withlarge-scale resource sharing. In the same way, in addition to the traditional file sharingapplications, P2P systems started to execute a wide range of scientific applications thatrequire sophisticated resource management techniques, usually present in grid systems.
Cloud computing is similar to grid computing since it also aims to provide distributedresources to achieve some computing objectives at reduced costs. However, whereas the
34

Chapter 2. Large-Scale Distributed Systems
resources in grid are provided through immediate or advance reservation, cloud employsan on-demand resource provision. This removes the need of reservation in order to meetthe users’ demands [20, 388] and reduces the costs. Also, the cloud infrastructure isavailable to everyone at different scales [139, 181, 335] and not only to members of somecommunities as in the grid. Moreover, grid computing is a one-model solution with toolsas the Globus Toolkit [122] deployed to enable resource aggregation [325]. On the otherhand, a cloud-based solution is based on multiple models (i.e., IaaS, PaaS, and SaaS),which leads to a flexible environment for the customers. In the cloud, the customers donot need to wait in a queue to execute their applications, but they can use the clouds’APIs to allocate the resources on-demand in nearly real-time.
We claim that, in the next years, a distributed computing environment will be builtcombining the advantages of each distributed architecture discussed in this chapter,available for the users as a utility computer. It will require adequate tools to abstractthe computer according to the users goals and the users shall be unaware of it such as ithappens in the Internet today, approximating to the utility computing concept envisionedby McCarthy [132].
35
Chapter 3
A Detailed View of Cloud
Computing
Contents
3.1 Technologies Related to Cloud Computing . . . . . . . . . . . 37
3.1.1 Virtualization . . . . . . . . . . . . . . . . . . . . . . . . . . . . 37
3.1.2 Service-Level Agreement . . . . . . . . . . . . . . . . . . . . . . 41
3.1.3 MapReduce . . . . . . . . . . . . . . . . . . . . . . . . . . . . . 43
3.2 Cloud Organization . . . . . . . . . . . . . . . . . . . . . . . . . 45
3.2.1 Architecture and Service Model . . . . . . . . . . . . . . . . . . 45
3.2.2 Deployment Model . . . . . . . . . . . . . . . . . . . . . . . . . 47
3.2.3 Cloud Federation . . . . . . . . . . . . . . . . . . . . . . . . . . 48
3.3 Cloud Standards and Metrics . . . . . . . . . . . . . . . . . . . 53
3.3.1 Cloud Standards . . . . . . . . . . . . . . . . . . . . . . . . . . 53
3.3.2 Cloud Metrics . . . . . . . . . . . . . . . . . . . . . . . . . . . . 54
3.4 IaaS Cloud Computing Systems . . . . . . . . . . . . . . . . . . 55
3.4.1 Architecture . . . . . . . . . . . . . . . . . . . . . . . . . . . . 55
3.4.2 Using an IaaS Cloud Service . . . . . . . . . . . . . . . . . . . 57
3.5 Cloud Computing Architectures . . . . . . . . . . . . . . . . . 60
3.5.1 Centralized Systems . . . . . . . . . . . . . . . . . . . . . . . . 60
3.5.2 Decentralized Systems . . . . . . . . . . . . . . . . . . . . . . . 68
3.5.3 Comparative View . . . . . . . . . . . . . . . . . . . . . . . . . 73
3.6 Summary . . . . . . . . . . . . . . . . . . . . . . . . . . . . . . . 73
36

Chapter 3. A Detailed View of Cloud Computing
This chapter presents practical aspects that must be considered when developing a cloudcomputing solution. First, we discuss virtualization techniques in section 3.1.1, since themajority of cloud systems employ virtualization techniques for resource management andworkload isolation. Then, in section 3.1.2, we briefly discuss service-level agreement (SLA),and the guarantees that are usually provided by the clouds. Cloud applications are usuallyprogrammed using the MapReduce programming model, and we present the concepts ofMapReduce in section 3.1.3. The cloud organization is presented in section 3.2 followed bysome available cloud standards and metrics (Section 3.3). Cloud computing systems arediscussed in section 3.4 followed by a review of IaaS cloud architectures (Section 3.5). Finally,section 3.6 summarizes this chapter.
3.1 Technologies Related to Cloud Computing
3.1.1 Virtualization
In this section, we discuss virtualization, which is a technology widely adopted toimplement clouds since it helps to increase resource utilization in an effective way. First,we present a definition of virtualization. Second, we describe the virtualization techniques.Then, the concept of virtual machine live migration and two approaches used to implementit are discussed. Finally, we present the concept of workload and server consolidation,which are by products of virtualization.
3.1.1.1 Definition
The term virtualization refers to the abstraction of computing resources (e.g., CPU,disk, network) from the applications aiming to improve sharing and utilization of computersystems [138]. The use of virtualization exists since 1960s, when it was first implementedby IBM to provide concurrent, interactive access to the mainframe 360/67 (Sections 2.1and 2.1.4).
A virtual machine (VM) is an environment provided by a virtualization softwarecalled virtual machine monitor (VMM), or hypervisor. In this case, the virtualizationlayer is placed between the bare hardware and the guest operating systems and gives theOSes a virtualized view of the hardware as shown in figure 3.1. The platform used by thehypervisor is named host machine, and the module that uses the virtual machine is namedguest machine. An important function of the hypervisor is to provide the connectionbetween virtual machines and the host machine. It also abstracts the resources of thehost machine, which will be used by the operating system through the virtual machine,and it provides the isolation among virtual machines placed in the same host machine,guaranteeing the independence of each other. Furthermore, the hypervisor handles changesin the processor where the application is running on without affecting the user’s OS orapplication [258, 325].
37

Chapter 3. A Detailed View of Cloud Computing
Hardware
Virtual Machine Monitor (VMM)
Operating System
Application1 Applicationn
Operating System
Application1 Applicationn
Virtual Machine1 Virtual Machinen
Host
Figure 3.1: Example of virtualization [138]
3.1.1.2 Techniques
Virtualizing the entire hardware faces some challenges. First, most of the CPUarchitectures were not designed to be virtualizable. Second, virtualization requires toplace a layer between the hardware and the operating system to create and to managethe virtual machines. In other words, the guest operating system must often run inan unprivileged level. However, most of the x86 operating systems are designed to rundirectly on the bare hardware (privileged level), having full control of the machine. Inthis scenario, the VMM must be able to intercept privileged instructions performed by thevirtual machine and to give them the appropriate treatment [283]. Nowadays, there arethree techniques to perform this interception namely full virtualization, paravirtualization,and hardware-assisted virtualization.
Full virtualization provides a complete hardware emulation allowing the guest operatingsystem to have full control of the hardware. In this case, the guest operating system runsin privileged mode using the hypervisor to intercept and to translate privileged instructionson-the-fly [283, 301]. The main advantage of this technique is that the guest OS runscompletely unaware of the virtual machine environment and does not need to be modified.The main disadvantage is the reduced performance of the VMM, due to frequent contextswitching activity. As example, we can cite KVM [197], Microsoft Hyper-V, and VMwareESX Server [100, 362].
Paravirtualization introduces a virtualization layer on top of the bare hardware. Unlikefull virtualization, in this technique the guest operating system is aware of the virtualmachine. In this case, the kernel of the guest OS is modified to delegate the execution ofnon-virtualized instructions to the VMM and this simplifies the design of the hypervisor.This technique can lead to better performance than full virtualization since the hypervisorand the operating system are aware of each other and can cooperate to achieve severaltasks. Also, the operating system is provided with an interface to access directly somedevices like disks or network interfaces [28], improving the performance. As an example,we can cite Xen [28].
The hardware-assisted virtualization is an alternative approach which aims to decreasethe performance gap between paravirtualization and full virtualization. It uses specialhardware instructions to automatically direct privileged and non-virtualized instructions
38
Chapter 3. A Detailed View of Cloud Computing
to the VMM, instead of emulating them. This allows the guest operating system to runwithout changes. However, it has the overhead of context switches between the VMMs,and it requires hardware support, which imposes a higher cost to server consolidation [5].
3.1.1.3 Live Migration
Live migration is the seamlessly movement of running virtual machines from onephysical machine to another with negligible downtime (i.e., in order of milliseconds) [80].For instance, with live migration, a streaming media server can be migrated withoutrequiring the client to reconnect. Furthermore, moving an entire virtual machine allowsthe administrators to optimize the placement of system workload, to perform maintenancetasks, and to re-allocate resources on-the-fly without knowing details about the virtualmachine, which significantly improves the system manageability [80].
In most cases, VM’s live migration is done using a network-attached storage (NAS) inpreference to using local disks in each individual nodes, in order to avoid virtual machine(VM) disk migration. It must also be noted that live migration without shared storage isonly supported by few hypervisors.
VM live migration can be categorized into two approaches: pre-copy [80] and post-copy [157].
In the pre-copy approach [80] the VM’s memory pages are iteratively copied to thetarget node while the VM continues to execute at the source node. If, during the copyprocess, a transmitted page is modified, it is re-sent to the target node in another copyiteration. After the end of the memory state transfer, the VM is suspended at the sourcenode and its CPU state and any remaining inconsistent memory pages are transferred to thetarget node, where the VM is resumed. Finally, with the acknowledge of the target node,the device drivers are reconfigured in the new node, the IP address of the migrated VMis advertised, and the source node releases its allocation of the virtual machine. Thisapproach aims to minimize both VM downtime and application’s performance degradationwhen the VM is executing a read-intensive workload.
On the other hand, the post-copy approach aims to minimize the network overheaddue to possible duplicate memory copies, transferring each memory page at most once.The post-copy [157] live migration approach works as follows. The VM is first suspendedon the source node and its CPU state is transferred to the target node. Then, the VM isresumed at the target node, that actively pushes the VM’s memory pages from the sourcefrom the target node, when they are accessed. Note that this approach creates a residualdependency between the source and target nodes.
The usage of each VM live migration approach depends on the VM workload type andthe performance goals of migration. For VMs with read-intensive workloads, the pre-copyapproach would be the best approach whereas the post-copy approach is best suited forcases where a small number of pages is accessed in the target node.
3.1.1.4 Workload and Server Consolidation
Consolidation is a technique that reallocates virtual machines to achieve some objectives.For instance, it can be used to reduce the amount of physical machines to run the virtual
39

Chapter 3. A Detailed View of Cloud Computing
machines or to improve performance of a virtual machine, migrating it for a more powerfulphysical machine [239, 358].
Virtualization and live migration make possible to consolidate heterogeneous workloadsonto a single physical platform, reducing the total cost of ownership and leading to betterutilization. This practice is also employed to overcome potential software and hardwareincompatibilities in case of upgrades, allowing systems to run legacy and new operatingsystems concurrently [351]. Recently, consolidation has been used to reduce the number ofunderutilized servers.
Figure 3.2 illustrates the consolidation strategy. First, a power-inefficient allocationis shown (Figure 3.2(a)). In this case, there are three active quad-core hosts, two ofthem with 25% of their capacity utilized and one with 50% of its capacity utilized. Withconsolidation, as shown in figure 3.2(b), all virtual machines are allocated in one host andthe other hosts can be turned off, reducing the power consumption of the whole system.
Host 1
OS
VM Monitor
VM1
Host 2
OS
VM Monitor
VM2
Host 3
OS
VM Monitor
VM4VM3
(a) Before consolidation
Host 1
OS
VM Monitor
VM1
Host 2
OS
VM Monitor
VM2
Host 3
OS
VM Monitor
VM4VM3VM1 VM4
(b) After consolidation
Figure 3.2: Example of workload consolidation using virtual machines
Server consolidation uses workload consolidation in order to reduce the number ofactive servers. It is the process of gathering several virtual machines into a single physicalserver. It is often used by data centers to increase resource utilization and to reduceelectricity costs [358].
The consolidation process can be performed in a single step using the peak load demands,known as static consolidation, or in a dynamic manner, re-evaluating periodically theworkload demand in each virtual machine (i.e., dynamic consolidation).
In static consolidation, once allocated, a virtual machine stays in the same physicalserver during its whole lifetime. In this case, live migration is not used. The utilization ofthe peak load demand ensures that the virtual machine does not overload. However, in adynamic environment with different load patterns, the virtual machine state can be idlemost of the time, resulting in an inefficient power allocation.
Dynamic consolidation usually yields better results since the allocation of virtualmachines occurs according to the current workload demands. Dynamic consolidation mayrequire migrating virtual machines between physical servers in order to [113]: (i) pull
40
Chapter 3. A Detailed View of Cloud Computing
out physical servers from an overload state when the total number of virtual machinesmapped to a physical server becomes higher than its capacity; (ii) or turn off a physicalserver when it is idle or when the virtual machines mapped to it can be moved to anotherphysical server.
Consolidation influences utilization of resources in a non-trivial manner. Clearly, energyusage does not linearly add when workloads are combined. For example, in an Intel i7machine (4 real cores and 4 cores emulated) an application using 100% of one core, withthe other cores in the idle state, consumes 128W whereas the same application using 100%of eight cores consumes 170W [36]. Moreover, resource utilization and performance canalso change in a non-trivial manner. Performance degradation occurs with consolidationbecause of internal conflicts among consolidated applications, such as cache conflicts,conflicts at functional units of the CPU, disk scheduling conflicts, and disk write bufferconflicts [359].
In a cloud computing environment, server consolidation presents some additionaldifficulties such as: (i) the cloud computing environment must provide reliable QoS,normally defined in terms of service-level agreement (SLA), which describe characteristicssuch as minimal throughput and maximal response time delivered by the deployed systems;(ii) there can be dynamic changes of the incoming requests for the services; (iii) the resourceusage patterns are usually unpredictable; and (iv) the users have distinct preferences.
3.1.2 Service-Level Agreement
In cloud computing, the relation between consumers and service providers is usuallybased on service-level agreement (SLA) [66]. A service-level agreement (SLA) defines thelevel of services, priorities, guarantees, warrants, and obligations of both service providersand consumers. It may also specifies the penalties in case of violation of the SLA [382].Moreover, an SLA includes some service parameters referred to as quality of service (QoS),such as availability, throughput, reliability, security, and performance indicators (e.g.,response time, I/O bandwidth) [367, 382].
Since different organizations have distinct definitions for QoS parameters, it is notpossible to fulfill all consumer expectations from the service provider perspective and abalance needs to be made via a negotiation process, committed in the end by the consumerand the service provider. After the agreement has been established, it is recommended tocontinuously monitor the attributes to ensure adherence to the contracted SLA parametersor, in some cases, renegotiate them. This requires dedicated resources or an assistance ofa third-party to measure the SLA’s parameters appropriately. In the literature, there aremany frameworks [52, 199, 316] to help consumers and providers to measure their SLA’sparameters.
In practice, an SLA is a document composed of several sections, which usually in-cludes [45]:
objective: describes why the agreement was created.
parts: describes the parts involved in the agreement and their roles (consumer,provider).
validity: defines the period of the time for which the agreement is valid.
41

Chapter 3. A Detailed View of Cloud Computing
scope: defines the services and resources involved in the agreement.
service level objectives: determines the service levels agreed between the parts, whichnormally include indicators such as availability, response time, CPU time, disk usage,among others.
penalties: defines the actions that should be taken if the service level objectives areviolated.
Figure 3.3 presents an example of an SLA document written in the Web service levelagreement (WSLA) language [190]. In this case, it describes an agreement named Stock-quoteServiceLevelAgreement12345 specifying that the service provider must keep the serviceresponse time below 5 seconds.
Nowadays, most of the cloud providers define their SLA in function of availabilityguarantees. In such case, they define the minimum percentage of time that their serviceswill be available during a certain period of time and the penalties as discount for the users.
<wsla :SLAxmlns : x s i=" http ://www. w3 . org /2001/XMLSchema−i n s t ance "
xmlns : wsla=" http ://www. ibm . com/ wsla "name=" StockquoteServiceLevelAgreement12345 ">
<Parties>. . .
</Parties>
<ServiceDefinition>. . .
</ServiceDefinition>
<Obligations><ServiceLevelObjective name=" g1 ">
<Obligated>provider</Obligated><Validity>
<Start>2001−11−30T14:00:00.000−05:00</Start><End>2001−12−31T14:00:00.000−05:00</End>
</Validity><Expression>
<Predicate x s i : type=" wsla : Less "><SLAParameter>AverageResponseTime<SLAParameter><Value>5</Value><TimeUnit>second</TimeUnit>
</Predicate></Expression><EvaluationEvent>NewValue</EvaluationEvent>
</ServiceLevelObjective></Obligations>
</wsla :SLA>
Figure 3.3: Example of an SLA structure. Adapted from [190]
42
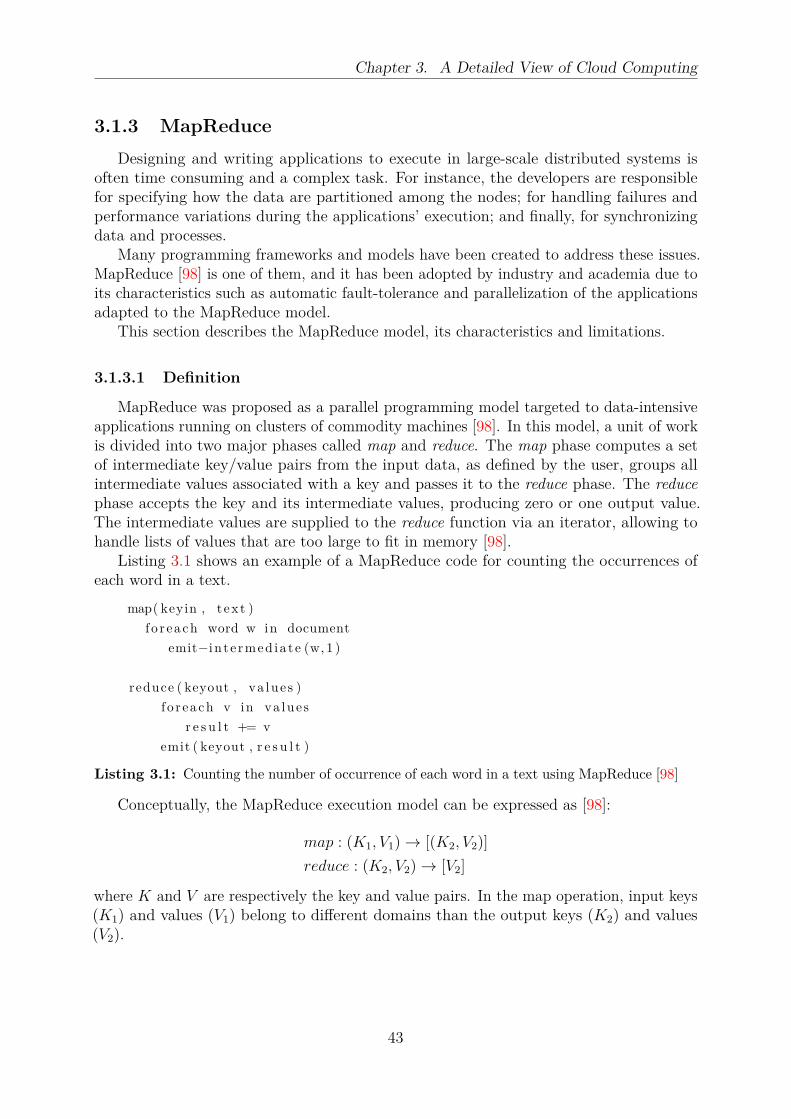
Chapter 3. A Detailed View of Cloud Computing
3.1.3 MapReduce
Designing and writing applications to execute in large-scale distributed systems isoften time consuming and a complex task. For instance, the developers are responsiblefor specifying how the data are partitioned among the nodes; for handling failures andperformance variations during the applications’ execution; and finally, for synchronizingdata and processes.
Many programming frameworks and models have been created to address these issues.MapReduce [98] is one of them, and it has been adopted by industry and academia due toits characteristics such as automatic fault-tolerance and parallelization of the applicationsadapted to the MapReduce model.
This section describes the MapReduce model, its characteristics and limitations.
3.1.3.1 Definition
MapReduce was proposed as a parallel programming model targeted to data-intensiveapplications running on clusters of commodity machines [98]. In this model, a unit of workis divided into two major phases called map and reduce. The map phase computes a setof intermediate key/value pairs from the input data, as defined by the user, groups allintermediate values associated with a key and passes it to the reduce phase. The reducephase accepts the key and its intermediate values, producing zero or one output value.The intermediate values are supplied to the reduce function via an iterator, allowing tohandle lists of values that are too large to fit in memory [98].
Listing 3.1 shows an example of a MapReduce code for counting the occurrences ofeach word in a text.
map( keyin , t ex t )
f o r each word w in document
emit−i n t e rmed ia t e (w, 1 )
reduce ( keyout , va lue s )
f o r each v in va lue s
r e s u l t += v
emit ( keyout , r e s u l t )
Listing 3.1: Counting the number of occurrence of each word in a text using MapReduce [98]
Conceptually, the MapReduce execution model can be expressed as [98]:
map : (K1, V1) → [(K2, V2)]
reduce : (K2, V2) → [V2]
where K and V are respectively the key and value pairs. In the map operation, input keys(K1) and values (V1) belong to different domains than the output keys (K2) and values(V2).
43

Chapter 3. A Detailed View of Cloud Computing
3.1.3.2 Characteristics
In MapReduce the processing engine and the underlying storage system are designed toscale up or down independently. The storage system often uses a distributed file system tosplit and to distribute the data over the machines. In this case, each partition is used as aninput for the mapper. Therefore, if the input data are split into M partitions, MapReducewill create M mappers to process the data. In practice, the processing engine is structuredas a master/slave system, where the master is responsible to assign the tasks (map andreduce) for the workers and to coordinate the execution flow. A worker parses the key/valuepairs out of the input data and executes the user-defined map function.
Figure 3.4 shows the overall flow of a MapReduce execution. First, the system splitsthe input data in M partitions and then starts many copies of the user-program on a set ofmachines. Second, one execution is elected the master, that uses a scheduler to assign thetasks for idle workers based on data locality and network state. It also controls failed tasksby rescheduling them to another worker. Third, the worker executes the map function andstores the intermediate key/value pairs in memory. Forth, periodically, the worker flushesthe intermediate key/value pairs to its local file system and passes back the location tothe master, which is responsible for forwarding these locations to a reduce worker. Fifth,a reducer worker reads all data and sorts them by the intermediate keys. The sorting isnecessary since many different keys may map to the same reduce task. Finally, the reduceworker iterates over the intermediate values executing the user-defined reduce functionand stores the values into the final output file.
Distributed
File System
Storage
split1
split2
split3
split4
map key/valuekey/value
map key/valuekey/value
map key/valuekey/value
map key/valuekey/value
key/valuekey/valuekey/valuekey/value
key/valuekey/valuekey/valuekey/value
reduce
reduce
part1
part2
sort
sort
sort
sort
copy merge
merge
Mapper node Reducer nodeDistributed File System
shuffle
Figure 3.4: MapReduce execution flow [98]
MapReduce tolerates failures of the map and reduce phases. When a map worker fails,even for a completed map, the system re-executes the failed map and notifies all reduceworkers’ that are executing. This is necessary, because map workers store the result locally.Also reduce tasks that have not already read the data from the failed worker need to besignalized to read from the new worker. On the other hand, completed reduce tasks donot need to be re-executed when a node failure occurs, since their output is stored into aglobal file system.
MapReduce is in general guided by the following features [98]:
flexibility: the programmers just need to write the map and the reduce functions toprocess the data, without needing to know how to parallelize a MapReduce job.
44

Chapter 3. A Detailed View of Cloud Computing
scalability: many existing applications face the challenge of scaling when the amountof data increases. When elastic scalability is desired, it requires dynamic behaviorto scale up or down as the computation requirements change.
efficiency: MapReduce minimizes data movement, scheduling the tasks to process asclose as possible to the data location.
fault-tolerance: thanks to the distributed file system, which keeps replicas of apartition, and the use of stateless functions to operate over the input values, tasksor machines can fail without requiring effort from the programmer. The failuresare compensated by re-scheduling the tasks to another machine that can handle theload.
Some limitations of MapReduce are [219]: (a) lack of support for multiple datasets and(b) lack of support for iterative data analysis, requiring data to be loaded at each iterationand demanding an extra MapReduce task to detect termination.
3.2 Cloud Organization
3.2.1 Architecture and Service Model
Several cloud architectures have been proposed in the literature. Generally, thearchitecture of a cloud computing system can be divided into four layers: hardware,infrastructure, platform and application layers, as shown in figure 3.5.
Infrastructure as a Service (IaaS)
Hardware
Platform as a Service (PaaS)
Microsoft Azure,
Google AppEngine,
Amazon SimpleDB/S3,
Amazon SQS
Software Framework
(Java/ Python/.Net)
Storage (DB/File)
Queue Systems
Amazon EC2
Rackspace
GigaSpaces
Virtual Machine
Virtual Network
Storage
Hardware
Microsoft Azure,
Google AppEngine,
Amazon SimpleDB/S3,
Amazon SQS
Software Framework
(Java/ Python/.Net)
Storage (DB/File)
Queue Systems
Amazon EC2
Rackspace
GigaSpaces
Virtual Machine
Virtual Network
Storage
Hardware
Amazon EC2
Rackspace
GigaSpaces
Virtual Machine
Virtual Network
Storage
Software as a Service (SaaS)
Google Apps,
SalesForce,
NetSuite
Application
Figure 3.5: Cloud computing architecture [243]
The hardware layer contains the physical resources of the cloud, such as CPUs, disksand networks. It is usually confined in data centers which contain thousands of serversand storage systems interconnected by switches.
The infrastructure layer contains resources that have been abstracted typically by usingvirtualization techniques (Section 3.1.1), creating a pool of computing resources to beexposed as integrated resources to the upper layer and end users [121]. This layer is animportant component of cloud computing, since many features such as elastic resourceassignment are made available in this layer [386].
The platform layer consists of application frameworks and a collection of specializedtools on top of the infrastructure layer to provide a development and/or deployment
45

Chapter 3. A Detailed View of Cloud Computing
platform aiming to minimize the burden of deploying applications directly into virtualmachines containers [121, 386].
The application layer contains the applications that run in the clouds. Different fromtraditional applications, cloud applications can leverage on automatic scaling to achievebetter performance and availability in an on-demand usage.
Usually, a cloud service model is mapped to the cloud architecture. In such case, thecloud service model is divided into three classes, according to the abstraction level andthe service model of the providers: infrastructure-as-a-service (IaaS), platform-as-a-service(PaaS), and software-as-a-service (SaaS) [243] (Figure 3.5).
The main difference between these cloud service models relies on the kind of controlthat the users may have over the cloud infrastructure (Figure 3.6).
Applications
Data
Runtime
Middleware
O.S
Virtualization
Servers
Storage
Networking
Packaged
Software
Infrastructure
(as a Service)
Platform
(as a Service)
Software
(as a Service)
Applications
Data
Runtime
Middleware
O.S
Virtualization
Servers
Storage
Networking
Applications
Data
Runtime
Middleware
O.S
Virtualization
Servers
Storage
Networking
Applications
Data
Runtime
Middleware
O.S
Virtualization
Servers
Storage
Networking
The
use
rs m
an
ag
e
Th
e p
rovid
ers
ma
nag
e
Th
e u
se
rs m
ana
ge
Th
e p
rovid
ers
man
ag
e
The
pro
vid
ers
man
age
Th
e u
se
rs
ma
na
ge
Figure 3.6: Cloud service model considering the customers’ viewpoint. Adapted from [243]
In the traditional approach (i.e., non-cloud scenario), the users are responsible formanaging the whole stack (e.g., hardware, software, and data center facilities), which givesthem full control over the infrastructure.
In the infrastructure-as-a-service (IaaS) model, the users request processing power, stor-age, network and other computing resources such as the operating system and pay for whatthey use. The users pay for the use of resources, instead of having to setup them, and deploytheir own software on physical machines, controlling and managing them. The amount ofinstances can be scaled dynamically to fill the users’ need. Examples of IaaS providersare Amazon Elastic Compute Cloud (Amazon EC2)–(aws.amazon.com/ec2), Rackspacecloud (rackspace.com/cloud), GigaSpaces (gigaspaces.com), Microsoft Windows Azure (win-dowsazure.com), and Google Compute Engine (GCE)–(cloud.google.com/compute).
Platform-as-a-service (PaaS) are development platforms that allow the creation ofapplications with supported programming languages and tools hosted in the cloud andaccessed through a browser. This model can slash development time, offering readilyavailable tools and services. PaaS providers offer a higher-level software infrastructure,
46

Chapter 3. A Detailed View of Cloud Computing
where the users can build and deploy particular classes of applications and services usingthe tools and programming languages supported by the PaaS provider. The users have nocontrol over the underlying infrastructure, such as CPU, network, storage or operatingsystem, as it is abstracted away below the platform [243]. Examples of PaaS servicesare Google App Engine (cloud.google.com/appengine), OpenShift (openshift.com), andHeroku (heroku.com).
In the software-as-a-service (SaaS) model, applications run on the cloud infrastructureand are accessible from various client devices. The users of these services do not control theunderlying infrastructure and application platform, i.e., only limited user-configurationsare available. The main architectural difference between the traditional software modeland SaaS model is the number of tenants the applications support. From the user viewpoint,the SaaS model allows him/her to save money in servers and software licenses. Examplesof SaaS are SalesForce (salesforce.com), NetSuite (netsuite.com) and Microsoft Office WebApps (office.com).
3.2.2 Deployment Model
The cloud deployment model can be classified as [24]: private, public, community, andhybrid.
In a private cloud, the cloud infrastructure usage is restricted to a single organization.The infrastructure may be owned and managed by the organization that will use it or bya third party organization. A private cloud can be built using either in-house solution orthird party solutions (e.g., VMware vCloud (vmware.com/products/vcloud-suite)) andopen-source solutions (e.g., OpenStack (openstack.org)).
In public clouds, the cloud infrastructure is available for everyone on the Internet. It isoften managed by public cloud providers, which allow the customers to use the resourcesif they pay for them.
In community clouds, the cloud infrastructure is restricted to some organizations thathave common interests. Unlike the public cloud, in a community cloud the access is limitedto the community members. For example, scientific institutions (e.g., FutureGrid (future-grid.org), WestGrid (westgrid.ca), and Chameleon (chameleoncloud.org) that can create acommunity cloud to collaborate and to share resources.
Finally, in hybrid clouds, the cloud infrastructure is composed by two or more distinctinfrastructures (e.g., private, community, or public cloud). In other words, each cloud canallocate resources owned by different clouds but they are managed by a unique cloud. Forinstance, a private cloud can support a hybrid cloud using, in some situations, resourcesfrom a public cloud [24, 328]. Hybrid clouds are often used for cloud bursting when thefirst-choice infrastructure cannot meet the users demand. Cloud bursting is the processof using another type of cloud (e.g., a public cloud) when workload spikes. It allows anapplication to run in a private infrastructure and to burst into a public cloud in a scenariowith high demand of resources. A hybrid cloud can be also achieved by an application thatruns across multiple clouds or use different cloud services at the same time. Figure 3.7show an example of a hybrid cloud scenario. Hybrid clouds can be seen as a type of cloudfederation, which will be discussed in section 3.2.3.
47
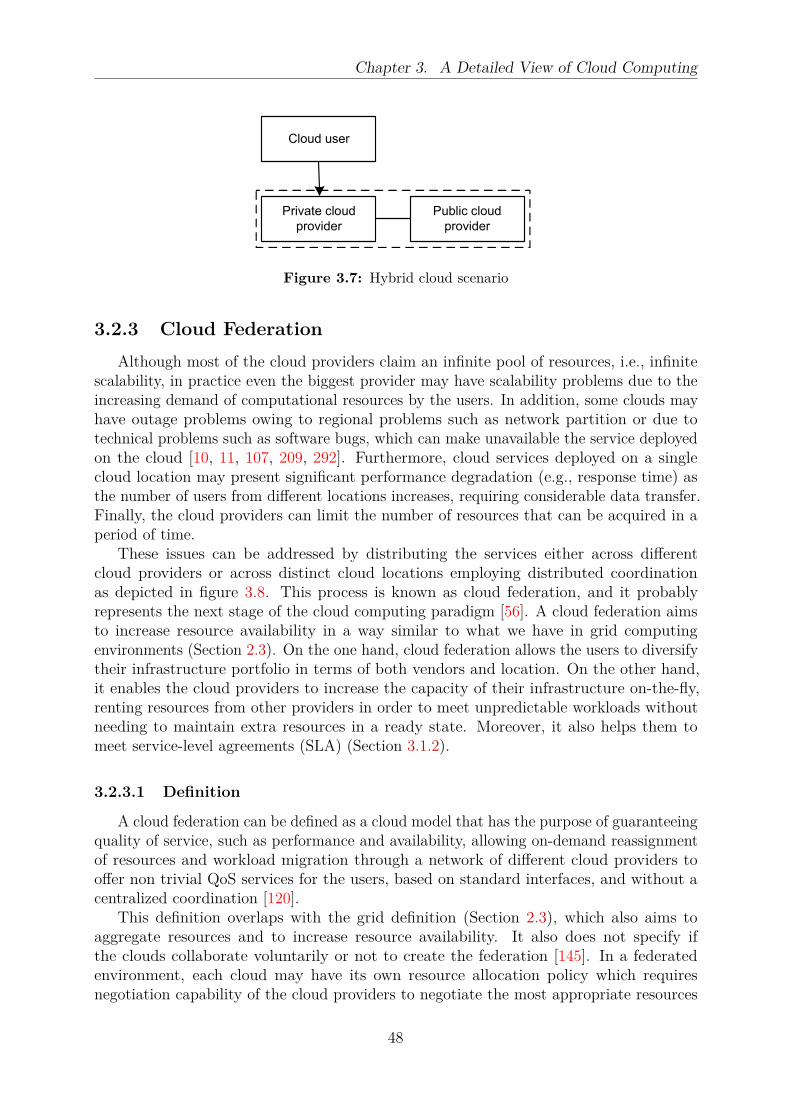
Chapter 3. A Detailed View of Cloud Computing
Cloud user
Private cloud
provider
Public cloud
provider
Figure 3.7: Hybrid cloud scenario
3.2.3 Cloud Federation
Although most of the cloud providers claim an infinite pool of resources, i.e., infinitescalability, in practice even the biggest provider may have scalability problems due to theincreasing demand of computational resources by the users. In addition, some clouds mayhave outage problems owing to regional problems such as network partition or due totechnical problems such as software bugs, which can make unavailable the service deployedon the cloud [10, 11, 107, 209, 292]. Furthermore, cloud services deployed on a singlecloud location may present significant performance degradation (e.g., response time) asthe number of users from different locations increases, requiring considerable data transfer.Finally, the cloud providers can limit the number of resources that can be acquired in aperiod of time.
These issues can be addressed by distributing the services either across differentcloud providers or across distinct cloud locations employing distributed coordinationas depicted in figure 3.8. This process is known as cloud federation, and it probablyrepresents the next stage of the cloud computing paradigm [56]. A cloud federation aimsto increase resource availability in a way similar to what we have in grid computingenvironments (Section 2.3). On the one hand, cloud federation allows the users to diversifytheir infrastructure portfolio in terms of both vendors and location. On the other hand,it enables the cloud providers to increase the capacity of their infrastructure on-the-fly,renting resources from other providers in order to meet unpredictable workloads withoutneeding to maintain extra resources in a ready state. Moreover, it also helps them tomeet service-level agreements (SLA) (Section 3.1.2).
3.2.3.1 Definition
A cloud federation can be defined as a cloud model that has the purpose of guaranteeingquality of service, such as performance and availability, allowing on-demand reassignmentof resources and workload migration through a network of different cloud providers tooffer non trivial QoS services for the users, based on standard interfaces, and without acentralized coordination [120].
This definition overlaps with the grid definition (Section 2.3), which also aims toaggregate resources and to increase resource availability. It also does not specify ifthe clouds collaborate voluntarily or not to create the federation [145]. In a federatedenvironment, each cloud may have its own resource allocation policy which requiresnegotiation capability of the cloud providers to negotiate the most appropriate resources
48

Chapter 3. A Detailed View of Cloud Computing
Cloud federation
Entry point
Cloud federationEntry point
Cloud federation
Entr
y p
oin
t
Entry point
Multi-cloud
Multi-cloud
Figure 3.8: An example of the cloud federation approach [145]
to achieve their goals. These goals are usually described as QoS metrics, such as minimumexecution time, minimum price, availability, minimum power consumption and minimumnetwork latency, among others. This requires coordination and orchestration of resourcesthat belong to more than one cloud, which will be used, for instance, to meet the users’demand. Furthermore, the requirements to achieve a cloud federation are [68, 296]:
automated and efficient deployment: cloud federation should support automatedprovisioning of complex services based on an SLA that specifies the cloud’s infrastruc-ture QoS requirements. This SLA should be reusable to provision multiple instancesof the services for different users and also be flexible to support customizations ac-cording to the user’s need. In practice, this requires automatic discovery mechanismsto look for resources in other clouds, automatic matchmaking process to select thecloud that better fits the requirements, and automatic authentication mechanismsto create a trusted context among the clouds.
dynamic resource allocation: the cloud infrastructure should autonomously adjustthe parameters of each virtual environment (e.g., resources) according to the system’sworkload aligned with the service-level agreement (SLA).
technology and provider independence: the cloud federation should be independent ofboth technology and cloud provider. It should seamlessly execute services across dis-tributed cloud providers considering the characteristics of each execution environmentand also the services’ requirements.
3.2.3.2 Classification
A cloud federation scenario can be classified according to the level of coupling orinter-operations among the clouds [253, 277]. In this context, a federation can be defined
49
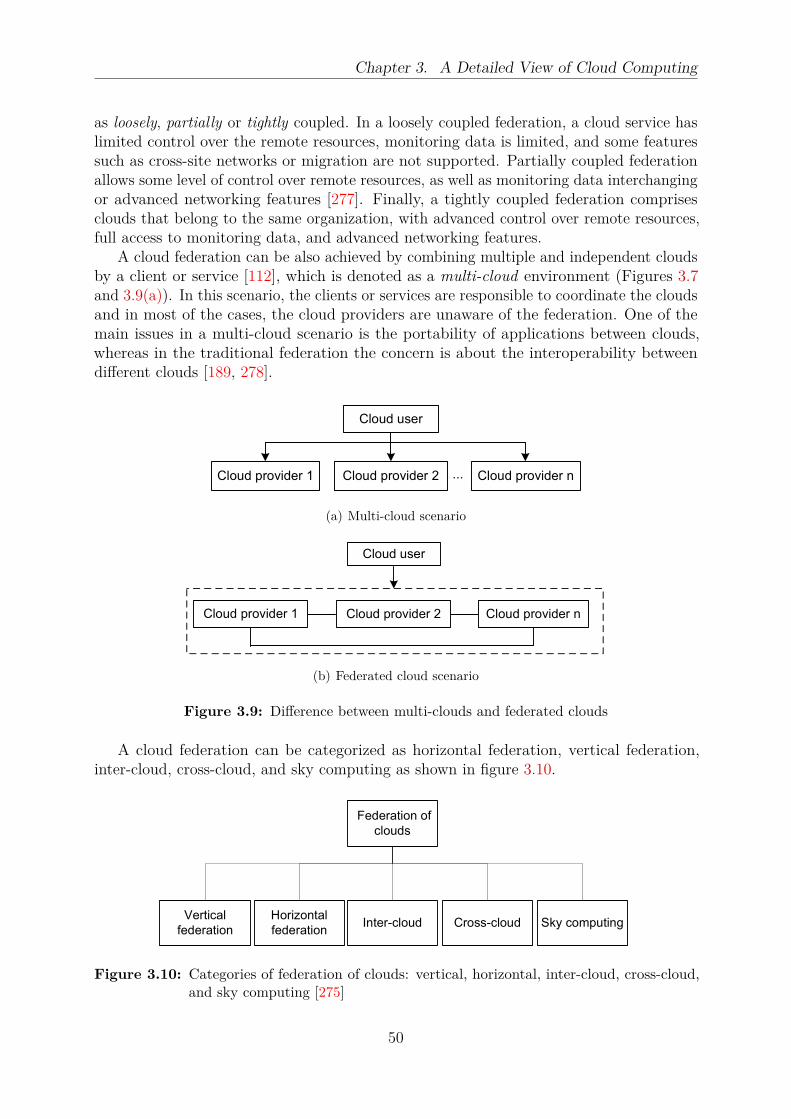
Chapter 3. A Detailed View of Cloud Computing
as loosely, partially or tightly coupled. In a loosely coupled federation, a cloud service haslimited control over the remote resources, monitoring data is limited, and some featuressuch as cross-site networks or migration are not supported. Partially coupled federationallows some level of control over remote resources, as well as monitoring data interchangingor advanced networking features [277]. Finally, a tightly coupled federation comprisesclouds that belong to the same organization, with advanced control over remote resources,full access to monitoring data, and advanced networking features.
A cloud federation can be also achieved by combining multiple and independent cloudsby a client or service [112], which is denoted as a multi-cloud environment (Figures 3.7and 3.9(a)). In this scenario, the clients or services are responsible to coordinate the cloudsand in most of the cases, the cloud providers are unaware of the federation. One of themain issues in a multi-cloud scenario is the portability of applications between clouds,whereas in the traditional federation the concern is about the interoperability betweendifferent clouds [189, 278].
Cloud user
Cloud provider 1 Cloud provider 2 Cloud provider n...
(a) Multi-cloud scenario
Cloud user
Cloud provider 1 Cloud provider 2 Cloud provider n
(b) Federated cloud scenario
Figure 3.9: Difference between multi-clouds and federated clouds
A cloud federation can be categorized as horizontal federation, vertical federation,inter-cloud, cross-cloud, and sky computing as shown in figure 3.10.
Federation of
clouds
Inter-cloud Cross-cloud Sky computingHorizontal
federation
Vertical
federation
Figure 3.10: Categories of federation of clouds: vertical, horizontal, inter-cloud, cross-cloud,and sky computing [275]
50

Chapter 3. A Detailed View of Cloud Computing
A vertical federation occurs when two or more cloud providers join to offer servicesto different layers (e.g., IaaS, PaaS, SaaS) [357], whereas in a horizontal federation, thesecloud providers join to offer services at the same cloud layer [297].
Inter-cloud is the federation of clouds that maintains some characteristics such asaddressing, naming, identity, security policies, presence, messaging, multicast, time domain,and application messaging [41]. In such case, the clouds are unified based on standardprotocols to allow the applications to scale across the clouds. The terms federated cloudsand inter-cloud are usually used interchangeably in the literature. However, there aresome important differences between these terms. First, inter-cloud is based on standardsand open interfaces, while federated clouds use the interfaces provided by the cloudproviders [106]. Second, inter-cloud goes beyond resources and services management frommultiple clouds that comprises a federation or a multi-cloud scenario, as it includes cloudgovernance as well as a cloud broker [277]. Cloud governance can be seen as a set ofdecision making processes, criteria and policies involved in the planning, design, acquisition,deployment, operation and management of cloud computing resources [256]. In this case,federated clouds can be seen as a prerequisite to achieve inter-cloud.
Cross-cloud is characterized by the use of resources owned by an external cloud (i.e., acloud that does not belong to the federation) in a trusted context [69].
Finally, sky computing occurs when multiple clouds are combined to provide newservices which are not provided by each isolated cloud. Moreover, sky providers areconsumers of other clouds [188]. In other words, sky providers are usually data center-less providers. For example, a PaaS provider can deploy its services in a computinginfrastructure offered by an IaaS provider.
Considering the user viewpoint, a cloud federation can be also obtained through athird agent called cloud broker. A cloud broker manages the usage, the performance, andthe relationships between the users and the cloud providers [275].
Figure 3.11 illustrates a horizontal cloud federated scenario. In this scenario, thereare three clouds, where cloud 1 is renting resources from clouds 2 and 3 to increase thecapacity of its infrastructure. In a federation, the resources do not need to move physicallyacross the clouds, but only be logically considered as belonging to another cloud. In otherwords, the resources continue to be physically placed in the origin cloud, but they arelogically considered as resources indeed hosted within the buyer cloud.
3.2.3.3 Challenges
Over the years, the rapid development of cloud computing has pushed to a large marketof cloud services usually operated by different proprietary APIs. This has resulted inheterogeneous service descriptions, data representation, and message level naming conflictsmaking service interoperability (i.e., inter-operation management) and service portabilitya complex task [275].
Service interoperability and service portability between clouds are key requirementsto create a cloud ecosystem and to take full advantage of cloud properties [275]. Serviceinteroperability is the ability of cloud users to use their data and applications acrossmultiple cloud providers with the same management interface, whereas service portabilityis the ability to move their applications from one cloud provider to another regardless oftheir choice as operating system, storage format or even APIs [49, 390].
51
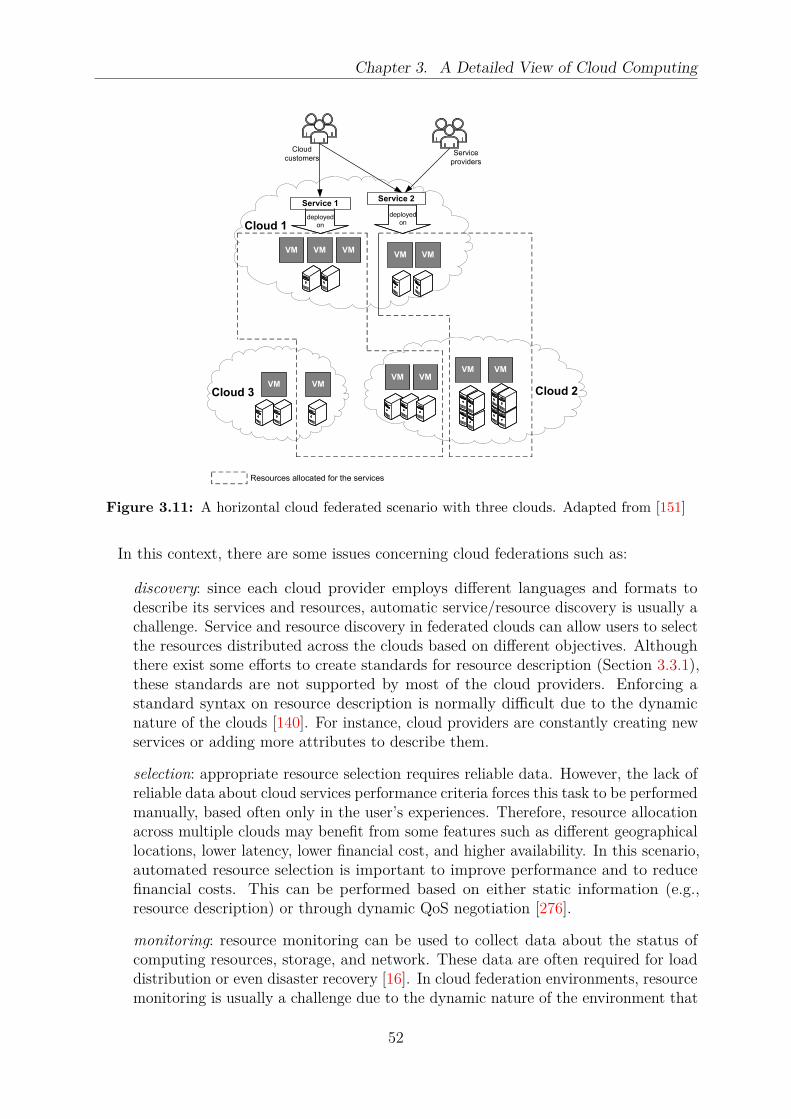
Chapter 3. A Detailed View of Cloud Computing
Cloud 3
Service 1Service 2
VM VM VMVM VM
VMVMVM VM
VM VM
Cloud 2
Cloud 1
Resources allocated for the services
Service
providers
Cloud
customers
deployed
on
deployed
on
Figure 3.11: A horizontal cloud federated scenario with three clouds. Adapted from [151]
In this context, there are some issues concerning cloud federations such as:
discovery: since each cloud provider employs different languages and formats todescribe its services and resources, automatic service/resource discovery is usually achallenge. Service and resource discovery in federated clouds can allow users to selectthe resources distributed across the clouds based on different objectives. Althoughthere exist some efforts to create standards for resource description (Section 3.3.1),these standards are not supported by most of the cloud providers. Enforcing astandard syntax on resource description is normally difficult due to the dynamicnature of the clouds [140]. For instance, cloud providers are constantly creating newservices or adding more attributes to describe them.
selection: appropriate resource selection requires reliable data. However, the lack ofreliable data about cloud services performance criteria forces this task to be performedmanually, based often only in the user’s experiences. Therefore, resource allocationacross multiple clouds may benefit from some features such as different geographicallocations, lower latency, lower financial cost, and higher availability. In this scenario,automated resource selection is important to improve performance and to reducefinancial costs. This can be performed based on either static information (e.g.,resource description) or through dynamic QoS negotiation [276].
monitoring: resource monitoring can be used to collect data about the status ofcomputing resources, storage, and network. These data are often required for loaddistribution or even disaster recovery [16]. In cloud federation environments, resourcemonitoring is usually a challenge due to the dynamic nature of the environment that
52
Chapter 3. A Detailed View of Cloud Computing
can be comprised of heterogeneous infrastructures and resources may reside acrossdifferent clouds. In such case, monitoring systems must collect and aggregate dataprovided by the monitored resources despite of the underlying infrastructure [16].Therefore, most of the monitoring systems such as Ganglia [240], Nagios (nagios.org),and GridICE [13] cannot be used in a cloud federation scenario. Moreover, in acloud federation environment, when virtual resources are migrated from one cloudto another one, monitoring data needs to be collected in the destination. In thiscase, the clouds need to support remote monitoring [81]. Furthermore, monitoringsystems must be designed to work autonomously. In other words, such monitoringsystems must reconfigure themselves when reconfiguration changes (e.g., services orVM migrations, or even resource failure) occur.
3.3 Cloud Standards and Metrics
3.3.1 Cloud Standards
Cloud interoperability requires different standards to work properly at any level of thecloud stack. Nowadays, there exist many organizations working on various standardizationefforts for cloud computing. Some of them are the Open Grid Forum (OGF) — (gridfo-rum.org), the Distributed Management Task Force (DMTF), and the Storage NetworkingIndustry Association (SNIA).
This section highlights some standards for cloud computing and their adoption bycloud providers and libraries. Table 3.1 summarizes the standards discussed in this section.
Open Virtualization Format (OVF) is an open standard of the DMTF. This standarddefines a descriptor for virtual appliance (VA) independent of both virtualization platformand vendor. In this context, a VA is a complete software stack to be run on virtualmachines. In other words, it is the description of the software packages and the requiredhardware configuration [311]. OVF has been designed to enable the deployment andmigration of virtual appliances across different virtualization platforms using a portableformat. In this case, it defines management actions for the whole life cycle of a VA such asdevelopment, package, distribution, deploy, and retirement. An OVF package comprisesan XML file with the description of the VA such as name, hardware constraints, storage,operating system, and network description. This standard is supported by many companiessuch as Amazon, RackSpace, Google, Microsoft, VMWare, Oracle, IBM, and OpenStack.
The Cloud Infrastructure Management Interface (CIMI) is also a standard proposedby the DMTF. It defines a protocol and a model to govern the interactions betweenan infrastructure-as-a-service (IaaS) provider and a cloud user. Its model comprises adescription of the resources available in an IaaS such as virtual machines, storages, andnetworks to enable the portability between clouds that support this standard, whereas itsprotocols defines a RESTful API based on both XML and JavaScript Object Notation(JSON) renderings [94].
The Cloud Data Management Interface (CDMI) (cdmi.sniacloud.com) is a standardproposed by SNIA. This standard defines a RESTful interface for storage management,which is not bound to clouds. It aims to promote data portability among storage providers.In this case, it specifies functions that (i) allow users to discover the capabilities in a data
53

Chapter 3. A Detailed View of Cloud Computing
service offering; (ii) manage containers (e.g., a directory within a file system) and data thatare placed in them; and (iii) associate metadata for containers and objects. In addition,CDMI offers a set of protocols that enable the users to perform other storage operationssuch as monitoring, billing, and access management independent of provider. The mainfeature of CDMI is that it allows users to understand the capabilities of the underlyingstorage and data services through a homogeneous interface. Moreover, many storagecompanies such as NetApp and EMC2 are compliant with this standard.
Open Cloud Computing Interface (OCCI) was proposed by OGF to create a remotemanagement API for IaaS-based services. Later, it has evolved to support all the cloudservice models (Section 3.2.1). OCCI aims to guarantee interoperability among multiplecloud providers. In such context, cloud providers should work together without dataschema or format translation between their APIs. In other words, the OCCI API actsas a service front-end for controlling cloud resources [390]. OCCI is compatible withother cloud standards such as OVF and CDMI. Moreover, it also works as an integrationpoint for standardization among various working groups and organizations [344]. Actually,the OCCI specification consists of three documents, namely OCCI core, OCCI Renderings,and OCCI Extensions. The OCCI core defines the instance type of the OCCI model.Basically, it provides an abstraction of cloud resources. The OCCI Rendering, on the otherhand, defines how the OCCI core model is rendered over the HTTP protocol to lead to aRESTful API. Finally, the OCCI Extensions define some OCCI infrastructure extensionsfor IaaS domain.
Furthermore, many libraries implement the OCCI model such as ApacheCloudStack (cloudstack.apache.org), OpenNebula [248], CompatibleOne [378], andjclouds (jclouds.apache.org).
Table 3.1: A summary of some cloud standards
Standard Group Focus Key operations
OVF DMTF Standard description of virtual appli-ances
Develop, package, distribution, deploy,and retirement
CIMI DMTF Portability and resource managementin the IaaS domain (RESTful API)
Resource management
CDMI SNIA Data portability Common file system operations (i.e.,read, write), backup, replication, andbilling
OCCI OGF Service interoperability (REST-ful API)
Deployment, monitoring, and auto-scaling
3.3.2 Cloud Metrics
The growing interest in cloud computing has demanded metrics to support the userson selecting a service considering different criteria. Cloud metrics is also required since theproviders often focus on resource availability without performance guarantees [20, 170, 257],which makes difficult for users to select the appropriate cloud. This is mostly owing to thecloud architecture that is based on a co-location model designed to minimize the costs forproviders [392]. In this scenario, cloud evaluation must rely on different characteristics
54

Chapter 3. A Detailed View of Cloud Computing
such as bandwidth, throughput, latency, computing and storage capacities as well as onresource availability and efficiency. Different works [137, 203, 206, 224, 237, 318] have beenproposed to evaluate a cloud service. Based on these works, this subsection presents somemetrics to evaluate IaaS services. Table 3.2 shows the metrics discussed in this section,which are classified as general or specific metrics. General metrics are metrics that can beused to evaluate any cloud service and/or resource, whereas specific metrics are metricsbound to a specific cloud service and/or resource.
In table 3.2, the instance sustainable performance (ISP) metric measures the effectiveaverage performance of an instance (i.e.,VM) to execute a particular application [205];and it is computed as the geometric mean of the Flop rate of an application. The instancecapability (IC), on the other hand, represents the sustained performance of the instanceintegrated over a time period. This metric can be also used to assess the price performanceof the instance dividing it by the cost of the instance. In other words, this metric can helpto determine the instance that delivers the best value out of all the available instances.
3.4 IaaS Cloud Computing Systems
This section describes the architecture of an IaaS cloud. First, its components arediscussed. Then, the steps to use a service offered by this architecture are presented.Finally, some IaaS architectures are presented and compared.
3.4.1 Architecture
IaaS clouds comprise a set of physical resources offering virtualized resources for theusers on-demand in nearly real-time. In this context, the users are responsible to requestthe virtual resources (e.g., virtual machines) and to manage them, whereas the providersare responsible (a) to select a physical resource to host the virtual machines; (b) tocreate/instantiate the virtual machines; (c) to monitor the hosts (i.e., physical machines)to guarantee their availability, and (d) to charge for their usage.
A generic IaaS cloud architecture (Figure 3.12) relies on a virtualization layer (Sec-tion 3.1.1).
Above the virtualization layer, there is a virtual infrastructure (VI) manager. The VImanager creates the virtual resources (e.g., virtual machines, storage) aggregating a pool ofphysical resources often regardless of the underlying virtualization layer. In addition, it canimplement more advanced functions such as automatic load balancing, server consolidation,and dynamic infrastructure resizing and partitioning [328]. In general, VI managers canbe grouped into two categories [328]: cloud toolkit and non-cloud toolkit. Cloud toolkitsexpose a remote interface to create, to monitor, and to control the virtualized resources, butthey lack some management functions such as server consolidation. The non-cloud toolkits,on the other hand, provide advanced features such as automatic load balancing and serverconsolidation without exposing remote cloud-like interfaces. Examples of VI managersinclude Eucalyptus [263], Nimbus [186], OpenNebula [248], and OpenStack (openstack.org).
The services are built on top of the virtual infrastructure (VI) manager, and organizedwithin the service layer. The services include virtual machines, storage, networking,and virtual machine images (VMI).
55
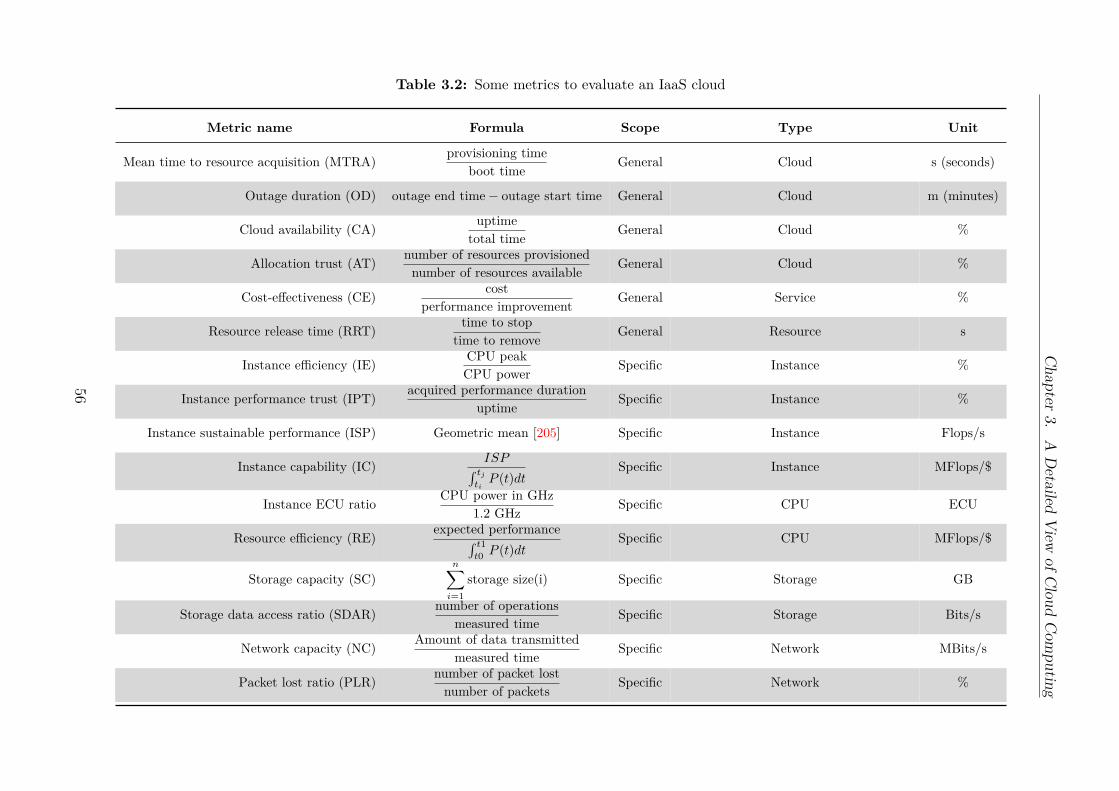
Chapter
3.
AD
etailed
View
of
Clo
ud
Com
putin
gTable 3.2: Some metrics to evaluate an IaaS cloud
Metric name Formula Scope Type Unit
Mean time to resource acquisition (MTRA)provisioning time
boot timeGeneral Cloud s (seconds)
Outage duration (OD) outage end time − outage start time General Cloud m (minutes)
Cloud availability (CA)uptime
total timeGeneral Cloud %
Allocation trust (AT)number of resources provisioned
number of resources availableGeneral Cloud %
Cost-effectiveness (CE)cost
performance improvementGeneral Service %
Resource release time (RRT)time to stop
time to removeGeneral Resource s
Instance efficiency (IE)CPU peakCPU power
Specific Instance %
Instance performance trust (IPT)acquired performance duration
uptimeSpecific Instance %
Instance sustainable performance (ISP) Geometric mean [205] Specific Instance Flops/s
Instance capability (IC)ISP
∫ tj
tiP (t)dt
Specific Instance MFlops/$
Instance ECU ratioCPU power in GHz
1.2 GHzSpecific CPU ECU
Resource efficiency (RE)expected performance
∫ t1
t0P (t)dt
Specific CPU MFlops/$
Storage capacity (SC)n∑
i=1
storage size(i) Specific Storage GB
Storage data access ratio (SDAR)number of operations
measured timeSpecific Storage Bits/s
Network capacity (NC)Amount of data transmitted
measured timeSpecific Network MBits/s
Packet lost ratio (PLR)number of packet lost
number of packetsSpecific Network %
56
Chapter 3. A Detailed View of Cloud Computing
Computing services are provided as virtual machines (VM) instances. A virtual machinebelongs to an instance type that determines its hardware capacity such as the number ofCPU cores (i.e., vCPUs), the amount of RAM memory, the disks’ constraints, and thenetwork capacity. In addition, instance types are divided into different family types orclasses defined according to their purpose usage such as memory-, CPU-, or I/O-optimized,among others. For instance, at the time of writing this thesis, Amazon EC2 offers sevenfamily types (general purpose, standard, compute optimized, memory optimized, GPU,storage optimized, and HS1)1 and Google Compute Engine offers four family types (smallor shared-core, standard, high CPU, high memory)2.
Storage is provided as regular disks for the virtual machines and it can be (Figure 3.13):instance disk, network disk, or object storage. Instance disks (Figure 3.13(a)) are ephemeraldisks physically attached to the host computer of a virtual machine. Network disks or blockstorages (Figure 3.13(b)) are persistent disks that can be attached to a running virtualmachine that is in the same data center (i.e., availability zone). Object storages (Fig-ure 3.13(c)), on the other hand, are external storage services that can be mounted in arunning virtual machine. Moreover, storages belong to a storage type that determines theirperformance and constraints. An example of a storage type is the solid-state disk (SSD).Finally, storage is often billed per size in a period of time, and some may have additioncharges such as the number of transactions or provisioned input/output operations persecond (IOPS).
Networking services provide network connectivity between the virtual resources andother networks (e.g., Internet); and their costs are usually defined in function of theamount of data transfered between the networks.
Virtual machine images (VMI) are provided as persistent disks that contain an operatingsystem and a root file system required to start a virtual machine. They can be configuredto run on a specific hypervisor (i.e., virtualization technique (Section 3.1.1.2)), and theirprice often depends on the operating system. Moreover, the providers allow the users to:(i) upload their own images to the cloud; (ii) create a new one based on one of their virtualmachines (VMs), i.e., to take a snapshot of a VM; or (iii) export an image. In this case,the users are usually billed per transaction (i.e., import/export, snapshot) and per theamount of storage used to store a snapshot and/or a VMI.
The client layer comprises the applications and the APIs available to access theservices. In most of the cases, the users have to create their own applications to access theservices through the application programming interfaces (APIs) provided by the clouds.
3.4.2 Using an IaaS Cloud Service
The steps to use an IaaS cloud service are: (1) choose a region to host the resources;(2) select an instance type; (3) select a VMI; (4) select a disk type; (5) request the providerto create the VM; (6) configure and monitor the VM; (7) execute the application; and(8) transfer the data from the cloud to the users local machine.
1. selecting a region: a region is an independent cloud environment deployed in ageographic location in order to increase availability, i.e., to meet users’ SLAs and
1aws.amazon.com/ec2/instance-types2cloud.google.com/compute/docs/machine-types
57

Chapter 3. A Detailed View of Cloud Computing
Cloud users
Virtualization
Virtual Infrastructure Manager
Hardware
Virtual
machinesDisks Networking
Virtual
machine
images
IaaS resources
Client
Figure 3.12: A generic IaaS architecture
VM1 VM2 VM3
Host computer 1 Host computer 2
Data center 1 (availability zone)
Cloud 1
(a) Instance disks
Host computer 1
VM1 VM2VM3
Host computer 2
Data center 1 (availability zone) Data center 2 (availability zone)
Connected
Cloud 1
(b) Network disks
VM3
Host computer 1
Data center 1 (availability zone)
Storage
service
Connected
Cloud 1
Cloud 2
(c) Object storages
Figure 3.13: Storage types usually available in IaaS clouds
58

Chapter 3. A Detailed View of Cloud Computing
to decrease network latency. A region may have multiple availability zones, or forshort, zone. Availability zones are distinct data centers engineered to be decoupledfrom failures in other zones; and to have high-network bandwidth and low-latencynetwork connections to other zones in the same region. The selection of a regiondepends on the resources needed by the users and on the cost they want to payfor, i.e., the users’ requirements. If a region has more than one data center (i.e.,availability zone), the users may select one or they may delegate this task for thecloud provider.
2. selecting an instance type: in this step, the users must select an instance typebased on the requirements of their computing environment, such as the minimumnumber of CPU cores and the minimum amount of memory; and on the characteristicsof their applications (e.g., CPU- or memory-bound). Usually, there are severalinstance types that meet the users constraints, and the users usually select one in anad-hoc way, which can lead to a high cost due to the mismatch between the instancepurpose usage and the application behavior.
3. selecting a virtual machine image (VMI): after choosing the instance type,a virtual machine image must be selected. This selection depends on the operatingsystem and in some cases, on the instance type. An instance type can restrict theusage of the images due to the hypervisor or virtualization technique required bythe instance.
4. selecting a disk type: as we said in the previous section, each disk type impliesdifferent performance, costs, and constraints. The selection of a disk type dependson the characteristics of the applications or on some I/O requirements. As in theselection of an instance type, this process is realized manually by the users.
5. requesting a VM: after choosing the region, the instance type, the VMI, and thedisk type, the users request the provider to create the VM. Then, the provider createsthe requested VM through its virtual infrastructure (VI) manager (Figure 3.12).Normally the steps to create a VM are: (a) select a physical machine to host the VM;(b) create the disks to the new VM; (c) copy the virtual machine image (VMI) tothe select host; (d) request the hypervisor (virtualization layer) to start the virtualmachine; (e) contextualize the VM [187]; i.e., assigns an IP address, imports theaccess keys, among other configurations; (f) test the state of the VM; and (g) startto charge for its usage.
6. configuring the VM: in this step, the users connect and install their applicationsand libraries in the virtual machine, as well as transfer all data from their localmachine to the cloud.
7. executing the applications: the users execute their applications and wait themto finish. During this execution, the users must monitor both the virtual machineand the application execution.
8. releasing the VM: in this step, the users transfer the output of the applicationsto their local machine and terminate the virtual machine.
59

Chapter 3. A Detailed View of Cloud Computing
If the users want to deploy their application in more than one VM, they should restartfrom the second step.
3.5 Cloud Computing Architectures
Over the years, many cloud computing systems have been proposed to manage and tocreate an IaaS cloud. This section presents some of these systems that aim to manage acloud. They are organized as centralized or decentralized systems.
3.5.1 Centralized Systems
In this section, we present ten centralized cloud architectures that are in the samedomain of this doctoral thesis. The architectures are considered centralized as the decisionsto access the resources rely on a single node. Other centralized cloud architectures can befound in [18, 128, 147, 180, 238, 280].
3.5.1.1 Claudia
Claudia [299] is a software layer that provides homogeneous interface for cloud servicemanagement (Figure 3.14). For service management, Claudia uses an extension of the OVFstandard (Section 3.3.1), called service descriptor file, to allow the providers to describetheir services independent of technology or API, and to specify the dependencies betweenthe services.
Claudia implements auto-scaling services based on scalability rules defined by theproviders for each service in the descriptor file. Such rules define the conditions and theactions to be executed by the system. A condition can be defined basing on user-definedmetrics or on hardware metrics. In this case, scalability rules encompass scaling resourcesup/down in the same cloud provider as well as scaling in/out the number of resourcesacross multiple clouds.
Claudia uses OpenNebula [248] to manage the underlying infrastructure and to accessmultiple clouds. In other words, the cloud interoperability is achieved through the useof OpenNebula. In this case, the architecture is deployed in a single node (i.e., themaster node) that is responsible for managing the clouds through the cloud infrastructuremanager (i.e., VI manager).
Experimental results show that Claudia could scale the jobs of a Sun Grid Engine(SGE) queue according to the scalability rules described in the descriptor file.
3.5.1.2 SciCumulus
SciCumulus [95] is a middleware to automate the execution of workflows on the cloudfollowing the many task computing (MTC) paradigm. It explores parameter sweep anddata fragmentation parallelism in workflows. In such case, SciCumulus aims to exploreworkflow parallelism in the cloud focusing on implementing provenance services, to freethe users to deal with the complexity of collecting distributed provenance data [95].
60

Chapter 3. A Detailed View of Cloud Computing
Figure 3.14: Claudia architecture [299]
The architecture of SciCumulus is organized in three layers: desktop, distribution, andexecution layer, which are placed between a workflow management system (WfMS) andthe cloud infrastructure (Figure 3.15). The desktop layer uses the WfMS to start theexecution of the workflow’s activities (steps 1 and 2). The distribution layer manages theexecution of cloud activities by recognizing the tasks that compose the workflow and usinga global schema to schedule them in the cloud (?? – steps 3.1, 3.2, 4, 5, and 6). A cloudactivity is a container with the application to execute, its execution strategy, its parametervalues, and its input data. For each assigned instance pair (instance, cloud activity), theexecution layer configures and executes the application (?? – steps 8.1, 8.2, 9, 10, and 11).
SciCumulus was validated using the CloudSim [58] simulator to evaluate the executiontime of a workflow when fragmented in 100 and 128 cloud activities. For the workflowanalyzed, the results show performance gains when the number of cloud activities is at most100, otherwise the performance degrades due to the overhead of managing the activities.
3.5.1.3 Cloud-TM
Cloud-TM [300] is a cloud architecture to build and to execute applications basedon distributed transaction memory (DTM). It aims to combine the transactional mem-ory (TM) approach with the scalability and failure resilience of redundant large-scaleinfrastructures.
Its architecture comprises two components: data platform and autonomic manager (Fig-ure 3.16). Data platform exposes an API for manipulating data across distributedservers, and it implements the distributed software transaction memory (DSTM) services.The DSTM is based on Infinispan (infinispan.org). Infinispan implements automatic datapartitioning across multiple nodes, enabling continuous data availability and transactionalintegrity even in the presence of failures. The autonomic manager, on the other hand, isresponsible for scaling the data platform and for implementing self-optimizing strategiesto reconfigure the data grid. In such case, there is a monitoring component that gathersdata about the resources and sends them to a workload analyzer. Then, the workloadanalyzer filters the data, generates a workload profile, and notifies the adaptation manager.
61
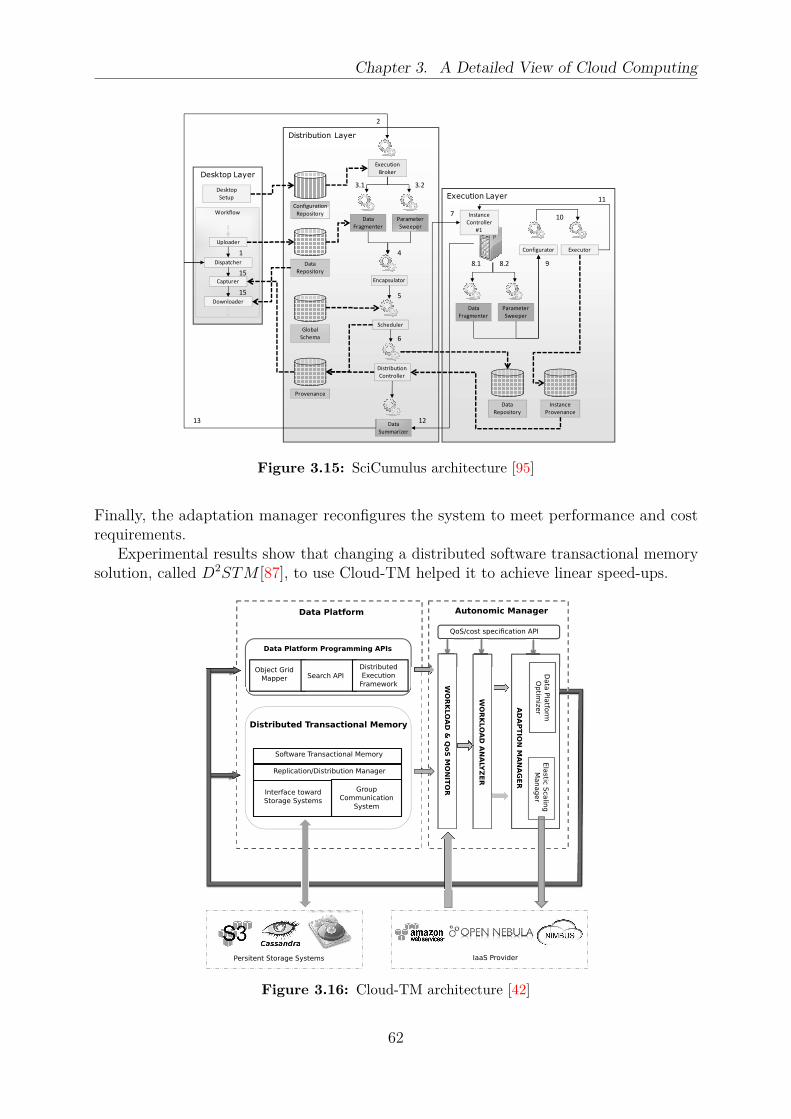
Chapter 3. A Detailed View of Cloud Computing
!"#$ %&#
'(#
)*(#
'+* $,#
* #
'#+ *-# *
./# #-##*#
' %0/# #
-$,#(#
!$*+
'+ 1 #
' %-//2#
!"#$
3+ $#% #45
%6#*+ 7
' %6#*+ 7
81-$,#/
.9#$#
3+ $#.9#$#
' %6#*+ 7
5
:
;<5 ;<:
=
>
?
@
A<5
5B
55
5:5;
5>
5>
./# #-##*#
' %0/# #
A<: C
Figure 3.15: SciCumulus architecture [95]
Finally, the adaptation manager reconfigures the system to meet performance and costrequirements.
Experimental results show that changing a distributed software transactional memorysolution, called D2STM [87], to use Cloud-TM helped it to achieve linear speed-ups.
Object GridMapper
" ) "#"##$ $$" ,#$ # IaaS ProvidersPersistent Storage Systems
Data Platform Programming APIs
Data Platform
Object GridMapper Search API
DistributedExecutionFramework
Distributed Transactional Memory
Software Transactional Memory
Replication/Distribution Manager
Interface towardStorage Systems
GroupCommunication
System
WORKLO
AD&QoS
MONITO
R
WORKLO
ADANALYZER
ADAPTIO
NMANAGER
DataPlatform
Optimizer
ElasticScaling
Manager
QoS/cost specification API
Autonomic Manager
Persitent Storage Systems IaaS Provider
Figure 3.16: Cloud-TM architecture [42]
62
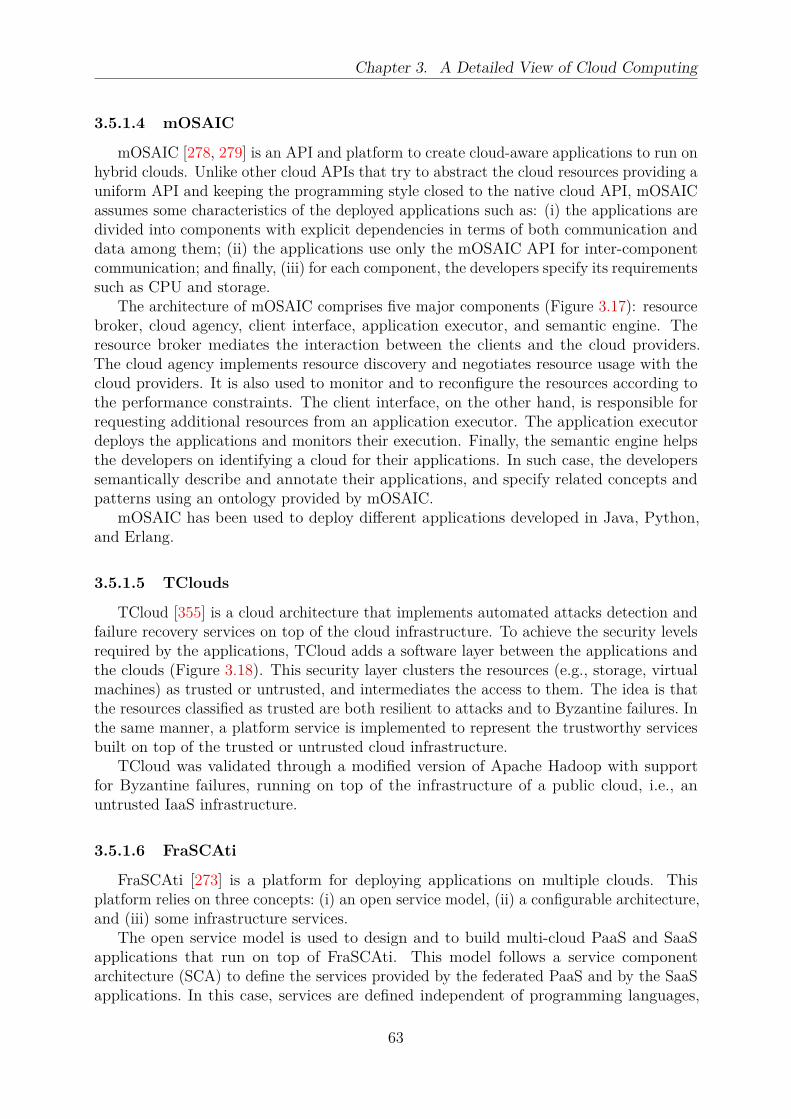
Chapter 3. A Detailed View of Cloud Computing
3.5.1.4 mOSAIC
mOSAIC [278, 279] is an API and platform to create cloud-aware applications to run onhybrid clouds. Unlike other cloud APIs that try to abstract the cloud resources providing auniform API and keeping the programming style closed to the native cloud API, mOSAICassumes some characteristics of the deployed applications such as: (i) the applications aredivided into components with explicit dependencies in terms of both communication anddata among them; (ii) the applications use only the mOSAIC API for inter-componentcommunication; and finally, (iii) for each component, the developers specify its requirementssuch as CPU and storage.
The architecture of mOSAIC comprises five major components (Figure 3.17): resourcebroker, cloud agency, client interface, application executor, and semantic engine. Theresource broker mediates the interaction between the clients and the cloud providers.The cloud agency implements resource discovery and negotiates resource usage with thecloud providers. It is also used to monitor and to reconfigure the resources according tothe performance constraints. The client interface, on the other hand, is responsible forrequesting additional resources from an application executor. The application executordeploys the applications and monitors their execution. Finally, the semantic engine helpsthe developers on identifying a cloud for their applications. In such case, the developerssemantically describe and annotate their applications, and specify related concepts andpatterns using an ontology provided by mOSAIC.
mOSAIC has been used to deploy different applications developed in Java, Python,and Erlang.
3.5.1.5 TClouds
TCloud [355] is a cloud architecture that implements automated attacks detection andfailure recovery services on top of the cloud infrastructure. To achieve the security levelsrequired by the applications, TCloud adds a software layer between the applications andthe clouds (Figure 3.18). This security layer clusters the resources (e.g., storage, virtualmachines) as trusted or untrusted, and intermediates the access to them. The idea is thatthe resources classified as trusted are both resilient to attacks and to Byzantine failures. Inthe same manner, a platform service is implemented to represent the trustworthy servicesbuilt on top of the trusted or untrusted cloud infrastructure.
TCloud was validated through a modified version of Apache Hadoop with supportfor Byzantine failures, running on top of the infrastructure of a public cloud, i.e., anuntrusted IaaS infrastructure.
3.5.1.6 FraSCAti
FraSCAti [273] is a platform for deploying applications on multiple clouds. Thisplatform relies on three concepts: (i) an open service model, (ii) a configurable architecture,and (iii) some infrastructure services.
The open service model is used to design and to build multi-cloud PaaS and SaaSapplications that run on top of FraSCAti. This model follows a service componentarchitecture (SCA) to define the services provided by the federated PaaS and by the SaaSapplications. In this case, services are defined independent of programming languages,
63
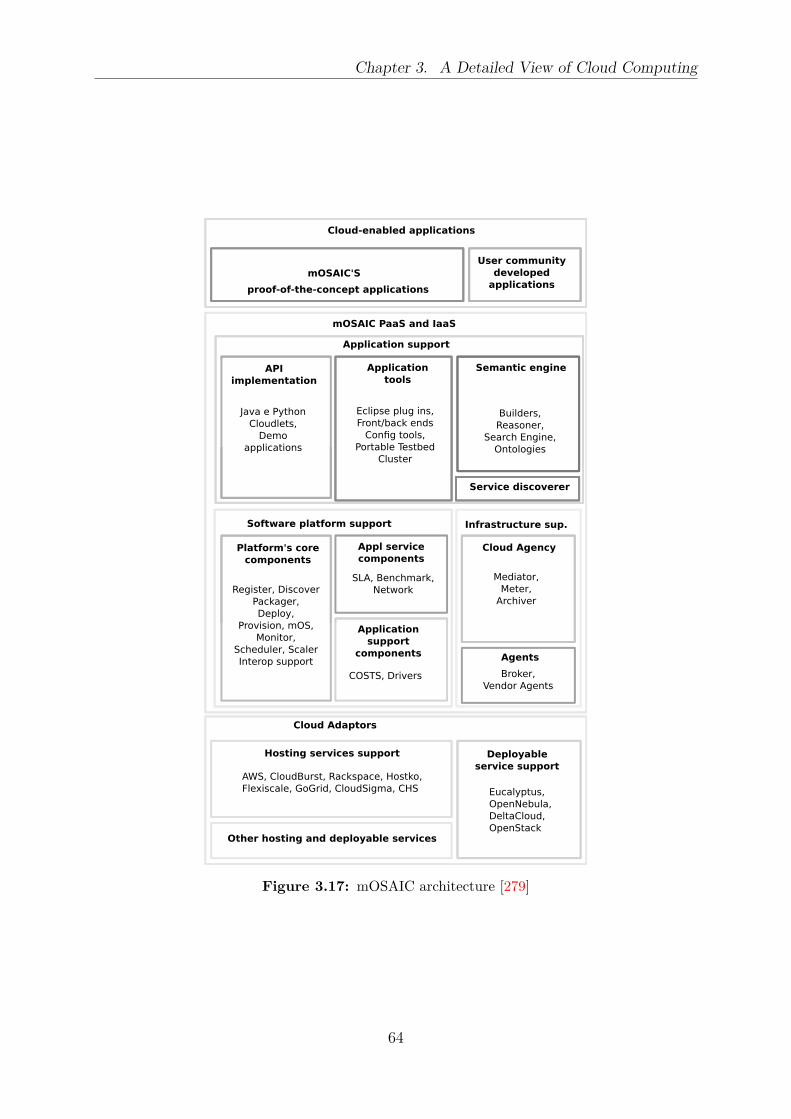
Chapter 3. A Detailed View of Cloud Computing
mOSAIC'Sproof-of-the-concept applications
User communitydeveloped
applications
Cloud-enabled applications
mOSAIC PaaS and IaaS
Application support
APIimplementation
Applicationtools
Semantic engine
Java e PythonCloudlets,
Demo applications
Eclipse plug ins,Front/back ends
Config tools,Portable Testbed
Cluster
Builders,Reasoner,
Search Engine,Ontologies
Service discoverer
Software platform support Infrastructure sup.
Platform's corecomponents
Appl servicecomponents
Cloud Agency
Cloud Adaptors
Deployableservice support
Hosting services support
Other hosting and deployable services
Applicationsupport
components Agents
AWS, CloudBurst, Rackspace, Hostko,Flexiscale, GoGrid, CloudSigma, CHS Eucalyptus,
OpenNebula,DeltaCloud,OpenStack
Broker,Vendor Agents
SLA, Benchmark,NetworkRegister, Discover
Packager,Deploy,
Provision, mOS,Monitor,
Scheduler, ScalerInterop support
COSTS, Drivers
Mediator,Meter,
Archiver
Figure 3.17: mOSAIC architecture [279]
64
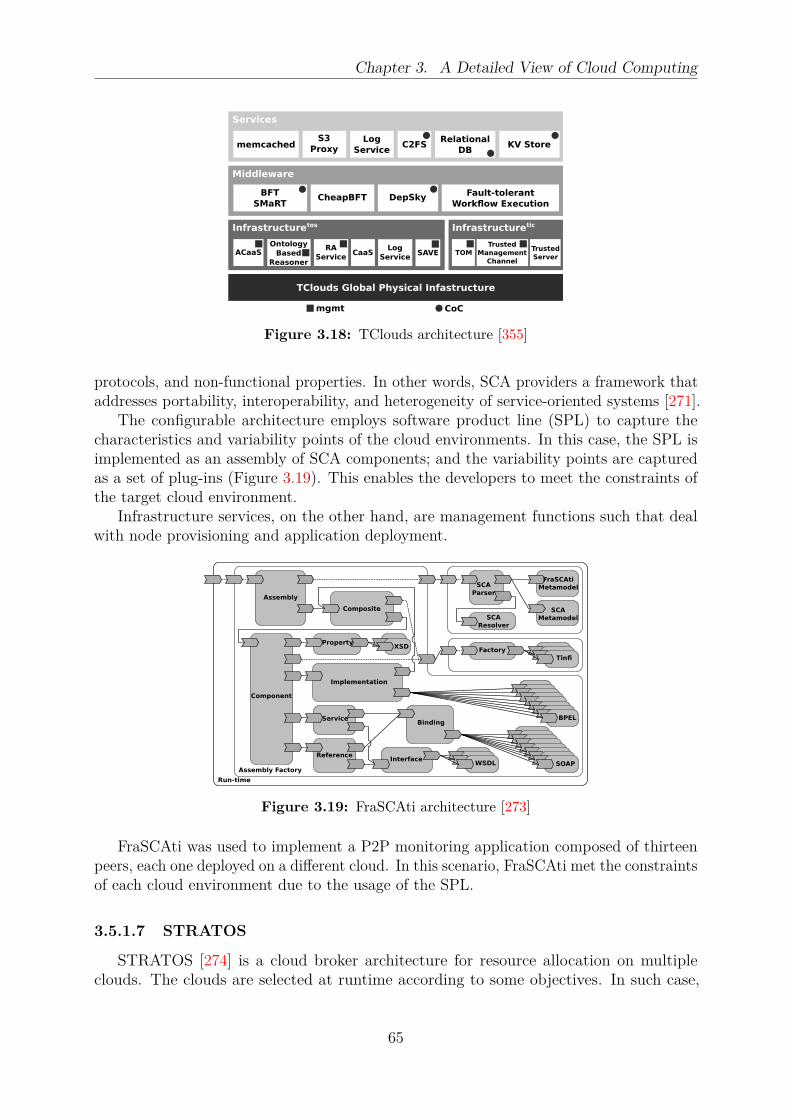
Chapter 3. A Detailed View of Cloud Computing
TClouds Global Physical Infastructure
Infrastructuretos
ACaaSOntologyBased
ReasonerRA
Service CaaS
MiddlewareBFT
SMaRT CheapBFT DepSky Fault-tolerantWorkflow Execution
Services
memcached S3Proxy
LogService C2FS Relational
DB KV Store
Infrastructuretic
TOMTrusted
ManagementChannel
TrustedServer
LogService
mgmt CoC
SAVE
Figure 3.18: TClouds architecture [355]
protocols, and non-functional properties. In other words, SCA providers a framework thataddresses portability, interoperability, and heterogeneity of service-oriented systems [271].
The configurable architecture employs software product line (SPL) to capture thecharacteristics and variability points of the cloud environments. In this case, the SPL isimplemented as an assembly of SCA components; and the variability points are capturedas a set of plug-ins (Figure 3.19). This enables the developers to meet the constraints ofthe target cloud environment.
Infrastructure services, on the other hand, are management functions such that dealwith node provisioning and application deployment.
? 74@? 74@
753&#A753&#A753&#A
B6C@753&#A753&#A753&#A
D&#ED&#E
753&#A753&#A753&#A
B6C@753&#A753&#A753&#A
AssemblyComposite
Property
Component
Implementation
Service
Reference Interface WSDL
Binding
SCAParser
FraSCAtiMetamodel
SCAMetamodel
TinfiFactory
SCAResolver
BPEL
SOAP
XSD
Assembly FactoryRun-time
Figure 3.19: FraSCAti architecture [273]
FraSCAti was used to implement a P2P monitoring application composed of thirteenpeers, each one deployed on a different cloud. In this scenario, FraSCAti met the constraintsof each cloud environment due to the usage of the SPL.
3.5.1.7 STRATOS
STRATOS [274] is a cloud broker architecture for resource allocation on multipleclouds. The clouds are selected at runtime according to some objectives. In such case,
65
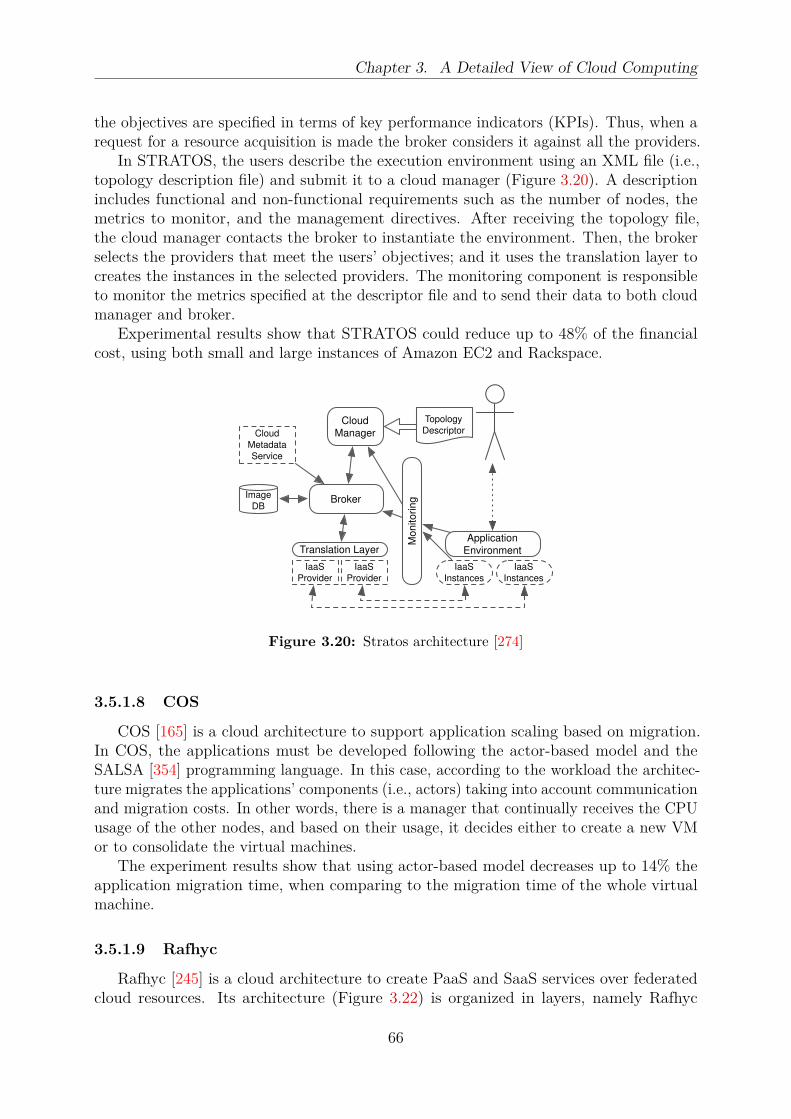
Chapter 3. A Detailed View of Cloud Computing
the objectives are specified in terms of key performance indicators (KPIs). Thus, when arequest for a resource acquisition is made the broker considers it against all the providers.
In STRATOS, the users describe the execution environment using an XML file (i.e.,topology description file) and submit it to a cloud manager (Figure 3.20). A descriptionincludes functional and non-functional requirements such as the number of nodes, themetrics to monitor, and the management directives. After receiving the topology file,the cloud manager contacts the broker to instantiate the environment. Then, the brokerselects the providers that meet the users’ objectives; and it uses the translation layer tocreates the instances in the selected providers. The monitoring component is responsibleto monitor the metrics specified at the descriptor file and to send their data to both cloudmanager and broker.
Experimental results show that STRATOS could reduce up to 48% of the financialcost, using both small and large instances of Amazon EC2 and Rackspace.
Cloud
Metadata
Service
Topology
Descriptor
IaaS
Provider
IaaS
Provider
Translation Layer
BrokerImage
DB
Cloud
Manager
Mo
nito
rin
g
IaaS
Instances
IaaS
Instances
Application
Environment
Figure 3.20: Stratos architecture [274]
3.5.1.8 COS
COS [165] is a cloud architecture to support application scaling based on migration.In COS, the applications must be developed following the actor-based model and theSALSA [354] programming language. In this case, according to the workload the architec-ture migrates the applications’ components (i.e., actors) taking into account communicationand migration costs. In other words, there is a manager that continually receives the CPUusage of the other nodes, and based on their usage, it decides either to create a new VMor to consolidate the virtual machines.
The experiment results show that using actor-based model decreases up to 14% theapplication migration time, when comparing to the migration time of the whole virtualmachine.
3.5.1.9 Rafhyc
Rafhyc [245] is a cloud architecture to create PaaS and SaaS services over federatedcloud resources. Its architecture (Figure 3.22) is organized in layers, namely Rafhyc
66

Chapter 3. A Detailed View of Cloud Computing
Physical Node #1
VMMonitor
IOS Agent
SALSA Runtime
Node Manager Node Manager
SALSA Runtime
IOs Agent
ActorsActors
Domain-UDomain-U
Domain-0 Domain-0Physical Node #2
1. Notifyhigh/low
CPUutilization
2. Pass theevent to COS
Manager COS Manager
4. Request VMcreation/ termination
5. Create/Terminate
VM6.
(Dis)connectLoad
Balancers
3. Determine ifrequesting VM
creation / termination
VMMonitor... ... ...
Autonomous Load Balancing
Figure 3.21: COS architecture [165]
Resilient Layer and Rafhyc Services Layer. The Rafhyc Resilient Layer provides servicesfor executing the applications in the cloud. The Rafhyc Services Layer provides the servicesto access and to manage the infrastructure. Moreover, Rafhyc has a configuration managerresponsible for monitoring the resources and the workload of the virtual machines. Inpractice, the configuration manager continuously executes a benchmark in the virtualmachines to compute the efficiency and reliability of the clouds.
The experiments realized in a federated environment show that Rafhyc can managethe execution of applications in a dynamic and heterogeneous environment. In this case,the experiments focused on analyzing performance variabilities between the clouds.
Science gateways, pilot factories, job factories
science workflows, scientific applications
Rafhyc Resilient Layer
Rafhyc VM
Interface
Rafhyc Configuration
Interface
Rafhyc
Multi-Cloud Layer
Rafhyc Federated
Hybrid Cloud
Services Layer
Specific cloud manager
REST APIs
Specific web
services APIs
Federated
Cloud
Services
Private
Cloud
Public
Cloud
Ra
fhy
c L
ay
er
Figure 3.22: Rafhyc architecture [245]
67

Chapter 3. A Detailed View of Cloud Computing
3.5.1.10 JSTaaS
JSTaaS [218] is a framework for enabling cloud bursting. Using an annotative strategy,the developers can create multi-cloud solutions, executing their applications across multipleclouds. In this case, JSTaaS (Figure 3.23) reads the annotations in the source code andgenerates a new code with the instructions to create the virtual machines and to monitorthe applications. It implements cloud bursting, intercepting every method invocation atruntime, and deciding in which node the method must be executed. In case of remoteexecution, the framework uses a queue to schedule the execution of the method in anothernode.
An experiment in a hybrid cloud scenario shows an increasing in the execution timedue to the network latencies between the clouds (i.e., private and public clouds).
CloudScaleMiddleware
JSTaaS ApplicationCode
CGLibProxy
CGLibProxy
AspectJBytecodeWeaving
InMem
Database
Openstack Private Cloud
Amazon EC2 Public Cloud
Ubuntu 12.10 +CloudScaleService
Ubuntu 12.10 +CloudScaleService
Figure 3.23: Cloud bursting architecture [218]
3.5.2 Decentralized Systems
In this section, we present five decentralized cloud architectures that are most relatedto this PhD thesis.
3.5.2.1 Reservoir
Reservoir [296] is an architecture to manage services defined as a collection of virtualexecution environments (VEEs). Each VEE can spread over multiple sites, where each siteis completely autonomous. The architecture of Reservoir comprises three elements: servicemanager (SM), VEE manager, and VEE host (VEEH) (Figure 3.24). The service manageris in the highest level of the architecture, and it is responsible for deploying, provisioning,and monitoring the VEEs. The VEE manager is responsible for placing the VEEs into thehosts and also for adding or removing VEEs from a given VEE group. Finally, the VEEhost is responsible for managing the virtualization platform and for monitoring the VEEs.In addition, it is also responsible to allow VEEs migrations across the sites.
In Reservoir, a service acts as a platform to execute the applications in the VEEs. Inthis case, the developers describe the requirements of their applications using a service
68

Chapter 3. A Detailed View of Cloud Computing
definition manifest. A service definition manifest includes the virtual machine imagesrequired to run the applications, as well as the elasticity and service-level agreement(SLA) rules. This service manifest is submitted to a service manager (SM) that selectsthe appropriate resources and instantiates the VEEs for each component defined in themanifest. In addition, the SM also monitors the execution of the applications to scalethem according to the elasticity rules and to meet the SLAs. It scales the applications byadjusting the service capacities, either adding more service components or changing theresource requirements of a component according to its load.
In practice, the service manager requests the virtual execution environment man-ager (VEEM) to create, to resize, and allocate the VEEs, satisfying services’ constraints.
Reservoir site
VEE manager (VEEM)
Servicemanager
VEEH(e.g., hypervisor,OSGi container)
Serviceprovider
Manifest
SLA
VMIVMI
SLA
SMI
VHI
VMI
Figure 3.24: Reservoir architecture [296]
3.5.2.2 Open Cirrus
Open Cirrus [22] is a federated cloud testbed sponsored by different companies incollaboration with universities and institutions in the US, Germany, Russia, and Singapore.It is composed of ten data centers located in North America, Europe, and Asia to offera cloud stack consisting of physical and virtual machines. The objective is to offer forresearchers access to low-level hardware and software resources, which are usually notavailable and/or allowed in public clouds.
A Open Cirrus’s data center consists of three service layers called foundation, utility,and primary domain services (Figure 3.25).
The foundation layer offers IaaS service capabilities; and it is based on Zoni. Zoni is asoftware responsible for managing physical resources and some cloud services such as nodeallocation, node isolation, software provisioning, network, and debugging of the allocatedresources.
The utility layer comprises non-critical services such as monitoring, power management,networking file system, and accounting for resource utilization.
69
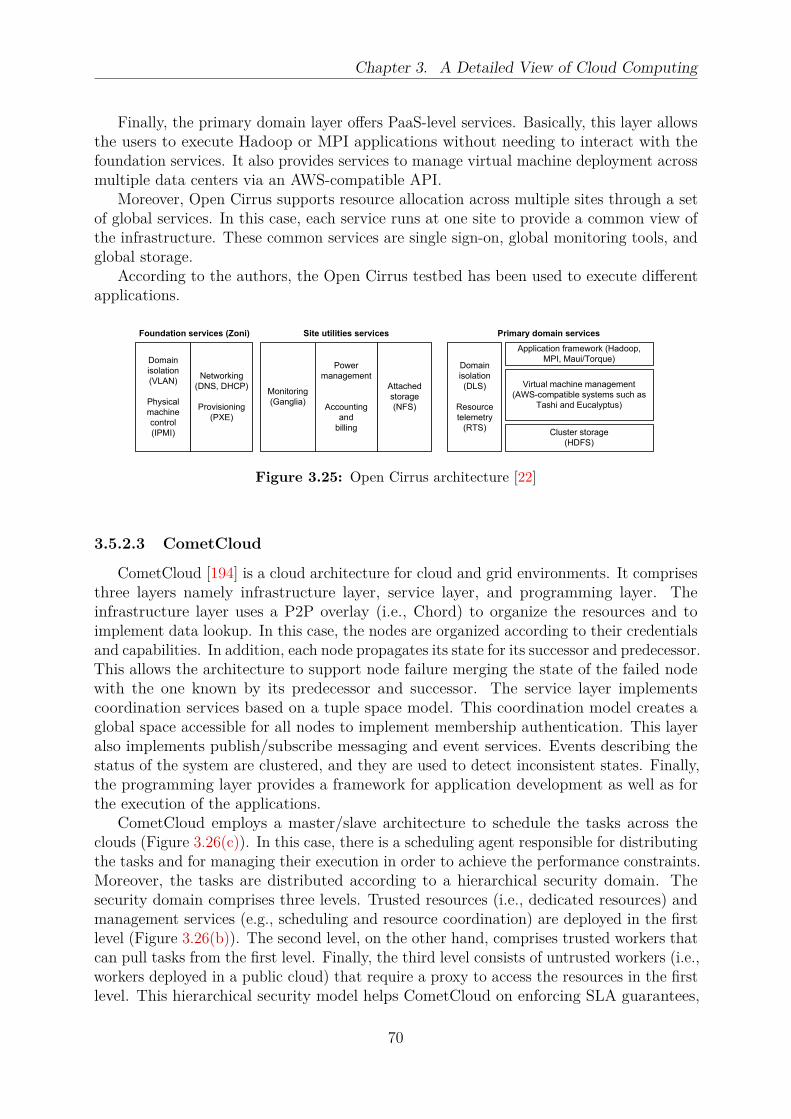
Chapter 3. A Detailed View of Cloud Computing
Finally, the primary domain layer offers PaaS-level services. Basically, this layer allowsthe users to execute Hadoop or MPI applications without needing to interact with thefoundation services. It also provides services to manage virtual machine deployment acrossmultiple data centers via an AWS-compatible API.
Moreover, Open Cirrus supports resource allocation across multiple sites through a setof global services. In this case, each service runs at one site to provide a common view ofthe infrastructure. These common services are single sign-on, global monitoring tools, andglobal storage.
According to the authors, the Open Cirrus testbed has been used to execute differentapplications.
Domain
isolation
(VLAN)
Physical
machine
control
(IPMI)
Application framework (Hadoop,
MPI, Maui/Torque)
Networking
(DNS, DHCP)
Provisioning
(PXE)
Monitoring
(Ganglia)
Power
management
Accounting
and
billing
Attached
storage
(NFS)
Domain
isolation
(DLS)
Resource
telemetry
(RTS)
Virtual machine management
(AWS-compatible systems such as
Tashi and Eucalyptus)
Cluster storage
(HDFS)
Foundation services (Zoni) Site utilities services Primary domain services
Figure 3.25: Open Cirrus architecture [22]
3.5.2.3 CometCloud
CometCloud [194] is a cloud architecture for cloud and grid environments. It comprisesthree layers namely infrastructure layer, service layer, and programming layer. Theinfrastructure layer uses a P2P overlay (i.e., Chord) to organize the resources and toimplement data lookup. In this case, the nodes are organized according to their credentialsand capabilities. In addition, each node propagates its state for its successor and predecessor.This allows the architecture to support node failure merging the state of the failed nodewith the one known by its predecessor and successor. The service layer implementscoordination services based on a tuple space model. This coordination model creates aglobal space accessible for all nodes to implement membership authentication. This layeralso implements publish/subscribe messaging and event services. Events describing thestatus of the system are clustered, and they are used to detect inconsistent states. Finally,the programming layer provides a framework for application development as well as forthe execution of the applications.
CometCloud employs a master/slave architecture to schedule the tasks across theclouds (Figure 3.26(c)). In this case, there is a scheduling agent responsible for distributingthe tasks and for managing their execution in order to achieve the performance constraints.Moreover, the tasks are distributed according to a hierarchical security domain. Thesecurity domain comprises three levels. Trusted resources (i.e., dedicated resources) andmanagement services (e.g., scheduling and resource coordination) are deployed in the firstlevel (Figure 3.26(b)). The second level, on the other hand, comprises trusted workers thatcan pull tasks from the first level. Finally, the third level consists of untrusted workers (i.e.,workers deployed in a public cloud) that require a proxy to access the resources in the firstlevel. This hierarchical security model helps CometCloud on enforcing SLA guarantees,
70
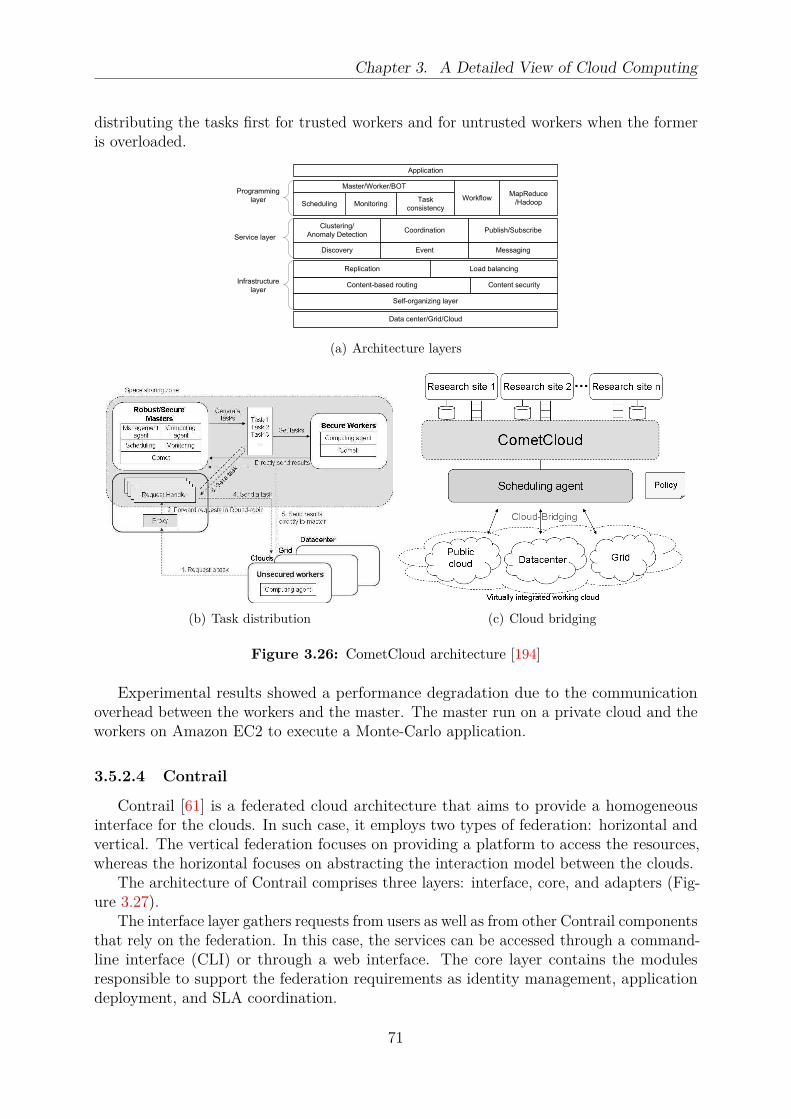
Chapter 3. A Detailed View of Cloud Computing
distributing the tasks first for trusted workers and for untrusted workers when the formeris overloaded.
Application
Master/Worker/BOT
Scheduling MonitoringTask
consistency
WorkflowMapReduce
/Hadoop
Clustering/
Anomaly Detection
Discovery Event
Coordination
Messaging
Publish/Subscribe
Self-organizing layer
Data center/Grid/Cloud
Content-based routing Content security
Replication Load balancing
Programming
layer
Service layer
Infrastructure
layer
(a) Architecture layers
(b) Task distribution (c) Cloud bridging
Figure 3.26: CometCloud architecture [194]
Experimental results showed a performance degradation due to the communicationoverhead between the workers and the master. The master run on a private cloud and theworkers on Amazon EC2 to execute a Monte-Carlo application.
3.5.2.4 Contrail
Contrail [61] is a federated cloud architecture that aims to provide a homogeneousinterface for the clouds. In such case, it employs two types of federation: horizontal andvertical. The vertical federation focuses on providing a platform to access the resources,whereas the horizontal focuses on abstracting the interaction model between the clouds.
The architecture of Contrail comprises three layers: interface, core, and adapters (Fig-ure 3.27).
The interface layer gathers requests from users as well as from other Contrail componentsthat rely on the federation. In this case, the services can be accessed through a command-line interface (CLI) or through a web interface. The core layer contains the modulesresponsible to support the federation requirements as identity management, applicationdeployment, and SLA coordination.
71

Chapter 3. A Detailed View of Cloud Computing
The identity management implements single sign-on (SSO) services, which once au-thenticated, a user it not prompted to login at each cloud. Application deployment isimplemented by the federation runtime manager (FRM). The FRM implements resourcediscovery considering different aspects such as cost and performance. It is also responsiblefor managing the application life-cycle. In this case, it gathers static and dynamic dataof the federation through the provider watcher module. The provider watcher modulemonitors the applications and updates the state module.
The adapters layer contains external and internal adapters that enable the accessto the services owned by both Contrail’s clouds and external clouds. Internal adaptersprovider components for network, storage, and execution platform, while internal adapterssupply provider-specific drivers for external clouds (i.e., non-Contrail clouds) by translatingrequests from the federation into requests that are understood by the providers.
Federation support
HTTP
REST
Core Layer
CLI
Security
Adapters layer
SLAManagement
Contrail Provider
SLAManagement
External Provider
VEP driver GAFS driver VIN driver External Cloudadapters
SLA Organizer
State
SLA TemplateRepository
SLA Negotiation
SLA Coordination
Federation RuntimeManagerMapping
Image ManagerImage Registry
Provider Watcher
User IdentityAuthentication
Attribute Authority
PolicyAdministration Point
Policy Decision Point
Figure 3.27: Contrail architecture [61]
Contrail has been used to deploy ConPaas [280], which is a platform-as-a-service forPHP applications.
3.5.2.5 OPTIMIS
OPTIMIS [112] is a multi-agent software architecture. It uses software agents toimplement resource provisioning across multiple clouds. One of the OPTIMIS agents isthe deployment engine (DE) (Figure 3.28) that is responsible to discover and to negotiatethe resources required by a service. First, it identifies the providers that meet the services’requirements, then it creates a service manifest (i.e., SLA template), submits it to eachcloud provider, and waits for the offers. When a request to host a service is received, aprovider can reject it or make an deployment offer through the admission controller (AC).The deployment decision is based on the workload of the cloud, on the requested resources,and on the provider’s objectives (i.e., profit).
72
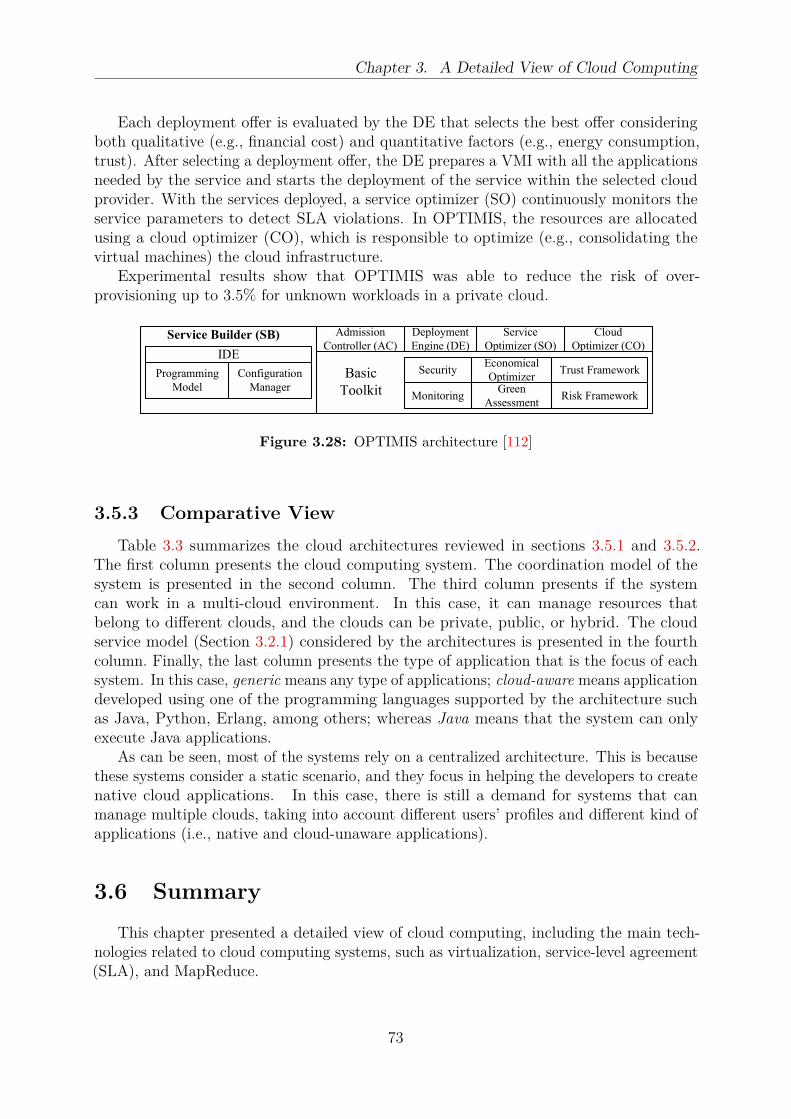
Chapter 3. A Detailed View of Cloud Computing
Each deployment offer is evaluated by the DE that selects the best offer consideringboth qualitative (e.g., financial cost) and quantitative factors (e.g., energy consumption,trust). After selecting a deployment offer, the DE prepares a VMI with all the applicationsneeded by the service and starts the deployment of the service within the selected cloudprovider. With the services deployed, a service optimizer (SO) continuously monitors theservice parameters to detect SLA violations. In OPTIMIS, the resources are allocatedusing a cloud optimizer (CO), which is responsible to optimize (e.g., consolidating thevirtual machines) the cloud infrastructure.
Experimental results show that OPTIMIS was able to reduce the risk of over-provisioning up to 3.5% for unknown workloads in a private cloud.
Service Builder (SB)
Basic
Toolkit
IDE
Programming
Model
Configuration
Manager
Admission
Controller (AC)
Deployment
Engine (DE)
Service
Optimizer (SO)
Cloud
Optimizer (CO)
SecurityEconomical
Optimizer
MonitoringGreen
Assessment
Trust Framework
Risk Framework
Figure 3.28: OPTIMIS architecture [112]
3.5.3 Comparative View
Table 3.3 summarizes the cloud architectures reviewed in sections 3.5.1 and 3.5.2.The first column presents the cloud computing system. The coordination model of thesystem is presented in the second column. The third column presents if the systemcan work in a multi-cloud environment. In this case, it can manage resources thatbelong to different clouds, and the clouds can be private, public, or hybrid. The cloudservice model (Section 3.2.1) considered by the architectures is presented in the fourthcolumn. Finally, the last column presents the type of application that is the focus of eachsystem. In this case, generic means any type of applications; cloud-aware means applicationdeveloped using one of the programming languages supported by the architecture suchas Java, Python, Erlang, among others; whereas Java means that the system can onlyexecute Java applications.
As can be seen, most of the systems rely on a centralized architecture. This is becausethese systems consider a static scenario, and they focus in helping the developers to createnative cloud applications. In this case, there is still a demand for systems that canmanage multiple clouds, taking into account different users’ profiles and different kind ofapplications (i.e., native and cloud-unaware applications).
3.6 Summary
This chapter presented a detailed view of cloud computing, including the main tech-nologies related to cloud computing systems, such as virtualization, service-level agreement(SLA), and MapReduce.
73

Chapter 3. A Detailed View of Cloud Computing
Table 3.3: Comparative view of some cloud architectures
Coordination Multi CloudSystem
model cloud modelApplication
Claudia [299] Centralized Yes IaaS GenericSciCumulus [95] Centralized No IaaS Workflow (Simulation)Cloud-TM [300] Centralized Yes PaaS Java
mOSAIC [278] Centralized Yes PaaS Cloud-awareTClouds [355] Centralized Yes PaaS Hadoop
FraSCAti [317] Centralized Yes PaaS JavaSTRATOS [274] Centralized Yes PaaS Java
COS [165] Centralized No PaaS JavaCOSCA [180] Centralized No PaaS JavaRafhyc [245] Centralized Yes IaaS GenericJSTaaS [218] Centralized Yes PaaS Java
Reservoir [296] Distributed Yes PaaS Cloud-awareOpen Cirrus [22] Distributed Yes IaaS Generic
CometCloud [194] Distributed Yes IaaS GenericContrail [61] Distributed Yes IaaS Cloud-aware
OPTIMIS [112] Distributed Yes PaaS Cloud-aware
Virtualization techniques introduce many advantages for such systems, such as mainte-nance with negligible downtime, workload consolidation to maximize the usage of resources,and properly workload isolation.
MapReduce, on the other hand, provides a simple and high-level API that enables thedevelopers to write distributed applications without needing to deal with failures, andthat can automatically scale.
Nevertheless, the customers’ services often rely on a single cloud infrastructure whichmay represent a drawback to the scalability and availability of the services. This issue canbe mitigated by federating the resources that belong to different providers. This can helpproviders to handle the requests that exceed their capacity by delegating them to othercloud providers, avoiding over-provisioning solutions, and it can also help cloud users toincrease their services availability.
Cloud federation is likely to represent the next step in the evolution of cloud computing,since it promotes the cooperation among different organizations and may contribute topush down the costs. Cloud federation enables a utility as a service model, where similarto the power generation, providers can delegate the exceed demand to their partners. Thus,cloud providers can elastically scale up/down their infrastructure by renting computationalcapability on-demand, and paying for them according to the business model (e.g., pay-per-usage) [70]. The challenge is how to deal effectively and automatically with failures,performance issues, and automatically deploy the services.
As in a cloud federation different platforms and technologies should coexist, thisrequires the development of middlewares to address the problems that may arise due tothe federation characteristics, such as interoperability, heterogeneous resources, multipleallocation policies, coordination, and data location.
Finally, a federated cloud should be designed considering a dynamic scenario, whereresources or even entire clouds could instantaneously appear and disappear. Consideringthis scenario, P2P techniques should be considered to implement discovery and services
74
Chapter 3. A Detailed View of Cloud Computing
selection due to their characteristics (e.g., scalability and adaptability) in a highly transientenvironment.
75

Chapter 4
Autonomic Computing
Contents
4.1 Definition . . . . . . . . . . . . . . . . . . . . . . . . . . . . . . . 77
4.2 Properties . . . . . . . . . . . . . . . . . . . . . . . . . . . . . . . 77
4.3 Architecture . . . . . . . . . . . . . . . . . . . . . . . . . . . . . 79
4.4 Autonomic Computing Systems . . . . . . . . . . . . . . . . . . 80
4.4.1 V-MAN . . . . . . . . . . . . . . . . . . . . . . . . . . . . . . . 80
4.4.2 Sunflower . . . . . . . . . . . . . . . . . . . . . . . . . . . . . . 80
4.4.3 Market-based . . . . . . . . . . . . . . . . . . . . . . . . . . . . 81
4.4.4 Component-Management Approach . . . . . . . . . . . . . . . 82
4.4.5 Snooze . . . . . . . . . . . . . . . . . . . . . . . . . . . . . . . . 82
4.4.6 Cloudlet . . . . . . . . . . . . . . . . . . . . . . . . . . . . . . . 83
4.4.7 Distributed VM Scheduler . . . . . . . . . . . . . . . . . . . . . 83
4.4.8 Thermal Management Framework . . . . . . . . . . . . . . . . 85
4.4.9 SmartScale . . . . . . . . . . . . . . . . . . . . . . . . . . . . . 85
4.4.10 SLA Management . . . . . . . . . . . . . . . . . . . . . . . . . 86
4.4.11 Comparative View . . . . . . . . . . . . . . . . . . . . . . . . . 87
4.5 Summary . . . . . . . . . . . . . . . . . . . . . . . . . . . . . . . 87
In the beginning of the 2000s, it was clear that computing systems were extremelycomplex, running in heterogeneous and dynamic environments such as the Internet andinteracting with other systems in complicated ways. In this scenario, even the most skilledadministrators were having problems to configure, to tune, and to manage these systemsproperly [163, 191]. Some challenges that arise in this scenario are [191]: (i) computingsystems must be scalable to provide a rich experience for users; (ii) computing systems
76
Chapter 4. Autonomic Computing
usually run in heterogeneous and unpredictable environments under multiple administrativedomains, where most of the interactions are known only at runtime; (iii) computing systemsshould be reliable even if they run in a unreliable environment; and finally (iv) computingsystems must be aware of their execution environment.
Observing these difficulties, in March 2001, Paul Horn, from IBM, introduced the ideaof autonomic computing at the National Academy of Engineering (NAE) by comparingcomputing systems to the human nervous system. He claimed that computing systemsshould be able to regulate themselves as the human body regulates itself [162]. Hesuggested that complex systems should independently take care of regular maintenanceand optimization tasks, thus reducing the workload of the system administrators.
This chapter describes autonomic computing. First, it provides the definition ofautonomic systems (Section 4.1) followed by the description of the autonomic proper-ties (Section 4.2). Then, it presents concepts related to the architecture of autonomicsystems (Section 4.3). Finally, some autonomic systems for large-scale distributed systemsare presented and compared (Section 4.4), and section 4.5 summarizes this chapter.
4.1 Definition
Autonomic systems are defined as computing systems that manage themselves, adjustingto environmental changes in order to achieve the users’ objectives [162]. Such systems mustanticipate needs and allow users to concentrate on what they want to accomplish with thesystems rather than spending their time overseeing the systems to get them there [162].This idea comes from the humans autonomic nervous system, that can observe and adaptthe human body to the environment, requiring little conscious actions [191, 236]. Forinstance, the nervous system autonomously controls the body’s temperature, the heartrate, the blood sugar level, and other vital functions.
An autonomic computing system is essentially a self-management system. A self-management system can configure and reconfigure itself under varying and unpredictablescenarios without human intervention [27]. The main goal is to free system administra-tors from the details of system operation. To achieve that, self-management systemsuse autonomic managers (AMs) to monitor the environment and to take appropriateactions [164, 191, 236].
4.2 Properties
According to Horn [162], autonomic systems are self-management systems with eightcharacteristics or key elements: self-configuration, self-healing, self-optimization, self-protection, self-knowledge, context-awareness, openness, and self-adaptation. The firstfour elements are considered major characteristics, and the other elements are minorcharacteristics [162].
Self-configuration refers to the ability of an autonomic element (AE) to be seamlesslyintegrated into the system according to the system or users’ objectives. In this context,an objective defines which states are desirable, without specifying how they should beaccomplished. For example, registering a node in a Hadoop (Section 3.1.3) cluster requires
77

Chapter 4. Autonomic Computing
changing on the Hadoop configuration in order to distribute tasks for the newest node.With self-configuration, a node can learn about the cluster and register itself, so that othercomponents can either use it or modify their behavior to the new system’s state.
Debugging and fixing problems in large-scale systems is usually a challenging task.They may require considerable amounts of time from programmers to diagnose problemsand to fix them. Moreover, such systems are often composed of interdependent subsystemseither developed or managed by different companies. Self-healing refers to the ability of asystem to detect and to diagnose problems automatically. Initially, an autonomic systemfollows the rules defined by system administrators, but later, it begins to discover newrules on its own that help it to meet the users’ goals. For instance, an autonomic system,after having detected a software bug, may decide to install software updates and to executeregression tests [191]. In this case, if the error continues, it can send a bug report to thesystem administrators with detailed information about the bug (i.e., context), or it canrestore the system to a state that minimizes services’ interruption.
Large-scale systems may have hundreds of tunable parameters that must be correctlyset for the system to perform adequately. In addition, such systems are often integrated,where adjusting one subsystem may affect the entire system [191]. In the context ofautonomic computing systems, self-optimization refers to the ability of a system to monitoritself constantly, to learn based on past experiences, and to adjust system parameters inorder to satisfy the performance goals. For instance, adaptive algorithms running on eachsystem can tune their own parameters and learn the best values that lead to the desirableperformance level.
An autonomic system that pro-actively protects itself from malicious attacks and fromthe users who can make changes that affect the system’s stability has the self-protectioncharacteristic. In this context, autonomic systems continuously tune themselves to achievedesirable security levels and also to anticipate problems based on historical data.
Self-knowledge means the ability of a system to have detailed information about itsenvironment even if it runs in an unpredictable scenario. In this case, the system shouldknow its components as well as their status, their current capacity, and their connectionswith other systems to be able to manage itself properly. Moreover, it should know whichresources belong to it, as well as the owners of other resources that it can borrow or lend,and finally which resources can be shared [162]. The self-knowledge property requirespolicies to govern the systems and to define their interactions.
Context-awareness refers to the ability of an autonomic system to know its environmentand the context surrounding its activities, and to act accordingly. In this case, it cangenerate new rules to interact with its neighbors, and to describe itself and its availableresources to other systems, as well as to automatically discover other resources in theenvironment. For example, in a cloud federation environment (Section 3.2.3), a context-aware autonomic system may negotiate the use of its underutilized resources with anotherclouds, which is geographically closed.
Besides these properties, autonomic systems must implement open standards to becorrectly integrated in heterogeneous environments (openess). Moreover, they mustanticipate their needs while keeping their complexity hidden from the users (self-adaptation).For instance, an application server can compare real-time access data with historical datato change the size of a cache service, anticipating performance degradation.
78

Chapter 4. Autonomic Computing
4.3 Architecture
Autonomic systems are often organized as a collection of distributed elements thatinteract to deliver services in accordance with some objectives in a control loop known asMAPE-K (Monitor, Analyze, Plan, Execute, and Knowledge) [164].
The monitoring function continuously collects, aggregates, and filters data obtainedfrom a managed element. The analyzing function observes the environment and determinesif some change needs to be made to achieve the desirable state. It takes into account thecurrent system state, historical data, and policies information to correlate and to modelcomplex events. The goal is to allow autonomic managers to learn about their environmentand to help them to predict future states [164]. The planning function creates a plan withthe actions needed to achieve the desired state. The execution function executes the planconsidering the precedence order of the actions as well as state changes. The data used bythese four functions are stored as shared knowledge to be used by autonomic managers.Autonomic managers obtain the knowledge retrieving it from policies, monitors, sensors orfrom an external knowledge source.
Figure 4.1 shows the structure of an autonomic element (AE). An autonomic elementhas one or more managed elements (MEs), composed of sensors and actuators, coupledwith an autonomic manager (AM). The MAPE-K control loop is implemented by the AEand it is similar to a generic agent model [306], where an intelligent agent perceives itsenvironment through sensors and uses such received data to act accordingly.
Analyze Plan
ExecuteMonitor Knowledge
Managed Element
Sensors Actuators
Autonomic Manager
Autonomic Element
Figure 4.1: Architecture of an autonomic element [191]
The sensors are responsible for collecting data about the managed element (ME), whichrepresent any resource (i.e., hardware or software) that has an autonomic behavior bycoupling with an autonomic manager (AM) [191]. An AM is a software agent implementedwith autonomic properties. It controls and represents the MEs, monitoring them throughsensors and storing data into the knowledge database. Based on the system’s knowledge,an AM decides the action to be taken, then it creates an execution plan, and sends it to
79
Chapter 4. Autonomic Computing
the MEs using the actuators. After, the MEs change their state, executing the actionsdefined by the AM.
Each AE is responsible for managing its internal state and interactions with theenvironment. Its relationships are driven by goals either defined by the user or by otherelements that have authority over it. The goals are expressed using event-condition-action(ECA) policies or through a utility function [163, 191]. For instance, a rule can be definedas follows: when the CPU load is less than 30%, then decrease the CPU frequency tothe lowest frequency available. In addition, AEs may cooperate requesting either data orresources to achieve a common goal. In this case, each AE is responsible to request thenecessary data and/or resources and to deal with failures of the required resource. Thus,AMs must be conscious of the state of their own managed elements and about the state ofthe environment, in special other autonomic elements in the network [163, 236].
4.4 Autonomic Computing Systems
Since the proposal of autonomic computing, many autonomic computing systems havebeen proposed in the literature. This section reviews some of these autonomic systemsdesigned for large-scale distributed systems.
4.4.1 V-MAN
V-MAN [239] is a decentralized VM management system based on an unstructured P2Poverlay. It implements self-optimization actions to reduce power consumption of thephysical machines. The optimization actions are based on workload consolidation andon dynamic voltage and frequency scaling (DVFS) (Section 5.1). In V-MAN, each physicalmachine knows a subset of other physical machines included in its local view through a peersampling service [174]. The control loop of V-MAN works as follows. Each node continuallyexchanges messages with its neighbors to: (i) share its local view; (ii) build a new localview, merging the old one with those received by the neighbors; and (iii) consolidate VMsin order to minimize the number of underutilized physical machines.
4.4.2 Sunflower
Sunflower [272] is an agent-based framework to coordinate workflow execution in anenvironment composed of grid and cloud resources. It implements self-optimization tomeet performance requirements. In this case, the optimization process first tries to use thegrid’s resources. But, when the performance degrades and cannot meet the users’ needs, itmoves some tasks to the cloud.
Its architecture, depicted in figure 4.2, comprises three main layers: Sunflower console,cloud, and distributed information system. The Sunflower console provides a graphical userinterface (GUI) for users to design their workflows. A workflow is submitted to the workflowmanager that creates sub-workflows and submits them to different agents. The cloud layermanages computing resources. In such case, it uses Eucalyptus (open.eucalyptus.com) toallocate cloud’s resources and a grid service to access grid’s resources. The distributed
80

Chapter 4. Autonomic Computing
information system organizes the nodes in groups using an ant clustering algorithm. Thesenodes cooperate to reach an orchestrated execution using a Petri Net policy associatedwith a BPEL application.
Figure 4.2: Sunflower architecture [272]
4.4.3 Market-based
In [86], the authors propose a market-based and self-optimization approach for re-source allocation in a multi-application scenario. The optimization process aims to meetperformance requirements, while trying to maximize the usage of the infrastructure. Thecontrol loop of this approach works as follows. First, based on a bid market, an applicationmanager defines: (i) the minimal resources that should be allocated to meet the applica-tion’s requirements; (ii) the spending rate; and (iii) the bids expressing their willingnessto pay for the resources. Then, it submits these data to a resource manager. Next, theresource manager evaluates the requests and allocates the resources according to theapplications’ bids, grouping the highest bids in nodes with more free resources. In thiscase, the resource manager maximizes resource usage and minimizes allocation failures,whereas the application managers meet QoS requirements by adjusting their bids or thespending rate.
81

Chapter 4. Autonomic Computing
4.4.4 Component-Management Approach
In [96], Oliveira and colleagues present a self-optimization cloud architecture to reducepower consumption. In this architecture (Figure 4.3) there are two autonomic man-agers — Application Manager (AM) and Infrastructure Manager (IM) — responsible formanaging the applications and the infrastructure. Each AM tests different configurationssuch as disabling logging events or consolidating virtual machines in order to accomplishits objectives (e.g., to reduce power consumption). An application is considered as a set ofindependent components that can be deployed in different virtual machines and integratedby AMs. In other words, AMs are responsible for synchronizing the states between thecomponents and their hosting virtual machines to minimize power consumption.
Figure 4.3: Control loop of the self-management cloud architecture [96]
4.4.5 Snooze
Snooze [111] is a hierarchical autonomic framework for VM placement. Snooze imple-ments self-optimization and self-healing by distinguishing three types of agents (Figure 4.4):local controller, group leader, and group manager. These agents are responsible for allo-cating and for monitoring the virtual machines. Implementing self-optimization actions,Snooze tries to free the users (e.g., system administrators) from some system details such aswhere and how to deploy a VM; and to minimize the number of overloaded or underutilizedphysical machines. Self-healing, on the other hand, implements fault-tolerance employingheartbeat multi-cast and leader election to discover and to connect group managers andgroup leaders.
82

Chapter 4. Autonomic Computing
Client Client ClientC Binding C++ Binding Java Binding
Entry Point Entry Point Entry Point
Group Leader
Client Interface
Group Manager Group Manager Group Manager
Local Controller Local ControllerMonitor Monitor Monitor MonitorCommon Cluster Monitoring and Management Interface
Virtualization Management Library
Virtualized Node Virtualized Node
Cluster
Clie
ntla
yer
Hier
arch
ical
laye
rPh
ysic
alla
yer
Figure 4.4: Snooze architecture [111]
4.4.6 Cloudlet
Cloudlet [321] is a multi-agent cloud computing architecture to discover and to negotiatecloud services. It implements self-optimization to free the users from the details of selectingand negotiating with different cloud providers functional and financial requirements. Thisarchitecture implements a control loop that work as follows (Figure 4.5). First, the cloudresources are registered in a database either by the cloud providers or by a crawler. Second,the users submit a query with their functional and budget requirements to the servicediscovery agent (SDA). Finally, the SDA negotiates with the cloud providers, and selectsthe services that match the user’s requirements. As each cloud provider often uses differentterminologies to describe its resources, the SDA uses an ontology to reason about thesimilarity between the users’ specification and the resources’ descriptions.
4.4.7 Distributed VM Scheduler
The distributed VM scheduler (DVMS) [286] is an agent-based VM scheduler thataims to optimize VM placement based on a structured P2P overlay (Figure 4.6). The P2Poverlay is the Chord (Section 2.4.3). It implements self-optimization actions to select anode to host a virtual machine according to some objective. In DVMS, each physicalmachine has an agent responsible to monitor its resources, to communicate with itsneighbors, and to consolidate the virtual machines. In this case, the control loop of DVMSworks as follows. First, when a node detects a problem (e.g., overloaded or underutilizedstate), it sends a message to its neighbor. Then, the neighbor can join the search, if it isnot already involved in another one, or it can forward the message to its neighbor. Thefirst node that accepts the message becomes the leader and the responsible for resolvingthe problem (i.e., to allocate the VM). As this process may lead to deadlock due to nodepartitions, duplicate searches are finished by the node with the lowest identifier.
83
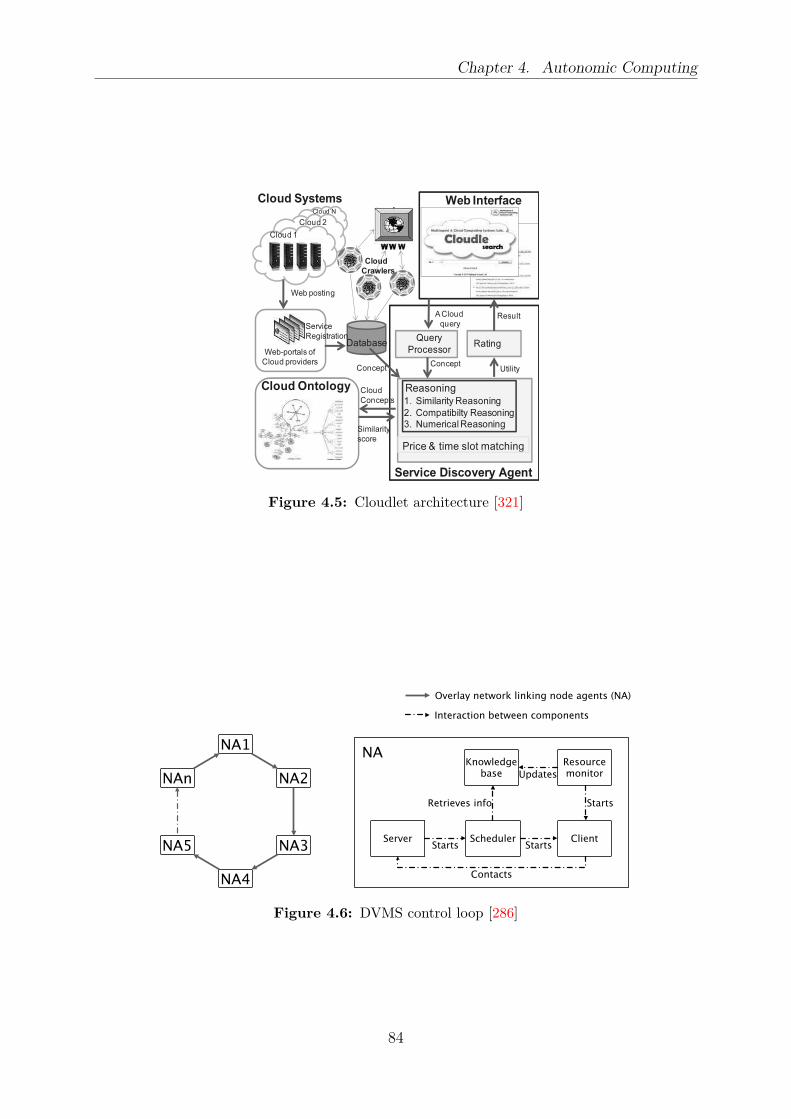
Chapter 4. Autonomic Computing
Figure 4.5: Cloudlet architecture [321]
Figure 4.6: DVMS control loop [286]
84
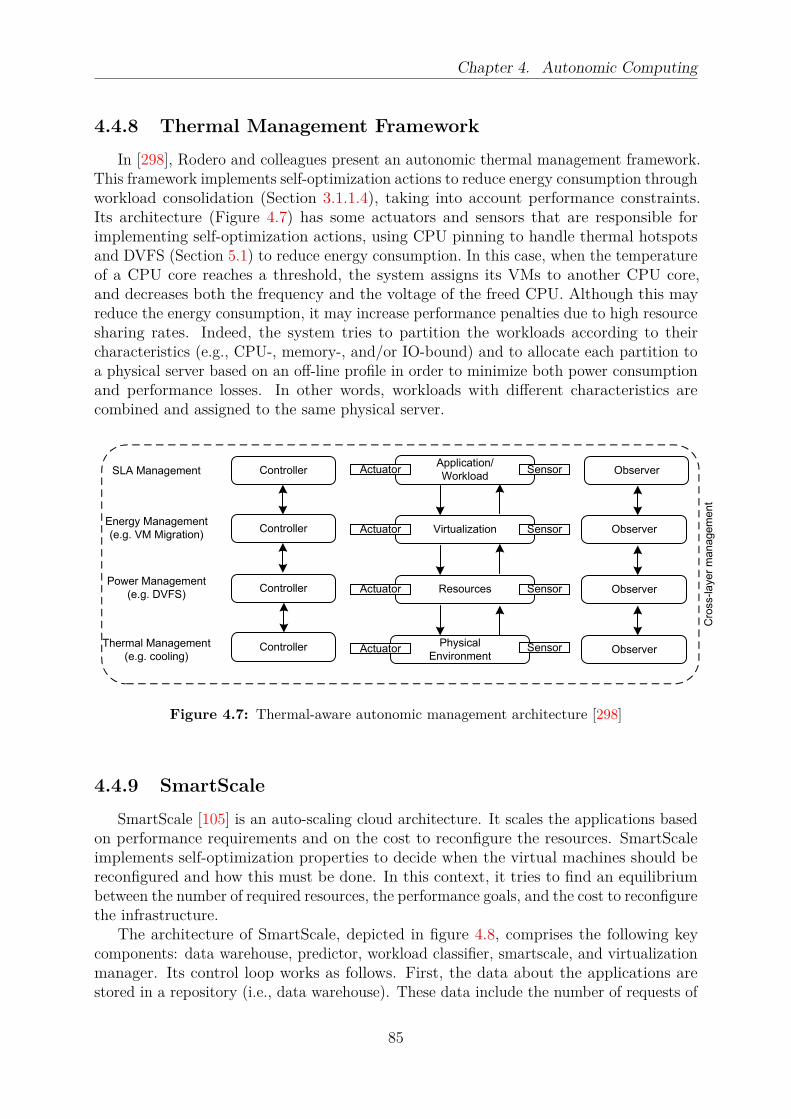
Chapter 4. Autonomic Computing
4.4.8 Thermal Management Framework
In [298], Rodero and colleagues present an autonomic thermal management framework.This framework implements self-optimization actions to reduce energy consumption throughworkload consolidation (Section 3.1.1.4), taking into account performance constraints.Its architecture (Figure 4.7) has some actuators and sensors that are responsible forimplementing self-optimization actions, using CPU pinning to handle thermal hotspotsand DVFS (Section 5.1) to reduce energy consumption. In this case, when the temperatureof a CPU core reaches a threshold, the system assigns its VMs to another CPU core,and decreases both the frequency and the voltage of the freed CPU. Although this mayreduce the energy consumption, it may increase performance penalties due to high resourcesharing rates. Indeed, the system tries to partition the workloads according to theircharacteristics (e.g., CPU-, memory-, and/or IO-bound) and to allocate each partition toa physical server based on an off-line profile in order to minimize both power consumptionand performance losses. In other words, workloads with different characteristics arecombined and assigned to the same physical server.
Controller
Controller
Controller
Controller
Application/
Workload
Virtualization
Resources
Physical
Environment
Observer
Observer
Observer
Observer
Sensor
Sensor
Sensor
Sensor
Actuator
Actuator
Actuator
ActuatorSLA Management
Energy Management
(e.g. VM Migration)
Power Management
(e.g. DVFS)
Thermal Management
(e.g. cooling)
Cro
ss-layer
managem
ent
Figure 4.7: Thermal-aware autonomic management architecture [298]
4.4.9 SmartScale
SmartScale [105] is an auto-scaling cloud architecture. It scales the applications basedon performance requirements and on the cost to reconfigure the resources. SmartScaleimplements self-optimization properties to decide when the virtual machines should bereconfigured and how this must be done. In this context, it tries to find an equilibriumbetween the number of required resources, the performance goals, and the cost to reconfigurethe infrastructure.
The architecture of SmartScale, depicted in figure 4.8, comprises the following keycomponents: data warehouse, predictor, workload classifier, smartscale, and virtualizationmanager. Its control loop works as follows. First, the data about the applications arestored in a repository (i.e., data warehouse). These data include the number of requests of
85
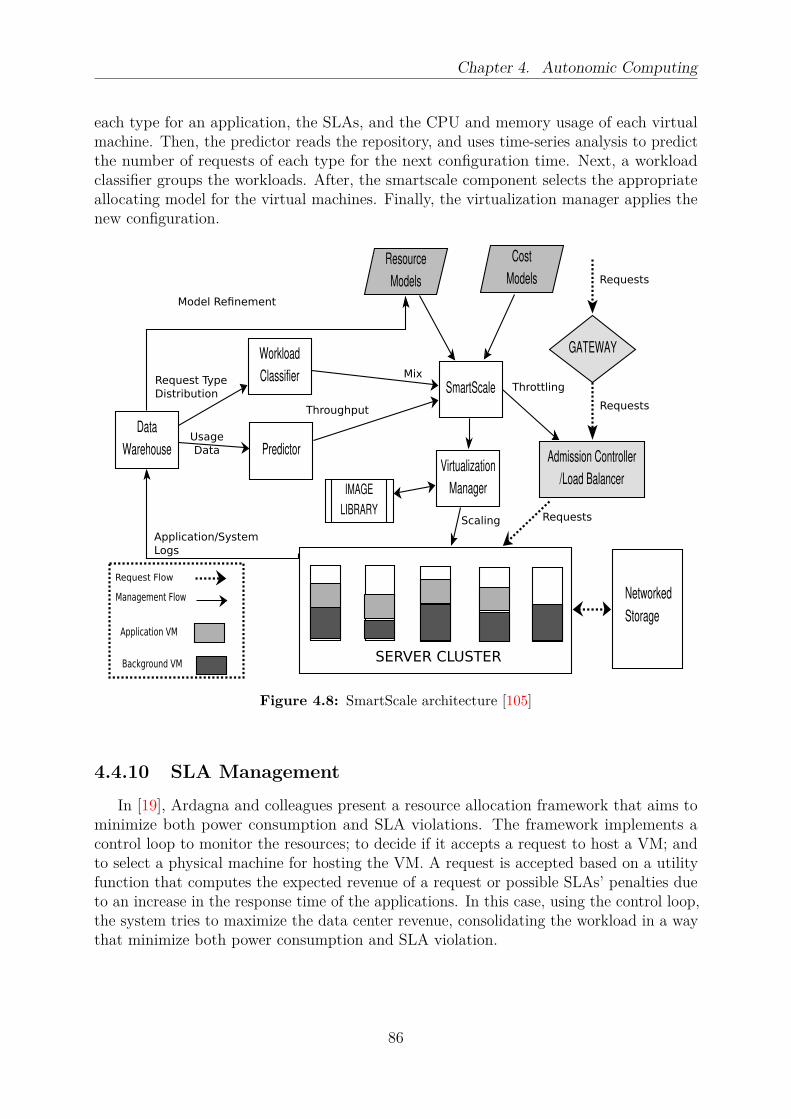
Chapter 4. Autonomic Computing
each type for an application, the SLAs, and the CPU and memory usage of each virtualmachine. Then, the predictor reads the repository, and uses time-series analysis to predictthe number of requests of each type for the next configuration time. Next, a workloadclassifier groups the workloads. After, the smartscale component selects the appropriateallocating model for the virtual machines. Finally, the virtualization manager applies thenew configuration.
Data
Warehouse
Workload
Classifier
Predictor
GATEWAY
SmartScale
Virtualization
Manager
Admission Controller
/Load Balancer
Resource
Models
Cost
Models
Networked
Storage
IMAGE
LIBRARY
Application/SystemLogs
UsageData
Request TypeDistribution
Model Refinement
Mix
Throughput
Throttling
Requests
Requests
RequestsScaling
Request Flow
Management Flow
Application VM
Background VM SERVER CLUSTER
Figure 4.8: SmartScale architecture [105]
4.4.10 SLA Management
In [19], Ardagna and colleagues present a resource allocation framework that aims tominimize both power consumption and SLA violations. The framework implements acontrol loop to monitor the resources; to decide if it accepts a request to host a VM; andto select a physical machine for hosting the VM. A request is accepted based on a utilityfunction that computes the expected revenue of a request or possible SLAs’ penalties dueto an increase in the response time of the applications. In this case, using the control loop,the system tries to maximize the data center revenue, consolidating the workload in a waythat minimize both power consumption and SLA violation.
86

Chapter 4. Autonomic Computing
4.4.11 Comparative View
Table 4.1 summarizes the autonomic systems reviewed in this section. The first columnpresents the system’s name or the paper. The second column presents their architecturecharacteristics. In this case, a centralized solution means that the system depends oncentralized information to work, even though there are some distributed components. Theautonomic properties implemented by each system are presented in the third column. Thefourth column presents the environment for which the autonomic system was proposed.Finally, the fifth column presents the objectives of the reviewed systems.
As can be seen in table 4.1, half of the systems rely on centralized information totake decisions. This may limit its usage in large-scale systems. Furthermore, as thesesystems focus on self-optimization, this may represent a challenge for their availability.Moreover, depicted the vision of autonomic computing, some of its properties such asself-configuration, self-healing, and context-awareness have not been completely addressedby today’s autonomic systems, while self-optimization has started to be implemented bysuch systems. Only Snooze [111] implements self-healing and self-optimization using ahierarchical architecture to allocate virtual machines in a private cloud.
4.5 Summary
This chapter presented the definition, properties, and important concepts related tothe architecture of autonomic systems. Moreover, it described some autonomic systemsdesigned for large-scale systems.
The self-management property of autonomic computing systems may be used toreduce considerably the burden on system managers, autonomously optimizing themselvesaccording to the environment changes. However, to achieve this, there are still manywork to do, since the majority of the autonomic systems available in the literature focuseson one autonomic property, such as self-configuration, employing a centralized controlmanagement.
87

Chapter
4.
Auto
nom
icC
om
putin
g
Table 4.1: Autonomic computing systems
System ArchitectureAutonomic⋆
Environment Objectivescharacteristics
V-MAN [239] Unstructured P2P SO Cloud Minimize power consumptionSunflower [272] Centralized SO Grid & cloud Minimize SLA violation
Market-based [86] Centralized SO Cloud Minimize SLA violationComponent-management [96] Centralized SO Cloud Minimize power consumption
Snooze [111] Hierarchical SO & SH Cloud Minimize power consumptionCloudlet [321] Centralized SO Cloud Minimize the cost of using the cloud
DVMS [286] Structured P2P SO Cluster Minimize the number of physical machinesThermal [298] Centralized SO Cloud Minimize energy consumption
SmartScale [105] Centralized SO Cloud Minimize SLA violationSLA management [19] Centralized SO Cloud Minimize power consumption and SLA violation
⋆ self-healing (SH), self-optimization (SO)
88
Chapter 5
Green Computing
Contents
5.1 Energy-Aware Computing . . . . . . . . . . . . . . . . . . . . . 90
5.2 Green Data Centers . . . . . . . . . . . . . . . . . . . . . . . . . 92
5.2.1 Green Data Center Benchmarks . . . . . . . . . . . . . . . . . 92
5.3 Green Performance Indicators . . . . . . . . . . . . . . . . . . . 95
5.3.1 The Approach of Stanley, Brill, and Koomey . . . . . . . . . . 95
5.3.2 The Green Grid Approach . . . . . . . . . . . . . . . . . . . . . 97
5.4 Summary . . . . . . . . . . . . . . . . . . . . . . . . . . . . . . . 99
The advances in large-scale distributed systems have historically been related toimproving in performance, scalability, and quality of service for the users. However, as theinfrastructures increased in size and computational capacity, other issues became critical.Power management is one of these issues, because of the constantly increasing powerconsumption of computing infrastructures. Also, systems with high peak power demandcomplex and expensive cooling infrastructures [44, 183]. Depending on the efficiency ofa computing infrastructure, the total number of watts required for cooling can be fromthree to thirty times higher than the number of watts needed for the computation [330].
According to Kumar [207], the actual power and cooling costs of servers representalmost 60% of their initial acquisition cost. A study on power consumption by servers anddata centers in the US shows that the electricity used by the large-scale infrastructures in2006 cost about USD 4.5 billion [201], and data centers are responsible for the emissionof tens millions of megatons of carbon dioxide annually. This study also indicates thatenergy consumption has doubled, if compared to the consumption in 2000.
One of the major causes of inefficiency in data centers is the idle power wasted whenservers run at low utilization. This occurs because the power consumption of CPUs evenat low load utilization rate, is over 60% of the peak load [30, 50, 110, 213]. Therefore,reducing the energy consumption without sacrificing quality of service commitments is
89

Chapter 5. Green Computing
an important issue, both for economical reasons and also for making the computinginfrastructure sustainable [38].
Currently, with the energy costs increasing, the focus shifts from optimizing large-scaleresource management for pure performance to optimize it for energy efficiency whilemaintaining the level of the services [56].
Another important issue in large-scale distributed systems is the level of carbonemissions. The high amount of carbon emissions in data centers is associated with theamount of energy consumption. A recent study on cloud computing and climate changeshows that the total electricity consumed by data centers in 2020 will be 1,963 billion kWhand the carbon emissions associated would reach 1,024 megatons, overtaking the airlineindustry in terms of carbon emissions [142]. Moreover, most of the electricity power comesfrom non-renewable and high-carbon fuels [29]. In this scenario, strategies that are awareof energy are gaining attention in academy and industry since they can fulfill the promiseof executing applications that can be tuned to consume less energy [244].
However, this represents a challenging problem, since there are many variables thatcontribute to the power consumption of a resource. First, large-scale infrastructurescomprise different layers, and characterizing the power consumed by each of them is usuallya difficult task [265]. For instance, the power consumed by a resource may change accordingto its position in the data center, as well as the data center’s temperature [60, 264]. Second,it is often difficult to determine the locations where a workload should be distributedwhile considering performance requirements. Third, in large scale, data centers’ carbonfootprint can vary significantly according to their load [129]. Finally, the environmentimpact of an application may change depending on the users’ location, as electricity costand carbon footprint are location specific [129, 230]. Moreover, it may be difficult todetermine the overall power footprint of a workload since some companies still do notpublish any information about their power source [85].
Green computing involves a set of methodologies, mechanisms and techniques thathelps computing systems (hardware and/or software) to reduce power consumption orcarbon footprint. This chapter presents an introduction to green computing, includingthe concepts of energy-aware computing (Section 5.1), green data centers (Section 5.2)and green data centers benchmarks (Section 5.2.1). Finally, some green data performanceindicators (GPI) related to energy consumption are presented (Section 5.3).
5.1 Energy-Aware Computing
The power consumption of a system comprises two parts: a static (or leakage power)and a dynamic part. The leakage power depends on the system size and on the type oftransistor. Static power consumption is related to the leakage currents that are present inany powered system and it is independent of clock rates and usage scenarios. The dynamicpart, on the other hand, depends on the activity of a circuit, the usage scenario, and theclock rates. Dynamic power consumption is mainly composed of short-circuit current andswitched capacitance [36]. Hence, it can be computed as showing in equation (5.1):
P = aCV 2f (5.1)
90
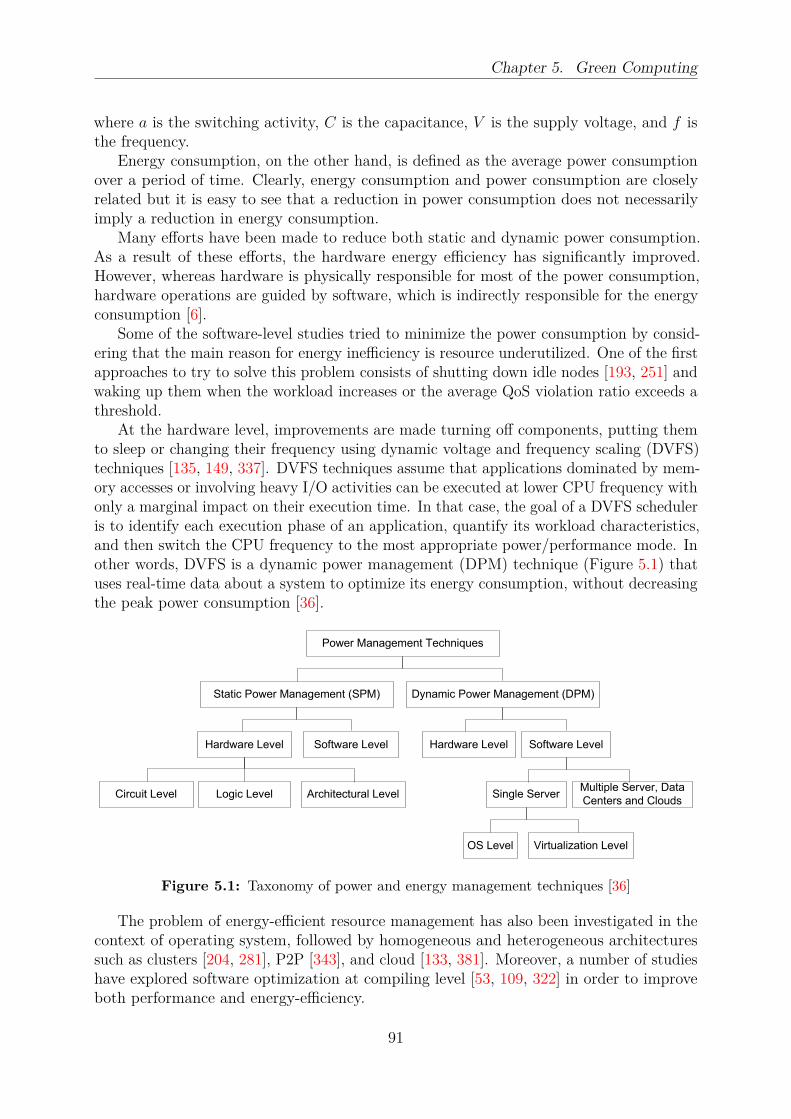
Chapter 5. Green Computing
where a is the switching activity, C is the capacitance, V is the supply voltage, and f isthe frequency.
Energy consumption, on the other hand, is defined as the average power consumptionover a period of time. Clearly, energy consumption and power consumption are closelyrelated but it is easy to see that a reduction in power consumption does not necessarilyimply a reduction in energy consumption.
Many efforts have been made to reduce both static and dynamic power consumption.As a result of these efforts, the hardware energy efficiency has significantly improved.However, whereas hardware is physically responsible for most of the power consumption,hardware operations are guided by software, which is indirectly responsible for the energyconsumption [6].
Some of the software-level studies tried to minimize the power consumption by consid-ering that the main reason for energy inefficiency is resource underutilized. One of the firstapproaches to try to solve this problem consists of shutting down idle nodes [193, 251] andwaking up them when the workload increases or the average QoS violation ratio exceeds athreshold.
At the hardware level, improvements are made turning off components, putting themto sleep or changing their frequency using dynamic voltage and frequency scaling (DVFS)techniques [135, 149, 337]. DVFS techniques assume that applications dominated by mem-ory accesses or involving heavy I/O activities can be executed at lower CPU frequency withonly a marginal impact on their execution time. In that case, the goal of a DVFS scheduleris to identify each execution phase of an application, quantify its workload characteristics,and then switch the CPU frequency to the most appropriate power/performance mode. Inother words, DVFS is a dynamic power management (DPM) technique (Figure 5.1) thatuses real-time data about a system to optimize its energy consumption, without decreasingthe peak power consumption [36].
Power Management Techniques
Static Power Management (SPM) Dynamic Power Management (DPM)
Hardware Level Software Level Hardware Level Software Level
Circuit Level Logic Level Architectural Level Single ServerMultiple Server, Data
Centers and Clouds
OS Level Virtualization Level
Figure 5.1: Taxonomy of power and energy management techniques [36]
The problem of energy-efficient resource management has also been investigated in thecontext of operating system, followed by homogeneous and heterogeneous architecturessuch as clusters [204, 281], P2P [343], and cloud [133, 381]. Moreover, a number of studieshave explored software optimization at compiling level [53, 109, 322] in order to improveboth performance and energy-efficiency.
91
Chapter 5. Green Computing
Besides reducing power consumption, data center providers are required to reducetheir carbon footprint from different organizations around the world. In this scenario,some companies such as Apple, Google, and Microsoft have already taken the initiative toachieve carbon neutrality [85, 369]. For instance, Apple (apple.com/environment) aims torun its data centers using only renewable energy [85]. Although renewable energy mayhave a lower carbon emission, in practice, it may be unreliable since green power supplieshighly depend on the weather conditions, which are usually time-varying. Thus, thislimits the broad adoption of green energy by large-scale infrastructures as they are mostlydesigned for high availability [76, 324].
5.2 Green Data Centers
Cloud computing systems are often built on large data centers. These data centersusually have a considerable number of servers and a sophisticated support and coolinginfrastructure that consume a huge amount of power and produce a lot of heat. Energyefficiency is therefore a major concern in the design and operation of data centers.
According to Wang and Khan [366], there are two main methods to build a greendata center: (a) design and build the data center with green elements; or (b) operate aconventionally built data center in a green way. These two methods are non-exclusive insuch a way that data centers designed as green can be also operated in a green way.
Green data center designs normally take into consideration the cooling systems insidethe chip. A sophisticated cooling solution with, for instance, localized cooling paths withruntime thermal management, will generally favor designs that include a small number ofcomplex cores with power-hungry needs. On the other hand, a great number of simplercores can also be used, replacing the complex cores. A simpler cooling solution will oftenbe applied to simpler cores. In theory, both alternatives are able to deliver the same wattper second rate, at a much higher financial cost for the first alternative.
In order to operate a data center in a green way, several techniques can be used, suchas: (a) reducing the data center temperature; (b) increasing the server utilization andconsequently turning off idle servers and/or (c) decreasing on-the-fly the power consumptionof the computing resources.
5.2.1 Green Data Center Benchmarks
Once a green data center is put into operation, there should be one or more metrics tomeasure its “greeness”. Measuring how green a data center is is important mainly for tworeasons. First, it is an indicator of the effectiveness of the techniques employed. Second, itprovides a way to compare several data centers and rank them according to the success oftheir green design.
In this scenario, there are challenges in identifying which metrics to be used, how touse them and which components to measure. Initially, power and cooling componentswere considered because of their size and scale of energy consumption. Nowadays, it isbecoming clear that metrics should also be applied to the computing components as well.Moreover, when systems are interconnected, which is the case in a data center, defining
92

Chapter 5. Green Computing
energy efficiency is not straightforward. Saving energy in one computer can possibly causeanother one to consume more energy, increasing the overall energy consumption [232].
Metrics provide insight about how resources are being used and the efficiency ofthat usage. They are often related to performance, availability, capacity and energyconsumption for servers, I/O resources and others, to meet a given level of service andcost objectives [314].
Several metrics for assessing performance have been proposed over the past decades,which have been successfully used in benchmarks. However, most of the benchmarksavailable do not measure energy efficiency. Only in the past years, the need for establishinggood benchmarks to measure green solutions really appeared. Efforts in this directioninclude the Green 500 initiative (green500.org), The Green Index (TGI) — (thegreenin-dex.com), the SPEC Power Initiative [210] and JouleSort [295], which will be discussed inthe next subsections.
5.2.1.1 The Green500 Initiative
The Green500 list aims at increasing awareness about environmental impact andlong-term sustainability of high-end supercomputers by providing a list that ranks themost energy-efficient supercomputers in the world. This ranking is based on the amountof power needed to complete a fixed amount of work [79].
The Green500 effort treats both performance and power consumption as importantdesign constraints for high performance computing environments. Its main idea is to usethe flops (Floating Point Operations per Second) metric of the LINPACK benchmark [227],which is widely used by the supercomputing community, and to combine it with a simplemetric that measures the power consumed, creating the flops per watt metric. In thismetric, the watts measured are the average system watts consumed during the executionof the LINPACK benchmark with a specific problem size.
Even though the flops per watt metric is having good acceptance, some authors discusssome of its potential drawbacks. For example, in [79], Feang and colleagues argue thatthis metric might be biased toward smaller supercomputing systems since the wattagescales linearly with the number of compute nodes whereas the flops performance scalessub-linearly for non-embarrassingly parallel problems, which is the case for LINPACK.This implies that smaller systems would have better ratings in such a metric. For thisreason, only the Top500 supercomputers (top500.org) are considered in the Green500 List.
5.2.1.2 The Green Index
The green index (TGI) metric [333] aims to capture the energy efficiency of a highperformance computing (HPC) system. It focuses on computing power, memory operationsand I/O activities. The main idea of The green index (TGI) is to combine the outputsof several benchmarks into a single metric, which is obtained in 4 steps. In the firststep, different benchmarks are executed and the performance to watt ratio is calculated.The ratios obtained in step 1 are compared in step 2 to a reference system (as in theSPEC benchmark suites), generating TGI components. In step 3, a weight is assigned toeach TGI component obtained in step 2. Finally, all the TGI components are multipliedby their respective weights and the addition of all these values is The green index.
93

Chapter 5. Green Computing
In order to evaluate TGI, the authors chose a 128-node cluster with 1024 cores as thereference system. The cluster evaluated was an 8-node cluster with 128 cores and HPCCbenchmarks [233] that stress CPU, memory and I/O were used. Even though good resultswere obtained, these results were clearly dependent on a good choice of the weights andon a good reference system.
5.2.1.3 SPECpower
The Standard Performance Evaluation Corporation (SPEC) (spec.org) is a non-profitcorporation formed to establish, maintain and endorse a set of metrics and benchmarks tobe applied to a wide range of computing platforms [210].
In 2006, the SPEC community started the development of the SPECpower_ssj2008benchmark, which was one of the first efforts to establish an industry-standard benchmarkthat measures power and performance characteristics of several types of servers.
The SPECpower_ssj2008 is a Java application that executes several transactions spreadover 11 target loads, stressing the CPU and the memory subsystem [309]. The throughputof each target load is measured in ssj_ops, i.e., the number of transactions completed persecond over a fixed period of time. The SPECpower_ssj2008 metric is then calculated bydividing the sum of the ssj_ops in each load by the sum of the average power consumedin each load.
As noted by some authors [309], the main limitation of SPECpower is that it does notconsider the disk activity and this activity is an important factor in measuring the energyefficiency of a computing system.
5.2.1.4 JouleSort
JouleSort [294] is a holistic benchmark to measure the energy-efficiency of computersystems, stressing CPU, memory and the I/O subsystem. The sort application was chosenbecause of its simplicity, portability and capacity to stress multiple components of a givenmachine.
The JouleSort benchmark sorts a file with 100-byte records and 10-byte keys. It isrequired that the input and output files must be in non-volatile storage. The number ofrecords to be sorted is fixed in three scales: 108, 109 and 1010 records. The metric used isSortedRecs / Joule. In this metric, energy is measured for power supplies of all hardwarecomponents, including the idle machines and the cooling system. The energy (Joule) is thetotal energy, which is the product of the average of the power consumed by the wallclocktime.
5.2.1.5 Comparative View
Table 5.1 summarizes the benchmarks discussed in section 5.2. In column 1 the greenbenchmark is provided. The metrics are provided in column 2. Column 3 provides theworkload category. Finally, the domain (column 4) of the metrics can be data center, whichinclude all data center resources; enterprise, which consider QoS and organization processparameters; and mobile and desktop resources.
94

Chapter 5. Green Computing
Table 5.1: Energy efficiency benchmarks and metrics
Benchmark Metric Category Domain
Green 500 MFLOPs/Watt HPC Data centerTGI Performance/Watt HPC Data center
SPECpower Operations/Watt (T/W) Web EnterpriseJouleSort Records sorted / Joule IT Resources Mobile, desktop, enterprise
5.3 Green Performance Indicators
Green performance indicators (GPIs) are defined as the driving policies for the datacollection and analysis related to energy consumption. The idea of GPI is interestingbecause it can be adapted as criteria to define SLAs (Section 3.1.2), where requirementsabout energy efficiency of services versus the expected quality of services are specified andneed to be satisfied.
In sections 5.3.1 and 5.3.2 we discuss two approaches used to categorize GPIs.
5.3.1 The Approach of Stanley, Brill, and Koomey
5.3.1.1 Overview
Stanley and colleagues [331], categorize the GPI metrics into four groups: IT strategy,IT hardware utilization, IT energy efficient hardware deployment, site infrastructure. Eachof these groups consider different issues in a green data center deployment and involvedifferent metrics and techniques.
The IT strategy category contains the strategic choices made by the enterprise/orga-nization to achieve its goals using less energy. These choices can be: data center Tierfunctionality levels, centralized vs decentralized processing, and disaster recovery mecha-nisms, among others. The IT hardware utilization category involves techniques such asturning off servers and storage systems and using consolidation techniques, among others.In the IT energy efficient deployment category, power-efficient techniques used to buildpower supplies and more efficient chips are considered. Finally, the site infrastructurecategory deals with techniques used to reduce the power consumed by the whole datacenter. Figure 5.2 illustrates this categorization.
In the following paragraphs, the metrics DH-UR, DH-UE, and H-POM are presented.
5.3.1.2 Metrics
deployed hardware utilization ratio (DH-UR): this metric measures how many serversare running applications in relation to the total number of servers in the data
95
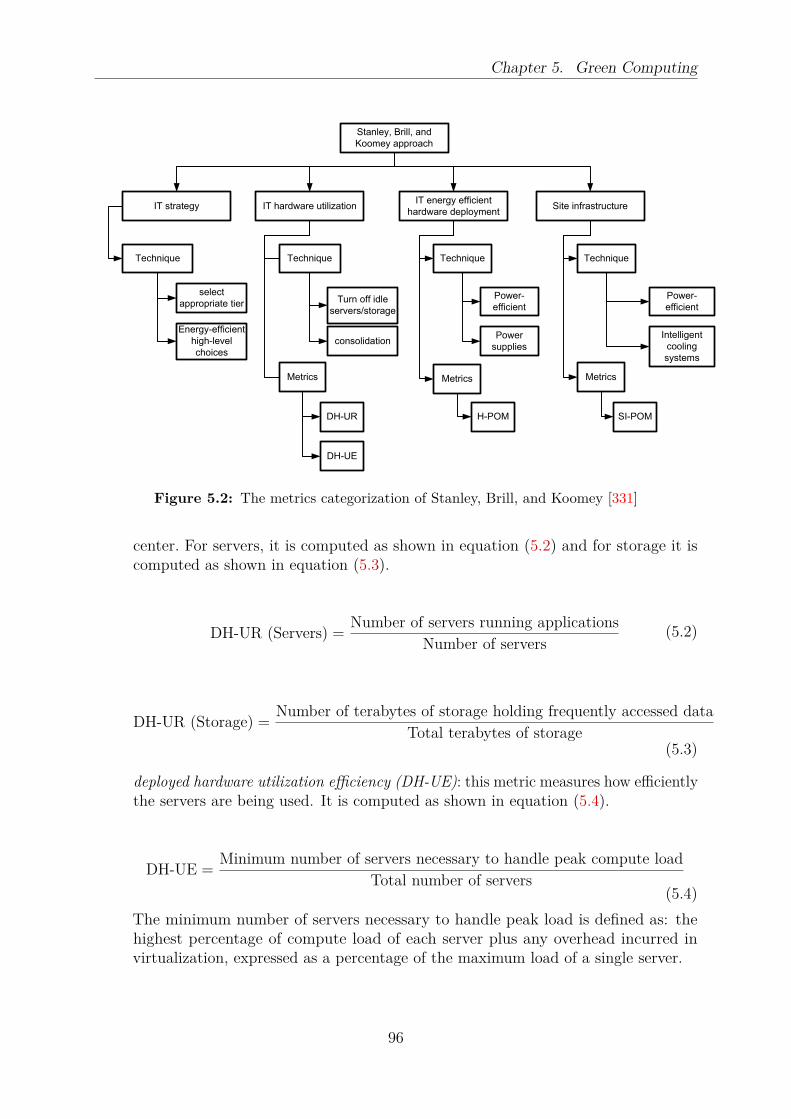
Chapter 5. Green Computing
Stanley, Brill, and
Koomey approach
IT strategy IT hardware utilizationIT energy efficient
hardware deploymentSite infrastructure
Technique
select
appropriate tier
Energy-efficient
high-level
choices
Technique
Turn off idle
servers/storage
consolidation
Metrics
DH-UR
DH-UE
Technique Technique
Power-
efficient
Power
supplies
Power-
efficient
Intelligent
cooling
systems
Metrics
H-POM SI-POM
Metrics
Figure 5.2: The metrics categorization of Stanley, Brill, and Koomey [331]
center. For servers, it is computed as shown in equation (5.2) and for storage it iscomputed as shown in equation (5.3).
DH-UR (Servers) =Number of servers running applications
Number of servers(5.2)
DH-UR (Storage) =Number of terabytes of storage holding frequently accessed data
Total terabytes of storage(5.3)
deployed hardware utilization efficiency (DH-UE): this metric measures how efficientlythe servers are being used. It is computed as shown in equation (5.4).
DH-UE =Minimum number of servers necessary to handle peak compute load
Total number of servers(5.4)
The minimum number of servers necessary to handle peak load is defined as: thehighest percentage of compute load of each server plus any overhead incurred invirtualization, expressed as a percentage of the maximum load of a single server.
96
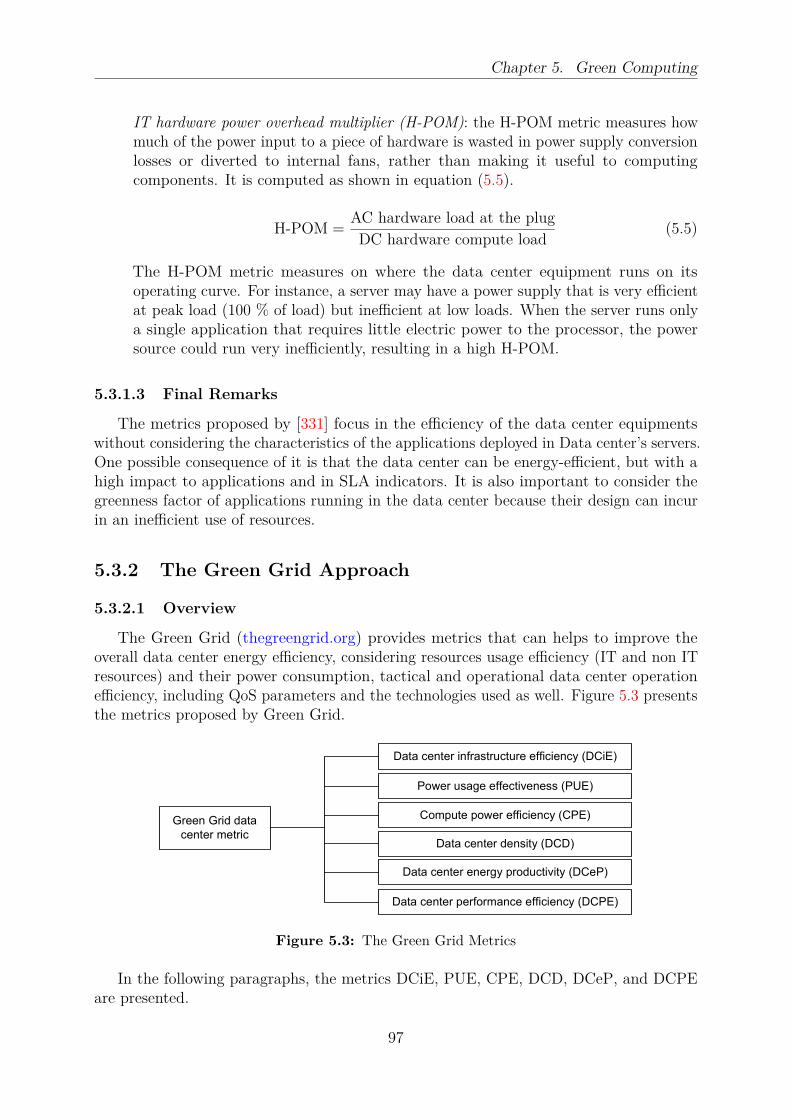
Chapter 5. Green Computing
IT hardware power overhead multiplier (H-POM): the H-POM metric measures howmuch of the power input to a piece of hardware is wasted in power supply conversionlosses or diverted to internal fans, rather than making it useful to computingcomponents. It is computed as shown in equation (5.5).
H-POM =AC hardware load at the plugDC hardware compute load
(5.5)
The H-POM metric measures on where the data center equipment runs on itsoperating curve. For instance, a server may have a power supply that is very efficientat peak load (100 % of load) but inefficient at low loads. When the server runs onlya single application that requires little electric power to the processor, the powersource could run very inefficiently, resulting in a high H-POM.
5.3.1.3 Final Remarks
The metrics proposed by [331] focus in the efficiency of the data center equipmentswithout considering the characteristics of the applications deployed in Data center’s servers.One possible consequence of it is that the data center can be energy-efficient, but with ahigh impact to applications and in SLA indicators. It is also important to consider thegreenness factor of applications running in the data center because their design can incurin an inefficient use of resources.
5.3.2 The Green Grid Approach
5.3.2.1 Overview
The Green Grid (thegreengrid.org) provides metrics that can helps to improve theoverall data center energy efficiency, considering resources usage efficiency (IT and non ITresources) and their power consumption, tactical and operational data center operationefficiency, including QoS parameters and the technologies used as well. Figure 5.3 presentsthe metrics proposed by Green Grid.
Green Grid data
center metric
Data center infrastructure efficiency (DCiE)
Power usage effectiveness (PUE)
Compute power efficiency (CPE)
Data center density (DCD)
Data center energy productivity (DCeP)
Data center performance efficiency (DCPE)
Figure 5.3: The Green Grid Metrics
In the following paragraphs, the metrics DCiE, PUE, CPE, DCD, DCeP, and DCPEare presented.
97

Chapter 5. Green Computing
5.3.2.2 Metrics
data center infrastructure efficiency (DCiE): this metric measures the energy effi-ciency of a data center. It quantifies how much energy the data center computingequipments consume from the total energy consumption. It is computed as shownin equation (5.6).
DCiE =IT equipment powerTotal facility power
(5.6)
The IT equipment power is defined as the power consumed by equipments that areused to manage, process, store or route data within the compute space. The totalfacility power is defined as the power measured at the utility meter.
power usage effectiveness (PUE): this metric measures the energy efficiency of adata center, calculated as a ratio between the total facility power and IT equipmentpower. It is computed as the inverse of DCiE metric (Equation (5.6)) as shownin equation (5.7).
PUE =Total facility powerIT equipment power
(5.7)
compute power efficiency (CPE): this metric measures how efficiently the data centerenergy is consumed for computation. By using this metric, the power consumed bythe idle servers is counted as overhead rather than as power that is being productivelyused [196]. It is computed as shown in equation (5.8).
CPE =IT equipment utilization
PUE(5.8)
data center density (DCD): this metric measures the data center space effi-ciency. The DCD focus on a tactical part of the data center design, includingthe data center computing operational efficiency, and characteristics of the SLAs. Itis computed as shown in equation (5.9).
DCD =Power of all equipment on raised floor
Area of raised floor (kW/ft2)(5.9)
The primary use for this benchmark is to determine if the deployment has low,medium, or high density. While this is a good metric to determine the absoluteperformance of a data center relative to other data centers, it fails to capture whetherthe deployment is being done effectively.
data center energy productivity (DCeP): this metric measures the number of usefulcomputation that a data center produces based on the amount of energy it consumes.It is computed as shown in equation (5.10):
DCeP =Useful work produced
Total data center energy consumed(5.10)
98

Chapter 5. Green Computing
To the Green Grid (thegreengrid.org), useful work is defined by the equation (5.11).
UW =M∑
i=1
Vi ∗ Ui(t, T ) ∗ Ti (5.11)
where M is the number of tasks initiated during the considered time period. Vi
is a normalization factor that allows the tasks to be summed numerically. Ti = 1if task i completes during the time period and Ti = 0 otherwise. Ui(t, T ) is atime-based utility function for each task, where the parameter t is the elapsed timefrom initiation to completion of the task, and T is the absolute time of completionof the task.
data center performance efficiency (DCPE): this metric measures how effective a datacenter is using power to provide a given level of service or work such as energy pertransaction or energy per business function [23]. It is computed as a ratio betweenthe effective IT workload and total facility power as shown in equation (5.12).
DCPE =Effective IT workload
total facility power(5.12)
5.3.2.3 Final Remarks
All of the Green Grid metrics focus on measuring how the data center’s resourcesare used efficiently considering the equipments and facilities but without considering theorganization process and the characteristics of the deployed applications.
5.4 Summary
Over the years, large-scale computing infrastructures have been mostly driven byperformance improvement, where power consumption and greenhouse gas (GHG) wereusually ignored. However, power and carbon footprint have started to impose constraintsin the design of computing systems and data centers [29, 34]. Thus, reducing powerconsumption and carbon footprint are some of the challenges that large computinginfrastructures have to deal with. This requires the design of energy-aware solutions foreconomic and environment reasons. In this case, several metrics and benchmarks have beenproposed where the mostly used are the PUE and the DCiE. These metrics provide a viewof the whole power consumed by infrastructure and the energy-efficient of its resources.The main characteristic of these metrics is that they can be applied to any workload.Nevertheless, they do not take performance into account. In this case, some benchmarkscan be used such as the ones discussed in sections 5.2.1.1 to 5.2.1.5.
Even though these benchmarks and metrics capture important aspects of energy-efficient solutions, more research is required to define holistic metrics and tools that willallow infrastructure operators and developers to evaluate their solutions in a broad sense.
99
Part II
Contributions
100
Chapter 6
Power-Aware Server Consolidation
for Federated Clouds
Contents
6.1 Introduction and Motivation . . . . . . . . . . . . . . . . . . . . 102
6.2 Design of the Proposed Solution . . . . . . . . . . . . . . . . . 103
6.3 Experimental Results . . . . . . . . . . . . . . . . . . . . . . . . 106
6.3.1 Modifications in CloudSim . . . . . . . . . . . . . . . . . . . . 106
6.3.2 Simulation Environment . . . . . . . . . . . . . . . . . . . . . . 107
6.3.3 Scenario 1: workload submission to a single data center under
power consumption threshold . . . . . . . . . . . . . . . . . . . 107
6.3.4 Scenario 2: distinct workload submission to different overloaded
data centers . . . . . . . . . . . . . . . . . . . . . . . . . . . . . 109
6.4 Related Work . . . . . . . . . . . . . . . . . . . . . . . . . . . . . 109
6.5 Summary . . . . . . . . . . . . . . . . . . . . . . . . . . . . . . . 113
Cloud services normally execute in big data centers. These data centers comprise alarge number of computing nodes. One issue that arises in this scenario is the amount ofenergy demanded by such services [31]. In this context, we aim to investigate the usageof a cloud federation to help the cloud providers on reducing power consumption of theservices, without having a great impact on service-level agreements.
Thus, in this chapter, we present the first contribution of this PhD thesis: a serverconsolidation strategy to reduce power consumption (Section 5.1) in cloud federation (Sec-tion 3.2.3), taking into account SLA (Section 3.1.2) requirements. We assume that cloudshave limited power consumption defined by a third party agent, thereby a power cappingstrategy [36] applied to data centers, and that when a cloud is overloaded, its data centerhas to negotiate with other data centers before migrating the virtual machine. In thiscase, we address applications’ workloads, considering the costs to turn servers on/off and
101
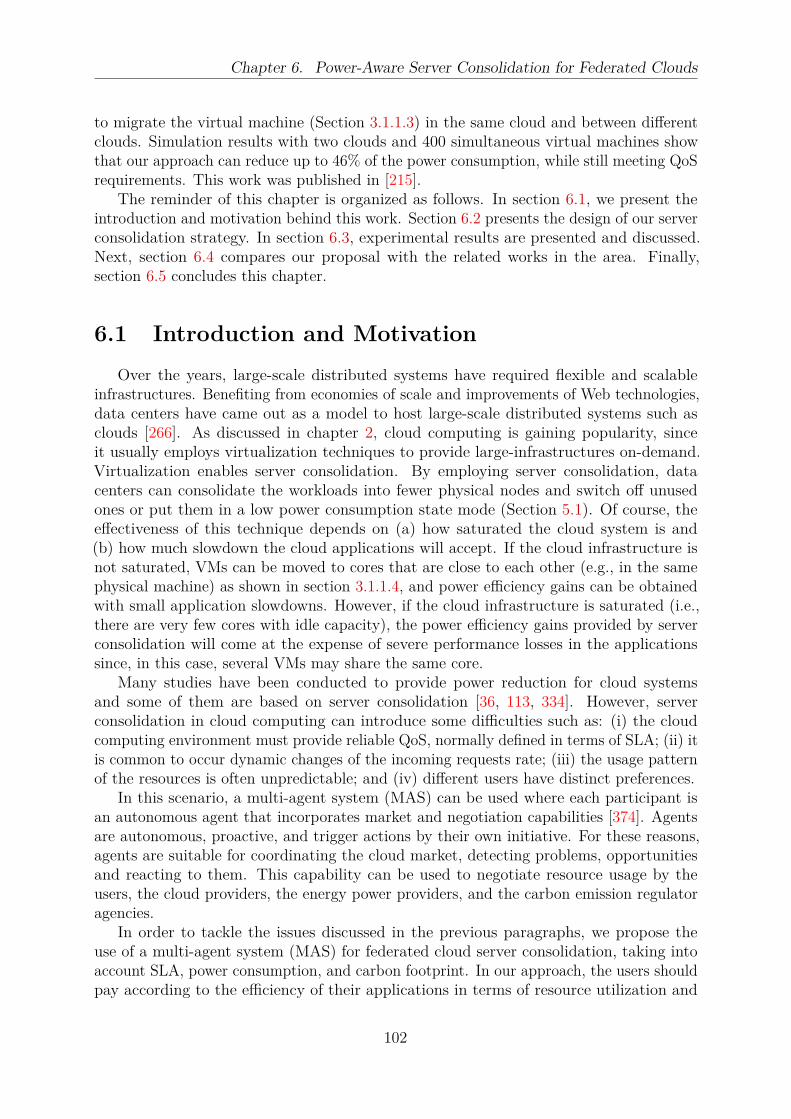
Chapter 6. Power-Aware Server Consolidation for Federated Clouds
to migrate the virtual machine (Section 3.1.1.3) in the same cloud and between differentclouds. Simulation results with two clouds and 400 simultaneous virtual machines showthat our approach can reduce up to 46% of the power consumption, while still meeting QoSrequirements. This work was published in [215].
The reminder of this chapter is organized as follows. In section 6.1, we present theintroduction and motivation behind this work. Section 6.2 presents the design of our serverconsolidation strategy. In section 6.3, experimental results are presented and discussed.Next, section 6.4 compares our proposal with the related works in the area. Finally,section 6.5 concludes this chapter.
6.1 Introduction and Motivation
Over the years, large-scale distributed systems have required flexible and scalableinfrastructures. Benefiting from economies of scale and improvements of Web technologies,data centers have came out as a model to host large-scale distributed systems such asclouds [266]. As discussed in chapter 2, cloud computing is gaining popularity, sinceit usually employs virtualization techniques to provide large-infrastructures on-demand.Virtualization enables server consolidation. By employing server consolidation, datacenters can consolidate the workloads into fewer physical nodes and switch off unusedones or put them in a low power consumption state mode (Section 5.1). Of course, theeffectiveness of this technique depends on (a) how saturated the cloud system is and(b) how much slowdown the cloud applications will accept. If the cloud infrastructure isnot saturated, VMs can be moved to cores that are close to each other (e.g., in the samephysical machine) as shown in section 3.1.1.4, and power efficiency gains can be obtainedwith small application slowdowns. However, if the cloud infrastructure is saturated (i.e.,there are very few cores with idle capacity), the power efficiency gains provided by serverconsolidation will come at the expense of severe performance losses in the applicationssince, in this case, several VMs may share the same core.
Many studies have been conducted to provide power reduction for cloud systemsand some of them are based on server consolidation [36, 113, 334]. However, serverconsolidation in cloud computing can introduce some difficulties such as: (i) the cloudcomputing environment must provide reliable QoS, normally defined in terms of SLA; (ii) itis common to occur dynamic changes of the incoming requests rate; (iii) the usage patternof the resources is often unpredictable; and (iv) different users have distinct preferences.
In this scenario, a multi-agent system (MAS) can be used where each participant isan autonomous agent that incorporates market and negotiation capabilities [374]. Agentsare autonomous, proactive, and trigger actions by their own initiative. For these reasons,agents are suitable for coordinating the cloud market, detecting problems, opportunitiesand reacting to them. This capability can be used to negotiate resource usage by theusers, the cloud providers, the energy power providers, and the carbon emission regulatoragencies.
In order to tackle the issues discussed in the previous paragraphs, we propose theuse of a multi-agent system (MAS) for federated cloud server consolidation, taking intoaccount SLA, power consumption, and carbon footprint. In our approach, the users shouldpay according to the efficiency of their applications in terms of resource utilization and
102

Chapter 6. Power-Aware Server Consolidation for Federated Clouds
power consumption. Therefore, we propose that the price paid by the users should increaseaccording to the whole energy consumption of the data center(s), especially when theusers refuse to negotiate performance requirements. Experimental results show that ourapproach can reduce up to 46% of the power consumption, while still meeting the QoSrequirements. Our experiments were realized through the CloudSim [58] simulator withtwo clouds and 400 simultaneous virtual machines. This work was published in [215].
The remainder of this chapter is organized as follows. Section 6.2 presents the pro-posed multi-agent system (MAS) server consolidation strategy for federated clouds. In sec-tion 6.3, experimental results are discussed. Section 6.4 presents some related works.Finally, section 6.5 presents some remarks and future work.
6.2 Design of the Proposed Solution
The main goal of our approach, called federated application provisioning (FAP), is toreduce power consumption of data centers, trying to meet QoS requirements, with limitedenergy defined by a third party agent (carbon emission regulator agency). We considerthat data centers are concerned by an energy threshold, and they are in a federated cloudcomputing environment, scheduling online the execution of the users’ applications. In thiscase, a multi-agent strategy is used to negotiate resources’ allocations and the final priceto execute the users’ tasks.
We assume a federated cloud model composed of public and private clouds (Sec-tion 3.2.3), and that the cost to transfer an application or to migrate VMs across theclouds is known by the cloud providers.
In our cloud environment there are four distinct agents: cloud service provider (CLSP),cloud user (CLU), electric power provider (EPP), and carbon emission regulator agency(CERA) as shown in figure 6.1. In our design, the carbon emission regulator agencydetermines the amount of carbon emissions that both CLSP and EPP can emit in a periodof time.
We also assume that each cloud is composed of one data center with one coordinatoraccountable for monitoring the metrics, negotiating with the other agents (CLSP, CLU,EPP, and CERA). There are also sensors to monitor power consumption, resource usage,and SLA violation as depicted in figure 6.2.
Finally, we consider that the cloud system has a communication layer such that anyparticipant can exchange messages. Messages and QoS metrics are described in a formatthat is known by the agents, and a cloud provider cannot reject users’ tasks.
The proposed scenario includes a set of data centers (clouds) composed by a set ofvirtual machines, which are mapped to a set of physical servers that are interconnectedand deployed across the clouds. Let R = r1, r2, · · · , rn be the set of resources in datacenter i with a capacity ck
i , where k ∈ R. The power consumption (Pi) can be definedas [212]:
Pi = (pmax − pmin) ∗ Ui + pmin (6.1)
103
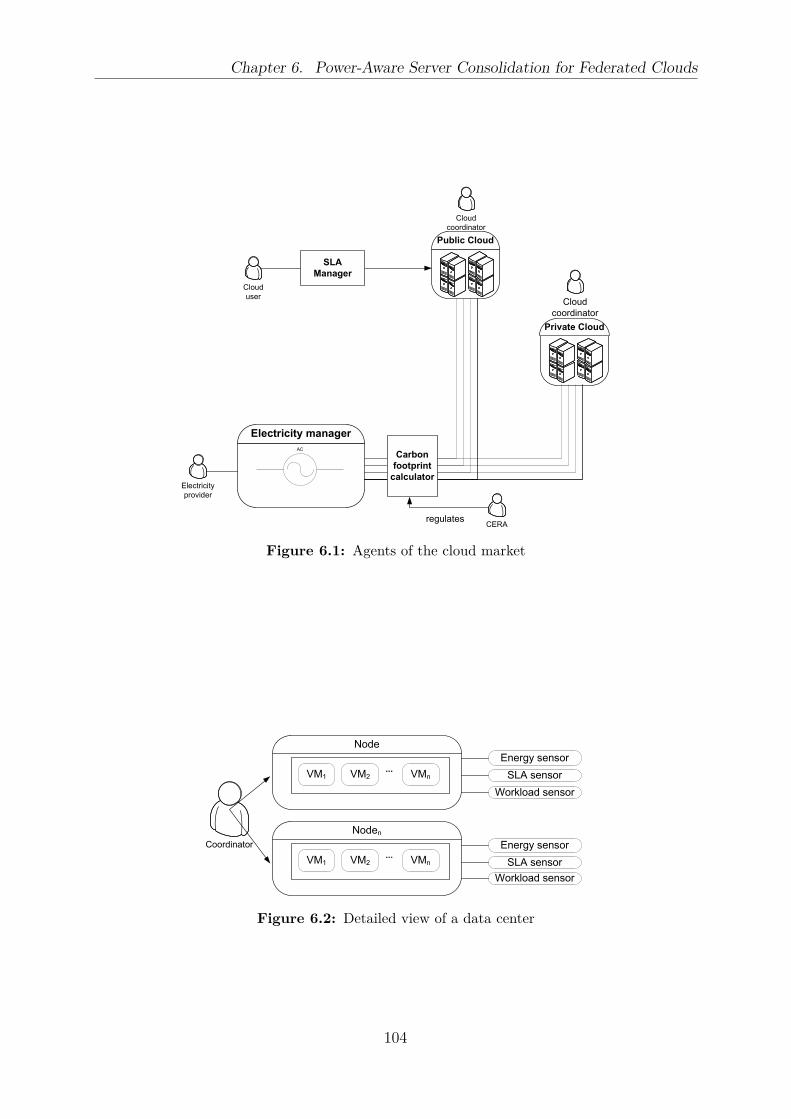
Chapter 6. Power-Aware Server Consolidation for Federated Clouds
Private Cloud
Electricity manager
AC
Cloud
coordinator
SLA
Manager
Carbon
footprint
calculator
regulates
Cloud
user
Public Cloud
Cloud
coordinator
CERA
Electricity
provider
Figure 6.1: Agents of the cloud market
VM1 VM2 VMn...
Node
Energy sensor
SLA sensor
Coordinator
VM1 VM2 VMn...
Noden
Workload sensor
Energy sensor
SLA sensor
Workload sensor
Figure 6.2: Detailed view of a data center
104
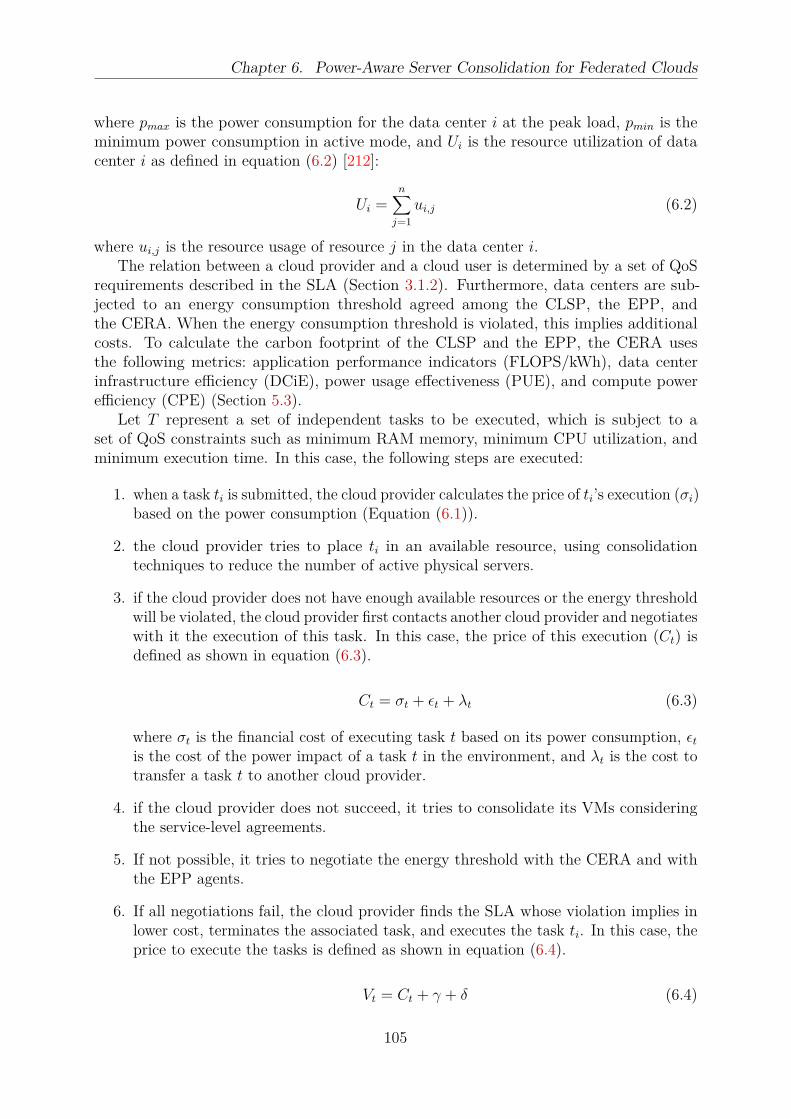
Chapter 6. Power-Aware Server Consolidation for Federated Clouds
where pmax is the power consumption for the data center i at the peak load, pmin is theminimum power consumption in active mode, and Ui is the resource utilization of datacenter i as defined in equation (6.2) [212]:
Ui =n∑
j=1
ui,j (6.2)
where ui,j is the resource usage of resource j in the data center i.The relation between a cloud provider and a cloud user is determined by a set of QoS
requirements described in the SLA (Section 3.1.2). Furthermore, data centers are sub-jected to an energy consumption threshold agreed among the CLSP, the EPP, andthe CERA. When the energy consumption threshold is violated, this implies additionalcosts. To calculate the carbon footprint of the CLSP and the EPP, the CERA usesthe following metrics: application performance indicators (FLOPS/kWh), data centerinfrastructure efficiency (DCiE), power usage effectiveness (PUE), and compute powerefficiency (CPE) (Section 5.3).
Let T represent a set of independent tasks to be executed, which is subject to aset of QoS constraints such as minimum RAM memory, minimum CPU utilization, andminimum execution time. In this case, the following steps are executed:
1. when a task ti is submitted, the cloud provider calculates the price of ti’s execution (σi)based on the power consumption (Equation (6.1)).
2. the cloud provider tries to place ti in an available resource, using consolidationtechniques to reduce the number of active physical servers.
3. if the cloud provider does not have enough available resources or the energy thresholdwill be violated, the cloud provider first contacts another cloud provider and negotiateswith it the execution of this task. In this case, the price of this execution (Ct) isdefined as shown in equation (6.3).
Ct = σt + ǫt + λt (6.3)
where σt is the financial cost of executing task t based on its power consumption, ǫt
is the cost of the power impact of a task t in the environment, and λt is the cost totransfer a task t to another cloud provider.
4. if the cloud provider does not succeed, it tries to consolidate its VMs consideringthe service-level agreements.
5. If not possible, it tries to negotiate the energy threshold with the CERA and withthe EPP agents.
6. If all negotiations fail, the cloud provider finds the SLA whose violation implies inlower cost, terminates the associated task, and executes the task ti. In this case, theprice to execute the tasks is defined as shown in equation (6.4).
Vt = Ct + γ + δ (6.4)
105

Chapter 6. Power-Aware Server Consolidation for Federated Clouds
where γ is the cost to violate the QoS requirements of other tasks and δ is the costassociated with the power consumption violation.
To control tasks’ allocation, each cloud provider has a 3-dimensional matrix representingthe tasks (ti ∈ T ), the virtual machines (vmj), and physical servers (rz ∈ R), wherer(i, j, z) = 1 iff task ti is allocated at virtual machine vmj in resource rz; 0 indicates thatthe task can be allocated in vmj; and finally, -1 represents that the allocation is impossible.
In order to illustrate our strategy, consider a federated cloud environment with 2clouds (DC1 and DC2) and one user that contracted one cloud to execute him/herapplications. Consider that the contracted cloud (DC1) is overloaded and that theQoS requirements described in the SLAs are based on response time. In this scenario,when the user submits a set of tasks to execute, the cloud provider of DC1 first triesto execute it locally considering power consumption and its available resources. SinceDC1 is overloaded, its cloud provider contacts another data center (DC2) and negotiatesthe execution of the tasks. If DC2 accepts, the cost of the tasks execution is calculatedusing equation (6.3). If DC2 refuses, then DC1 tries to consolidate its virtual machinesand, if not possible, it tries to negotiate the energy threshold with the carbon emissionregulator agency (CERA) and with the electric power provider (EPP) considering thefollowing metrics (Section 5.3): application performance indicators (FLOPS/kWh), datacenter infrastructure efficiency (DCiE), power usage effectiveness (PUE), and computepower efficiency (CPE). If all negotiations fail, then DC1 finds the SLA whose violationsimplies in lower cost and terminates the execution of its associated task. Then, the costto execute the tasks is calculated using equation (6.4).
6.3 Experimental Results
In this section, we evaluate the proposed server consolidation mechanism for federatedclouds. We use the cloud simulator CloudSim [58], which is a well-established cloudsimulator that has been used in many previous works [319, 375, 387], among others,for simulating resource management strategies. CloudSim is a simulation toolkit thatenables modeling and simulation of cloud computing systems and application provisioningenvironments, with support for cloud system components such as data centers, virtualmachines and resource provisioning policies.
6.3.1 Modifications in CloudSim
In order to enable federation and energy regulation capabilities, we added 4 classesto CloudSim, which are described below. CloudSim already implemented the support tomeasure the power consumption of the nodes.
The CloudEnergyRegulation class represents the behavior of the carbon emissionregulator agency (CERA) agent. The CERA communicates with the data center cloudcoordinator to inform the power consumption threshold.
The DatacenterEnergySensor class implements the Sensor interface that monitorsthe power consumption of the data center and informs the coordinator. When the powerconsumption is close to the limit, this sensor creates an event (i.e., CloudSim event) and
106

Chapter 6. Power-Aware Server Consolidation for Federated Clouds
notifies the coordinator. In this case, the coordinator first tries to contact another datacenter to transfer the virtual machines and if the data center does not accept, then thecoordinator tries to consolidate them (Section 6.2).
The FederatedPowerVmAllocationPolicy class extends the VmAllocationPol-icy class to implement our strategy to allocate the virtual machines across the datacenters.
Finally, the CustomerDatacenterBroker class models the QoS requirements cus-tomer behavior, negotiates with the cloud coordinator, and requests the resources.
6.3.2 Simulation Environment
In order to evaluate the effectiveness of our federated application provisioning (FAP)technique, we used a simulation setup that is similar to the one described in [58]. Oursimulation environment included two clouds, each one with one data center (DC1 andDC2) that had 100 hosts each. These hosts were modeled to have one CPU with fourcores with 1000 MIPS, 2GB of RAM and 1TB of storage. The workload model includedprovisioning and allocating for 400 virtual machines. Each virtual machine requestedone CPU core, 256MB of RAM and 1GB of storage. The CPU utilization distributionwas generated according to the Poisson distribution, where each virtual machine required150 MIPS and 1 to 10 minutes to complete execution, assuming a CPU utilization of 20,40, 60, 80 and 100% and a global energy consumption threshold of 3 kWh of energy perdata center. Initially, the provisioner allocates as many as possible virtual machines in asingle host, without violating any constraint of the host. The SLA was defined in terms ofresponse time (10 minutes).
The energy consumption threshold of 3 kWh of energy per data center was chosenbased in the results of the power management technique, presented in [58].
6.3.3 Scenario 1: workload submission to a single data center
under power consumption threshold
In this scenario, tasks are always submitted to data center 1 (DC1). If needed, VMsare migrated from DC1 to DC2. The simulation was repeated 10 times and the meanvalues for energy consumption without our mechanism using only DC1 (trivial), and withour federated application provisioning (FAP) approach are presented in figure 6.3(a).
Figure 6.3(a) shows that the proposed provision technique can reduce the total powerconsumption of the data centers, without SLA violation. In this case, an average re-duction of 46% in the power consumption was achieved since the data center 1 (DC1)consumed more than 9 kWh with the trivial approach (without VM migration) and no morethan 4.8 kWh was consumed in total by both data centers with our approach (2.9 kWh forDC1 and 1.9 kWh for DC2). In order to achieve this, data center 1 (DC1) tried first tomaximize the usage of its resources and to consume the limit of its energy power threshold,without violating the SLAs. Hence, the data center 2 (DC2) was only used in imminenceof SLA violation or when the energy consumption was close to violate the limit. In allcases, the energy consumption for DC1 remained close to the limit.
107

Chapter 6. Power-Aware Server Consolidation for Federated Clouds
20% 40% 60% 80% 100%
DC1 DC2 Without VM migration
CPU utilization threshold
Pow
er
co
nsu
mp
tio
n (
kW
h)
02
46
81
01
2
2.9
1.9
9.1
2.8
9
1.9
2.8
1.7
9.1
2.9
1.5
9.1
2.9
1.4
9.2
(a) Power consumption of the data centers with and without the FAP approach
20% 40% 60% 80% 100%
CPU utilization threshold
Nu
mb
er
of
VM
mig
ratio
ns
05
01
00
15
02
00
186
172168
152148
(b) Number of VM migrated from DC1 to DC2using the FAP approach
20% 40% 60% 80% 100%
FAP (DC1 + DC2) Without VM migration
CPU utilization threshold
Exe
cu
tio
n t
ime
(se
co
nd
s)
05
00
10
00
15
00
20
00
1654
1360
1644
1320
1659
1296
1644
1298
1644
1290
(c) Execution time of the tasks with and withoutthe FAP approach
Figure 6.3: Case study 1: power consumption with 2 data centers under limited power con-sumption
108
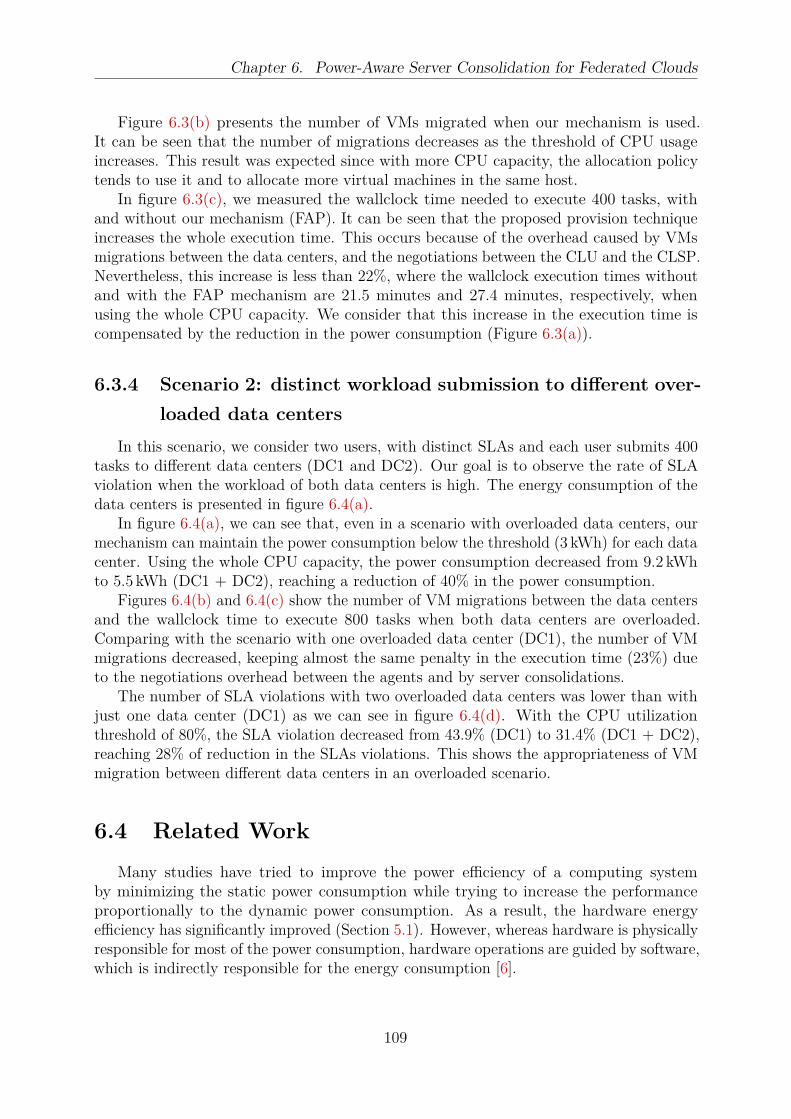
Chapter 6. Power-Aware Server Consolidation for Federated Clouds
Figure 6.3(b) presents the number of VMs migrated when our mechanism is used.It can be seen that the number of migrations decreases as the threshold of CPU usageincreases. This result was expected since with more CPU capacity, the allocation policytends to use it and to allocate more virtual machines in the same host.
In figure 6.3(c), we measured the wallclock time needed to execute 400 tasks, withand without our mechanism (FAP). It can be seen that the proposed provision techniqueincreases the whole execution time. This occurs because of the overhead caused by VMsmigrations between the data centers, and the negotiations between the CLU and the CLSP.Nevertheless, this increase is less than 22%, where the wallclock execution times withoutand with the FAP mechanism are 21.5 minutes and 27.4 minutes, respectively, whenusing the whole CPU capacity. We consider that this increase in the execution time iscompensated by the reduction in the power consumption (Figure 6.3(a)).
6.3.4 Scenario 2: distinct workload submission to different over-
loaded data centers
In this scenario, we consider two users, with distinct SLAs and each user submits 400tasks to different data centers (DC1 and DC2). Our goal is to observe the rate of SLAviolation when the workload of both data centers is high. The energy consumption of thedata centers is presented in figure 6.4(a).
In figure 6.4(a), we can see that, even in a scenario with overloaded data centers, ourmechanism can maintain the power consumption below the threshold (3 kWh) for each datacenter. Using the whole CPU capacity, the power consumption decreased from 9.2 kWhto 5.5 kWh (DC1 + DC2), reaching a reduction of 40% in the power consumption.
Figures 6.4(b) and 6.4(c) show the number of VM migrations between the data centersand the wallclock time to execute 800 tasks when both data centers are overloaded.Comparing with the scenario with one overloaded data center (DC1), the number of VMmigrations decreased, keeping almost the same penalty in the execution time (23%) dueto the negotiations overhead between the agents and by server consolidations.
The number of SLA violations with two overloaded data centers was lower than withjust one data center (DC1) as we can see in figure 6.4(d). With the CPU utilizationthreshold of 80%, the SLA violation decreased from 43.9% (DC1) to 31.4% (DC1 + DC2),reaching 28% of reduction in the SLAs violations. This shows the appropriateness of VMmigration between different data centers in an overloaded scenario.
6.4 Related Work
Many studies have tried to improve the power efficiency of a computing systemby minimizing the static power consumption while trying to increase the performanceproportionally to the dynamic power consumption. As a result, the hardware energyefficiency has significantly improved (Section 5.1). However, whereas hardware is physicallyresponsible for most of the power consumption, hardware operations are guided by software,which is indirectly responsible for the energy consumption [6].
109
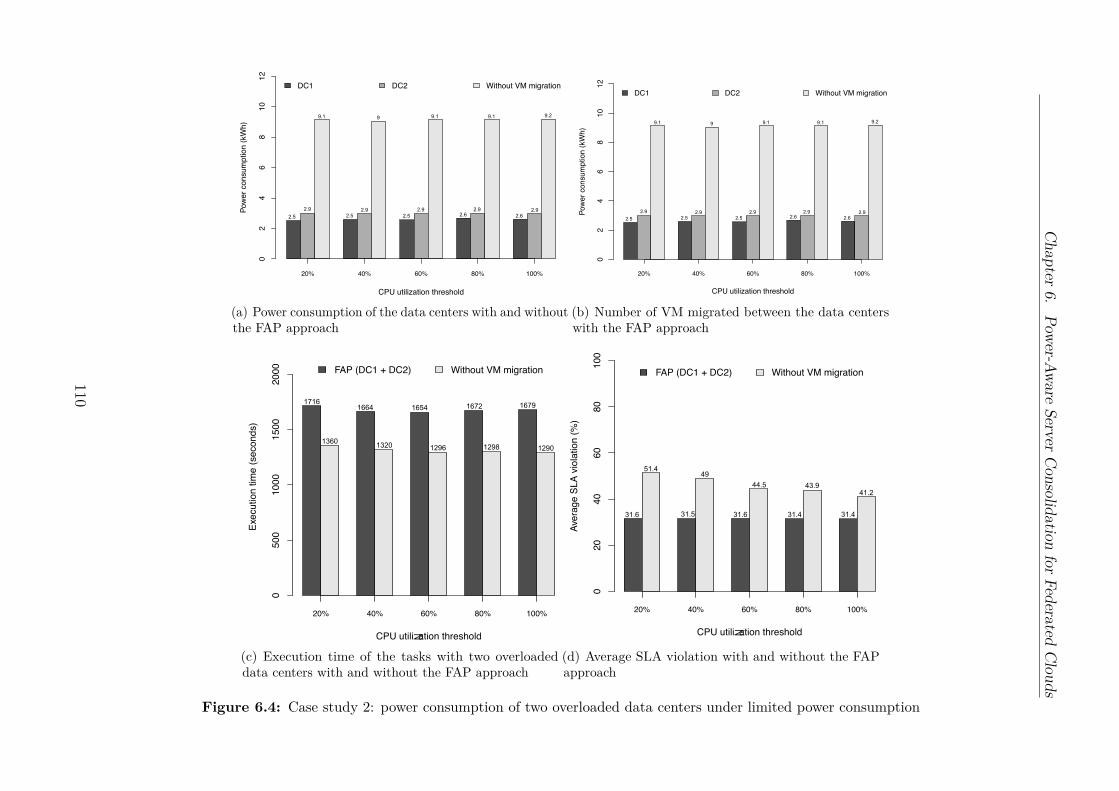
Chapter
6.
Pow
er-Aw
are
Serv
erC
onso
lidatio
nfo
rFed
erated
Clo
uds
20% 40% 60% 80% 100%
DC1 DC2 Without VM migration
CPU utilization threshold
Pow
er
co
nsu
mp
tio
n (
kW
h)
02
46
81
01
2
2.5
2.9
9.1 9 9.1 9.1 9.2
2.5
2.9
2.5
2.9
2.6
2.9
2.6
2.9
(a) Power consumption of the data centers with and withoutthe FAP approach
20% 40% 60% 80% 100%
DC1 DC2 Without VM migration
CPU utilization threshold
Pow
er
co
nsu
mp
tio
n (
kW
h)
02
46
81
01
2
2.5
2.9
9.1 9 9.1 9.1 9.2
2.5
2.9
2.5
2.9
2.6
2.9
2.6
2.9
(b) Number of VM migrated between the data centerswith the FAP approach
20% 40% 60% 80% 100%
FAP (DC1 + DC2) Without VM migration
CPU utilization threshold
Exe
cu
tio
n t
ime
(se
co
nd
s)
05
00
10
00
15
00
20
00
1716
1360
1664
1320
1654
1296
1672
1298
1679
1290
(c) Execution time of the tasks with two overloadeddata centers with and without the FAP approach
20% 40% 60% 80% 100%
FAP (DC1 + DC2) Without VM migration
CPU utilization threshold
Ave
rage S
LA
vio
lation (
%)
020
40
60
80
100
31.6
51.4
31.5
49
31.6
44.5
31.4
43.9
31.4
41.2
(d) Average SLA violation with and without the FAPapproach
Figure 6.4: Case study 2: power consumption of two overloaded data centers under limited power consumption
110
Chapter 6. Power-Aware Server Consolidation for Federated Clouds
Some of the studies reported in literature try to minimize the power consumption fromthe data center perspective, considering that the main reason for energy inefficiency isresource underutilization. One of the first approaches to try to solve this problem consistsof shutting down idle nodes [193, 251] and waking them up when the workload increasesor the average QoS violation ratio exceeds a threshold.
At the hardware level, improvements are made turning off components, putting themto sleep or changing their frequency using dynamic voltage and frequency scaling (DVFS)techniques (Section 5.1). For example, in [195], a power-aware DVFS based cluster schedul-ing algorithm is presented taking into account performance constraints. The proposedalgorithm selects the appropriate supply voltages that minimize energy consumption ofthe resources. Simulation results show that the proposed scheduling algorithm can reducethe power consumption with an increase in the execution time.
In [155], the authors describe a virtual machine placement framework called Entropy.Entropy aims to minimize the number of physical hosts to allocate the virtual machines,without violating any constraints (e.g., memory size and number of CPUs). Its placementprocess comprises two phases. The first phase identifies the nodes that have sufficientresources (i.e., RAM and CPU) to host a VM, and the second one allocates the VMs tryingto minimize both the number of physical hosts and the number of VM migrations. Thesetwo phases use constraint programming to find out a feasible global solution. Experimentsrealized in the Grid’5000 testbed (www.grid5000.fr) show that constraint programmingoutperforms the first-fit decreasing (FDD) algorithm with regard to the number of VMmigrations and power savings. In [103], the authors use Entropy to allocate VMs in afederated cloud environment, taking into account power consumption and CO2 emissions.Experimental results show a power saving of almost 22% when considering only power anda saving of almost 19% when the allocations considering both power and CO2 emissions.The experiments considered two federated clouds, and they used two synthetic workloads.
In [356], the authors present pMapper, a power and VM placement framework. Itsarchitecture comprises three different managers: performance, migration, and power. InpMapper, a sensor collects the current performance and power characteristics of bothvirtual and physical machines. Then, it sends these data to the performance and powermanagers. After, the performance manager analyses the data, and based on SLA violations,it suggests to resize the VMs. Similarly, the power manager based on the current powerconsumption suggests power throttling actions (e.g., DVFS). Based on these suggestions,an arbitrator component selects a configuration, and defines the physical machines tohost the VMs, as well as the characteristics of each VM. Finally, the managers resize andmigrate the VMs. Since heterogeneous platforms are considered, each manager consults aknowledge database to determine the cost of a VM migration in the performance of itsapplications, as well as in the power consumption. pMapper implements three algorithmscalled: min Power Parity (mPP), min Power Placement with history (mPPH), and PMaP.The mPP algorithm attempts to allocate the VMs in order to minimize the total powerconsumption, without taking into account the current placement of the VMs. Hence, themPP algorithm results in a high number of migrations. The mPPH, on the other hand,extends the mPP to minimize VM migrations. However, its efficiency with regard tominimizing the power consumption is low. Finally, the PMaP tries to find out an allocationthat minimizes both power consumption and VM migrations. Experimental results showthat the mPP and mPPH algorithms can reduce 25% of the power consumption when the
111
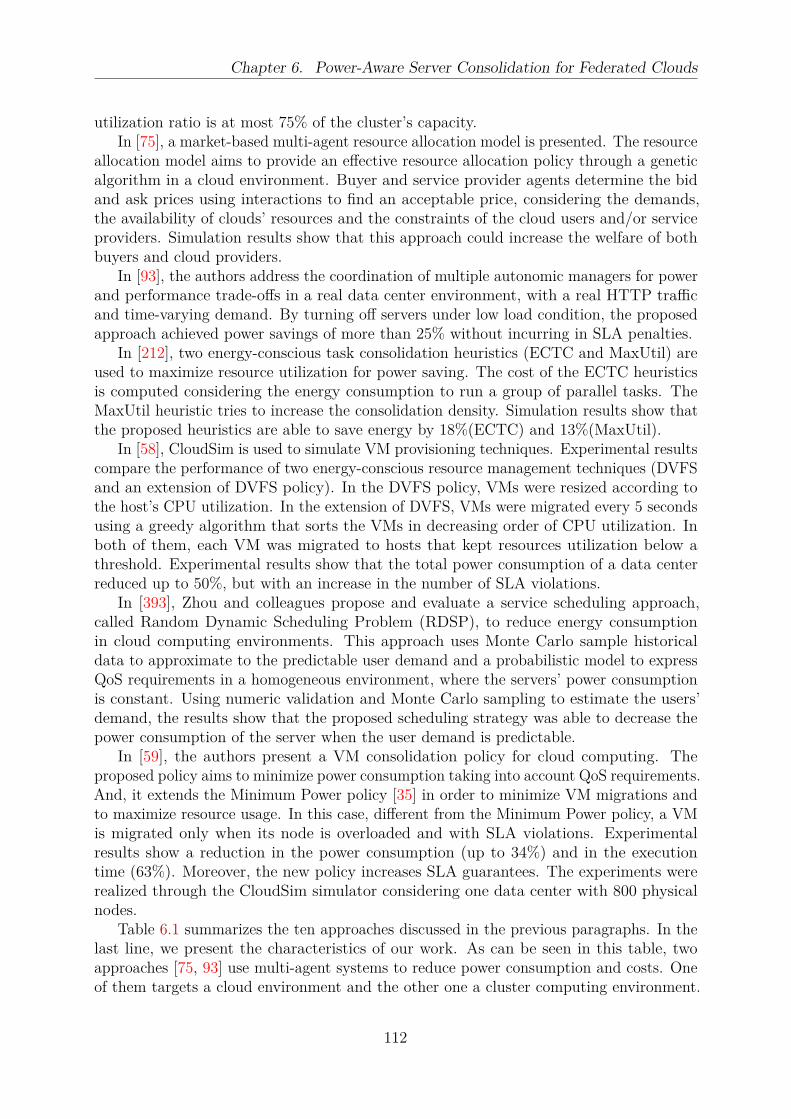
Chapter 6. Power-Aware Server Consolidation for Federated Clouds
utilization ratio is at most 75% of the cluster’s capacity.In [75], a market-based multi-agent resource allocation model is presented. The resource
allocation model aims to provide an effective resource allocation policy through a geneticalgorithm in a cloud environment. Buyer and service provider agents determine the bidand ask prices using interactions to find an acceptable price, considering the demands,the availability of clouds’ resources and the constraints of the cloud users and/or serviceproviders. Simulation results show that this approach could increase the welfare of bothbuyers and cloud providers.
In [93], the authors address the coordination of multiple autonomic managers for powerand performance trade-offs in a real data center environment, with a real HTTP trafficand time-varying demand. By turning off servers under low load condition, the proposedapproach achieved power savings of more than 25% without incurring in SLA penalties.
In [212], two energy-conscious task consolidation heuristics (ECTC and MaxUtil) areused to maximize resource utilization for power saving. The cost of the ECTC heuristicsis computed considering the energy consumption to run a group of parallel tasks. TheMaxUtil heuristic tries to increase the consolidation density. Simulation results show thatthe proposed heuristics are able to save energy by 18%(ECTC) and 13%(MaxUtil).
In [58], CloudSim is used to simulate VM provisioning techniques. Experimental resultscompare the performance of two energy-conscious resource management techniques (DVFSand an extension of DVFS policy). In the DVFS policy, VMs were resized according tothe host’s CPU utilization. In the extension of DVFS, VMs were migrated every 5 secondsusing a greedy algorithm that sorts the VMs in decreasing order of CPU utilization. Inboth of them, each VM was migrated to hosts that kept resources utilization below athreshold. Experimental results show that the total power consumption of a data centerreduced up to 50%, but with an increase in the number of SLA violations.
In [393], Zhou and colleagues propose and evaluate a service scheduling approach,called Random Dynamic Scheduling Problem (RDSP), to reduce energy consumptionin cloud computing environments. This approach uses Monte Carlo sample historicaldata to approximate to the predictable user demand and a probabilistic model to expressQoS requirements in a homogeneous environment, where the servers’ power consumptionis constant. Using numeric validation and Monte Carlo sampling to estimate the users’demand, the results show that the proposed scheduling strategy was able to decrease thepower consumption of the server when the user demand is predictable.
In [59], the authors present a VM consolidation policy for cloud computing. Theproposed policy aims to minimize power consumption taking into account QoS requirements.And, it extends the Minimum Power policy [35] in order to minimize VM migrations andto maximize resource usage. In this case, different from the Minimum Power policy, a VMis migrated only when its node is overloaded and with SLA violations. Experimentalresults show a reduction in the power consumption (up to 34%) and in the executiontime (63%). Moreover, the new policy increases SLA guarantees. The experiments wererealized through the CloudSim simulator considering one data center with 800 physicalnodes.
Table 6.1 summarizes the ten approaches discussed in the previous paragraphs. In thelast line, we present the characteristics of our work. As can be seen in this table, twoapproaches [75, 93] use multi-agent systems to reduce power consumption and costs. Oneof them targets a cloud environment and the other one a cluster computing environment.
112
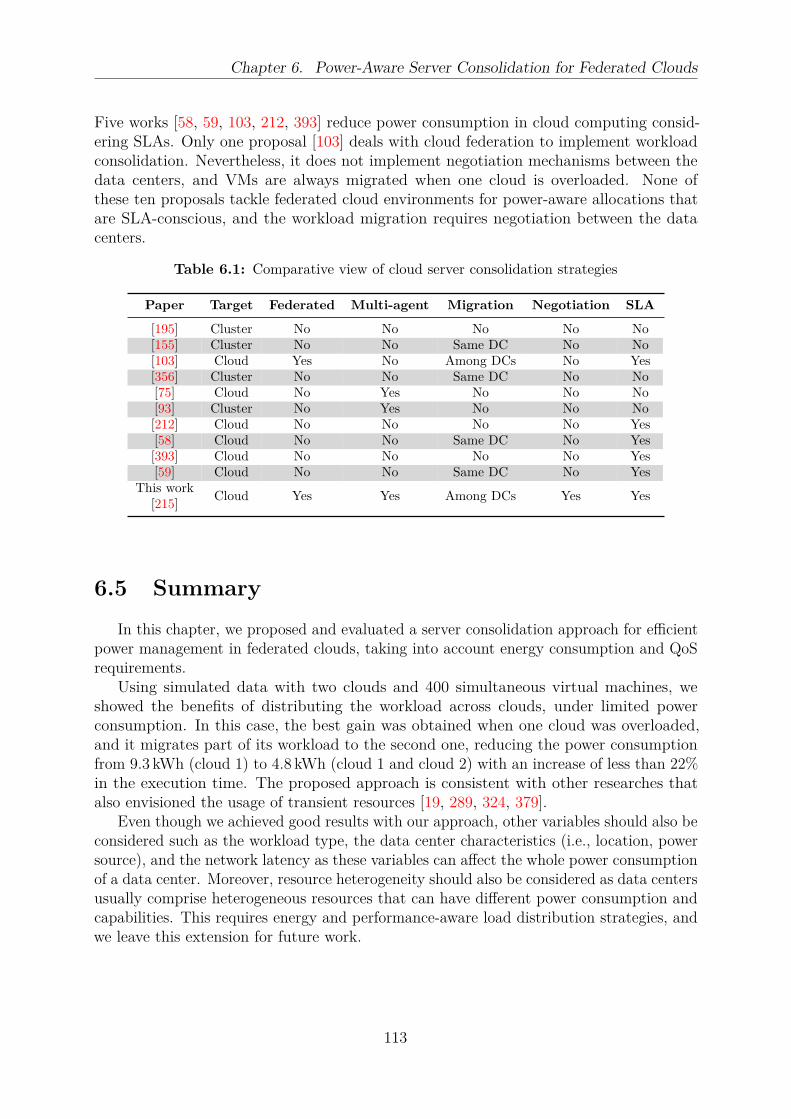
Chapter 6. Power-Aware Server Consolidation for Federated Clouds
Five works [58, 59, 103, 212, 393] reduce power consumption in cloud computing consid-ering SLAs. Only one proposal [103] deals with cloud federation to implement workloadconsolidation. Nevertheless, it does not implement negotiation mechanisms between thedata centers, and VMs are always migrated when one cloud is overloaded. None ofthese ten proposals tackle federated cloud environments for power-aware allocations thatare SLA-conscious, and the workload migration requires negotiation between the datacenters.
Table 6.1: Comparative view of cloud server consolidation strategies
Paper Target Federated Multi-agent Migration Negotiation SLA
[195] Cluster No No No No No[155] Cluster No No Same DC No No[103] Cloud Yes No Among DCs No Yes[356] Cluster No No Same DC No No[75] Cloud No Yes No No No[93] Cluster No Yes No No No[212] Cloud No No No No Yes[58] Cloud No No Same DC No Yes[393] Cloud No No No No Yes[59] Cloud No No Same DC No Yes
This work[215]
Cloud Yes Yes Among DCs Yes Yes
6.5 Summary
In this chapter, we proposed and evaluated a server consolidation approach for efficientpower management in federated clouds, taking into account energy consumption and QoSrequirements.
Using simulated data with two clouds and 400 simultaneous virtual machines, weshowed the benefits of distributing the workload across clouds, under limited powerconsumption. In this case, the best gain was obtained when one cloud was overloaded,and it migrates part of its workload to the second one, reducing the power consumptionfrom 9.3 kWh (cloud 1) to 4.8 kWh (cloud 1 and cloud 2) with an increase of less than 22%in the execution time. The proposed approach is consistent with other researches thatalso envisioned the usage of transient resources [19, 289, 324, 379].
Even though we achieved good results with our approach, other variables should also beconsidered such as the workload type, the data center characteristics (i.e., location, powersource), and the network latency as these variables can affect the whole power consumptionof a data center. Moreover, resource heterogeneity should also be considered as data centersusually comprise heterogeneous resources that can have different power consumption andcapabilities. This requires energy and performance-aware load distribution strategies, andwe leave this extension for future work.
113

Chapter 7
Biological Sequence Comparison at
Zero-Cost on a Vertical Public Cloud
Federation
Contents
7.1 Introduction and Motivation . . . . . . . . . . . . . . . . . . . . 115
7.2 Biological Sequence Comparison . . . . . . . . . . . . . . . . . 116
7.2.1 The Smith-Waterman Algorithm . . . . . . . . . . . . . . . . . 117
7.3 Design of our Federated Cloud Architecture . . . . . . . . . . 118
7.3.1 Task Generation with MapReduce . . . . . . . . . . . . . . . . 120
7.3.2 Smith-Waterman Execution . . . . . . . . . . . . . . . . . . . . 120
7.4 Experimental Results . . . . . . . . . . . . . . . . . . . . . . . . 121
7.5 Related Work . . . . . . . . . . . . . . . . . . . . . . . . . . . . . 125
7.6 Summary . . . . . . . . . . . . . . . . . . . . . . . . . . . . . . . 126
The previous chapter showed us that cloud federation can help the providers onreducing the power consumption of the clouds, by migrating the tasks according to thedata center workload and the SLA violation ratio. In this chapter, we aim to use thecloud federation considering the software developers viewpoint. In other words, we aim toaggregate resources from different type of cloud providers (e.g., PaaS and IaaS) to executea biological sequence comparison application at reduced-cost. Therefore, we presentand evaluate a cloud architecture to execute a native cloud application on federatedclouds at zero-cost. Our architecture follows a hierarchical and distributed managementstrategy to connect and to manage the services offered by PaaS and IaaS clouds, thus,being an architecture for vertical federated clouds (Section 3.2.3.2). The applicationis a biological sequence comparison application, which was implemented following theMapReduce (Section 3.1.3) programming model.
114
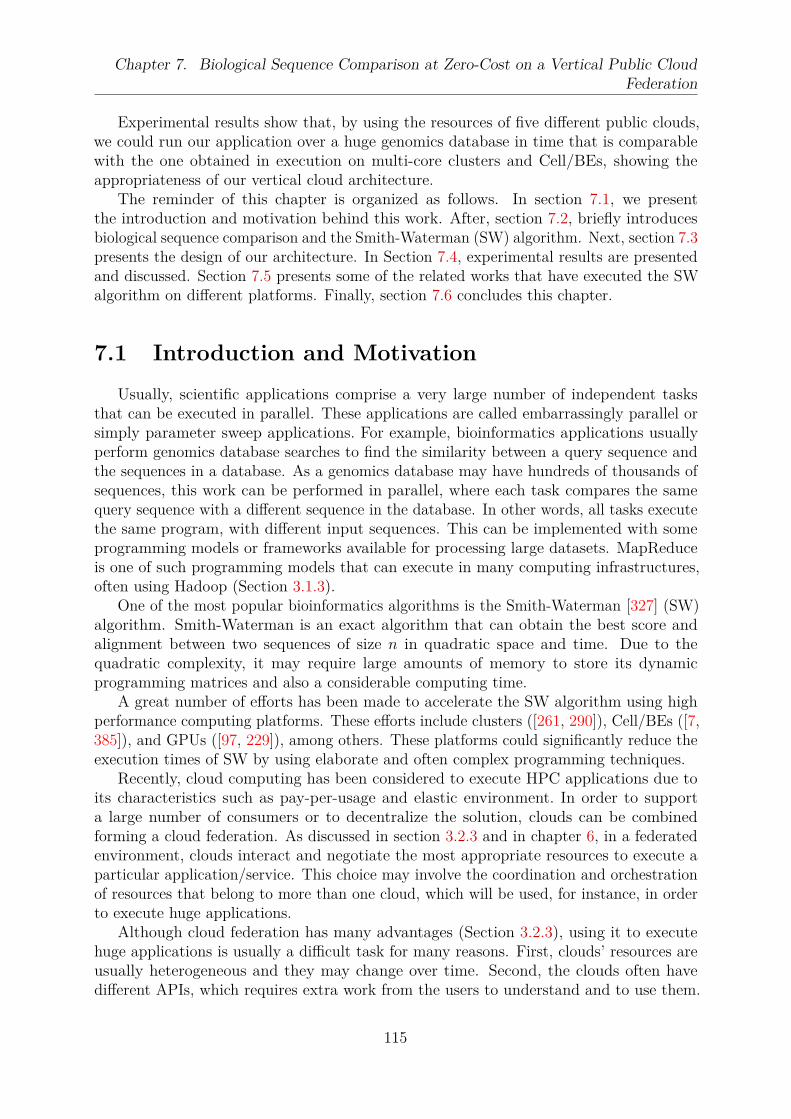
Chapter 7. Biological Sequence Comparison at Zero-Cost on a Vertical Public Cloud
Federation
Experimental results show that, by using the resources of five different public clouds,we could run our application over a huge genomics database in time that is comparablewith the one obtained in execution on multi-core clusters and Cell/BEs, showing theappropriateness of our vertical cloud architecture.
The reminder of this chapter is organized as follows. In section 7.1, we presentthe introduction and motivation behind this work. After, section 7.2, briefly introducesbiological sequence comparison and the Smith-Waterman (SW) algorithm. Next, section 7.3presents the design of our architecture. In Section 7.4, experimental results are presentedand discussed. Section 7.5 presents some of the related works that have executed the SWalgorithm on different platforms. Finally, section 7.6 concludes this chapter.
7.1 Introduction and Motivation
Usually, scientific applications comprise a very large number of independent tasksthat can be executed in parallel. These applications are called embarrassingly parallel orsimply parameter sweep applications. For example, bioinformatics applications usuallyperform genomics database searches to find the similarity between a query sequence andthe sequences in a database. As a genomics database may have hundreds of thousands ofsequences, this work can be performed in parallel, where each task compares the samequery sequence with a different sequence in the database. In other words, all tasks executethe same program, with different input sequences. This can be implemented with someprogramming models or frameworks available for processing large datasets. MapReduceis one of such programming models that can execute in many computing infrastructures,often using Hadoop (Section 3.1.3).
One of the most popular bioinformatics algorithms is the Smith-Waterman [327] (SW)algorithm. Smith-Waterman is an exact algorithm that can obtain the best score andalignment between two sequences of size n in quadratic space and time. Due to thequadratic complexity, it may require large amounts of memory to store its dynamicprogramming matrices and also a considerable computing time.
A great number of efforts has been made to accelerate the SW algorithm using highperformance computing platforms. These efforts include clusters ([261, 290]), Cell/BEs ([7,385]), and GPUs ([97, 229]), among others. These platforms could significantly reduce theexecution times of SW by using elaborate and often complex programming techniques.
Recently, cloud computing has been considered to execute HPC applications due toits characteristics such as pay-per-usage and elastic environment. In order to supporta large number of consumers or to decentralize the solution, clouds can be combinedforming a cloud federation. As discussed in section 3.2.3 and in chapter 6, in a federatedenvironment, clouds interact and negotiate the most appropriate resources to execute aparticular application/service. This choice may involve the coordination and orchestrationof resources that belong to more than one cloud, which will be used, for instance, in orderto execute huge applications.
Although cloud federation has many advantages (Section 3.2.3), using it to executehuge applications is usually a difficult task for many reasons. First, clouds’ resources areusually heterogeneous and they may change over time. Second, the clouds often havedifferent APIs, which requires extra work from the users to understand and to use them.
115

Chapter 7. Biological Sequence Comparison at Zero-Cost on a Vertical Public Cloud
Federation
Third, the resources mostly have unpredictable performance, even for resources of thesame type. Fourth, most of the users’ applications are cloud-unaware, which may not fitthe constraints of a cloud environment.
In this context, MapReduce (Section 3.1.3) may help us to dismiss these difficulties asit provides an application model that can run on multiple clouds. Also, its implementationis decoupled from the cloud provider or any particular infrastructure. Finally, it can easilyhandle performance changing and node failures.
As noted in section 2.5, clouds usually employ the pay-as-you-go model. Nonetheless,the majority of the clouds also provide resources at zero-cost, in a category called usuallyas “free-quota”. The resources from the free-quota category have limited capacity such aslow CPU frequency and a small amount of RAM memory. Thus, we want to investigateif a federated execution exclusively in the free-quota (i.e., at zero-cost) can yield goodexecution times.
Therefore, in this chapter we describe our approach to execute the SW algorithm in acloud federation. Since the cloud providers are unaware of the federation, our proposalis classified as a multi-cloud (Section 3.2.3.2). Our approach has two main components:(a) an architecture that can transparently connect and manage multiple clouds, thuscreating a federated cloud environment; and (b) an implementation of the MapReduceversion of SW in this architecture. The proposed architecture is hierarchical in such a waythat one of the clouds is the cloud coordinator, which distributes the tasks to be executed;and the other clouds are the workers responsible for executing a MapReduce version ofthe SW algorithm over the piece of computation received from the coordinator. This workwas published in [214].
The reminder of this chapter is organized as follows. First, we provide a brief introduc-tion for biological sequence comparison followed by a description of the Smith-Watermanalgorithm (Section 7.2). Next, we present the proposed architecture (Section 7.3) and theexperimental results realized in a public cloud federation scenario (Section 7.4). Finally,we discuss some of the related works that have executed the SW algorithm in differentplatforms (Section 7.5) followed by some considerations and future work.
7.2 Biological Sequence Comparison
A biological sequence is represented by a linear list of residues, which are nucleotidebases (for DNA and RNA sequences) or amino acids (for protein sequences). To comparebiological sequences, we need to find the best alignment between them, which is to placeone sequence above the other making clear the correspondence between similar residuesfrom the sequences [104].
Given an alignment between two sequences s and t, a score can be associated forit as follows. For each two bases in the same column, we associate (a) a punctuationma, if both characters are identical (match); or (b) a penalty mi, if the characters aredifferent (mismatch); or (c) a penalty g, if one of the characters is a space (gap). Thescore is the sum of all these values and the maximal score is called the similarity betweenthe sequences.
Figure 7.1 illustrates a possible alignment and score between DNA sequences: S0 =ACATGTCCGAG and S1 = ATTGTCAGGAG.
116

Chapter 7. Biological Sequence Comparison at Zero-Cost on a Vertical Public Cloud
Federation
A C A T G T C C G − A G
A − T T G T C A G G A G
+1 −2 −1 +1 +1 +1 +1 −1 +1 −2 +1 +1︸ ︷︷ ︸
score = 2
Figure 7.1: Computing the alignment and the score of two biological sequences, where ma =+1, mi = −1 and g = −2
If proteins are being compared, a substitution matrix of size 20 x 20 is used to storethe match/mismatch punctuation. The most commonly used substitution matrices arePAM and BLOSUM [255].
7.2.1 The Smith-Waterman Algorithm
The Smith-Waterman algorithm (SW) [327] is an exact algorithm based on dynamicprogramming to obtain the best local alignment between two sequences in quadratic timeand space. It is divided in two phases: create the similarity matrix and obtain the bestlocal alignment.
The first phase receives as input sequences s and t, with |s| = m and |t| = n, where |s|represents the size of a sequence s. Typically, s and t can range from few characters tothousands of characters. The notation used to represent the n-th character of a sequenceseq is seq[n] and, to represent a prefix with n characters, from the beginning of the sequence,we use seq[1..n]. The similarity matrix is denoted as A and each element contains thesimilarity score between the prefixes s[1..i] and t[1..j], i < m + 1 ∧ j < n + 1.
At the beginning, the first row and column are filled with zeros. The remaining elementsof A are obtained from equation (7.1). The SW score between sequences s and t is thehighest value contained in matrix A.
Ai,j = max
Ai−1,j−1 + (if s[i] = s[j] then ma else mi)
Ai,j−1 − g
Ai−1,j − g
0
(7.1)
The second phase is executed to obtain the best local alignment. The algorithm startsfrom the cell that contains the highest value and follows the arrows until a zero-valuedcell is reached. A left arrow in Ai,j (Figure 7.2) indicates the alignment of s[i] with a gapin t. An up arrow represents the alignment of t[j] with a gap in s. Finally, an arrow inthe diagonal indicates that s[i] is aligned with t[j].
In the next section, we describe how the SW is executed in a multi-cloud environment.
117

Chapter 7. Biological Sequence Comparison at Zero-Cost on a Vertical Public Cloud
Federation
* G A G C T A T G A G G* 0 0 0 0 0 0 0 0 0 0 0 0T 0 0 0 0 0 1 0 1 0 0 0 0A 0 0 1 0 0 0 2 0 0 1 0 0T 0 0 0 0 0 1 0 3 1 0 0 0A 0 0 1 0 0 0 2 1 2 2 0 0G 0 1 0 2 0 0 0 1 2 1 3 1G 0 1 0 1 1 0 0 0 2 1 2 4T 0 0 0 0 0 2 0 1 0 1 0 2A 0 0 1
aa
0 0 0 3 1 0 1 0 0G 0 1 0 2
aa
0 0 1 2 2 0 2 1C 0 0 0 0 3
aa
1 0 0 1 1 0 1T 0 0 0 0 1 4
aa
2 1 0 0 0 0A 0 0 1 0 0 2 5
aa
3 1 1 0 0
Figure 7.2: Smith-Waterman similarity matrix for sequences s = TATAGGTAGCTA and t =GAGCTATGAGG. In this example, the alignment has score = 5.
7.3 Design of our Federated Cloud Architecture
Our architecture assumes a hierarchical and multi-cloud environment. In addition, weassume that resource usage is limited. This limitation is not due to the cloud environmentitself, but it is associated with financial constraints. In an extreme scenario, the use ofcloud resources by the applications is limited by the free-quota offered by each cloud.
In our architecture, there is a coordinator responsible for the whole execution, and forinteracting with the user and the multiple clouds. Each cloudi has a cloud master and aset of slave instances. The cloud master is responsible for executing the tasks assigned toits cloud; and the slave instances are the ones that actually execute the tasks.
The proposed architecture, depicted in figure 7.3, comprises four layers: User, Storage,Communication, and Execution.
The User layer provides a graphical user interface (GUI) to submit the MapReduceapplications, as well as the input files. In the case of the SW application, there are twoinput files. The first file contains a set of biological query sequences and the second onecontains a genomics database, which is composed of a huge set of biological sequences.
At the Storage layer, the input files are persisted into a storage system and the tasksare created using the MapReduce model. In this case, we create one task for each entry ofthe map function and enqueue the task into the coordinator queue in the reduce function.In other words, a task executes one SW comparison.
The Communication layer implements transparent communication among the cloudsand transparent access to the cloud database. In this layer, generic requests are trans-lated to specific requests according to the cloud master environment. This creates ahomogeneous API to access the federated resources, and it reduces the needs of the usersknowing about the limitation of each cloud provider such as maximum request size, requesttimeouts, and commands to interact with the environment.
118

Chapter 7. Biological Sequence Comparison at Zero-Cost on a Vertical Public Cloud
Federation
Job Controller
MapReduce
Communication Layer
Cloud master1 Cloud mastern
Slave1 Slavex….
Input Queue Output Queue
Clo
ud
Co
ord
inato
r
Storage
User Layer
Storage Layer
Slave1 Slavey
Input Queue Output Queue
….
Execu
tio
n L
ayer
….
Figure 7.3: Federated cloud architecture to execute MapReduce applications
In each cloud, there is an input and an output queue which are shared by the slaveinstances, containing the tasks to be executed. At the Execution layer, each cloud masterreceives the tasks and stores them into the input queue. Slave machines retrieve tasksfrom this queue, process them and store the result into the output queue.
The architecture uses the HTTP protocol to implement message exchanges between themasters and the slaves. A well-defined interface is defined to accept either data requests orcomputational task requests. The body of a message can be either XML or JSON followingthe REST architecture style [116]. The HTTP methods are used as following: (i) thePOST method is used to submit a task; (ii) the GET method is called to obtain informationabout the cloud or about the status of the a task; and (iii) the DELETE method is usedto delete a task. Figure 7.4 presents the types of messages and their associations.
- failure : Exception- code : int- time : Date
Result
+ run() : void- owner : URL- createdIn : Date- id : Long
Job
- value : StringSequence
- database : StringSequences
1..*
0..*
Taskquery
target
<<enum>>State
state
Score
computation
Alignment
state
Figure 7.4: Type of the messages exchanged in our multi-cloud architecture
119
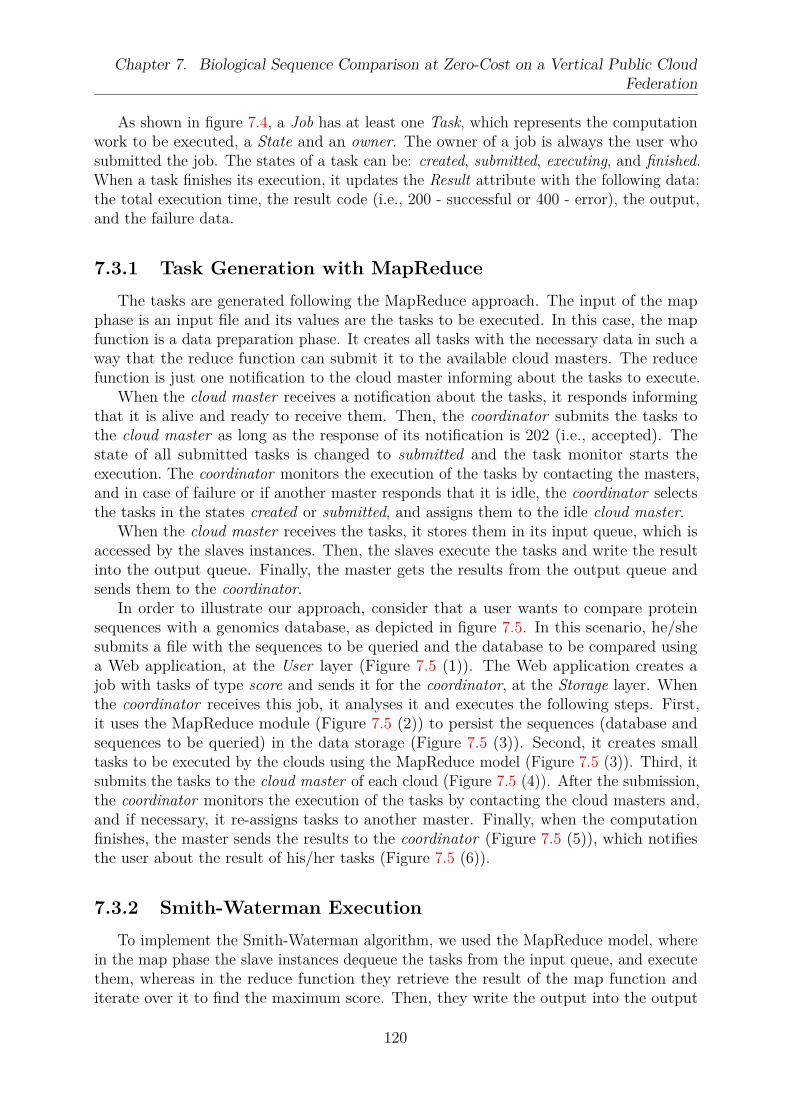
Chapter 7. Biological Sequence Comparison at Zero-Cost on a Vertical Public Cloud
Federation
As shown in figure 7.4, a Job has at least one Task, which represents the computationwork to be executed, a State and an owner. The owner of a job is always the user whosubmitted the job. The states of a task can be: created, submitted, executing, and finished.When a task finishes its execution, it updates the Result attribute with the following data:the total execution time, the result code (i.e., 200 - successful or 400 - error), the output,and the failure data.
7.3.1 Task Generation with MapReduce
The tasks are generated following the MapReduce approach. The input of the mapphase is an input file and its values are the tasks to be executed. In this case, the mapfunction is a data preparation phase. It creates all tasks with the necessary data in such away that the reduce function can submit it to the available cloud masters. The reducefunction is just one notification to the cloud master informing about the tasks to execute.
When the cloud master receives a notification about the tasks, it responds informingthat it is alive and ready to receive them. Then, the coordinator submits the tasks tothe cloud master as long as the response of its notification is 202 (i.e., accepted). Thestate of all submitted tasks is changed to submitted and the task monitor starts theexecution. The coordinator monitors the execution of the tasks by contacting the masters,and in case of failure or if another master responds that it is idle, the coordinator selectsthe tasks in the states created or submitted, and assigns them to the idle cloud master.
When the cloud master receives the tasks, it stores them in its input queue, which isaccessed by the slaves instances. Then, the slaves execute the tasks and write the resultinto the output queue. Finally, the master gets the results from the output queue andsends them to the coordinator.
In order to illustrate our approach, consider that a user wants to compare proteinsequences with a genomics database, as depicted in figure 7.5. In this scenario, he/shesubmits a file with the sequences to be queried and the database to be compared usinga Web application, at the User layer (Figure 7.5 (1)). The Web application creates ajob with tasks of type score and sends it for the coordinator, at the Storage layer. Whenthe coordinator receives this job, it analyses it and executes the following steps. First,it uses the MapReduce module (Figure 7.5 (2)) to persist the sequences (database andsequences to be queried) in the data storage (Figure 7.5 (3)). Second, it creates smalltasks to be executed by the clouds using the MapReduce model (Figure 7.5 (3)). Third, itsubmits the tasks to the cloud master of each cloud (Figure 7.5 (4)). After the submission,the coordinator monitors the execution of the tasks by contacting the cloud masters and,and if necessary, it re-assigns tasks to another master. Finally, when the computationfinishes, the master sends the results to the coordinator (Figure 7.5 (5)), which notifiesthe user about the result of his/her tasks (Figure 7.5 (6)).
7.3.2 Smith-Waterman Execution
To implement the Smith-Waterman algorithm, we used the MapReduce model, wherein the map phase the slave instances dequeue the tasks from the input queue, and executethem, whereas in the reduce function they retrieve the result of the map function anditerate over it to find the maximum score. Then, they write the output into the output
120
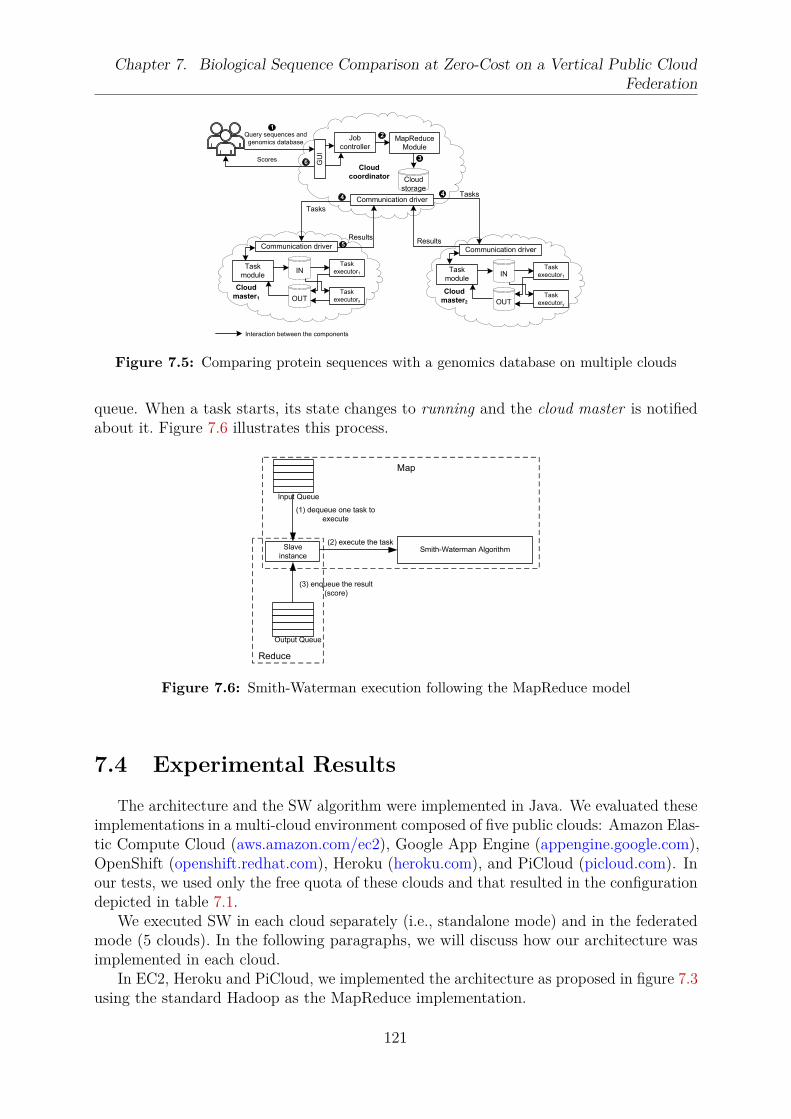
Chapter 7. Biological Sequence Comparison at Zero-Cost on a Vertical Public Cloud
Federation
Communication driver
Cloud
storage
Cloud
coordinator
Job
controllerMapReduce
Module
Communication driver
Cloud
master1
Task
module
OUT
INTask
executor1
Task
executorx
Communication driver
Cloud
master2
Task
module
OUT
INTask
executor1
Task
executory
Tasks
ResultsResults
Tasks
Query sequences and
genomics database
Scores
GU
I
2
3
44
5
6
Interaction between the components
1
Figure 7.5: Comparing protein sequences with a genomics database on multiple clouds
queue. When a task starts, its state changes to running and the cloud master is notifiedabout it. Figure 7.6 illustrates this process.
Input Queue
Output Queue
Smith-Waterman AlgorithmSlave
instance
(1) dequeue one task to
execute
(3) enqueue the result
(score)
(2) execute the task
Map
Reduce
Figure 7.6: Smith-Waterman execution following the MapReduce model
7.4 Experimental Results
The architecture and the SW algorithm were implemented in Java. We evaluated theseimplementations in a multi-cloud environment composed of five public clouds: Amazon Elas-tic Compute Cloud (aws.amazon.com/ec2), Google App Engine (appengine.google.com),OpenShift (openshift.redhat.com), Heroku (heroku.com), and PiCloud (picloud.com). Inour tests, we used only the free quota of these clouds and that resulted in the configurationdepicted in table 7.1.
We executed SW in each cloud separately (i.e., standalone mode) and in the federatedmode (5 clouds). In the following paragraphs, we will discuss how our architecture wasimplemented in each cloud.
In EC2, Heroku and PiCloud, we implemented the architecture as proposed in figure 7.3using the standard Hadoop as the MapReduce implementation.
121
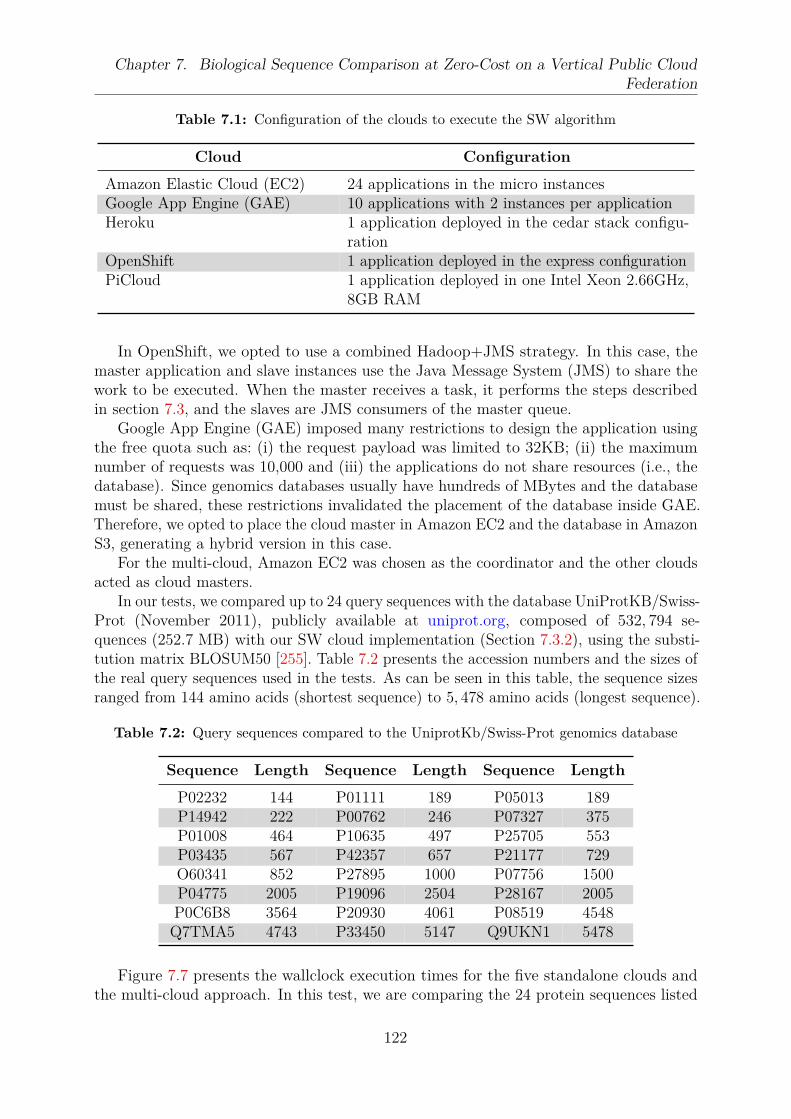
Chapter 7. Biological Sequence Comparison at Zero-Cost on a Vertical Public Cloud
Federation
Table 7.1: Configuration of the clouds to execute the SW algorithm
Cloud Configuration
Amazon Elastic Cloud (EC2) 24 applications in the micro instancesGoogle App Engine (GAE) 10 applications with 2 instances per applicationHeroku 1 application deployed in the cedar stack configu-
rationOpenShift 1 application deployed in the express configurationPiCloud 1 application deployed in one Intel Xeon 2.66GHz,
8GB RAM
In OpenShift, we opted to use a combined Hadoop+JMS strategy. In this case, themaster application and slave instances use the Java Message System (JMS) to share thework to be executed. When the master receives a task, it performs the steps describedin section 7.3, and the slaves are JMS consumers of the master queue.
Google App Engine (GAE) imposed many restrictions to design the application usingthe free quota such as: (i) the request payload was limited to 32KB; (ii) the maximumnumber of requests was 10,000 and (iii) the applications do not share resources (i.e., thedatabase). Since genomics databases usually have hundreds of MBytes and the databasemust be shared, these restrictions invalidated the placement of the database inside GAE.Therefore, we opted to place the cloud master in Amazon EC2 and the database in AmazonS3, generating a hybrid version in this case.
For the multi-cloud, Amazon EC2 was chosen as the coordinator and the other cloudsacted as cloud masters.
In our tests, we compared up to 24 query sequences with the database UniProtKB/Swiss-Prot (November 2011), publicly available at uniprot.org, composed of 532, 794 se-quences (252.7 MB) with our SW cloud implementation (Section 7.3.2), using the substi-tution matrix BLOSUM50 [255]. Table 7.2 presents the accession numbers and the sizes ofthe real query sequences used in the tests. As can be seen in this table, the sequence sizesranged from 144 amino acids (shortest sequence) to 5, 478 amino acids (longest sequence).
Table 7.2: Query sequences compared to the UniprotKb/Swiss-Prot genomics database
Sequence Length Sequence Length Sequence Length
P02232 144 P01111 189 P05013 189P14942 222 P00762 246 P07327 375P01008 464 P10635 497 P25705 553P03435 567 P42357 657 P21177 729O60341 852 P27895 1000 P07756 1500P04775 2005 P19096 2504 P28167 2005P0C6B8 3564 P20930 4061 P08519 4548Q7TMA5 4743 P33450 5147 Q9UKN1 5478
Figure 7.7 presents the wallclock execution times for the five standalone clouds andthe multi-cloud approach. In this test, we are comparing the 24 protein sequences listed
122
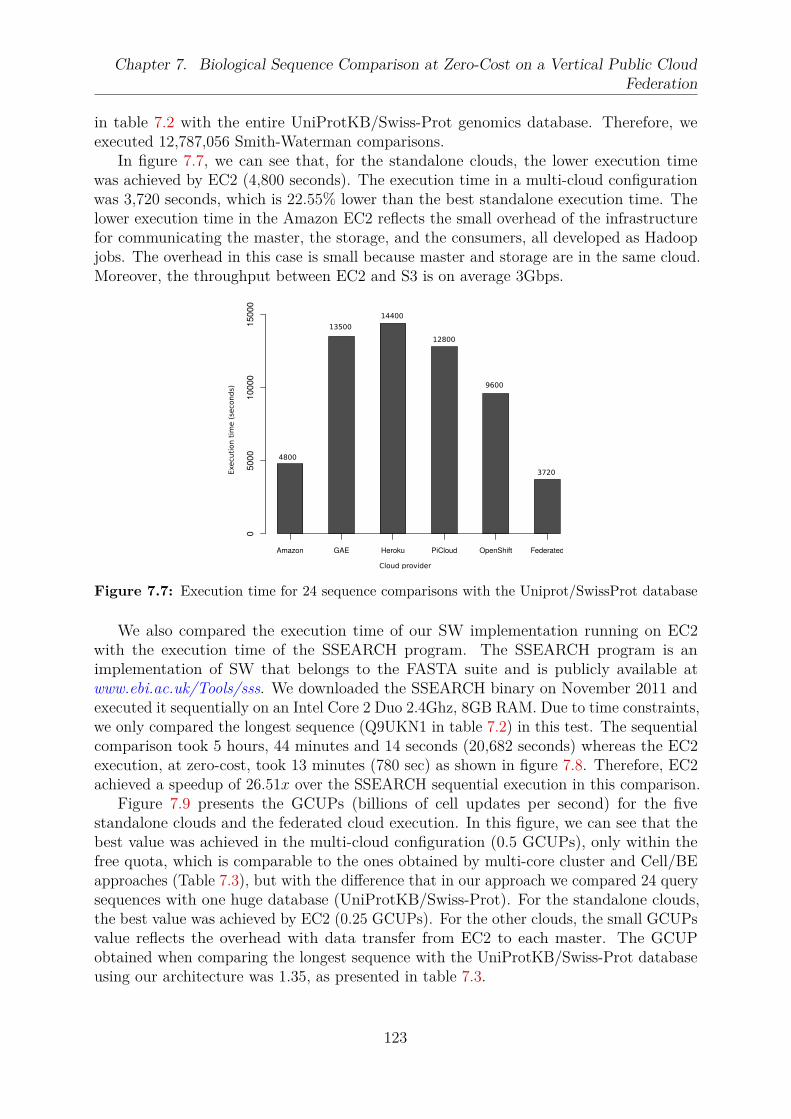
Chapter 7. Biological Sequence Comparison at Zero-Cost on a Vertical Public Cloud
Federation
in table 7.2 with the entire UniProtKB/Swiss-Prot genomics database. Therefore, weexecuted 12,787,056 Smith-Waterman comparisons.
In figure 7.7, we can see that, for the standalone clouds, the lower execution timewas achieved by EC2 (4,800 seconds). The execution time in a multi-cloud configurationwas 3,720 seconds, which is 22.55% lower than the best standalone execution time. Thelower execution time in the Amazon EC2 reflects the small overhead of the infrastructurefor communicating the master, the storage, and the consumers, all developed as Hadoopjobs. The overhead in this case is small because master and storage are in the same cloud.Moreover, the throughput between EC2 and S3 is on average 3Gbps.
Amazon GAE Heroku PiCloud OpenShift Federated
05000
10000
150
00
4800
1350014400
12800
9600
3720Exec
utio
n tim
e (s
econ
ds)
Cloud provider
Figure 7.7: Execution time for 24 sequence comparisons with the Uniprot/SwissProt database
We also compared the execution time of our SW implementation running on EC2with the execution time of the SSEARCH program. The SSEARCH program is animplementation of SW that belongs to the FASTA suite and is publicly available atwww.ebi.ac.uk/Tools/sss. We downloaded the SSEARCH binary on November 2011 andexecuted it sequentially on an Intel Core 2 Duo 2.4Ghz, 8GB RAM. Due to time constraints,we only compared the longest sequence (Q9UKN1 in table 7.2) in this test. The sequentialcomparison took 5 hours, 44 minutes and 14 seconds (20,682 seconds) whereas the EC2execution, at zero-cost, took 13 minutes (780 sec) as shown in figure 7.8. Therefore, EC2achieved a speedup of 26.51x over the SSEARCH sequential execution in this comparison.
Figure 7.9 presents the GCUPs (billions of cell updates per second) for the fivestandalone clouds and the federated cloud execution. In this figure, we can see that thebest value was achieved in the multi-cloud configuration (0.5 GCUPs), only within thefree quota, which is comparable to the ones obtained by multi-core cluster and Cell/BEapproaches (Table 7.3), but with the difference that in our approach we compared 24 querysequences with one huge database (UniProtKB/Swiss-Prot). For the standalone clouds,the best value was achieved by EC2 (0.25 GCUPs). For the other clouds, the small GCUPsvalue reflects the overhead with data transfer from EC2 to each master. The GCUPobtained when comparing the longest sequence with the UniProtKB/Swiss-Prot databaseusing our architecture was 1.35, as presented in table 7.3.
123

Chapter 7. Biological Sequence Comparison at Zero-Cost on a Vertical Public Cloud
Federation
Amazon Sequential
05000
10000
15000
20000
25000
20682
780
Environment
Executiontim
e(secon
ds)
Figure 7.8: Sequential execution time for the longest sequence (Q9UKN1) withSSEARCH (November 2011) compared with the standalone execution time inAmazon EC2
Amazon GAE Heroku PiCloud OpenShift Federated
0.0
0.1
0.2
0.3
0.4
0.5
0.6
0.25
0.1 0.1 0.1
0.15
0.5
GCUP
S
Cloud provider
Figure 7.9: GCUPS of 24 query sequences comparison with the database UniProtKB/Swiss-Prot (November 2011) using our SW implementation
124

Chapter 7. Biological Sequence Comparison at Zero-Cost on a Vertical Public Cloud
Federation
7.5 Related Work
The efforts that have been made to reduce the execution time of the SW applicationinclude (i) classical parallel platforms, such as clusters; (ii) accelerators such as Cell/BEand GPUs; and, more recently, (iii) clouds. Table 7.3 lists eight proposals of SW im-plementations and compares them to our proposal. We must note that there are manyother implementations of SW in clusters, Cell/BEs, and GPUs. Here, we chose twoimplementations in each platform to give a picture of the performance improvements thathave been achieved. As far as we know, there are only two implementations of SW inHadoop for cloud environments [127, 176].
In column 2, the computing platform is provided, which can be Cell/BEs, cluster ofCell/BE, multi-core clusters, GPUs, and cloud.
The type of comparison is provided in column 3, which can be between two se-quences (seq x seq) or query x dbase. Genomics databases (dbase) are composed of a greatnumber of sequences and each processing element compares the same sequence (query)with a subset of sequences from the database. Therefore, a high amount of comparisons ismade in the (query x dbase) case, but the size of the similarity matrices is not big. Theseq x seq comparison, on the other hand, compares only two sequences and the size of thesimilarity matrix is usually big.
Column 4 provides the grain of computation. All seq x seq comparisons are finegrain comparisons, i.e., all the processing elements participate in the computation of asingle similarity matrix. Coarse grain computations are normally made in query x dbasecomparisons, where each processing element independently computes a set of similaritymatrices.
As output, the SW algorithm can provide the score or the score and the alignment (Col-umn 5). In the first case, only the first phase of SW is executed.
The number of processing elements used in the comparisons is listed in column 6. Thisnumber varies, and it depends on the platform used. Note that, even though only oneGPU was used in the GPU SW implementations, these GPUs have multiple cores. Forinstance, the NVidia GTX 560Ti has 384 cores. In the first cloud implementation (line 7of table 7.3), a cluster of 768 cores was used and in the second one (line 8 of table 7.3), 20units of Amazon EC2 were used.
Column 7 lists the maximum speedups reported in the papers, which cannot be usedfor direct comparison since each approach uses a different general-purpose processor as abaseline to calculate speedups. Nevertheless, the reported speedups can give us an idea ofthe gains that can be obtained by each approach.
To measure the performance of SW, the metric GCUPs is often used. This metriccalculates the rate at which the cells of the similarity matrix are updated. When a querysequence is compared to a genomics database, the sizes of the query sequence and thesize of the whole database are taken into consideration. GCUPs range from 0.42 to 8.00for the Cell/BE and from 0.25 to 4.38 for clusters. The best GCUPs were obtained withGPUs (from 23.3 to 58.8 GCUPs). Neither speedups nor GCUPs were provided for thecloud computing implementations.
In the last row, we present the details of our multi-cloud approach. Like most of theapproaches, we calculate the SW score between a query sequence and a genomics databasewith coarse-grained computations. Unlike the other approaches, we propose and use a
125

Chapter 7. Biological Sequence Comparison at Zero-Cost on a Vertical Public Cloud
Federation
federated cloud architecture to execute our comparisons. Also, we used five public cloudsand, only within the free quota, we could launch 37 applications. The GCUP obtainedwith our proposal (1.35 GCUPs) is comparable with the multi-core clusters and Cell/BEsapproaches. As far as we know, ours was the first attempt to execute the SW algorithm ina vertical cloud federation.
7.6 Summary
In this chapter we proposed and evaluated a hierarchical multi-cloud architecture toexecute the Smith-Waterman (SW) algorithm in a cloud federation. By only using thefree-quota of five public clouds, we could execute the SW to compare 24 protein sequenceswith the UniProtKB/Swiss-Prot database in approximately one hour and this result iscomparable to the ones obtained in SW cluster and Cell/BE executions. We also presentedresults where the multi-cloud approach was 22.55% faster that the best standalone cloudexecution (EC2), showing the advantages of the cloud federation. In addition, we comparedthe EC2 execution with the sequential SSEARCH execution (November 2011). In thiscase, the EC2 execution achieved a speedup of 26.51x over SSEARCH.
Even though our approach could execute a huge application in multiple public clouds,there are some issues with it, which are: (i) the usage of a centralized coordinator todistribute the tasks, and (ii) the lack of fault-tolerance strategies for the coordinator andfor the masters. The first issue may limit the scalability of the architecture and its usagein a dynamic environment. On the one hand, failure of the coordinator may require there-execution of the whole application as the architecture does not provide a way to discoverthe tasks distributed to each master. In this case, the masters will continue the executionof their tasks, but the result will be inaccessible for the users. On the other hand, masters’failures will cause the re-execution of the tasks assigned to them. In both cases, the slavescontinue the execution. These two issues are tackled in chapter 10, where we propose adecentralized and fault-tolerant architecture for cloud federations.
126
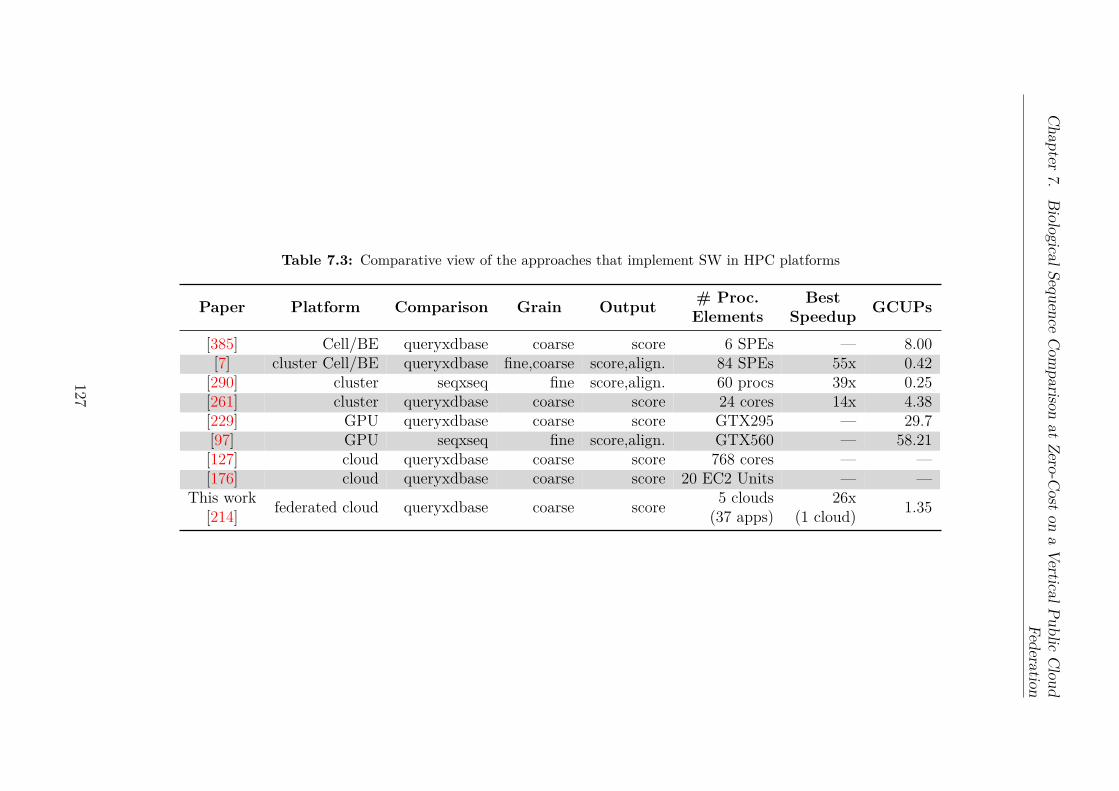
Chapter
7.
Bio
logica
lSeq
uen
ceC
om
pariso
nat
Zero
-Cost
on
aV
ertical
Public
Clo
ud
Fed
eratio
n
Table 7.3: Comparative view of the approaches that implement SW in HPC platforms
Paper Platform Comparison Grain Output# Proc. BestElements Speedup
GCUPs
[385] Cell/BE queryxdbase coarse score 6 SPEs — 8.00[7] cluster Cell/BE queryxdbase fine,coarse score,align. 84 SPEs 55x 0.42
[290] cluster seqxseq fine score,align. 60 procs 39x 0.25[261] cluster queryxdbase coarse score 24 cores 14x 4.38[229] GPU queryxdbase coarse score GTX295 — 29.7[97] GPU seqxseq fine score,align. GTX560 — 58.21[127] cloud queryxdbase coarse score 768 cores — —[176] cloud queryxdbase coarse score 20 EC2 Units — —
This workfederated cloud queryxdbase coarse score
5 clouds 26x1.35
[214] (37 apps) (1 cloud)
127

Chapter 8
Excalibur: A User-Centered Cloud
Architecture for Executing Parallel
Applications
Contents
8.1 Introduction and Motivation . . . . . . . . . . . . . . . . . . . . 129
8.2 Architecture Overview . . . . . . . . . . . . . . . . . . . . . . . 130
8.2.1 Scaling Cloud-Unaware Applications with Budget Restrictions
and Resource Constraints . . . . . . . . . . . . . . . . . . . . . 132
8.2.2 Reducing Data Movement to Reduce Cost and Execution Time 133
8.2.3 Reducing Job Makespan with Workload Adjustment . . . . . . 134
8.2.4 Making the Cloud Transparent for the Users . . . . . . . . . . 134
8.3 Experimental Results . . . . . . . . . . . . . . . . . . . . . . . . 136
8.3.1 Scenario 1: execution without auto-scaling and based on users’
preferences . . . . . . . . . . . . . . . . . . . . . . . . . . . . . 139
8.3.2 Scenario 2: execution with auto-scaling . . . . . . . . . . . . . 140
8.4 Related Work . . . . . . . . . . . . . . . . . . . . . . . . . . . . . 141
8.5 Summary . . . . . . . . . . . . . . . . . . . . . . . . . . . . . . . 143
The previous chapter showed us that developing and deploying cloud applications isa difficult task, even for experienced software developers, due to the various constraintsand the complex configuration tasks. Thus, we decided to investigate the usage of a cloudenvironment to execute cloud-unaware applications, considering the view of inexperiencecloud users, without having to change the applications to meet clouds’ environmentconstraints.
128

Chapter 8. Excalibur: A User-Centered Cloud Architecture for Executing Parallel
Applications
Therefore, in this chapter, we propose and evaluate a cloud architecture, called Excal-ibur, to execute applications on IaaS clouds. Our architecture aims to hide the configurationtasks from the users and to implements an auto-scaling strategy. Experimental results showthat the proposed architecture could dynamically scale the application up to 11 virtualmachines, reducing both the execution time and the cost of executing a genomics workflowwhen deployed on an instance type selected by the users.
The remainder of this chapter is organized as follows. In section 8.1, we present anintroduction and the motivation behind this work. Section 8.2 presents the design ofour cloud architecture. Experimental results are presented and discussed in section 8.3.Section 8.4 presents and compares some related works. Finally, section 8.5 concludes thischapter.
8.1 Introduction and Motivation
As stated in previous chapter, nowadays, the cloud infrastructure may be used toexecute HPC applications, due to its characteristics such as resources on-demand, pay-as-you-go model, and full access to the underlying infrastructure [1]. However, executing highperformance computing applications in the cloud still faces some difficulties such as thedifferences in HPC cloud infrastructures and the applications were not written for cloud.
Hence, cloud infrastructures require a new level of robustness and flexibility from theapplications, as hardware failures and performance variations become part of its normaloperation. In addition, cloud resources are optimized to reduce the cost for cloud providersoften without providing performance guarantees at low cost for the users. Furthermore,cloud providers offer different resources and services that have costs and performancedefined according to their purpose usage. In this scenario, the users face many problems.First, re-engineering applications to fit the cloud model requires expertise in both domains:cloud and high performance computing, as well as a considerable time to accomplish it.Second, selecting the resources that meet the applications’ needs demands data aboutboth applications and resources. Thus, deploying and executing an application in thecloud is still a complex task [179, 392].
Although some efforts have been made to help in solving these problems, most of themtarget software developers [262, 315], and they are not straightforward for inexperiencedusers [179].
Therefore, in this chapter, we propose and evaluate a cloud architecture, called Ex-calibur, to execute applications in the cloud with three main objectives: (a) provide aplatform for high performance computing applications in the cloud for users without cloudskills; (b) dynamically scale the applications without user intervention; and (c) meet theusers requirements such as performance at reduced cost. This work was published in [217].
The remainder of this chapter is organized as follows. Section 8.2 presents our cloudarchitecture. In section 8.3, experimental results are discussed. Section 8.4 presentsrelated work and discusses cloud architectures to perform high performance computingapplications. Finally, section 8.5 presents final considerations and future work.
129

Chapter 8. Excalibur: A User-Centered Cloud Architecture for Executing Parallel
Applications
8.2 Architecture Overview
The proposed architecture aims to simplify the use of the cloud and to run applicationson it without requiring re-design of the applications. To achieve these goals, we considerthat a cloud can be used to increase the capacity of local resources or combined with otherclouds, i.e., hybrid cloud environment (Section 3.2.2).
In this chapter, an application represents a user’s demand/work, being seen as a singleunit by the user. An application is composed of one or more tasks which represent thesmallest work unit to be executed by the system. The tasks that form an application canbe connected by precedence relations, forming a workflow. The workflow is defined to bea set of activities, and these activities can be tasks, as said above, or even other workflows.Moreover, a partition is a set of independent tasks with respect to the precedence relation.The terms application and job are used interchangeably in this chapter.
We propose an architecture composed of micro-services. A micro-service is a lightweightand independent service that performs single functions and collaborates with other ser-vices using a well-defined interface to achieve some objectives. Micro-services make ourarchitecture flexible and scalable since services can be changed dynamically according tothe users’ objectives. In other words, if a service does not achieve a desirable performancein a given cloud, it can be deployed in another one without requiring service restart.
Our architecture, called Excalibur, has three layers: resource management, application,and user layer as depicted in figure 8.1. The resource management layer comprises theservices responsible for managing the resources (e.g., VM and/or storage). A resource canbe registered by the providers or by the users through the service registry. By default, theresources provided by the public clouds are registered with the following data: resourcetype (e.g., physical or virtual machine, storage), URL, costs, and purpose usage (e.g., ifthe resource is optimized for CPU, memory or I/O-bound applications). The resourcemanagement service is responsible to validate these data and to keep them up-to-date.First, it gets a list of the resources through the service registry. Then, it asks the cloudsthe state of each resource and updates its state in the system. This is necessary because aresource registered at time ti may not be available at time tj, tj > ti for many reasons.The monitoring and deployment services, on the other hand, are responsible to deploy andto monitor the applications. Monitoring is an important activity in our architecture forthree reasons. First, it collects data about the resources. Second, it can be used to detectfailures — sometimes the providers terminate services when they are stressing the CPU,RAM memory, or both. And finally, it supports our auto-scaling mechanism.
We provide a uniform view of the clouds through a communication API. This isnecessary because each cloud provider often has different interfaces to access its resources.
On top of the resource management layer, the application layer provides services toschedule the jobs (provisioning), to control the data flows (workflow data event), to providedata streaming service (data streaming processing), and to execute the applications. Thearchitecture uses MapReduce (Section 3.1.3) to distribute the applications. This does notmean that only MapReduce applications are supported, as in chapter 7, but only that theapplications are distributed following the MapReduce model.
The coordination service manages the resources, which can be distributed acrossdifferent cloud providers, and provides a uniform view of the system such as the availableresources and the system’s workload.
130

Chapter 8. Excalibur: A User-Centered Cloud Architecture for Executing Parallel
Applications
The provisioning service creates a workflow with the activities to set up the environment,and it creates an execution plan for the applications. In practice, the provisioning servicecommunicates with the coordination service to obtain data about the resources and toallocate them for the applications. After that, it submits the workflow to the workflowmanagement service.
An execution plan comprises the application to execute, its input data (i.e., datasources), the resources to execute it, a state (initializing, waiting data, ready, executing,and finished), and a characteristic that can be known or unknown by the system. Acharacteristic represents the application’s behavior such as CPU, memory, or I/O-bound.
The workflow management service coordinates the execution of the workflow andcreates the data flows (i.e., data streams) in the workflow data event service.
The workflow data event service is responsible to provide the data for the executionplans. A data flow has a source and a sink and it can supply data for multiple executionplans simultaneously. This avoids multiple accesses for the distributed file system (DFS)to fetch the same data.
Finally, the user layer has two services: job submission and job stats processing. Theusers submit their jobs through the job submission service. A job has the following data:the tasks which compose it, the constraints, the data definition (input and output), andthe data about the cloud providers (e.g., name and access key). The users can monitor orobtain the results of their jobs through the job stats processing.
Monitoring and
deployment
Provisioning Coordination
Workflow
Management Distributed Job Processing
(MapReduce)
Distributed File System
(DFS)
Workflow data
event
User
layerJob submission Job stats
Service registryResource
management
Communication API
Cloud Provider API
Application layer
Resource management layer
Distributed
database
Data streaming
processing
Monitors the resources
Interaction between the services
Figure 8.1: Excalibur: services and layers
Scaling cloud-unaware applications without having technical skills requires an architec-ture that abstracts the whole environment, taking into account the users’ objectives. Inthe next subsections, we explain how the proposed architecture achieves these objectives.
131

Chapter 8. Excalibur: A User-Centered Cloud Architecture for Executing Parallel
Applications
8.2.1 Scaling Cloud-Unaware Applications with Budget Restric-
tions and Resource Constraints
The applications considered in this chapter are workflows but some parts of theworkflow can be composed of a set of independent tasks that can be run in parallel. Theseindependent tasks are the target of our scaling technique. For example, figure 8.2 showsa directed acyclic graph (DAG) with four tasks (T1, T2, T3, and T4) and the temporalprecedence relations among the tasks. In this example, tasks T2 and T3 can be executedin parallel, after task T1 finishing, as expected by any workflow engine. However, task T3
is composed of three independent subtasks (s1, s2 and, s3).
T1
T2
T4
s2
s1s3T3
Figure 8.2: A DAG representing a workflow application with 4 tasks, where one of them, T3, iscomposed of three independent subtasks
In this case, the subtasks can be grouped in p partitions and assigned to differentnodes. One important problem here is to determine the size and the number of partitions.Over-partitioning can lead to a great number of short duration tasks that may cause aconsiderable overhead to the system. Hence, over-partitioning can result in inefficientresource usage. To avoid this, the size of one partition (Pp) is estimated as [15]:
Pp = ⌊Nq ∗ R
T⌋ (8.1)
where Nq is the workload size; T is the estimated CPU time for executing Nq in thepartition; and R is a parameter for the maximum execution time for partition Pp. Apartition size can be adjusted according to the node characteristics. For instance, if theresource usage by a partition Pp is below a threshold, Pp can be increased.
Partitions exist due to the concept of splittable and static files. It is the user whodefines which data are splittable and how to split them when the system does not know.Splittable data are converted to JSON records and persisted onto the distributed database,so a partition represents a set of JSON records. Static data, on the other hand, are keptin the local file system.
Listing 8.1 illustrates the input file of task T3. This file represents a FASTA file, andeach line starting with the > character represents a genomics sequence, thus a subtask. TheFASTA file is converted to the JSON format as shown in listing 8.1. A genomics sequencehas a name (e.g., ERR135910.3), a description (e.g., 2405:1:1101:1234:1973:Y/1), and avalue (e.g., NAAGGGTTTGAGTAAGAGCATAGCTGTTGGGACCCGAAAGATGGT-GAACT). In this case, the system will create a table with name sequences in the distributed
132

Chapter 8. Excalibur: A User-Centered Cloud Architecture for Executing Parallel
Applications
database and will store onto it the genomics sequences. Moreover, three partitions can becreated to execute in parallel.
>ERR135910.3 2405:1:1101:1234:1973:Y/1
NAAGGGTTTGAGTAAGAGCATAGCTGTTGGGACCCGAAAGATGGTGAACT
>ERR135910.5 2405:1:1101:1170:1994:Y/1
NTCAACGAGGAATTCCTAGTAAGCGNAAGTCATCANCTTGCGTTGAATAC
>ERR135910.6 2405:1:1101:1272:1972:Y/1
NTAGTACTATGGTTGGAGACAACATGGGAATCCGGGGTGCTGTAGGCTTG
Listing 8.1: Example of a splittable file format (i.e., FASTA file)
1
2 "sequences" : [
3 "name" : "ERR135910.3",
4 "description" : "2405:1:1101:1234:1973:Y/1",
5 "value" : "NAAGGGTTTGAGTAAGAGCATAGCTGTTGGGACCCGAAAGATGGTGAACT"
6 ,
7 "name" : "ERR135910.5",
8 "description" : "2405:1:1101:1170:1994:Y/1",
9 "value" : "NTCAACGAGGAATTCCTAGTAAGCGNAAGTCATCANCTTGCGTTGAATAC"
10 ,
11 "name" : "ERR135910.6",
12 "description" : "2405:1:1101:1272:1972:Y/1",
13 "value" : "NTAGTACTATGGTTGGAGACAACATGGGAATCCGGGGTGCTGTAGGCTTG"
14 ]
15
Listing 8.2: Example of a JSON with three genomics sequences
8.2.2 Reducing Data Movement to Reduce Cost and Execution
Time
Data movement can increase the total execution time of an application (i.e., makespan)and sometimes it can be higher than the computation time due to the differences innetworks’ bandwidth. In this case, we can invert the direction of the logical flow, movingthe application to as close as possible of the data location. Actually, we distribute thedata using a DFS and the MapReduce strategy.
Although MapReduce is an elegant solution, it has the overhead of creating the mapand the reduce tasks every time a query must be executed. We minimize this overhead byusing a data structure to keep the data in memory. This increases the memory usage andrequires data consistency policies to keep the data updated. However it does not increasefinancial costs. We implemented a data policy that works as follows. Each record readby a node is kept in memory and its key is sent for the coordination service (Figure 8.1).The coordination service stores the key/value pairs and the information where they wereread. When a node updates a record, it removes it from its memory and notifies thecoordinator. Then, the coordination service asynchronously notifies all nodes that have thekey to remove it from its memory. This is not a strong consistency policy, since we assume
133
Chapter 8. Excalibur: A User-Centered Cloud Architecture for Executing Parallel
Applications
that a node partition does not affect system’s consistency, and the tasks are idempotent.For instance, consider a scenario where a key k was loaded by three nodes (N1, N2, N3)and a partition occurred after the readings. The task represented by the key k will beexecuted by the nodes, but its result will be the same.
8.2.3 Reducing Job Makespan with Workload Adjustment
In an environment with incomplete information and unpredictable usage patterns asthe cloud, load imbalance can have high impact in the total execution time and in themonetary cost. For instance, assigning a CPU-bound task to a memory optimized node isnot a good choice. To tackle this problem, we propose a workload adjustment techniquethat works as follows. For execution plans in the ready state and with an unknownapplication’s characteristics, the scheduler selects similar execution plans and submitsthem for each available resource (i.e., CPU, memory or I/O optimized) and waits theirexecution to finish. When the first execution finishes, the scheduler checks if there aresimilar execution plans in the ready state and submits them. Execution plans are similarif they execute the same application and almost the same number of tasks.
When there are no more execution plans in the ready state, the scheduler assigns onethat is executing. Note that, in this case, the cost can increase, since we have more thanone node executing the same task. In fact, we minimize this, finishing the slowest nodeaccording to the difference between the elapsed time and the time to charge for its usage.
8.2.4 Making the Cloud Transparent for the Users
As our architecture aims to make the cloud transparent for the users, it automates thewhole setup process. However, for some users, this is not sufficient since some jobs stillrequire programming skills. For instance, consider the following scenarios: (i) a biologistwho wants to search DNA units that have some properties in a genomics database, and tocompare these DNA units with another sequence that he/she has built; (ii) a social mediaanalyst who wants to filter tweets using some keywords.
Normally, these works require a program to read, to parse, and to filter the data.However, in our solution, the users only have to know the structure or their data and touse a domain specific language (DSL) to perform their work. Listings 8.3 and 8.4 showhow these works can be defined, where b, P1, P2, T, and w are users’ parameters.
execute T with ( select reads from genomic−database where P1 = X and P2 =
Y) −seq = b
Listing 8.3: Defining a genomics analysis application
select tweet from tweets where t ex t conta in s (w)
Listing 8.4: Defining a Twitter analysis application
In these cases, a data structure (i.e., a file) is seen as a table whose fields can befiltered. Although there are similar approaches in the literature such as BioPig [262] and
134

Chapter 8. Excalibur: A User-Centered Cloud Architecture for Executing Parallel
Applications
SeqPig [315], they still require programming skills to register the drivers and to load/storethe data. In other words, to use them, the users have to know the internals of the system.
In order to illustrate our architecture, consider the bioinformatics scenario describedabove. In this case, the biologist submits a YAML Ain’t Markup Language (YAML) filedepicted in listing 8.5, with the application, the requirements, and the input data (e.g.,the genomics database and the built sequence) using a console application (a client ofthe job submission service) at the user layer (Figure 8.3 (1)). The job submission sendsthe job description to the provisioning service at the application layer (Figure 8.3 (2)).When the provisioning service receives the application, it requests the coordination ser-vice resources the resources that match the users’ requirements (Figure 8.3 (3)). Then,the coordination service asks the resource management service such resources, and returnsthem for the provisioning service (Figure 8.3 (4)). Next, the provisioning service createsa workflow (i.e., deployment workflow) with the activities to configure the environmentand an execution plan for the application. Next, it submits them to the workflow manage-ment (Figure 8.3 (5)). The deployment workflow’s activities are: (i) selects the cheapestvirtual machine to setup the environment; (ii) gets non splittable files (e.g., a referencegenome) to store them in the local file system; (iii) gets the splittable files (e.g., thegenomics database) and persists them into the DFS; (iv) creates a VMI of the config-ured environment; and (v) finishes the VM used to configure the environment. After,the workflow management service executes the deployment workflow. In other words,it stores the splittable files (Figure 8.3 (6)) into the distributed database, deploys theapplications (Figure 8.3 (7)), and asks the workflow data event service (Figure 8.3 (8))to create the data streams. Then, the workflow data event registers the data streams inthe data stream processing service (Figure 8.3 (9)). Finally, the workflow managementservice executes the application (Figure 8.3 (10)).
In this scenario, a partition has a set of genomics sequences read from the DFS bythe workflow data event and it is assigned to an execution plan. During the execution,the provisioning service monitors the applications through the monitoring service andif the execution time of a partition reaches the expected time it creates more VMs toredistribute the workload. After all tasks have finished, the user receives the outputthrough the job submission service.
135

Chapter 8. Excalibur: A User-Centered Cloud Architecture for Executing Parallel
Applications
1 ---
2 id: "cmsearch"
4 requirements:
5 - memory: "4"
6 - architecture: "I386_64"
7 - platform: "LINUX"
9 applications:
10 application:
11 - command: "cmsearch -o $hits $rfam $query_sequence"
13 data-def:
14 data:
15 - id: "hits"
16 is-output: true
17 is-splittable: true
18 path: "$HOME/hits.txt"
20 - id: "rfam"
21 is-output: false
22 is-splittable: false
23 path: "$HOME/Rfam/11.1/Rfam.cm"
25 - id: "query_sequence"
26 is-output: false
27 is-splittable: true
28 path: "$HOME/query_sequence.fa"
Listing 8.5: Excalibur: example of a YAML file with the requirements and one
application to be executed on the cloud
8.3 Experimental Results
We deployed an instance of our architecture on Amazon EC2. Our goal was to evaluatethe architecture when instanced by a user without cloud computing skills.
We executed a genomics workflow that aims to identify non-coding RNA (ncRNA) inthe fungi Schizosaccharomyces pombe (S. pombe). This workflow, called Infernal-Segemehl,consists of four phases (Figure 8.4): (i) first, the application Infernal [260] maps the S.pombe sequences onto a nucleic acid sequence database (e.g., Rfam [143]); (ii) then, thesequences with no hit or with a low score are processed by segemehl [160]; (iii) next,SAMTools [220] is used to sort the alignments and to convert them to the SAM/BAMformat. Finally, (iv) the RNAFold [159] application computes the minimum free energy ofthe RNA molecules obtained in step (iii).
We used the Rfam version 11.1 (with 2278 ncRNA families) and S. pombe sequencesextracted from the EMBL-EBI (1 million reads). Rfam is a database of non-coding RNAfamilies with a seed alignment for each family and a covariance model profile built on thisseed to identify additional members of a family [143].
136
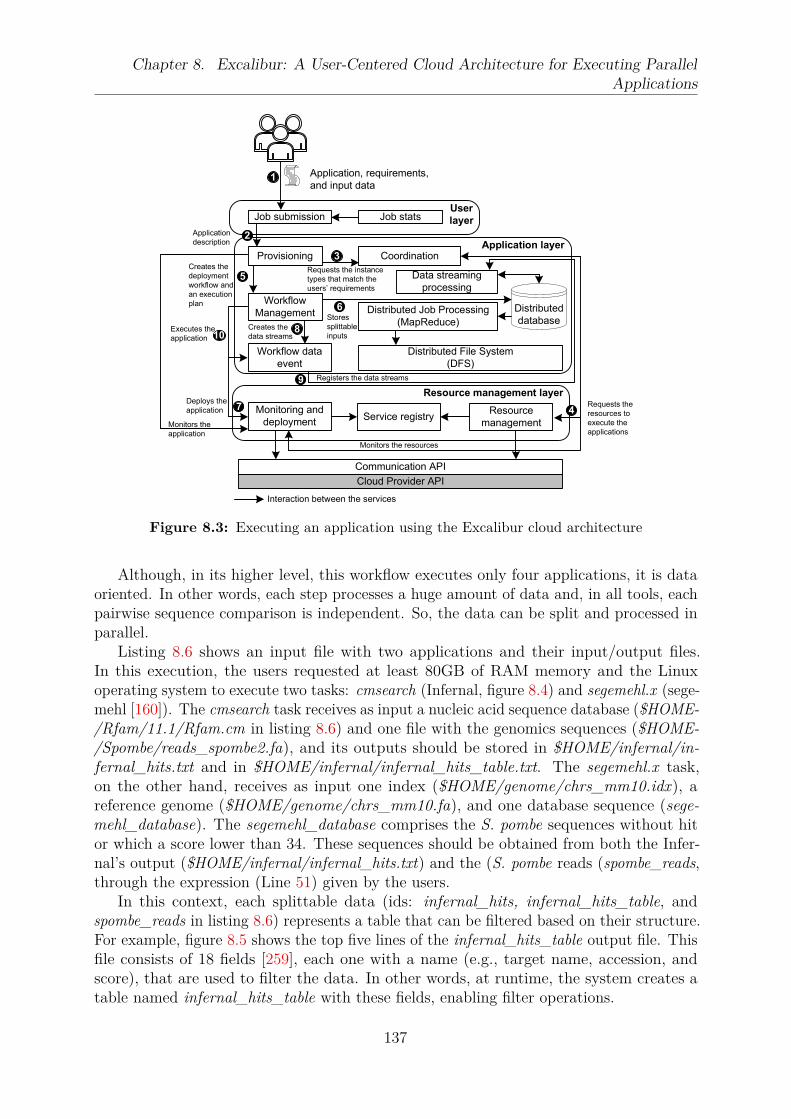
Chapter 8. Excalibur: A User-Centered Cloud Architecture for Executing Parallel
Applications
Monitoring and
deployment
Provisioning Coordination
Workflow
Management Distributed Job Processing
(MapReduce)
Distributed File System
(DFS)
Workflow data
event
User
layerJob submission Job stats
Service registryResource
management
Communication API
Cloud Provider API
Application layer
Resource management layer
Distributed
database
Data streaming
processing
Application, requirements,
and input data1
2Application
description
5Creates the
deployment
workflow and
an execution
plan
3
Requests the instance
types that match the
users’ requirements
4Requests the
resources to
execute the
applications
6Stores
splittable
inputs
7Deploys the
application
8Creates the
data streams
Registers the data streams
10Executes the
application
Monitors the resources
9
Monitors the
application
Interaction between the services
Figure 8.3: Executing an application using the Excalibur cloud architecture
Although, in its higher level, this workflow executes only four applications, it is dataoriented. In other words, each step processes a huge amount of data and, in all tools, eachpairwise sequence comparison is independent. So, the data can be split and processed inparallel.
Listing 8.6 shows an input file with two applications and their input/output files.In this execution, the users requested at least 80GB of RAM memory and the Linuxoperating system to execute two tasks: cmsearch (Infernal, figure 8.4) and segemehl.x (sege-mehl [160]). The cmsearch task receives as input a nucleic acid sequence database ($HOME-/Rfam/11.1/Rfam.cm in listing 8.6) and one file with the genomics sequences ($HOME-/Spombe/reads_spombe2.fa), and its outputs should be stored in $HOME/infernal/in-fernal_hits.txt and in $HOME/infernal/infernal_hits_table.txt. The segemehl.x task,on the other hand, receives as input one index ($HOME/genome/chrs_mm10.idx), areference genome ($HOME/genome/chrs_mm10.fa), and one database sequence (sege-mehl_database). The segemehl_database comprises the S. pombe sequences without hitor which a score lower than 34. These sequences should be obtained from both the Infer-nal’s output ($HOME/infernal/infernal_hits.txt) and the (S. pombe reads (spombe_reads,through the expression (Line 51) given by the users.
In this context, each splittable data (ids: infernal_hits, infernal_hits_table, andspombe_reads in listing 8.6) represents a table that can be filtered based on their structure.For example, figure 8.5 shows the top five lines of the infernal_hits_table output file. Thisfile consists of 18 fields [259], each one with a name (e.g., target name, accession, andscore), that are used to filter the data. In other words, at runtime, the system creates atable named infernal_hits_table with these fields, enabling filter operations.
137
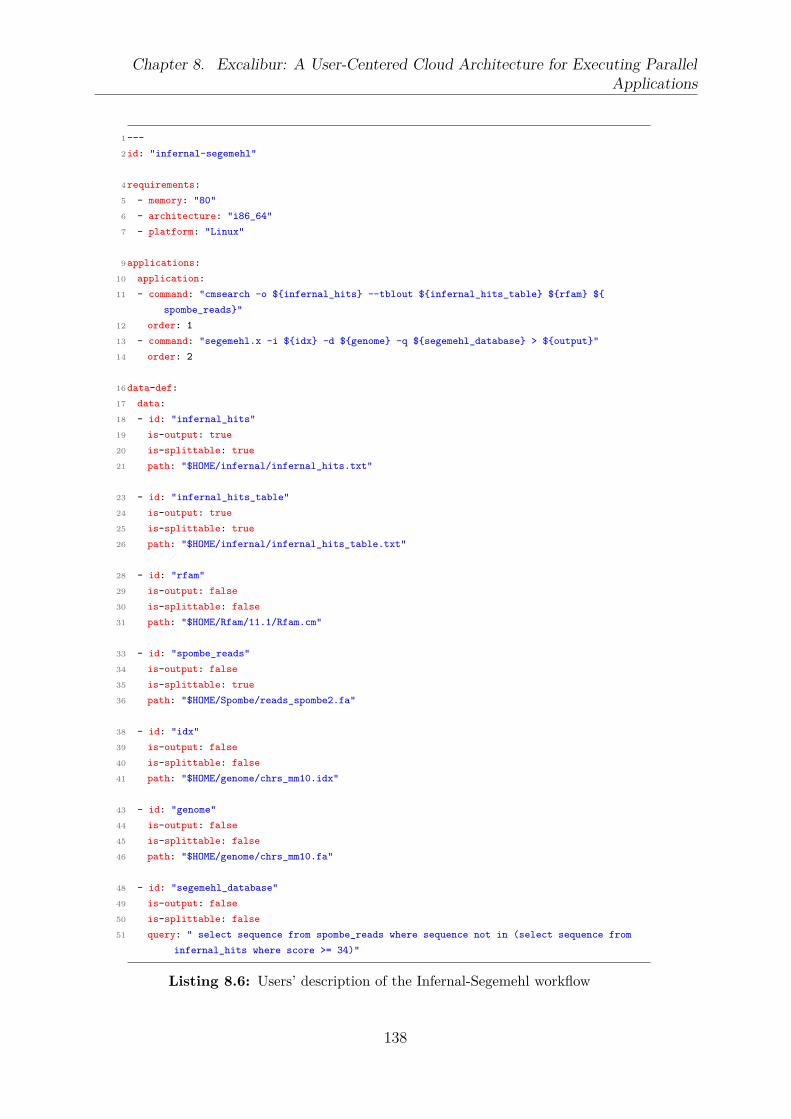
Chapter 8. Excalibur: A User-Centered Cloud Architecture for Executing Parallel
Applications
1 ---
2 id: "infernal-segemehl"
4 requirements:
5 - memory: "80"
6 - architecture: "i86_64"
7 - platform: "Linux"
9 applications:
10 application:
11 - command: "cmsearch -o $infernal_hits --tblout $infernal_hits_table $rfam $
spombe_reads"
12 order: 1
13 - command: "segemehl.x -i $idx -d $genome -q $segemehl_database > $output"
14 order: 2
16 data-def:
17 data:
18 - id: "infernal_hits"
19 is-output: true
20 is-splittable: true
21 path: "$HOME/infernal/infernal_hits.txt"
23 - id: "infernal_hits_table"
24 is-output: true
25 is-splittable: true
26 path: "$HOME/infernal/infernal_hits_table.txt"
28 - id: "rfam"
29 is-output: false
30 is-splittable: false
31 path: "$HOME/Rfam/11.1/Rfam.cm"
33 - id: "spombe_reads"
34 is-output: false
35 is-splittable: true
36 path: "$HOME/Spombe/reads_spombe2.fa"
38 - id: "idx"
39 is-output: false
40 is-splittable: false
41 path: "$HOME/genome/chrs_mm10.idx"
43 - id: "genome"
44 is-output: false
45 is-splittable: false
46 path: "$HOME/genome/chrs_mm10.fa"
48 - id: "segemehl_database"
49 is-output: false
50 is-splittable: false
51 query: " select sequence from spombe_reads where sequence not in (select sequence from
infernal_hits where score >= 34)"
Listing 8.6: Users’ description of the Infernal-Segemehl workflow
138

Chapter 8. Excalibur: A User-Centered Cloud Architecture for Executing Parallel
Applications
Infernal Segemehl RNAfoldSAMtools
Figure 8.4: The Infernal-Segemehl workflow
#target name accession query name accession mdl mdl from mdl to seq from seq to strand trunc pass gc bias score E-value inc description of target
#-------------- --------- ---------- --------- --- -------- -------- -------- -------- ------ ----- ---- ---- ----- ------ --------- --- ---------------------
ERR135910.3845 - 5S_rRNA RF00001 cm 9 59 1 50 + 5’&3’ 4 0.54 0.2 39.2 2.7e-07 ! 2405:1:1101:20720:2186:Y/1
ERR135910.4258 - 5S_rRNA RF00001 cm 12 62 1 50 + 5’&3’ 4 0.52 0.1 38.5 4.2e-07 ! 2405:1:1101:2670:2486:Y/1
ERR135910.8417 - 5S_rRNA RF00001 cm 12 62 1 50 + 5’&3’ 4 0.52 0.1 38.5 4.2e-07 ! 2405:1:1101:6991:2660:Y/1
Figure 8.5: Infernal’s target hits table
The Amazon EC2 micro instance (t1.micro) was used to setup the environment (e.g.,install the applications, to copy the static files to the local file system), and to createa virtual machine image (VMI).
In addition to the cloud’s executions, we also executed the workflow in a local PC (Ta-ble 8.1) to have an idea of the cloud overhead.
Table 8.1: Resources used to execute the Infernal-Segemehl workflow
Instance type CPU RAM Cost ($/hour)
PC Intel Core 2 Quad CPU 2.40 GHz 4 GB Not applicablehs1.8xlarge Intel Xeon 2.0 GHz 16 cores 171 GB 4.60m1.xlarge Intel Xeon 2.0 GHz 4 cores 15 GB 0.48c1.xlarge Intel Xeon 2.0 GHz 8 cores 7 GB 0.58t1.micro Intel Xeon 2.0 GHz 1 core 613 MB 0.02
8.3.1 Scenario 1: execution without auto-scaling and based on
users’ preferences
This experiment aims to simulate the users’ preferences. In this case, the users areresponsible for selecting an instance type based on their knowledge about the applicationsor on the amount of computational resources offered by the instance types. We executedthe workflow illustrated in figure 8.4 in the first four instances listed in table 8.1.
Figure 8.6 shows the costs and the execution time for the four instances. The time wasmeasured from the moment the application was submitted until the time all the resultswere produced (i.e., wallclock time). Therefore, it includes the cloud overhead (e.g., datamovement to/from the cloud, VM creation, among others). The instance hs1.8xlarge,which was selected based on the application requirements (≥ 88GB of RAM), outperformedall other instances. Although it was possible for the users to execute the workflow withoutrequiring cloud skills, they paid a high cost (USD 78.00). This happened because theusers (i.e., biologists) specified that their applications would need more than 88GB ofRAM and in fact, they used only 3GB of RAM. Moreover, the hs1.8xlarge is suitable forapplications that demand high I/O performance operations.
139
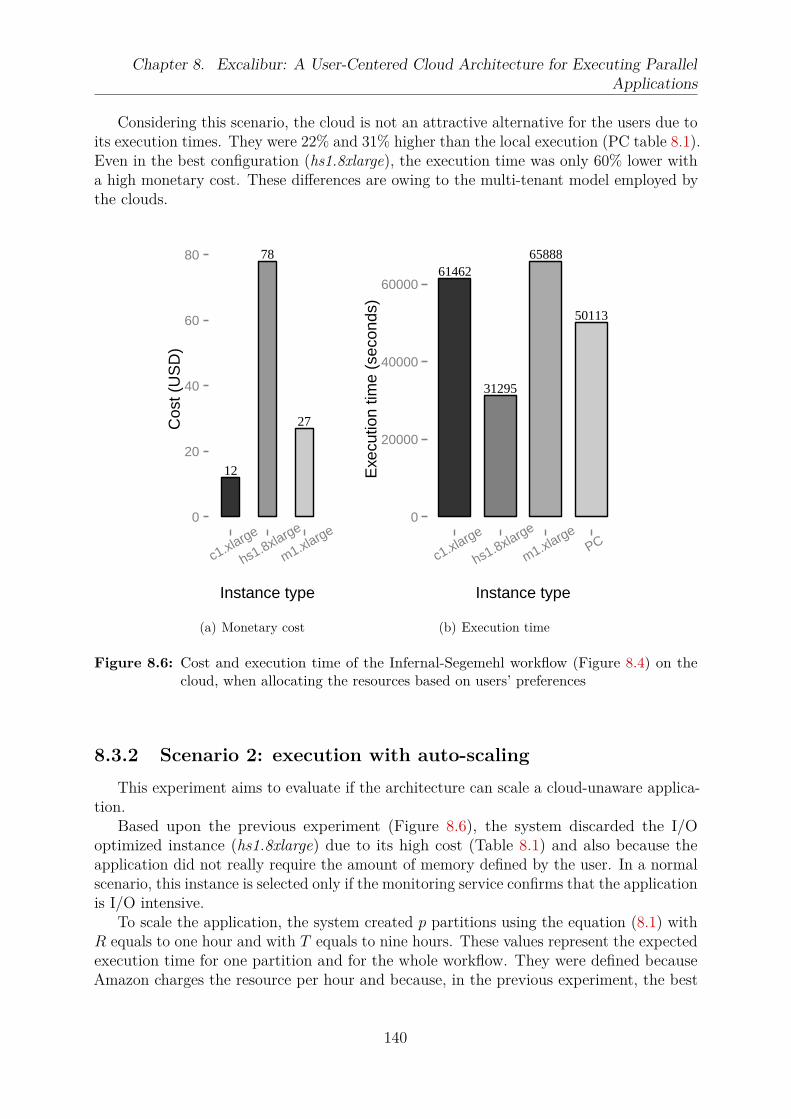
Chapter 8. Excalibur: A User-Centered Cloud Architecture for Executing Parallel
Applications
Considering this scenario, the cloud is not an attractive alternative for the users due toits execution times. They were 22% and 31% higher than the local execution (PC table 8.1).Even in the best configuration (hs1.8xlarge), the execution time was only 60% lower witha high monetary cost. These differences are owing to the multi-tenant model employed bythe clouds.
12
78
27
0
20
40
60
80
c1.xlarge
hs1.8xlarge
m1.xlarge
Instance type
Cos
t (U
SD
)
(a) Monetary cost
61462
31295
65888
50113
0
20000
40000
60000
c1.xlarge
hs1.8xlarge
m1.xlargePC
Instance type
Exe
cutio
n tim
e (s
econ
ds)
(b) Execution time
Figure 8.6: Cost and execution time of the Infernal-Segemehl workflow (Figure 8.4) on thecloud, when allocating the resources based on users’ preferences
8.3.2 Scenario 2: execution with auto-scaling
This experiment aims to evaluate if the architecture can scale a cloud-unaware applica-tion.
Based upon the previous experiment (Figure 8.6), the system discarded the I/Ooptimized instance (hs1.8xlarge) due to its high cost (Table 8.1) and also because theapplication did not really require the amount of memory defined by the user. In a normalscenario, this instance is selected only if the monitoring service confirms that the applicationis I/O intensive.
To scale the application, the system created p partitions using the equation (8.1) withR equals to one hour and with T equals to nine hours. These values represent the expectedexecution time for one partition and for the whole workflow. They were defined becauseAmazon charges the resource per hour and because, in the previous experiment, the best
140

Chapter 8. Excalibur: A User-Centered Cloud Architecture for Executing Parallel
Applications
execution time took approximately 9 hours to finish (Figure 8.6). This means that thisexperiment aimed to at least decrease the cost. In this case, 9 partitions were created.
As in the beginning, the system had not sufficient data to decide if the workflow wasmemory or CPU-bound, it submitted two similar partitions — for two instance types(m1.xlarge and c1.xlarge) — to realize which one was the most appropriate to execute theapplications.
Figure 8.7 shows the execution time for each partition in the selected instance types. Assoon as the execution of the partition assigned to the c1.xlarge instance finished, the systemcreated one VM for each partition in the ready state and executed them. Although therewere only seven partitions in the ready state and one in execution (execution state), thearchitecture duplicated the partition in execution, since its execution time in the m1.xlargeinstance was unknown. After one hour, three more instances were created to redistributethe tasks as shown in figure 8.8.
Due to the cloud infrastructure, which provided in nearly real-time the requestedresources, and the auto-scaling mechanism, which selected the resources based on thepartitions’ characteristics, we decreased the cost (5 times) and the makespan (63%) using10 c1.xlarge instances (80 vCPUs) and one m1.xlarge (4 vCPUs) compared to instancetype specified by the users (hs1.8xlarge in table 8.1). The makespan was reduced from31, 295 seconds (Figure 8.6(b)) to 10, 830 seconds (Figure 8.8).
Our strategy differs from scaling services (e.g., Amazon CloudWatch –aws.amazon.com/cloudwatch/) offered by the cloud providers, since the users do nothave to select an instance type nor to set up the environment.
8.4 Related Work
In the last years, many works have described the challenges and opportunities ofrunning high-performance computing in the cloud [1, 179, 392].
Therefore, many works have focused on developing new architectures to execute users’applications in the cloud considering both cost and performance. For instance, the CloudVirtual Service (CloVR) [15] is a desktop application for automated sequences analysisusing cloud computing resources. With CloVR, the users execute a VM on their computer,configure the applications, insert the data in a special directory, and CloVR deploys aninstance of this VM on the cloud to scale and to execute the applications. CloVR scalesthe application by splitting the workload in p partitions through the equation (8.1), andexecuting the Cunningham BLAST runtime [371] to estimate the CPU time for eachBLAST query.
Iordache and colleagues [166] developed Resilin, an architecture to scale MapReducejobs in the cloud. The solution has different services to provision the resources, to handlejobs flow execution, to process the users requests, and to scale according to the load of thesystem. Doing bioinformatics data analysis with Hadoop requires knowledge about theHadoop internal and considerable effort to implement the data flow.
In [262], a tool for bioinformatics data analysis called BioPig is presented. In this case,the users select and register a driver — bioformatics algorithms — provided by the tooland write their analysis’ jobs using the Apache Pig (pig.apache.org) data flow language.
141

Chapter 8. Excalibur: A User-Centered Cloud Architecture for Executing Parallel
Applications
12
20
20
40
60
80
c1.xlarge
m1x.large
Instance type
Cos
t (U
SD
)
5408
8160
0
2000
4000
6000
8000
c1.xlarge
m1.xlarge
Instance typeE
xecu
tion
time
(sec
onds
)
(a) Cost to execute the workflow using 10 c1.xlarge
instances and 1 m1.xlarge instance
(b) Execution time for one partition when executed
in the c1.xlarge and m1.xlarge instances. One
partition was defined to finish in 1 hour with the
deadline of 9 hours for the whole workflow
Figure 8.7: Monetary cost and execution time of the Infernal-Segemehl workflow (Figure 8.4)on the cloud with the auto-scaling enabled
time (seconds)
#ins
tanc
es
0
2
4
6
8
10
0 2000 4000 6000 8000 10000
Figure 8.8: Scaling the Infernal-Segemehl workflow
142

Chapter 8. Excalibur: A User-Centered Cloud Architecture for Executing Parallel
Applications
SeqPig [315] is another tool that has the same objective of BioPig. The differencesbetween them are the drivers provided by each tool. These tools reduce the needs to knowHadoop internal to realize bioinformatics data analysis.
Table 8.2 summarizes the approaches discussed in the previous paragraphs. As canbe seen in this table, one architecture, CloVR[15], can both execute and scale workflowin the cloud. The others [166, 262, 315] can execute MapReduce applications. Hence,the auto-scaling is supported by the in-built approaches implemented by MapReduce’sframeworks such as Apache Hadoop.
The closest works to ours are CloVR [15], BioPig [262], and SeqPig [315]. Our workdiffers from these approaches in the following ways. First, the users do not need toconfigure a VM in their computers to execute the applications in the cloud. Second, ourarchitecture tries to match the workload to the appropriate instance type. Third, thedata flow is defined using an abstract language freeing the users to write any code. Thelanguage is the same as used by BioPig and SeqPig but with the difference that the userswrite the data flow by only considering the data structure. For instance, to filter thesequences using BioPig or SeqPig the users have to register the loaders, the drivers, andto write a script to execute the analysis, which can be more appropriate for softwaredevelopers.
Table 8.2: Comparative view of user-centered cloud architectures
Paper Workflow Auto-scaling User support Application
CloVR [15] Yes Yes Script BLASTResilin [166] No Yes Hadoop MapReduce applicationsBioPig [262] No Yes Pig MapReduce applicationsSeqPig [315] No Yes Pig MapReduce applications
Excalibur [217] Yes Yes DSL + Pig More general applications
8.5 Summary
In this chapter, we proposed and evaluated a cloud architecture, named Excalibur.Excalibur aims to execute cloud-unaware applications in the cloud without requiringprogramming or cloud skills from the users. Following an autonomic approach, Excalibur:(a) set up the whole cloud environment; (b) dynamically scaled the applications to reduceboth the monetary cost and the execution time of a genomics workflow (Figure 8.4); and(c) enabled the users to describe the dependencies between the applications based on thestructure of their data (i.e., input and output data).
We instantiated our architecture on Amazon EC2 considering two different scenarios:one with the auto-scaling enabled and another with it disabled. In the first case, the userwas responsible for selecting an instance type to execute the applications, whereas in thesecond case, an instance type was selected based on historical data and on characteristicsof the applications. Using 11 virtual machines, Excalibur reduced the execution time by63% and the cost by 84%.
Therefore, in this chapter, we considered a single cloud, and the users were responsiblefor selecting an instance type to start the execution of the applications. Moreover, Excalibur
143

Chapter 8. Excalibur: A User-Centered Cloud Architecture for Executing Parallel
Applications
assumed that the clouds were homogeneous with regard to the resources’ constraints. Inother words, that the constraints of the resources were equal between the clouds belongingto a cloud provider. Nonetheless, nowadays, the clouds are usually heterogeneous evenwhen they belong to the same cloud provider. Hence, we need a method to handle clouds’heterogeneity properly, and this motivated the work that we will be described in the nextchapter.
144
Chapter 9
Resource Selection Using Automated
Feature-Based Configuration
Management in Federated Clouds
Contents
9.1 Introduction . . . . . . . . . . . . . . . . . . . . . . . . . . . . . 146
9.2 Motivation and Challenges . . . . . . . . . . . . . . . . . . . . . 149
9.3 Multi-Objective Optimization . . . . . . . . . . . . . . . . . . . 151
9.4 Feature Modeling . . . . . . . . . . . . . . . . . . . . . . . . . . 154
9.5 Proposed Model . . . . . . . . . . . . . . . . . . . . . . . . . . . 157
9.5.1 Cloud Computing Model . . . . . . . . . . . . . . . . . . . . . 158
9.5.2 Cost Model . . . . . . . . . . . . . . . . . . . . . . . . . . . . . 160
9.6 Modeling IaaS Clouds Configuration Options with Feature
Model . . . . . . . . . . . . . . . . . . . . . . . . . . . . . . . . . 161
9.7 Experimental Results . . . . . . . . . . . . . . . . . . . . . . . . 162
9.7.1 Scenario 1: simple . . . . . . . . . . . . . . . . . . . . . . . . . 170
9.7.2 Scenario 2: compute . . . . . . . . . . . . . . . . . . . . . . . . 170
9.7.3 Scenario 3: compute and memory . . . . . . . . . . . . . . . . . 173
9.8 Related Work . . . . . . . . . . . . . . . . . . . . . . . . . . . . . 173
9.8.1 Virtual Machine Image Configuration . . . . . . . . . . . . . . 175
9.8.2 Virtual Machine Image Deployment . . . . . . . . . . . . . . . 177
9.8.3 Deploying PaaS Applications . . . . . . . . . . . . . . . . . . . 179
9.8.4 Configuration options of multi-tenant applications . . . . . . . 180
145
Chapter 9. Resource Selection Using Automated Feature-Based Configuration
Management in Federated Clouds
9.8.5 Infrastructure Configuration . . . . . . . . . . . . . . . . . . . . 184
9.8.6 Comparative View . . . . . . . . . . . . . . . . . . . . . . . . . 184
9.9 Summary . . . . . . . . . . . . . . . . . . . . . . . . . . . . . . . 188
In the previous chapter, we implemented an architecture and a domain specific language(DSL) that allowed the users to execute a set of ordinary applications on a cloud. Thearchitecture focused on users without cloud computing skills, and implemented an auto-scaling strategy to trie to speed up the execution of the applications. Therefore, weconsidered a simplified environment, where the constraints associated with the resourceswere the same in all clouds belonging to a provider, and we only considered a single cloud.
For that reason, in this chapter, we are interested in using multiple clouds, takinginto account different user profiles. In other words, we aim to help the users on selectingappropriate clouds’ resources to execute their applications on heterogeneous and feder-ated clouds. Hence, we present and evaluate an engineering method based on softwareproduct line (SPL) to achieve these goals. The SPL-based engineering method enablesa declarative and goal-oriented strategy, allowing resource selection and deployment onmultiple clouds.To the best of our knowledge, our engineering method is the first that(a) supports the description of clouds’ services independent of cloud providers; (b) enablesautomatic resource selection and configuration on various clouds, considering temporaland functional dependencies between the resources, which leaves the environment in aconsistent state; (c) offers a level of abstraction suitable for different user profiles (i.e.,system administrators, software developers, and ordinary users).
The remainder of this chapter is organized as follows. In section 9.1, we present theintroduction of this chapter. Section 9.2 presents the motivations behind this chapter, aswell as the challenges we are addressing in this chapter. Sections 9.3 and 9.4 provide abriefly introduction for multi-objective optimization problem (MOOP) and feature model(FM). In section 9.5, we present the proposed cloud model followed by the feature modelsto handle commonalities and variabilities of the clouds. Experimental results are presentedand discussed in section 9.7. Section 9.8 presents and compares related works. Finally,section 9.9 concludes this chapter.
9.1 Introduction
Resource selection in the cloud normally represents a difficult task, mostly because theclouds offer a wide range of resources [200, 392]. Moreover, such resources are usually suitedfor different purposes, and they may have multiple constraints [102, 173]. Learning howto deal with these options may require days or even weeks, without guarantees of meetingthe users needs [179, 346]. In this scenario, the users mostly take decisions based on veryfew data, which can lead to under or over resource provisioning and can also increase thefinancial cost. For example, to execute an application in an IaaS cloud, the users have to:(a) select an instance type, a disk type, and an operating system; (b) install and configureall necessary applications; (c) transfer all data to the cloud; (d) create a virtual machineimage (VMI) to avoid to install and to configure the applications in all nodes, if multiplenodes are needed; and finally, (e) execute their application. However, choosing an instance
146
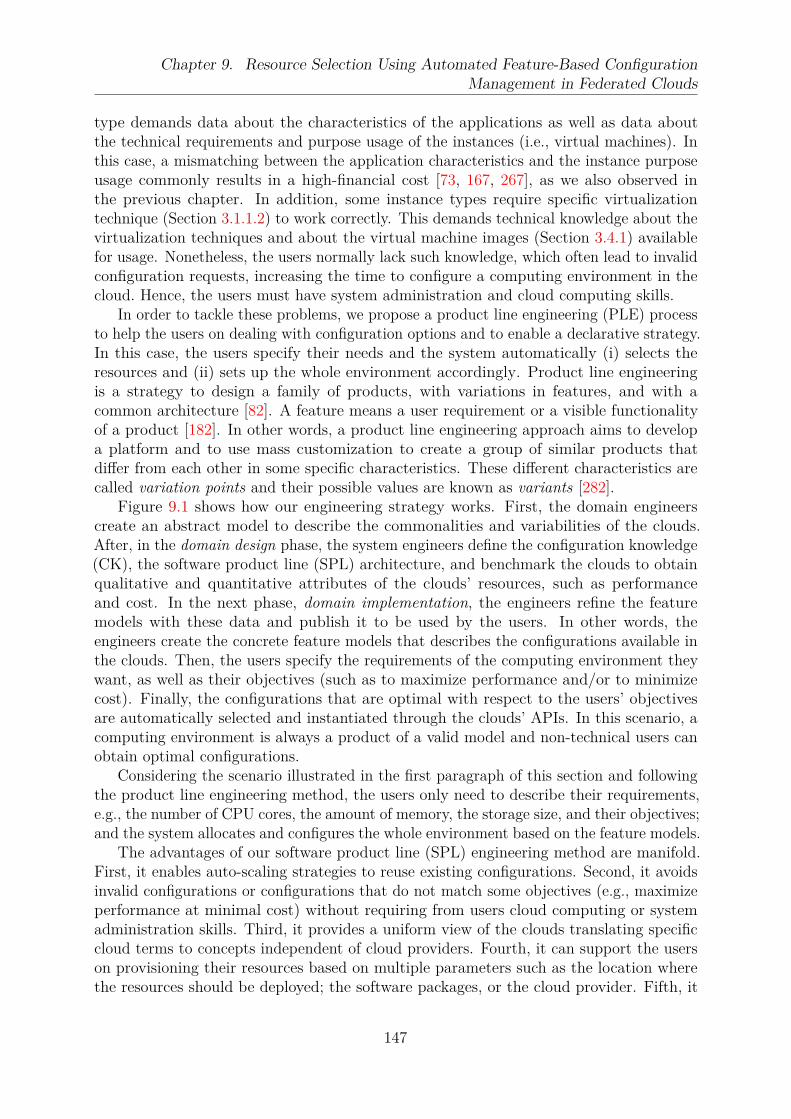
Chapter 9. Resource Selection Using Automated Feature-Based Configuration
Management in Federated Clouds
type demands data about the characteristics of the applications as well as data aboutthe technical requirements and purpose usage of the instances (i.e., virtual machines). Inthis case, a mismatching between the application characteristics and the instance purposeusage commonly results in a high-financial cost [73, 167, 267], as we also observed inthe previous chapter. In addition, some instance types require specific virtualizationtechnique (Section 3.1.1.2) to work correctly. This demands technical knowledge about thevirtualization techniques and about the virtual machine images (Section 3.4.1) availablefor usage. Nonetheless, the users normally lack such knowledge, which often lead to invalidconfiguration requests, increasing the time to configure a computing environment in thecloud. Hence, the users must have system administration and cloud computing skills.
In order to tackle these problems, we propose a product line engineering (PLE) processto help the users on dealing with configuration options and to enable a declarative strategy.In this case, the users specify their needs and the system automatically (i) selects theresources and (ii) sets up the whole environment accordingly. Product line engineeringis a strategy to design a family of products, with variations in features, and with acommon architecture [82]. A feature means a user requirement or a visible functionalityof a product [182]. In other words, a product line engineering approach aims to developa platform and to use mass customization to create a group of similar products thatdiffer from each other in some specific characteristics. These different characteristics arecalled variation points and their possible values are known as variants [282].
Figure 9.1 shows how our engineering strategy works. First, the domain engineerscreate an abstract model to describe the commonalities and variabilities of the clouds.After, in the domain design phase, the system engineers define the configuration knowledge(CK), the software product line (SPL) architecture, and benchmark the clouds to obtainqualitative and quantitative attributes of the clouds’ resources, such as performanceand cost. In the next phase, domain implementation, the engineers refine the featuremodels with these data and publish it to be used by the users. In other words, theengineers create the concrete feature models that describes the configurations available inthe clouds. Then, the users specify the requirements of the computing environment theywant, as well as their objectives (such as to maximize performance and/or to minimizecost). Finally, the configurations that are optimal with respect to the users’ objectivesare automatically selected and instantiated through the clouds’ APIs. In this scenario, acomputing environment is always a product of a valid model and non-technical users canobtain optimal configurations.
Considering the scenario illustrated in the first paragraph of this section and followingthe product line engineering method, the users only need to describe their requirements,e.g., the number of CPU cores, the amount of memory, the storage size, and their objectives;and the system allocates and configures the whole environment based on the feature models.
The advantages of our software product line (SPL) engineering method are manifold.First, it enables auto-scaling strategies to reuse existing configurations. Second, it avoidsinvalid configurations or configurations that do not match some objectives (e.g., maximizeperformance at minimal cost) without requiring from users cloud computing or systemadministration skills. Third, it provides a uniform view of the clouds translating specificcloud terms to concepts independent of cloud providers. Fourth, it can support the userson provisioning their resources based on multiple parameters such as the location wherethe resources should be deployed; the software packages, or the cloud provider. Fifth, it
147
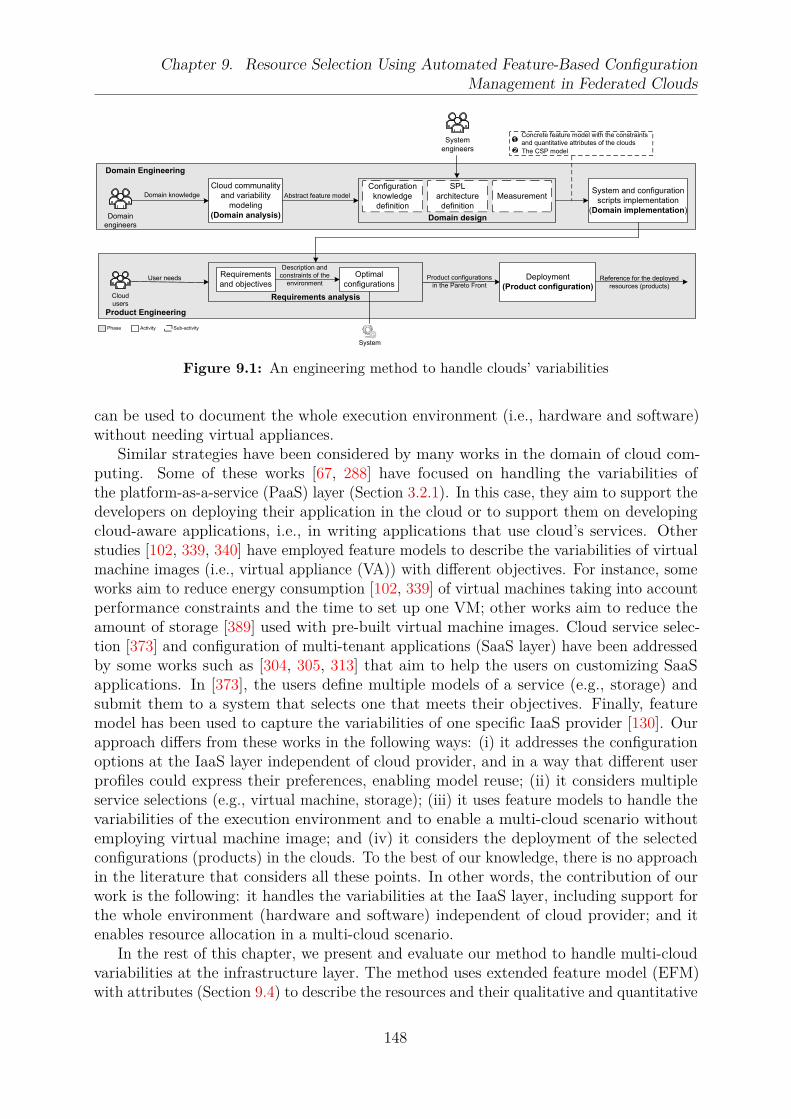
Chapter 9. Resource Selection Using Automated Feature-Based Configuration
Management in Federated Clouds
Cloud communality
and variability
modeling
(Domain analysis)
Deployment
(Product configuration)
Abstract feature model
Concrete feature model with the constraints
and quantitative attributes of the clouds
Product configurations
in the Pareto FrontReference for the deployed
resources (products)
Domain knowledge
System
engineers
Domain
engineers
Cloud
users
Requirements
and objectives
Description and
constraints of the
environment
System
System and configuration
scripts implementation
(Domain implementation)
Optimal
configurations
Requirements analysis
Domain Engineering
Product Engineering
User needs
Configuration
knowledge
definition
Measurement
Domain design
SPL
architecture
definition
The CSP model
1
2
Phase Activity Sub-activity
Figure 9.1: An engineering method to handle clouds’ variabilities
can be used to document the whole execution environment (i.e., hardware and software)without needing virtual appliances.
Similar strategies have been considered by many works in the domain of cloud com-puting. Some of these works [67, 288] have focused on handling the variabilities ofthe platform-as-a-service (PaaS) layer (Section 3.2.1). In this case, they aim to support thedevelopers on deploying their application in the cloud or to support them on developingcloud-aware applications, i.e., in writing applications that use cloud’s services. Otherstudies [102, 339, 340] have employed feature models to describe the variabilities of virtualmachine images (i.e., virtual appliance (VA)) with different objectives. For instance, someworks aim to reduce energy consumption [102, 339] of virtual machines taking into accountperformance constraints and the time to set up one VM; other works aim to reduce theamount of storage [389] used with pre-built virtual machine images. Cloud service selec-tion [373] and configuration of multi-tenant applications (SaaS layer) have been addressedby some works such as [304, 305, 313] that aim to help the users on customizing SaaSapplications. In [373], the users define multiple models of a service (e.g., storage) andsubmit them to a system that selects one that meets their objectives. Finally, featuremodel has been used to capture the variabilities of one specific IaaS provider [130]. Ourapproach differs from these works in the following ways: (i) it addresses the configurationoptions at the IaaS layer independent of cloud provider, and in a way that different userprofiles could express their preferences, enabling model reuse; (ii) it considers multipleservice selections (e.g., virtual machine, storage); (iii) it uses feature models to handle thevariabilities of the execution environment and to enable a multi-cloud scenario withoutemploying virtual machine image; and (iv) it considers the deployment of the selectedconfigurations (products) in the clouds. To the best of our knowledge, there is no approachin the literature that considers all these points. In other words, the contribution of ourwork is the following: it handles the variabilities at the IaaS layer, including support forthe whole environment (hardware and software) independent of cloud provider; and itenables resource allocation in a multi-cloud scenario.
In the rest of this chapter, we present and evaluate our method to handle multi-cloudvariabilities at the infrastructure layer. The method uses extended feature model (EFM)with attributes (Section 9.4) to describe the resources and their qualitative and quantitative
148
Chapter 9. Resource Selection Using Automated Feature-Based Configuration
Management in Federated Clouds
characteristics. We employ constraint programming (CP) to select the resources throughthe Choco [178] constraint satisfaction problem solver. Choco [178] was used since it isa well-known satisfaction problem solver, and also because it has been successfully usedby other works for such purpose (Section 9.8). We developed a prototype to evaluate thewhole process (Figure 9.1) and our model, considering two different cloud providers andmultiple users’ objectives (Section 9.7).
In section 9.2, we describe the motivation and challenges addressed by our modelfollowed by an overview of multi-objective optimization problem (MOOP) (Section 9.3).
9.2 Motivation and Challenges
Currently, with the existing techniques, before executing an application in the cloud,the users have to select the most suited resources for their applications and to configurethem accordingly. Otherwise, the cost and the execution time can be very high. In otherwords, the users have to know the characteristics and the technical requirements of theresources as well as the behavior of their applications. Moreover, to reduce the risks oflosing their work due to cloud failures, it is interesting to consider a multi-cloud scenario.A multi-cloud scenario may also be necessary since a single cloud may have a limitednumber of resources or its resources may not meet the users’ constraints.
In this context, the overall objectives of the users can be defined as: (i) minimize thefinancial cost to execute applications across multiple clouds, and (ii) maximize the usage ofconfigurations that have both best resource capabilities and performance without needingto deal with low-level technical details.
Nevertheless, there exist some open important challenges to address in order to helpusers on achieving these objectives. Some of these challenges are:
challenge 1: capturing clouds heterogeneity and constraints. Normally,clouds’ resources are offered within different geographic regions with different costsand constraints. In addition, they are often deployed in heterogeneous data centersin the same region. In other words, clouds’ variabilities may happen at any level (e.g.region, data center, resource). Hence, the users have to read extensive documentationin order to ensure that their desired resources are available in the cloud and also tounderstand the constraints of each resource. For example, at the time of writing thisthesis, the Amazon EC2 cloud at Virginia has four availability zones (data centers)but only three of them support SSD disks. Thus, in order to know these restrictionsthe users have to test each zone. Furthermore, the clouds usually employ differentterms to describe their resources. For instance, Amazon EC2 uses Elastic ComputingUnit (ECU) as a metric to express the CPU capacity of a virtual machine, whileGoogle Compute Engine uses Google Compute Engine Units (GCEUs). Finally, theclouds often employ high-level terms to describe the performance of their resourcessuch as low, moderate, and high, which limits a decision based only on the resources’descriptions.
challenge 2: matching application requirements with the resources char-acteristics. Determining an optimal-configuration environment for an application inthe cloud can be a difficult task for many reasons. First, cloud environments usually
149
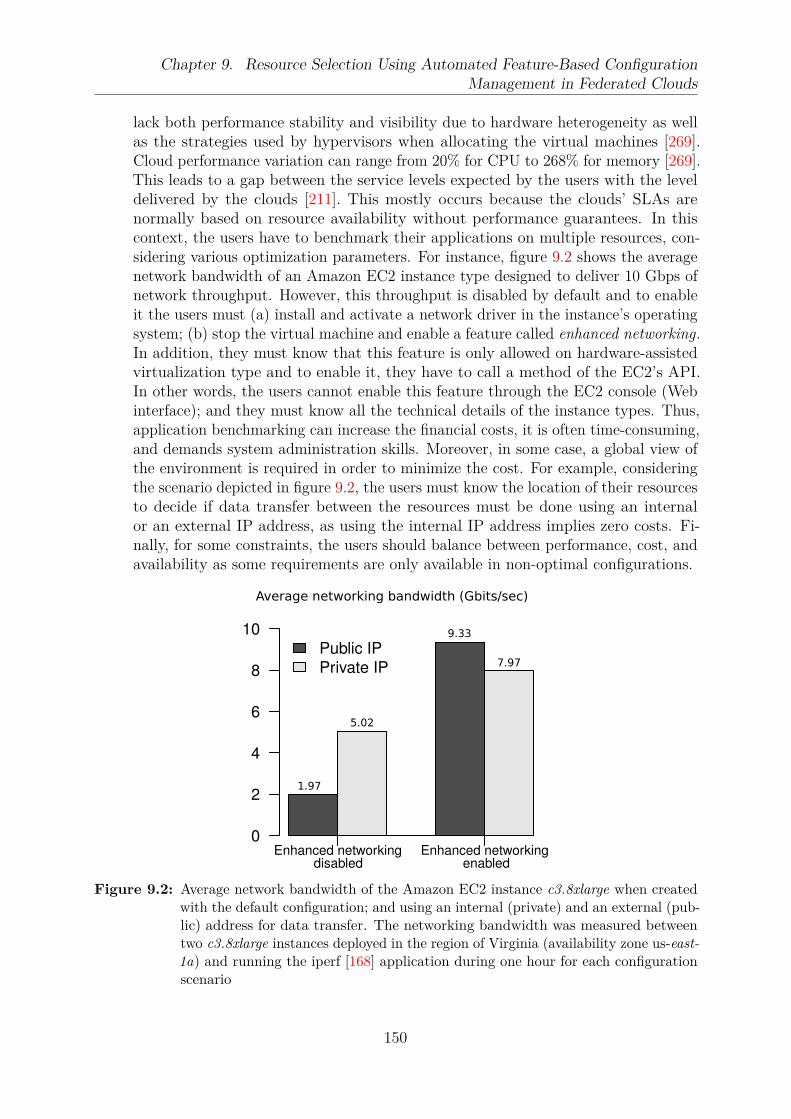
Chapter 9. Resource Selection Using Automated Feature-Based Configuration
Management in Federated Clouds
lack both performance stability and visibility due to hardware heterogeneity as wellas the strategies used by hypervisors when allocating the virtual machines [269].Cloud performance variation can range from 20% for CPU to 268% for memory [269].This leads to a gap between the service levels expected by the users with the leveldelivered by the clouds [211]. This mostly occurs because the clouds’ SLAs arenormally based on resource availability without performance guarantees. In thiscontext, the users have to benchmark their applications on multiple resources, con-sidering various optimization parameters. For instance, figure 9.2 shows the averagenetwork bandwidth of an Amazon EC2 instance type designed to deliver 10 Gbps ofnetwork throughput. However, this throughput is disabled by default and to enableit the users must (a) install and activate a network driver in the instance’s operatingsystem; (b) stop the virtual machine and enable a feature called enhanced networking.In addition, they must know that this feature is only allowed on hardware-assistedvirtualization type and to enable it, they have to call a method of the EC2’s API.In other words, the users cannot enable this feature through the EC2 console (Webinterface); and they must know all the technical details of the instance types. Thus,application benchmarking can increase the financial costs, it is often time-consuming,and demands system administration skills. Moreover, in some case, a global view ofthe environment is required in order to minimize the cost. For example, consideringthe scenario depicted in figure 9.2, the users must know the location of their resourcesto decide if data transfer between the resources must be done using an internalor an external IP address, as using the internal IP address implies zero costs. Fi-nally, for some constraints, the users should balance between performance, cost, andavailability as some requirements are only available in non-optimal configurations.
Enhanced networkingdisabled
Enhanced networkingenabled
Public IP
Private IP
0
2
4
6
8
10 9.33
7.97
5.02
1.97
Average networking bandwidth (Gbits/sec)
Figure 9.2: Average network bandwidth of the Amazon EC2 instance c3.8xlarge when createdwith the default configuration; and using an internal (private) and an external (pub-lic) address for data transfer. The networking bandwidth was measured betweentwo c3.8xlarge instances deployed in the region of Virginia (availability zone us-east-1a) and running the iperf [168] application during one hour for each configurationscenario
150

Chapter 9. Resource Selection Using Automated Feature-Based Configuration
Management in Federated Clouds
challenge 3: describing a multi-cloud deployment environment. Currently,to deploy an application on multiple clouds the users have to configure each cloudindividually. In some cases, they can create a virtual machine image (VMI) withtheir applications. However, the VMI can only handle software package descriptionsleaving for the users the work of selecting a resource and for orchestrating theresources accordingly, i.e., the work of selecting and instantiating the VMI ineach cloud. Hence, we need an approach that can describe the whole computingenvironment, independent of the cloud provider and that also enables automaticresources provisioning on multiple clouds taking into account temporal and functionaldependencies between the resources, to leave the environment in a consistent state.
challenge 4: supporting auto-scaling decisions. Auto-scaling systems andresources on-demand are key features of cloud computing. Therefore, they dependon functional and non-functional data about the resources to avoid under or over-provisioning, as well as to consider clouds’ capabilities. On the one hand, functionalproperties like storage size, type of operating system, and software packages can behandled by virtual appliances, but they may not be appropriate in a multi-cloudscenario due to the network traffic. On the other hand, cloud computing lacks aneasy way to capture non-functional data such as the amount of time to install or toremove a software package; the average time to boot or to release a resource, and thelocation of the resources. Therefore, some of these data are only available via APIcalling, which can lead to vendor lock-in. Furthermore, in case of cloud’s failure, itmay be difficult for users to re-create the environment in another cloud.
9.3 Multi-Objective Optimization
A multi-objective optimization problem (MOOP) can be defined as a problem of findinga vector of decision variables which satisfies constraints and optimizes a vector functionwhose elements represent the objective functions. These functions form a mathematicaldescription of performance criteria which are usually in conflict with each other [268]. Inother words, multi-objective problems are such problems where the goal is to optimize k,often conflicting, objective functions simultaneously and to find a solution which wouldgive the values of all the objective functions acceptable to the decision maker [246].
Therefore, multi-objective optimization problems can be formally defined as fol-lows [352]:
optimize y = F (~x) = (f1(~x), f2(~x), . . . , fk(~x))
subject to gi(~x) = (g1(~x), g2(~x), . . . , gm(~x)) ≤ 0
where ~x = (x1, x2, . . . , xn) ∈ Ω
~y = (y1, y2, . . . , yk) ∈ Λ
(9.1)
where ~x is an n-dimensional decision variable vector; ~y is an n-dimensional objective vector;Ω is denoted as the decision universe (Ω = x ∈ R
n); and Λ is called the objectiveregion (Λ = y ∈ R
k). The constraints gi(~x) ≤ 0 determine the set of feasible solutions.
151

Chapter 9. Resource Selection Using Automated Feature-Based Configuration
Management in Federated Clouds
A feasible set Xf ∈ Ω is defined as the set of decision vectors ~x that satisfy theconstraints gi(~x) ≤ 0:
Xf = x ∈ Ω | gi(~x) ≤ 0 (9.2)
Thus, a multi-objective optimization problem (MOOP) consists of n decisions variables,m constraints, and k objectives of which any or all of the objectives functions can be linear oralso non-linear. The MOOP’s evaluation function maps decision variables (~x = x1, . . . , xn)to objective vectors (~y = y1, . . . , yk). In other words, objective vectors are images ofdecision vectors as shown in figure 9.3.
x1
x2
F1
F2
F3
F
Ω
Decision variable space (Ω) Objective function space ( )
Figure 9.3: MOOP evaluation mapping [352]
Unlike single-objective optimization problems (SOOPs), which may have a uniquesolution for the objective function, an MOOP often presents an infinite [83] set of solutionsthat, when evaluated, produce vectors whose components represent the trade-offs in theobjective space. For instance, in the design of a computer architecture under reliabilityconstraints, cost and performance conflict. An optimal solution would be a computer systemthat achieves maximum performance at minimal cost without violating any constraint.Thus, if such solution exists, we only have to solve a SOOP [312]. In this case, theoptimal solution for one objective is also optimum for the other objective. However,if the individual optima corresponding to the objective functions are different, thereare conflicting objective functions that cannot be optimized simultaneously [394]. Thisis the case of the previous example, since high-performance systems usually have highcost; and low-cost architectures commonly provide low performance. Furthermore, ina single-objective optimization problem, the feasible set is completely ordered accordingto an objective function f , whereas it is partially ordered in multi-objective optimizationproblems.
An MOOP solution can be best, worst, and indifferent according to the objectivevalues (Figure 9.4). Indifferent solutions means solutions neither dominating nor dominatedwith respect to each trade-off. A best solution, on the other hand, means a solution notworst in any of the objectives and at least better in one objective than the other [3]. Asolution is considered optimal if none of its elements can be improved without deterioratingany other objective. Such solution is called Pareto optimal and the entire set of optimaltrade-off is called Pareto-optimal set [84].
152

Chapter 9. Resource Selection Using Automated Feature-Based Configuration
Management in Federated Clouds
Indifferentdominated
Indifferent they are dominating
Pare
to-o
ptim
al so
lutio
ns
f1
f2
Figure 9.4: Pareto optimality for the objective space F (~x) = (f1(~x), f2(~x)) [119]
In the following, important Pareto concepts used in multi-objective optimizationproblems are presented [352]1:
1. Pareto Dominance: For any two decision vectors ~u = (u1, . . . , uk) ∈ Ω and~v = (v1, . . . , vk) ∈ Ω:
~u ≺ ~v (~u dominates ~v) ⇐⇒ ∀ i ∈ 1, . . . , k, fi(~u) > fi(~v)
~u ~v (~u weakly dominates ~v) ⇐⇒ ∀ i ∈ 1, . . . , k, fi(~u) ≥ fi(~v)
~u ∼ ~v (~u is indifferent to ~v) ⇐⇒ ∃ i ∈ 1, . . . , k, fi(~u) ≥ fi(~v)
∧ ∃ j ∈ 1, . . . , k, fj(~u) < fj(~v)
(9.3)
In other words, the decision vector ~u dominates ~v if and only if, ~u is as good as ~vconsidering all objectives, and ~u is strictly better than ~v in at least one objective.
2. Pareto Optimality: A solution x ∈ Ω is said to be Pareto optimal regarding to Ωif and only if there is no x′ ∈ Ω for which ~v = F (x′) = (f1(x′), . . . , fk(x′)) dominates~u = F (x) = (f1(x), . . . , fk(x)). The set of all Pareto-optimal solutions is calledthe Pareto-optimal set. The corresponding set of objective vectors is known as thenon-dominated set, surface or Pareto-optimal front. In practice, it is common forthese terms to be used interchangeably to describe solutions of an MOOP [119].
1Without loss of generality, a maximization problem is assumed
153
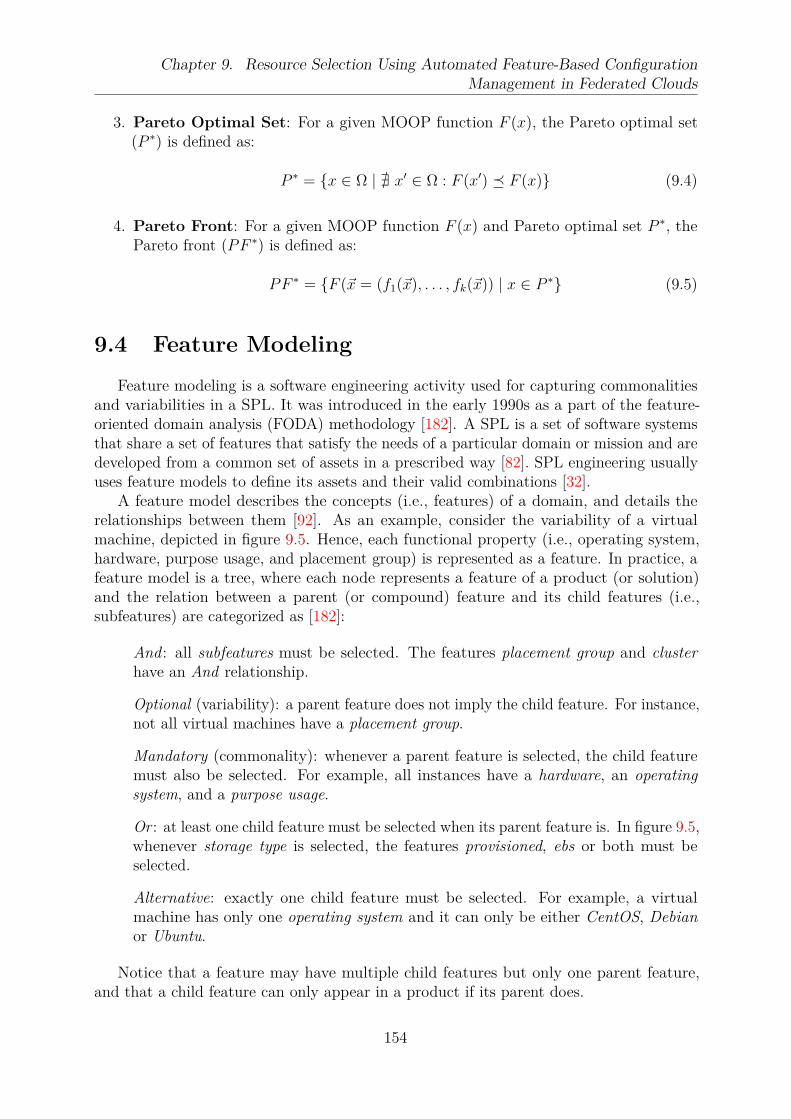
Chapter 9. Resource Selection Using Automated Feature-Based Configuration
Management in Federated Clouds
3. Pareto Optimal Set: For a given MOOP function F (x), the Pareto optimal set(P ∗) is defined as:
P ∗ = x ∈ Ω | ∄ x′ ∈ Ω : F (x′) F (x) (9.4)
4. Pareto Front: For a given MOOP function F (x) and Pareto optimal set P ∗, thePareto front (PF ∗) is defined as:
PF ∗ = F (~x = (f1(~x), . . . , fk(~x)) | x ∈ P ∗ (9.5)
9.4 Feature Modeling
Feature modeling is a software engineering activity used for capturing commonalitiesand variabilities in a SPL. It was introduced in the early 1990s as a part of the feature-oriented domain analysis (FODA) methodology [182]. A SPL is a set of software systemsthat share a set of features that satisfy the needs of a particular domain or mission and aredeveloped from a common set of assets in a prescribed way [82]. SPL engineering usuallyuses feature models to define its assets and their valid combinations [32].
A feature model describes the concepts (i.e., features) of a domain, and details therelationships between them [92]. As an example, consider the variability of a virtualmachine, depicted in figure 9.5. Hence, each functional property (i.e., operating system,hardware, purpose usage, and placement group) is represented as a feature. In practice, afeature model is a tree, where each node represents a feature of a product (or solution)and the relation between a parent (or compound) feature and its child features (i.e.,subfeatures) are categorized as [182]:
And: all subfeatures must be selected. The features placement group and clusterhave an And relationship.
Optional (variability): a parent feature does not imply the child feature. For instance,not all virtual machines have a placement group.
Mandatory (commonality): whenever a parent feature is selected, the child featuremust also be selected. For example, all instances have a hardware, an operatingsystem, and a purpose usage.
Or : at least one child feature must be selected when its parent feature is. In figure 9.5,whenever storage type is selected, the features provisioned, ebs or both must beselected.
Alternative: exactly one child feature must be selected. For example, a virtualmachine has only one operating system and it can only be either CentOS, Debianor Ubuntu.
Notice that a feature may have multiple child features but only one parent feature,and that a child feature can only appear in a product if its parent does.
154
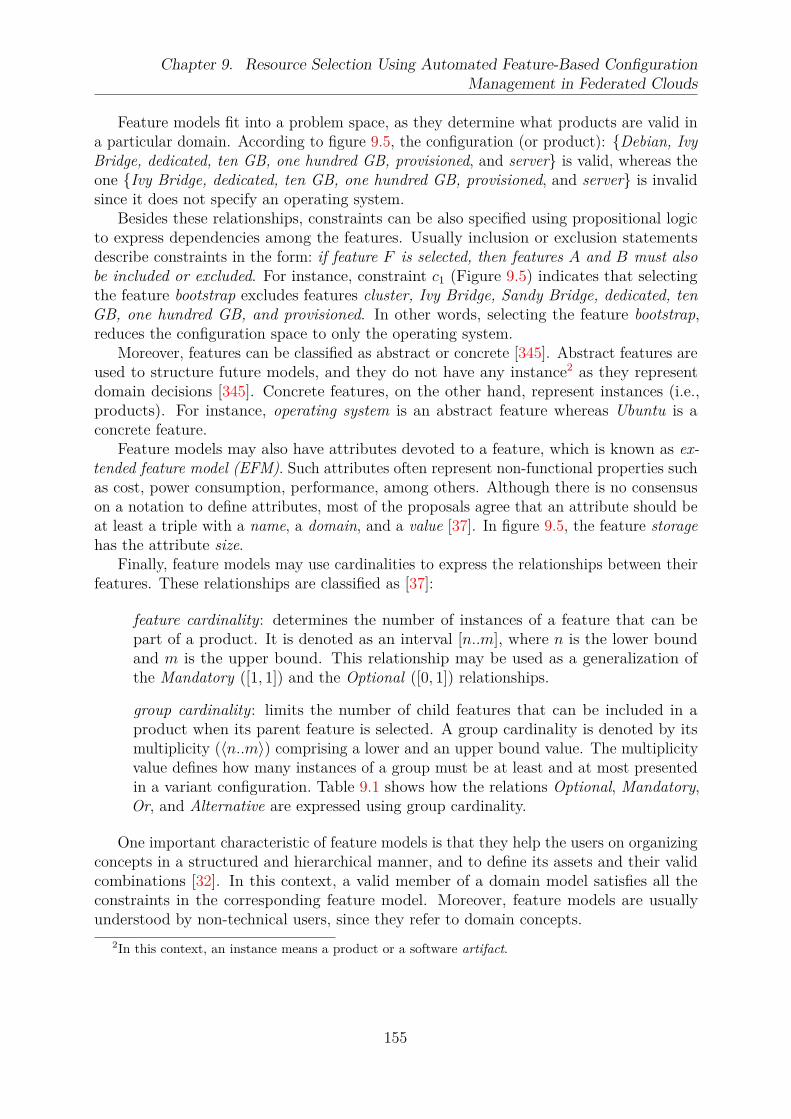
Chapter 9. Resource Selection Using Automated Feature-Based Configuration
Management in Federated Clouds
Feature models fit into a problem space, as they determine what products are valid ina particular domain. According to figure 9.5, the configuration (or product): Debian, IvyBridge, dedicated, ten GB, one hundred GB, provisioned, and server is valid, whereas theone Ivy Bridge, dedicated, ten GB, one hundred GB, provisioned, and server is invalidsince it does not specify an operating system.
Besides these relationships, constraints can be also specified using propositional logicto express dependencies among the features. Usually inclusion or exclusion statementsdescribe constraints in the form: if feature F is selected, then features A and B must alsobe included or excluded. For instance, constraint c1 (Figure 9.5) indicates that selectingthe feature bootstrap excludes features cluster, Ivy Bridge, Sandy Bridge, dedicated, tenGB, one hundred GB, and provisioned. In other words, selecting the feature bootstrap,reduces the configuration space to only the operating system.
Moreover, features can be classified as abstract or concrete [345]. Abstract features areused to structure future models, and they do not have any instance2 as they representdomain decisions [345]. Concrete features, on the other hand, represent instances (i.e.,products). For instance, operating system is an abstract feature whereas Ubuntu is aconcrete feature.
Feature models may also have attributes devoted to a feature, which is known as ex-tended feature model (EFM). Such attributes often represent non-functional properties suchas cost, power consumption, performance, among others. Although there is no consensuson a notation to define attributes, most of the proposals agree that an attribute should beat least a triple with a name, a domain, and a value [37]. In figure 9.5, the feature storagehas the attribute size.
Finally, feature models may use cardinalities to express the relationships between theirfeatures. These relationships are classified as [37]:
feature cardinality: determines the number of instances of a feature that can bepart of a product. It is denoted as an interval [n..m], where n is the lower boundand m is the upper bound. This relationship may be used as a generalization ofthe Mandatory ([1, 1]) and the Optional ([0, 1]) relationships.
group cardinality: limits the number of child features that can be included in aproduct when its parent feature is selected. A group cardinality is denoted by itsmultiplicity (〈n..m〉) comprising a lower and an upper bound value. The multiplicityvalue defines how many instances of a group must be at least and at most presentedin a variant configuration. Table 9.1 shows how the relations Optional, Mandatory,Or, and Alternative are expressed using group cardinality.
One important characteristic of feature models is that they help the users on organizingconcepts in a structured and hierarchical manner, and to define its assets and their validcombinations [32]. In this context, a valid member of a domain model satisfies all theconstraints in the corresponding feature model. Moreover, feature models are usuallyunderstood by non-technical users, since they refer to domain concepts.
2In this context, an instance means a product or a software artifact.
155
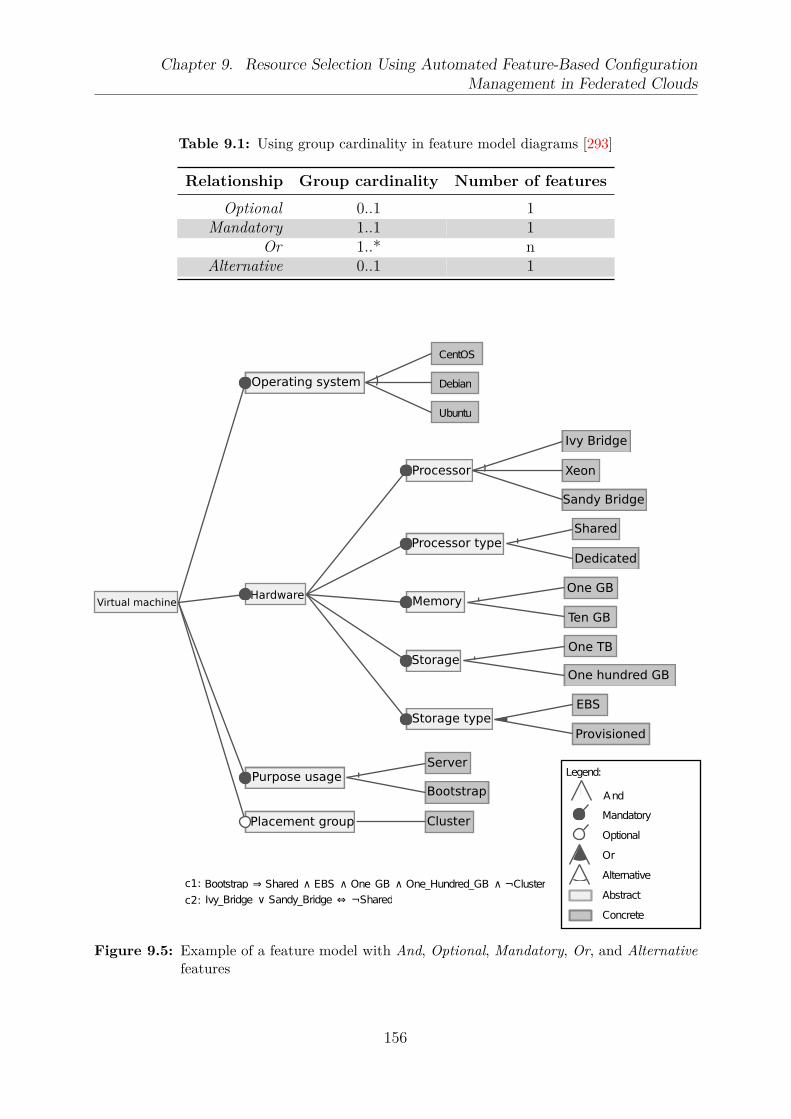
Chapter 9. Resource Selection Using Automated Feature-Based Configuration
Management in Federated Clouds
Table 9.1: Using group cardinality in feature model diagrams [293]
Relationship Group cardinality Number of features
Optional 0..1 1Mandatory 1..1 1
Or 1..* nAlternative 0..1 1
CentOS
Debian
Ubuntu
Legend:
MandatoryOptionalOrAlternativeAbstractConcrete
Bootstrap ⇒ Shared ∧ EBS ∧ One_GB ∧ One_Hundred_GB ∧ ¬ClusterIvy_Bridge ∨ Sandy_Bridge ⇔ ¬Shared
c1:c2:
Operating system
Processor
Ivy Bridge
Xeon
Sandy Bridge
Shared
Dedicated
One GB
Ten GB
One TB
One hundred GB
EBS
ProvisionedStorage type
Storage
Memory
Processor type
Server
Cluster
Bootstrap
Placement group
Purpose usage
HardwareVirtual machine
And
Figure 9.5: Example of a feature model with And, Optional, Mandatory, Or, and Alternativefeatures
156

Chapter 9. Resource Selection Using Automated Feature-Based Configuration
Management in Federated Clouds
9.5 Proposed Model
This section presents our cloud model to handle the variability points of IaaS clouds.It aims to enable resource selection based on quantitative attributes and on the users’objectives. For a better understanding, table 9.2 presents the concepts/symbols used inthis section and their meaning.
Table 9.2: Notation of the model
Name Meaning
cj Cloud j
q Number of cloudsri,j Resource i from cloud j
lci,j Network bandwidth between the resources i and j
iti,j Instance type i of cloud j
lagi,j Acquisition time of instance i in cloud j
itdi,j,k Disk i of instance type j in cloud k
Θi,j Set of disks from instance type i in cloud j
estwi,j Estimated execution time of workload k in resource i which belongs to cloud j
costi,j Financial cost of resource i in cloud j
σi,j Maximum number of virtual machines allowed for an instance type i in cloud j
vmii,j Virtual machine image i in cloud j
ηi,j Maximum number of disk allowed for the instance type i in cloud j
ωi,j Total amount of disk space, in gigabytes, that can be mounted by instance type i in cloud j
tpsj Maximum aggregate disk space that can be provisioned in cloud j
dti,j Disk type i in the cloud j
mini,j Minimum size in gigabytes of a disk type i in cloud j
maxi,j Maximum size in gigabytes of a disk type i in cloud j
diski,j,k Disk i of type j in cloud k
dsi Size in gigabytes of disk i
dpi Performance in IOPS of disk i
dthi Technology of disk i
ρi,j Size of virtual machine image i, in gigabytes, in cloud j
vti,j Virtualization technique of virtual machine image i in cloud j
spi,j Software packages of virtual machine image i in cloud j
vk Maximum number of virtual machines in cloud k
δj,k Number of virtual machines of type j hosted in cloud k
vmi,j,k Virtual machine i of type j hosted in cloud k
bdi,k Boot disk of virtual machine i in cloud k
nadi,k Number of attached disks to a virtual machine i in cloud k
Ψi,k Total disks size mounted by VM i in cloud k
Hi,j,k(t) Matrix of virtual machines allocation (vmi,j hosted in cloud k at the time t)pricei Real price of virtual machine i
pmi Price model of virtual machine i. For example, on-demand, spot, reservedazi,k Zone (data center) where virtual machine i of cloud k is deployedgi,k Group of the virtual machine i in cloud k
ici A metric that determines the capacity of virtual machine i (c.f. table 3.2)ipti Performance trust of virtual machine i (c.f. table 3.2)
νi Internal networking cost of cloud i
λi External networking cost of cloud i
ϕi Networking cost of cloud i
φi Storage cost of cloud i
157

Chapter 9. Resource Selection Using Automated Feature-Based Configuration
Management in Federated Clouds
9.5.1 Cloud Computing Model
We assume a cloud computing system with a set of q clouds denoted as C =c1, c2, . . . , cq. The clouds are defined as an undirected graph G(R, L) where R =ri,j, 1 ≤ j ≤ q ∧ 1 ≤ i ≤ nj represents a set of virtual machines (VMs)3 deployedacross the clouds, and L is a set of edges connecting these VMs. Each edge (r, r′) ∈ Lhas a capacity value lcr,r′ , representing the network bandwidth between the VMs r and r′,with lcr,r′ > 0. A virtual machine belongs to an instance type and it has a price model,a virtual machine image (VMI), and at least one disk. Additionally, a VM is deployedin a zone (data center) and it may belong to a group. In the remainder of this section jusually refers to the g cloud where the resource stands.
9.5.1.1 Instance Type Model
A cloud cj, 1 ≤ j ≤ q offers a set of mj instance types denoted by ITj =it1,j, it2,j, . . . , itm,j. The instance types have different capabilities such as processingpower, network throughput, and a cost per use. The cost is defined per unit of time (e.g.,per hour) and any partial usage is rounded up to the next time unit. For instance, ina hourly-based scenario, the cost for using an instance during one hour and one minuteis the same as using it during two hours. Moreover, an instance type has a family typethat determines a target workload (e.g., CPU-, Memory-, I/O-optimized), i.e., a purposeusage. Furthermore, it has a non-negligible and varying acquisition time shortly denotedas lagi,j, 1 ≤ i ≤ m ∧ 1 ≤ j ≤ k. Additionally, an instance type iti,j may have a set ofdisks denoted by Θi,j = itd1,i,j, itd2,i,j, . . . , itdd,i,j, d ∈ N+. Finally, a cloud may limitthe number of instances of each type that can be acquired by a user.
Formally, an instance type iti,j is defined as a tuple with an expected execution timefor a given workload (estw
i,j), a hourly-based price (costi,j), an acquisition time (lagi,j), themaximum number of instances (σi,j ∈ Z∗) allowed for it, and a set of disks (Θi,j).
iti,j = < estwi,j, costi,j, lagi,j, σi,j, Θi,j > (9.6)
Additionally, an instance type may have a restriction on the maximum number of disksand on the total amount of disk space that can be mounted simultaneously. Let ηi,j ∈ N∗
be the maximum number of disk allowed for an instance type i, ωi,j be the total amountof disk space, in gigabytes, that can be mounted by a type i, and tpsj the maximumaggregate disk space that can be provisioned by a user in the cloud j.
9.5.1.2 Disk Model
A cloud offers a set of disk types to be used by a virtual machine. Example of disk typesare ephemeral or instance disks, persistent, and object store. Let dti,j be a disk type i inthe cloud j. In this case, dti,j is a tuple with a minimum (mini,j) and a maximum (maxi,j)size in gigabytes, and a cost per gigabytes/month (costi,j).
dti,j = < mini,j, maxi,j, costi,j > (9.7)
3The terms instance, node, and virtual machine are used interchangeably in this chapter
158

Chapter 9. Resource Selection Using Automated Feature-Based Configuration
Management in Federated Clouds
In this context, a disk (diski,j,k) has a type (dtj,k), a size in gigabytes (dsi), a perfor-mance (dpi) defined as the number of input/output operations per second (IOPS), and adisk technology (dthi). Example of disk technologies are standard4 and SSD.
diski,j,k = < dti,k, dsi, dpi, dthi > (9.8)
where, minj,k ≤ dsi ≤ maxj,k andn∑
i=1
dsi ≤ tpsk.
9.5.1.3 Virtual Machine Image Model
A virtual machine image (VMI) is a disk that contains an operating system and aroot file system required to start a virtual machine. Moreover, it is designed to run ona hypervisor (i.e., virtualization technique), and it may have a set of software packages.Formally, a VMI (vmii,j) is a tuple with a cost per hour (costi,j), a size in gigabytes (ρi,j),a virtualization technique (vti,j), and a set of software packages (spi,j).
vmii,j = < costi,j, ρi,j, vti,j, spi,j > (9.9)
with ρi,j ≤ tpsj.
9.5.1.4 Instance Model
An instance is a virtual machine (VM) deployed in a cloud k. A V M i (vmi,j,k) belongsto only one instance type (j) and to only one cloud (k). It cannot be migrated, and acloud may limit the number of instances that can be acquired.
Let δj,k be the number of virtual machines of type j hosted by cloud ck. Thus, δj,k ≤ σj,k,and the maximum number of virtual machines in the cloud (ck) is:
vk ≤m∑
j=1
δj,k (9.10)
An instance requires a virtual machine image (vmii,k) and a boot disk (bdi,k) withdsi ≥ ρi, where dsi is boot disk (bdi,k) size. Additionally, it may have a set of attacheddisks. Let nadi,k be the number of attached disks of a virtual machine i, and Ψi,k thecurrent total disk size mounted by VM i. Thus, nadi,k ≤ ηj,k and ωj,k ≤ Ψi,k ≤ tpsk. Inother words, the number and amount of disks attached by a virtual machine must be atmost the allowed for its instance type.
We use a binary integer matrix Hi,j,k(t) to represent the deployment of a VM in acloud at the time (t), where:
Hi,j,k(t) =
1 if vmi,j is hosted by the cloud ck during the period t
0 otherwise(9.11)
4Standard disks are often network storages that can be mounted by a virtual machine, which offer thesame functions of a regular hard disk attached to a computer.
159

Chapter 9. Resource Selection Using Automated Feature-Based Configuration
Management in Federated Clouds
Moreover, a instance runs in a zone (data center) and it can belong to a group.An instance vmi,j,k can be defined as a tuple with a price, a pricing model (pmi),
a virtual machine image (vmii,k), a boot disk (bdi,k), a zone (azi,k), a group (gi,k), and themetrics: instance capability (IC) and performance trust (IPT), detailed in section 3.3.2.
vmi,j,k = < pricei, pmi, vmii,k, bdi,k, ici, ipti > (9.12)
9.5.2 Cost Model
9.5.2.1 Networking and Storage Cost
Each cloud may have different monetary costs for data transfer (i.e., network pricing)and data provisioning (i.e., storage).
The data transfer cost consists of the inbound and outbound price per gigabytes. Inother words, it is the network cost per amount of data transferred from/to a cloud’sresource. It is defined as internal when the resources are located at the same cloud orexternal when one resource belongs to another cloud (i.e., the Internet traffic). Let νi andλi be respectively the internal and external networking costs of the cloud i. Thus, thenetworking cost can be defined as:
ϕi = νi + λi (9.13)
The data provisioning, on the other hand, is the monetary storage cost. The cloudsoften consider three storage costs: the provisioned space cost (i.e., disks cost), the snapshotstorage cost, and the image storage cost. The provisioned space is the cost of the provisioneddisks. The snapshot storage cost is the price to pay for taking a snapshot of an instanceand to store it in the cloud. Finally, the image storage cost is the price to store a virtualmachine image (VMI) in a cloud. These costs are defined in gigabytes per dollar. Let φk
be the total storage cost in the cloud k. It can be defined as follows:
φk =n∑
i=1
dsi ∗ costi,k +n∑
j=1
dsj ∗ costj,k +n∑
l=1
dsl ∗ costl,k (9.14)
where dsi, dsj, and dsl are respectively the size of: disk i, snapshot j, and image l ingigabytes.
9.5.2.2 Instance Cost
A virtual machine can be acquired following three pricing models: on-demand, spot,and reserved. The on-demand model has a fixed cost. The spot model, on the other hand,has a varying model, where the users can specify the maximum value that they would liketo pay. Finally, in the reserved model, the users pay in advance to use the cloud during afixed time.
160
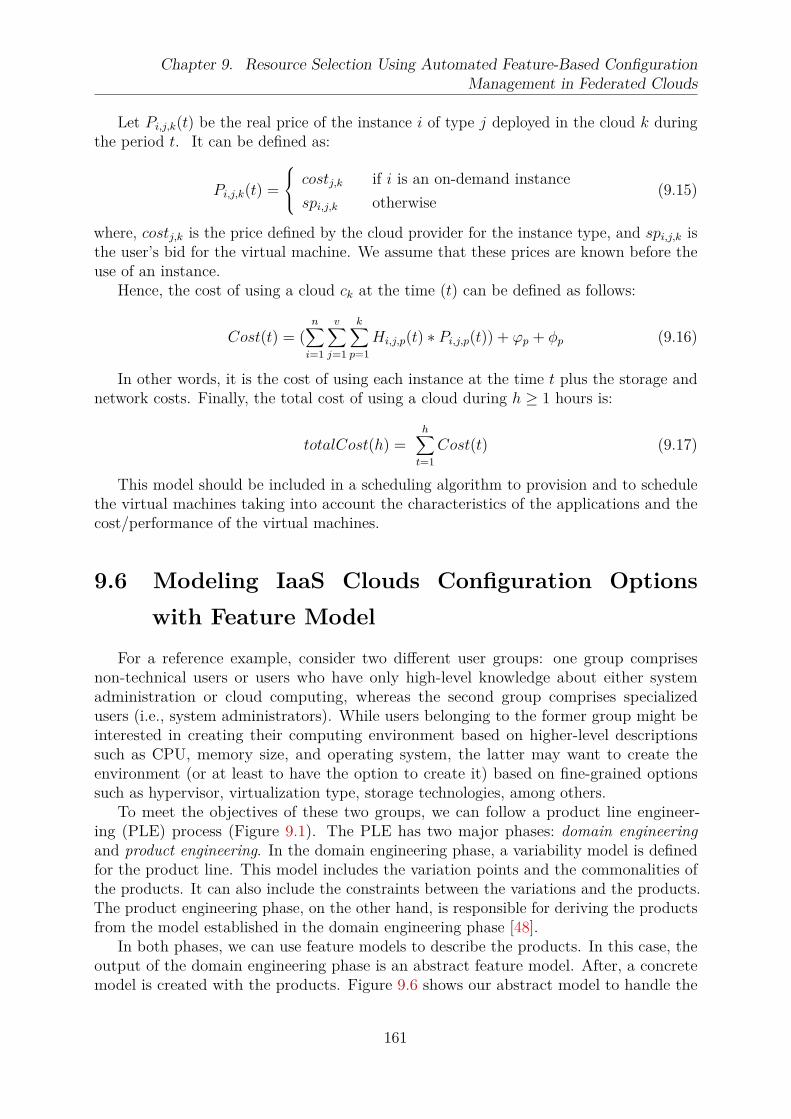
Chapter 9. Resource Selection Using Automated Feature-Based Configuration
Management in Federated Clouds
Let Pi,j,k(t) be the real price of the instance i of type j deployed in the cloud k duringthe period t. It can be defined as:
Pi,j,k(t) =
costj,k if i is an on-demand instance
spi,j,k otherwise(9.15)
where, costj,k is the price defined by the cloud provider for the instance type, and spi,j,k isthe user’s bid for the virtual machine. We assume that these prices are known before theuse of an instance.
Hence, the cost of using a cloud ck at the time (t) can be defined as follows:
Cost(t) = (n∑
i=1
v∑
j=1
k∑
p=1
Hi,j,p(t) ∗ Pi,j,p(t)) + ϕp + φp (9.16)
In other words, it is the cost of using each instance at the time t plus the storage andnetwork costs. Finally, the total cost of using a cloud during h ≥ 1 hours is:
totalCost(h) =h∑
t=1
Cost(t) (9.17)
This model should be included in a scheduling algorithm to provision and to schedulethe virtual machines taking into account the characteristics of the applications and thecost/performance of the virtual machines.
9.6 Modeling IaaS Clouds Configuration Options
with Feature Model
For a reference example, consider two different user groups: one group comprisesnon-technical users or users who have only high-level knowledge about either systemadministration or cloud computing, whereas the second group comprises specializedusers (i.e., system administrators). While users belonging to the former group might beinterested in creating their computing environment based on higher-level descriptionssuch as CPU, memory size, and operating system, the latter may want to create theenvironment (or at least to have the option to create it) based on fine-grained optionssuch as hypervisor, virtualization type, storage technologies, among others.
To meet the objectives of these two groups, we can follow a product line engineer-ing (PLE) process (Figure 9.1). The PLE has two major phases: domain engineeringand product engineering. In the domain engineering phase, a variability model is definedfor the product line. This model includes the variation points and the commonalities ofthe products. It can also include the constraints between the variations and the products.The product engineering phase, on the other hand, is responsible for deriving the productsfrom the model established in the domain engineering phase [48].
In both phases, we can use feature models to describe the products. In this case, theoutput of the domain engineering phase is an abstract feature model. After, a concretemodel is created with the products. Figure 9.6 shows our abstract model to handle the
161
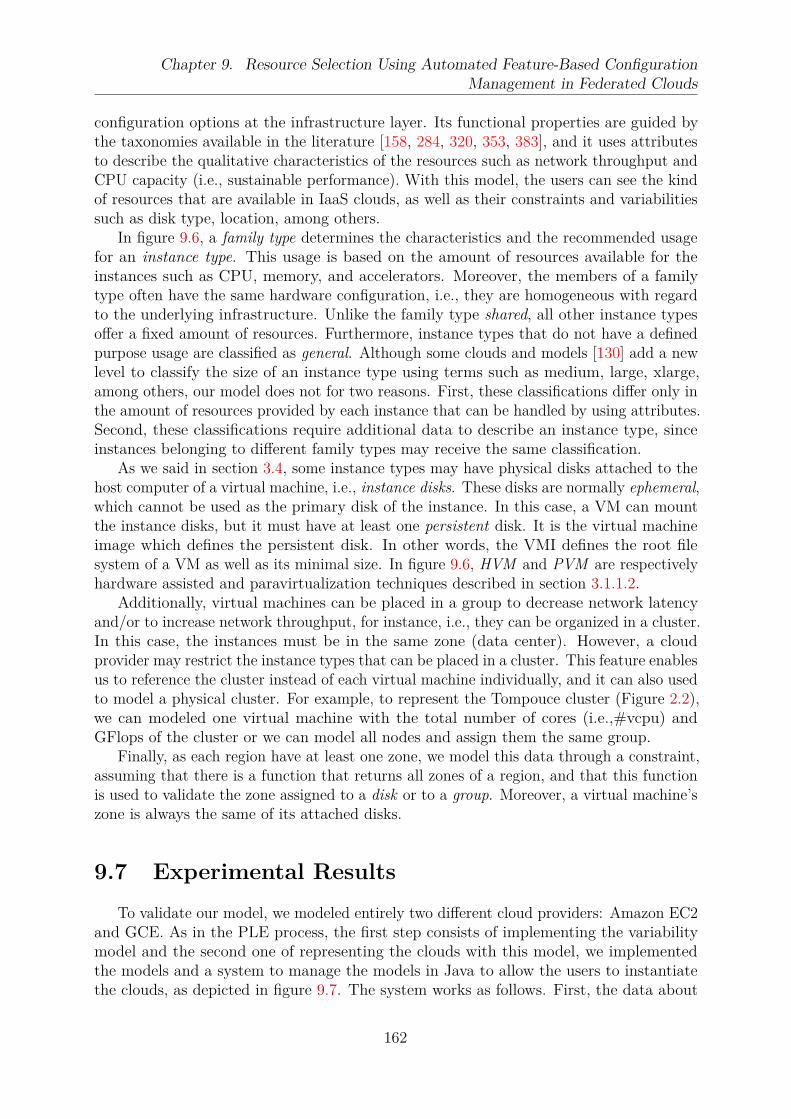
Chapter 9. Resource Selection Using Automated Feature-Based Configuration
Management in Federated Clouds
configuration options at the infrastructure layer. Its functional properties are guided bythe taxonomies available in the literature [158, 284, 320, 353, 383], and it uses attributesto describe the qualitative characteristics of the resources such as network throughput andCPU capacity (i.e., sustainable performance). With this model, the users can see the kindof resources that are available in IaaS clouds, as well as their constraints and variabilitiessuch as disk type, location, among others.
In figure 9.6, a family type determines the characteristics and the recommended usagefor an instance type. This usage is based on the amount of resources available for theinstances such as CPU, memory, and accelerators. Moreover, the members of a familytype often have the same hardware configuration, i.e., they are homogeneous with regardto the underlying infrastructure. Unlike the family type shared, all other instance typesoffer a fixed amount of resources. Furthermore, instance types that do not have a definedpurpose usage are classified as general. Although some clouds and models [130] add a newlevel to classify the size of an instance type using terms such as medium, large, xlarge,among others, our model does not for two reasons. First, these classifications differ only inthe amount of resources provided by each instance that can be handled by using attributes.Second, these classifications require additional data to describe an instance type, sinceinstances belonging to different family types may receive the same classification.
As we said in section 3.4, some instance types may have physical disks attached to thehost computer of a virtual machine, i.e., instance disks. These disks are normally ephemeral,which cannot be used as the primary disk of the instance. In this case, a VM can mountthe instance disks, but it must have at least one persistent disk. It is the virtual machineimage which defines the persistent disk. In other words, the VMI defines the root filesystem of a VM as well as its minimal size. In figure 9.6, HVM and PVM are respectivelyhardware assisted and paravirtualization techniques described in section 3.1.1.2.
Additionally, virtual machines can be placed in a group to decrease network latencyand/or to increase network throughput, for instance, i.e., they can be organized in a cluster.In this case, the instances must be in the same zone (data center). However, a cloudprovider may restrict the instance types that can be placed in a cluster. This feature enablesus to reference the cluster instead of each virtual machine individually, and it can also usedto model a physical cluster. For example, to represent the Tompouce cluster (Figure 2.2),we can modeled one virtual machine with the total number of cores (i.e.,#vcpu) andGFlops of the cluster or we can model all nodes and assign them the same group.
Finally, as each region have at least one zone, we model this data through a constraint,assuming that there is a function that returns all zones of a region, and that this functionis used to validate the zone assigned to a disk or to a group. Moreover, a virtual machine’szone is always the same of its attached disks.
9.7 Experimental Results
To validate our model, we modeled entirely two different cloud providers: Amazon EC2and GCE. As in the PLE process, the first step consists of implementing the variabilitymodel and the second one of representing the clouds with this model, we implementedthe models and a system to manage the models in Java to allow the users to instantiatethe clouds, as depicted in figure 9.7. The system works as follows. First, the data about
162
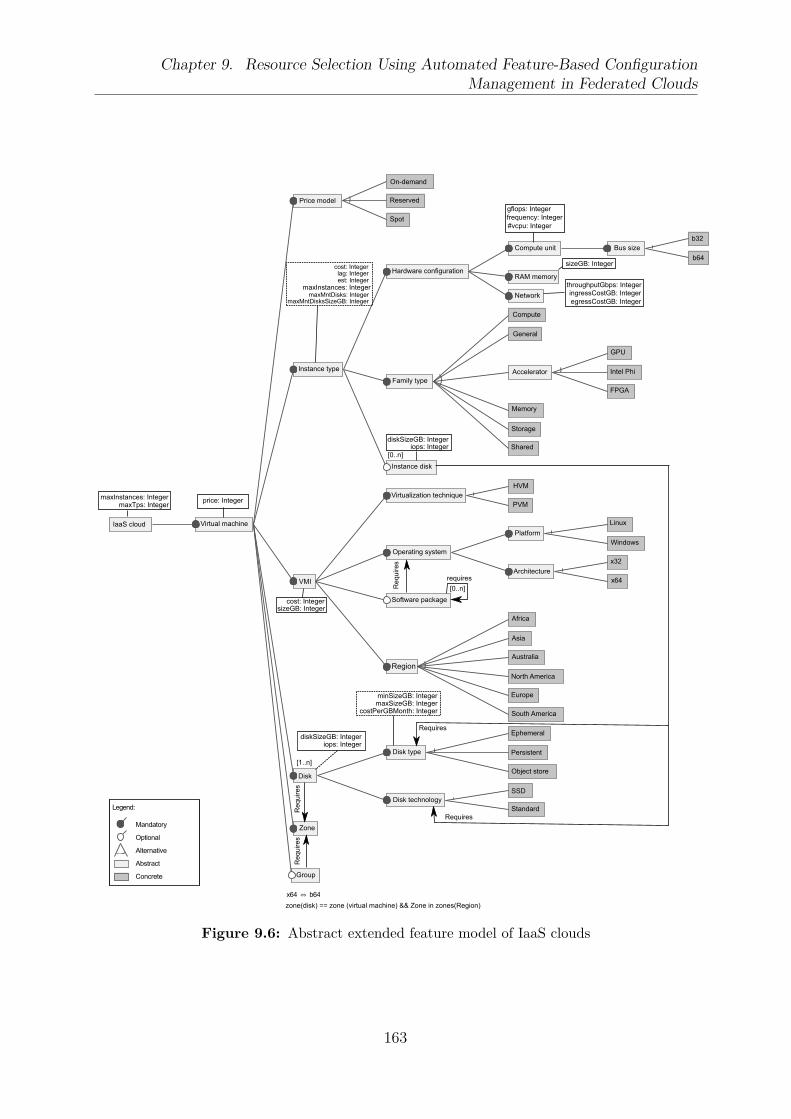
Chapter 9. Resource Selection Using Automated Feature-Based Configuration
Management in Federated Clouds
Legend:
Mandatory
Optional
Alternative
Abstract
Concrete
x64 ⇔ b64
IaaS cloud Virtual machine
Price model
On-demand
Reserved
Spot
Hardware configuration
Compute unit Bus sizeb32
b64
RAM memory
Network
Compute
General
Instance type
Family type
Instance disk
Operating system
Virtualization technique
Memory
Storage
Shared
GPU
Intel Phi
FPGA
Accelerator
Platform
Architecture
Linux
Windows
x32
x64
Software package
HVM
PVM
VMI
Disk type
Disk technology
Disk
Zone
Group
Africa
Asia
Australia
North America
Europe
South America
Ephemeral
Persistent
Object store
SSD
Standard
gflops: Integerfrequency: Integer#vcpu: Integer
sizeGB: Integer
throughputGbps: IntegeringressCostGB: IntegeregressCostGB: Integer
Requires
Requires
Req
uire
sR
equi
res
[1..n]
diskSizeGB: Integer
minSizeGB: IntegermaxSizeGB: Integer
iops: Integer
costPerGBMonth: Integer
Region
[0..n]
diskSizeGB: Integeriops: Integer
Req
uire
s
requires[0..n]
cost: Integerlag: Integerest: Integer
maxMntDisks: IntegermaxMntDisksSizeGB: Integer
maxTps: IntegermaxInstances: Integer
zone(disk) == zone (virtual machine) && Zone in zones(Region)
cost: IntegersizeGB: Integer
maxInstances: Integer
price: Integer
Figure 9.6: Abstract extended feature model of IaaS clouds
163
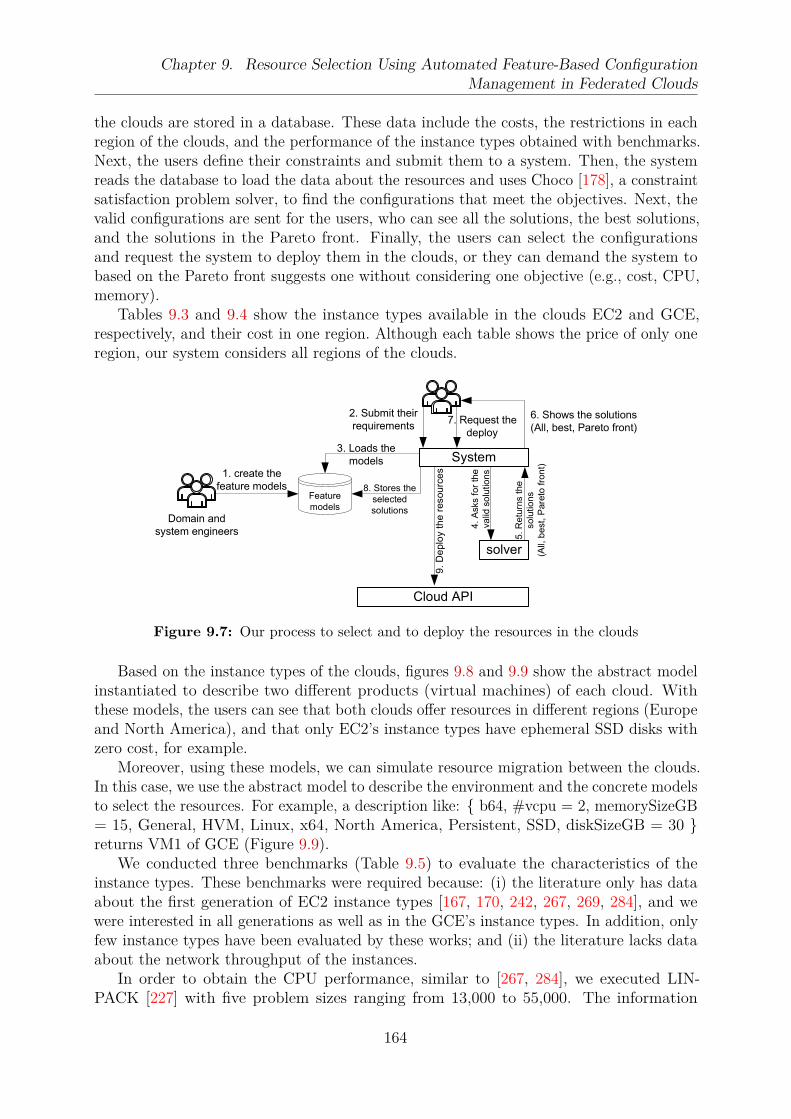
Chapter 9. Resource Selection Using Automated Feature-Based Configuration
Management in Federated Clouds
the clouds are stored in a database. These data include the costs, the restrictions in eachregion of the clouds, and the performance of the instance types obtained with benchmarks.Next, the users define their constraints and submit them to a system. Then, the systemreads the database to load the data about the resources and uses Choco [178], a constraintsatisfaction problem solver, to find the configurations that meet the objectives. Next, thevalid configurations are sent for the users, who can see all the solutions, the best solutions,and the solutions in the Pareto front. Finally, the users can select the configurationsand request the system to deploy them in the clouds, or they can demand the system tobased on the Pareto front suggests one without considering one objective (e.g., cost, CPU,memory).
Tables 9.3 and 9.4 show the instance types available in the clouds EC2 and GCE,respectively, and their cost in one region. Although each table shows the price of only oneregion, our system considers all regions of the clouds.
Domain and
system engineers
Cloud API
System
solver
Feature
models
1. create the
feature models
2. Submit their
requirements
3. Loads the
models
5. R
etu
rns t
he
solu
tions
(All,
best,
Pare
to fro
nt)
4.
Asks f
or
the
va
lid s
olu
tio
ns
8. Stores the
selected
solutions
6. Shows the solutions
(All, best, Pareto front)7. Request the
deploy9
. D
eplo
y t
he
resou
rce
s
Figure 9.7: Our process to select and to deploy the resources in the clouds
Based on the instance types of the clouds, figures 9.8 and 9.9 show the abstract modelinstantiated to describe two different products (virtual machines) of each cloud. Withthese models, the users can see that both clouds offer resources in different regions (Europeand North America), and that only EC2’s instance types have ephemeral SSD disks withzero cost, for example.
Moreover, using these models, we can simulate resource migration between the clouds.In this case, we use the abstract model to describe the environment and the concrete modelsto select the resources. For example, a description like: b64, #vcpu = 2, memorySizeGB= 15, General, HVM, Linux, x64, North America, Persistent, SSD, diskSizeGB = 30 returns VM1 of GCE (Figure 9.9).
We conducted three benchmarks (Table 9.5) to evaluate the characteristics of theinstance types. These benchmarks were required because: (i) the literature only has dataabout the first generation of EC2 instance types [167, 170, 242, 267, 269, 284], and wewere interested in all generations as well as in the GCE’s instance types. In addition, onlyfew instance types have been evaluated by these works; and (ii) the literature lacks dataabout the network throughput of the instances.
In order to obtain the CPU performance, similar to [267, 284], we executed LIN-PACK [227] with five problem sizes ranging from 13,000 to 55,000. The information
164
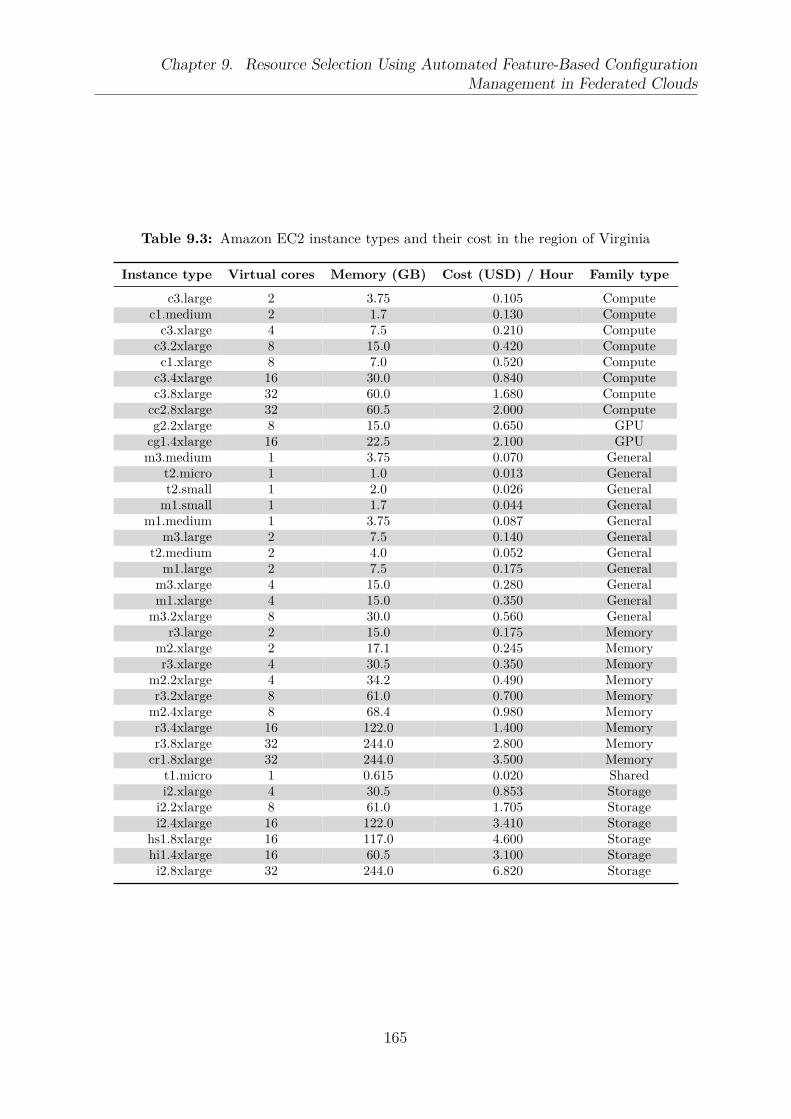
Chapter 9. Resource Selection Using Automated Feature-Based Configuration
Management in Federated Clouds
Table 9.3: Amazon EC2 instance types and their cost in the region of Virginia
Instance type Virtual cores Memory (GB) Cost (USD) / Hour Family type
c3.large 2 3.75 0.105 Computec1.medium 2 1.7 0.130 Compute
c3.xlarge 4 7.5 0.210 Computec3.2xlarge 8 15.0 0.420 Computec1.xlarge 8 7.0 0.520 Compute
c3.4xlarge 16 30.0 0.840 Computec3.8xlarge 32 60.0 1.680 Compute
cc2.8xlarge 32 60.5 2.000 Computeg2.2xlarge 8 15.0 0.650 GPU
cg1.4xlarge 16 22.5 2.100 GPUm3.medium 1 3.75 0.070 General
t2.micro 1 1.0 0.013 Generalt2.small 1 2.0 0.026 General
m1.small 1 1.7 0.044 Generalm1.medium 1 3.75 0.087 General
m3.large 2 7.5 0.140 Generalt2.medium 2 4.0 0.052 General
m1.large 2 7.5 0.175 Generalm3.xlarge 4 15.0 0.280 Generalm1.xlarge 4 15.0 0.350 General
m3.2xlarge 8 30.0 0.560 Generalr3.large 2 15.0 0.175 Memory
m2.xlarge 2 17.1 0.245 Memoryr3.xlarge 4 30.5 0.350 Memory
m2.2xlarge 4 34.2 0.490 Memoryr3.2xlarge 8 61.0 0.700 Memory
m2.4xlarge 8 68.4 0.980 Memoryr3.4xlarge 16 122.0 1.400 Memoryr3.8xlarge 32 244.0 2.800 Memory
cr1.8xlarge 32 244.0 3.500 Memoryt1.micro 1 0.615 0.020 Sharedi2.xlarge 4 30.5 0.853 Storage
i2.2xlarge 8 61.0 1.705 Storagei2.4xlarge 16 122.0 3.410 Storage
hs1.8xlarge 16 117.0 4.600 Storagehi1.4xlarge 16 60.5 3.100 Storagei2.8xlarge 32 244.0 6.820 Storage
165

Chapter
9.
Reso
urce
Selectio
nU
sing
Auto
mated
Fea
ture-B
ased
Configura
tion
Managem
ent
inFed
erated
Clo
uds
c3_2xlarge
Spot
c3.2xlarge-hardwareIntel Xeon E5-2680 b64
c3.2xlarge-network
Ephemeral
SSD
Ephemeral
SSD
Linux
x64Ubuntu Server 14.04 LTS
North America
Persistent
SSD
HVM
ami-864d84ee
VM1
EC2
disk-1
us-east-1a
Group-1
On-demand
Compute
instance-disk-1
instance-disk-2
VM2
m3.large General
m3.large-hardware
m3.instance-disk-1
PVM
Ubuntu Server 14.04 LTS
Europe
Persistent
EBS
Linux
x64
SSD
Ephemeral
m3.large-network
Intel Xeon E5-2670
m3.disk-1
eu-west-1a
ami-3907d64e
cost: 0.53 USDlag: 0.15
maxInstances: 20maxMntDisksSizeGB: 20,480
gflops: 123.20frequency: 2.8 GHz
#vcpu: 8
throughputGbps: 1.5
egressCostGB: 0.12ingressCostGB: 0.0
diskSizeGB: 80iops: 24cost: 0.0
diskSizeGB: 80iops: 24cost: 0.0
throughputGbps: 0.7ingressCostGB: 0.0egressCostGB: 0.12
gflops: 20.35frequency: 2.5 GHz
#vcpu: 2
diskSizeGB: 32iops: 24cost: 0.0
diskSizeGB: 30iops: 90cost: 1.65
diskSizeGB: 30iops: 90cost: 3.0
cost: 0.140 USDlag: 0.10
maxInstances: 20maxMntSizeGB: 20,480
maxInstances: 20maxTps: 20,480
Figure 9.8: Example of the abstract extended feature model (Figure 9.6) instantiated to represent two products of Amazon EC2
166

Chapter
9.
Reso
urce
Selectio
nU
sing
Auto
mated
Fea
ture-B
ased
Configura
tion
Managem
ent
inFed
erated
Clo
uds
GCE
VM1
GeneralHVM
Linuxx64
PersistentSSD
VM2
Compute
Europe
EBS
Intel Sandy Bridge Xeon
gflops: 26.4frequency: 2.6 GHz#vpcu: 2
n2-network
throughputGbps: 0.56ingressCostGB: 0.0egressCost: 0.11
n1-standard-2-hardware
Debian v7
North America
n1-standard-2
diskSizeGB: 30cost: 9.75iops: 14.4
disk-1
us-central1-a
On-demandcost: 0.14
disk-2
europe-west1-a
Debian v7
HVM
n1-highcpu-hardware Intel Ivy Bridge Xeon
gflops: 96.8frequency: 2.8 GHz#vpcu: 8
throughputGbps: 1.0egressCost: 0.12ingressCost: 0.0
n1-hcpu-network
Linuxx64
Persistent
diskSizeGB: 30cost: 1.2iops: 3
debian-7-wheezy-v20140718
debian-7-wheezy-v20140718
On-demand
n1-highcpu-8
lag: 0.10maxInstances: 12maxMntDisks: 16
maxMntDiskSizeGB: 10, 240
lag: 0.12maxInstances: 3maxMntDisks: 16
maxMntDisksSizeGB: 10,240
cost: 0.384
maxInstances: 24maxTps: 5,120
Figure 9.9: Example of the abstract extended feature model (Figure 9.6) instantiated to represent two products of GCE
167
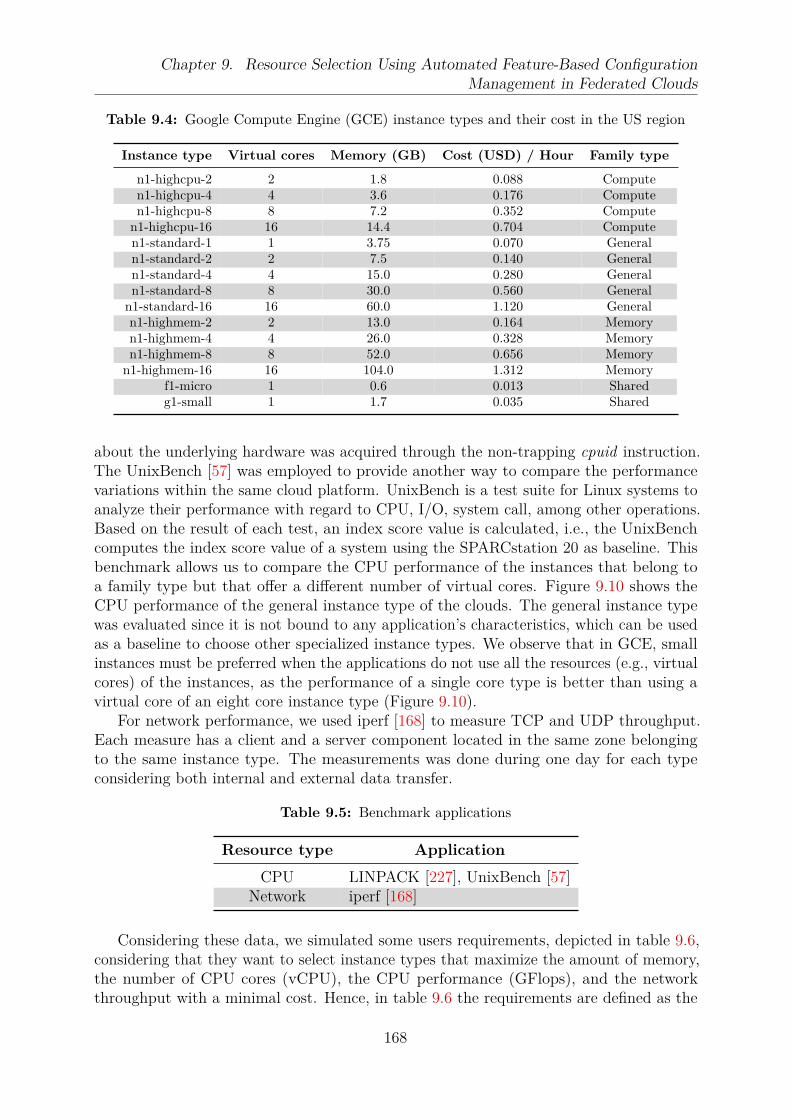
Chapter 9. Resource Selection Using Automated Feature-Based Configuration
Management in Federated Clouds
Table 9.4: Google Compute Engine (GCE) instance types and their cost in the US region
Instance type Virtual cores Memory (GB) Cost (USD) / Hour Family type
n1-highcpu-2 2 1.8 0.088 Computen1-highcpu-4 4 3.6 0.176 Computen1-highcpu-8 8 7.2 0.352 Compute
n1-highcpu-16 16 14.4 0.704 Computen1-standard-1 1 3.75 0.070 Generaln1-standard-2 2 7.5 0.140 Generaln1-standard-4 4 15.0 0.280 Generaln1-standard-8 8 30.0 0.560 General
n1-standard-16 16 60.0 1.120 Generaln1-highmem-2 2 13.0 0.164 Memoryn1-highmem-4 4 26.0 0.328 Memoryn1-highmem-8 8 52.0 0.656 Memory
n1-highmem-16 16 104.0 1.312 Memoryf1-micro 1 0.6 0.013 Sharedg1-small 1 1.7 0.035 Shared
about the underlying hardware was acquired through the non-trapping cpuid instruction.The UnixBench [57] was employed to provide another way to compare the performancevariations within the same cloud platform. UnixBench is a test suite for Linux systems toanalyze their performance with regard to CPU, I/O, system call, among other operations.Based on the result of each test, an index score value is calculated, i.e., the UnixBenchcomputes the index score value of a system using the SPARCstation 20 as baseline. Thisbenchmark allows us to compare the CPU performance of the instances that belong toa family type but that offer a different number of virtual cores. Figure 9.10 shows theCPU performance of the general instance type of the clouds. The general instance typewas evaluated since it is not bound to any application’s characteristics, which can be usedas a baseline to choose other specialized instance types. We observe that in GCE, smallinstances must be preferred when the applications do not use all the resources (e.g., virtualcores) of the instances, as the performance of a single core type is better than using avirtual core of an eight core instance type (Figure 9.10).
For network performance, we used iperf [168] to measure TCP and UDP throughput.Each measure has a client and a server component located in the same zone belongingto the same instance type. The measurements was done during one day for each typeconsidering both internal and external data transfer.
Table 9.5: Benchmark applications
Resource type Application
CPU LINPACK [227], UnixBench [57]Network iperf [168]
Considering these data, we simulated some users requirements, depicted in table 9.6,considering that they want to select instance types that maximize the amount of memory,the number of CPU cores (vCPU), the CPU performance (GFlops), and the networkthroughput with a minimal cost. Hence, in table 9.6 the requirements are defined as the
168
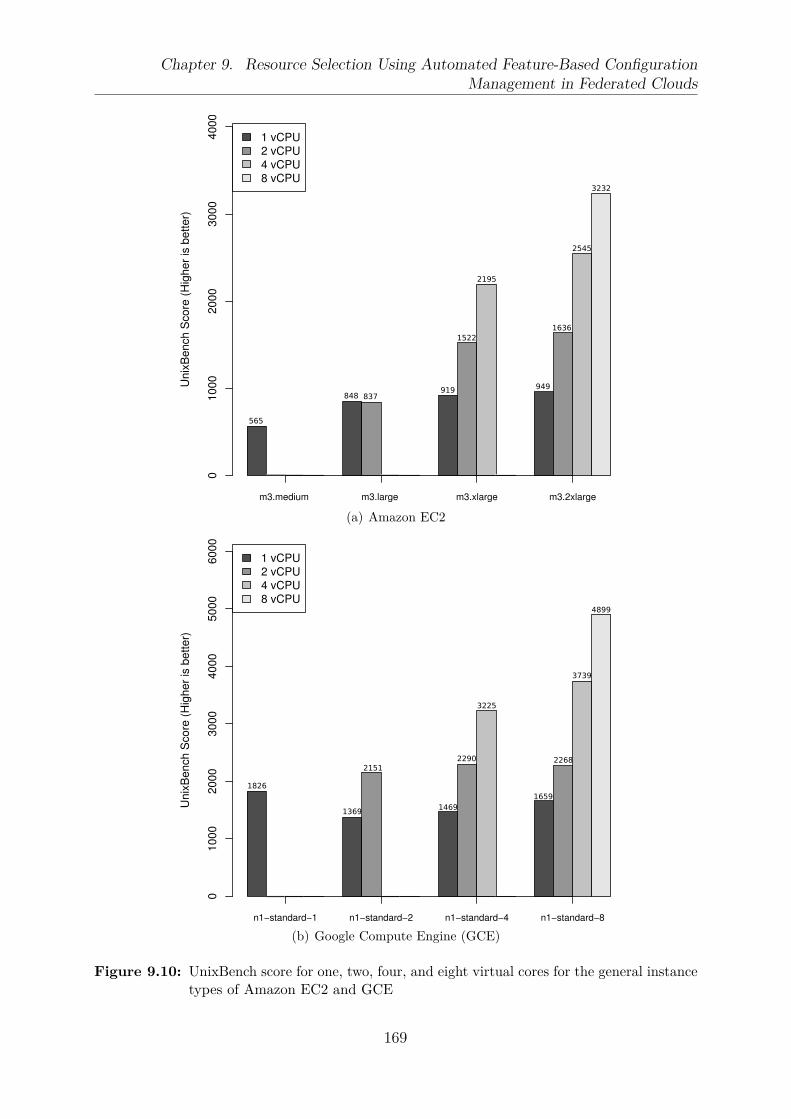
Chapter 9. Resource Selection Using Automated Feature-Based Configuration
Management in Federated Clouds
m3.medium m3.large m3.xlarge m3.2xlarge
1 vCPU
2 vCPU
4 vCPU
8 vCPUU
nix
Bench
Score
(Hig
heris
better)
01000
2000
3000
4000
565
848 837919
1522
2195
949
1636
2545
3232
(a) Amazon EC2
n1−standard−1 n1−standard−2 n1−standard−4 n1−standard−8
1 vCPU
2 vCPU
4 vCPU
8 vCPU
UnixBenchScore
(Higherisbetter)
01000
2000
3000
4000
5000
6000
1826
1369
2151
1469
2290
3225
1659
2268
3739
4899
(b) Google Compute Engine (GCE)
Figure 9.10: UnixBench score for one, two, four, and eight virtual cores for the general instancetypes of Amazon EC2 and GCE
169
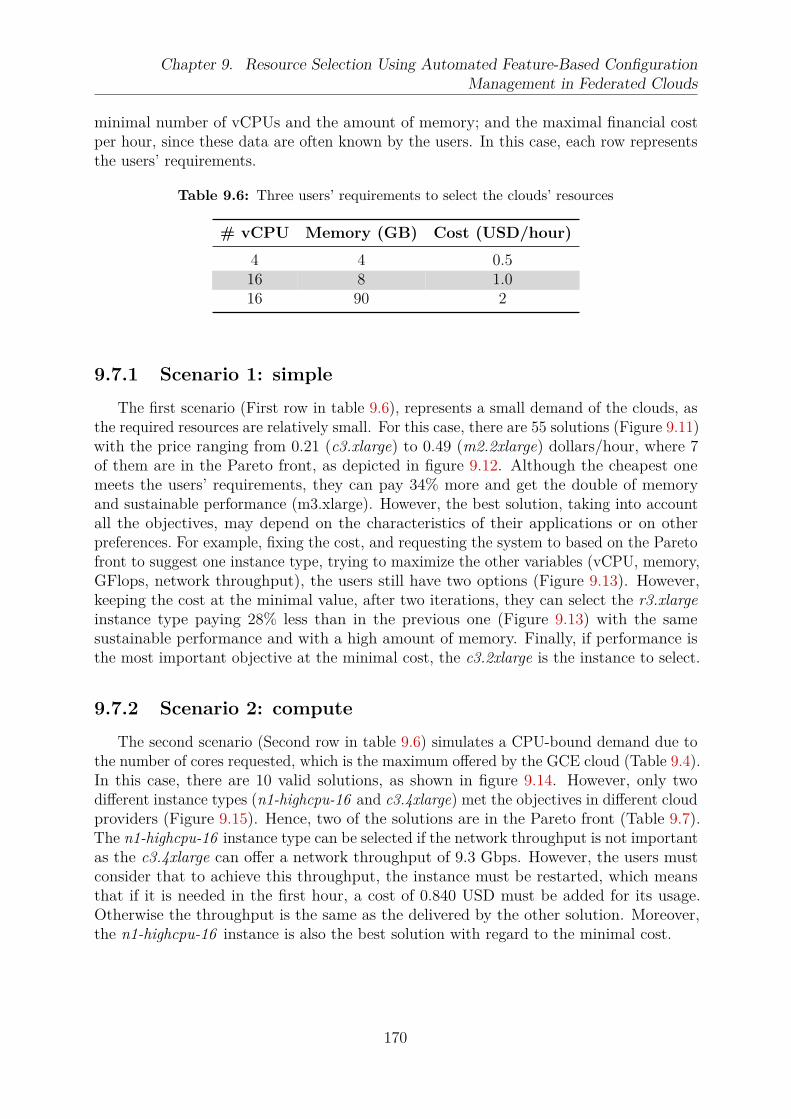
Chapter 9. Resource Selection Using Automated Feature-Based Configuration
Management in Federated Clouds
minimal number of vCPUs and the amount of memory; and the maximal financial costper hour, since these data are often known by the users. In this case, each row representsthe users’ requirements.
Table 9.6: Three users’ requirements to select the clouds’ resources
# vCPU Memory (GB) Cost (USD/hour)
4 4 0.516 8 1.016 90 2
9.7.1 Scenario 1: simple
The first scenario (First row in table 9.6), represents a small demand of the clouds, asthe required resources are relatively small. For this case, there are 55 solutions (Figure 9.11)with the price ranging from 0.21 (c3.xlarge) to 0.49 (m2.2xlarge) dollars/hour, where 7of them are in the Pareto front, as depicted in figure 9.12. Although the cheapest onemeets the users’ requirements, they can pay 34% more and get the double of memoryand sustainable performance (m3.xlarge). However, the best solution, taking into accountall the objectives, may depend on the characteristics of their applications or on otherpreferences. For example, fixing the cost, and requesting the system to based on the Paretofront to suggest one instance type, trying to maximize the other variables (vCPU, memory,GFlops, network throughput), the users still have two options (Figure 9.13). However,keeping the cost at the minimal value, after two iterations, they can select the r3.xlargeinstance type paying 28% less than in the previous one (Figure 9.13) with the samesustainable performance and with a high amount of memory. Finally, if performance isthe most important objective at the minimal cost, the c3.2xlarge is the instance to select.
9.7.2 Scenario 2: compute
The second scenario (Second row in table 9.6) simulates a CPU-bound demand due tothe number of cores requested, which is the maximum offered by the GCE cloud (Table 9.4).In this case, there are 10 valid solutions, as shown in figure 9.14. However, only twodifferent instance types (n1-highcpu-16 and c3.4xlarge) met the objectives in different cloudproviders (Figure 9.15). Hence, two of the solutions are in the Pareto front (Table 9.7).The n1-highcpu-16 instance type can be selected if the network throughput is not importantas the c3.4xlarge can offer a network throughput of 9.3 Gbps. However, the users mustconsider that to achieve this throughput, the instance must be restarted, which meansthat if it is needed in the first hour, a cost of 0.840 USD must be added for its usage.Otherwise the throughput is the same as the delivered by the other solution. Moreover,the n1-highcpu-16 instance is also the best solution with regard to the minimal cost.
170
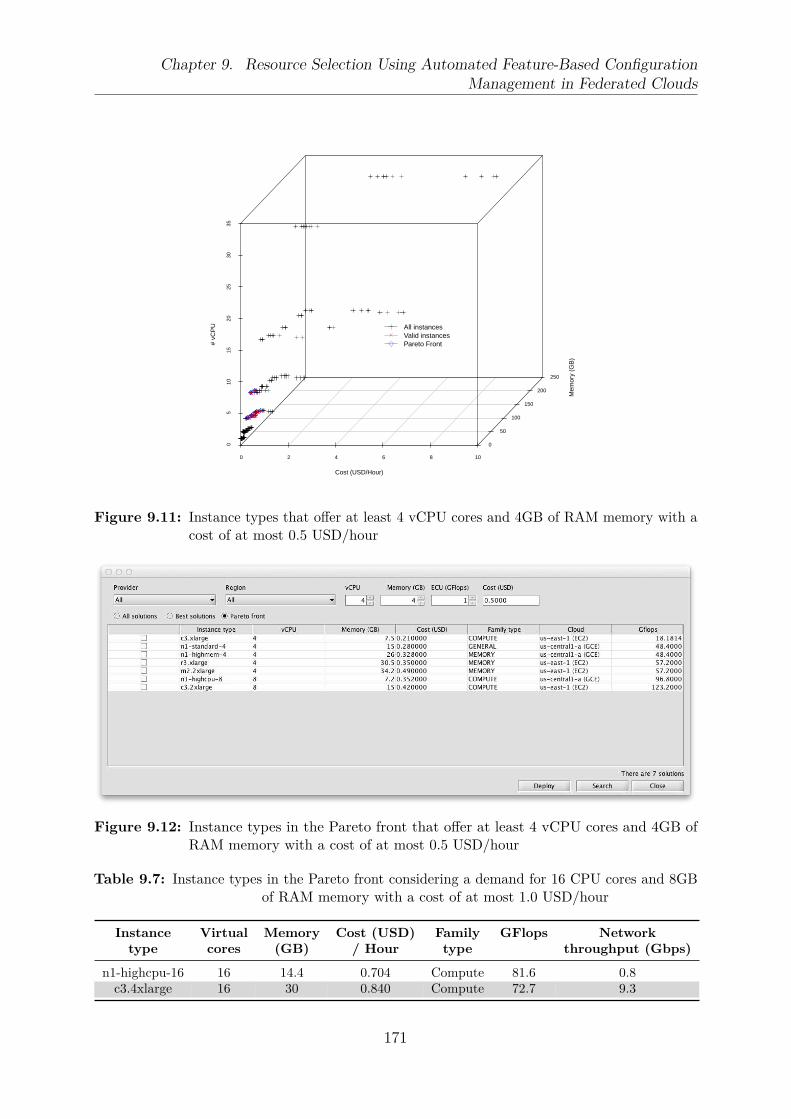
Chapter 9. Resource Selection Using Automated Feature-Based Configuration
Management in Federated Clouds
0 2 4 6 8 10
0 5
1015
2025
3035
0
50
100
150
200
250
Cost (USD/Hour)
Mem
ory
(GB
)
# vC
PU All instances
Valid instancesPareto Front
Figure 9.11: Instance types that offer at least 4 vCPU cores and 4GB of RAM memory with acost of at most 0.5 USD/hour
Figure 9.12: Instance types in the Pareto front that offer at least 4 vCPU cores and 4GB ofRAM memory with a cost of at most 0.5 USD/hour
Table 9.7: Instance types in the Pareto front considering a demand for 16 CPU cores and 8GBof RAM memory with a cost of at most 1.0 USD/hour
Instance Virtual Memory Cost (USD) Family GFlops Networktype cores (GB) / Hour type throughput (Gbps)
n1-highcpu-16 16 14.4 0.704 Compute 81.6 0.8c3.4xlarge 16 30 0.840 Compute 72.7 9.3
171

Chapter 9. Resource Selection Using Automated Feature-Based Configuration
Management in Federated Clouds
Figure 9.13: Instance types suggested by the system that offer at least 4 vCPU cores and 4GBof RAM memory with a cost of at most 0.5 USD/hour
0 2 4 6 8 10
0 5
1015
2025
3035
0
50
100
150
200
250
Cost (USD/Hour)
Mem
ory
(GB
)
# vC
PU All instances
Valid instancesPareto Front
Figure 9.14: Instance types that offer at least 16 CPU cores and 8GB of RAM memory with acost of at most 1.0 USD/hour
172
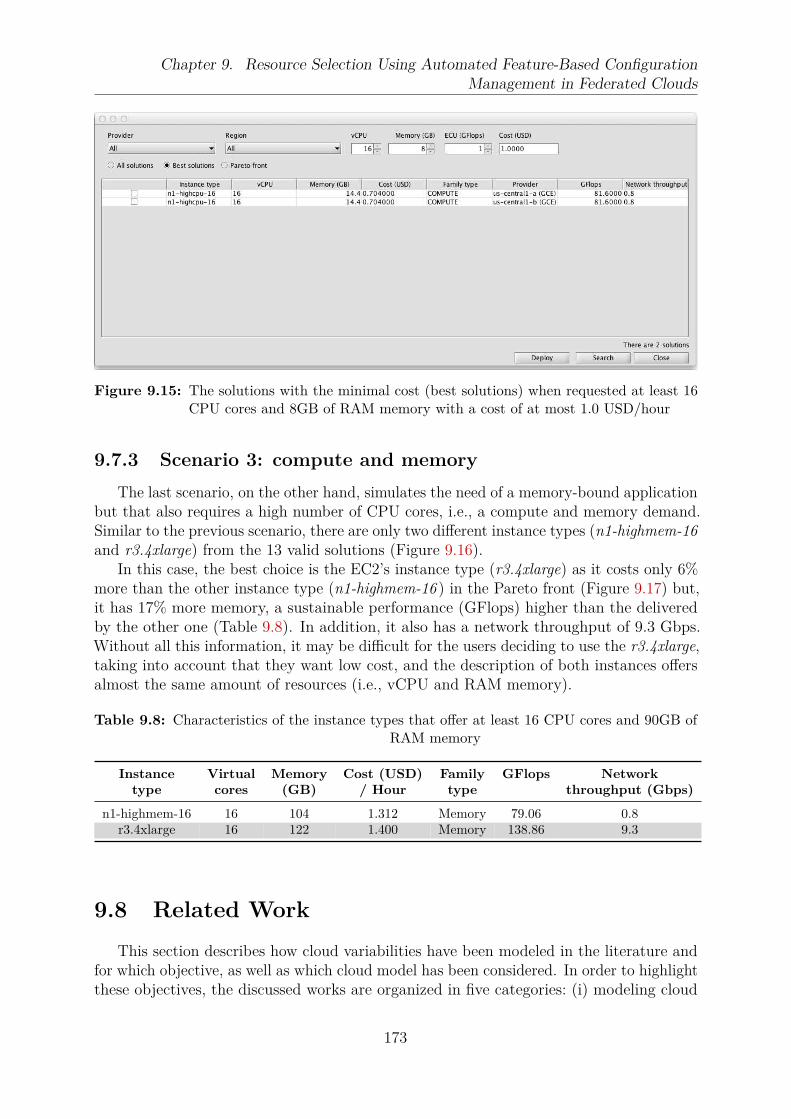
Chapter 9. Resource Selection Using Automated Feature-Based Configuration
Management in Federated Clouds
Figure 9.15: The solutions with the minimal cost (best solutions) when requested at least 16CPU cores and 8GB of RAM memory with a cost of at most 1.0 USD/hour
9.7.3 Scenario 3: compute and memory
The last scenario, on the other hand, simulates the need of a memory-bound applicationbut that also requires a high number of CPU cores, i.e., a compute and memory demand.Similar to the previous scenario, there are only two different instance types (n1-highmem-16and r3.4xlarge) from the 13 valid solutions (Figure 9.16).
In this case, the best choice is the EC2’s instance type (r3.4xlarge) as it costs only 6%more than the other instance type (n1-highmem-16 ) in the Pareto front (Figure 9.17) but,it has 17% more memory, a sustainable performance (GFlops) higher than the deliveredby the other one (Table 9.8). In addition, it also has a network throughput of 9.3 Gbps.Without all this information, it may be difficult for the users deciding to use the r3.4xlarge,taking into account that they want low cost, and the description of both instances offersalmost the same amount of resources (i.e., vCPU and RAM memory).
Table 9.8: Characteristics of the instance types that offer at least 16 CPU cores and 90GB ofRAM memory
Instance Virtual Memory Cost (USD) Family GFlops Networktype cores (GB) / Hour type throughput (Gbps)
n1-highmem-16 16 104 1.312 Memory 79.06 0.8r3.4xlarge 16 122 1.400 Memory 138.86 9.3
9.8 Related Work
This section describes how cloud variabilities have been modeled in the literature andfor which objective, as well as which cloud model has been considered. In order to highlightthese objectives, the discussed works are organized in five categories: (i) modeling cloud
173

Chapter 9. Resource Selection Using Automated Feature-Based Configuration
Management in Federated Clouds
0 2 4 6 8 10
0 5
1015
2025
3035
0
50
100
150
200
250
Cost (USD/Hour)
Mem
ory
(GB
)
# vC
PU All instances
Valid instancesPareto Front
Figure 9.16: Instance types that offer at least 16 CPU cores and 90GB of RAM memory witha cost of at most 2 USD/hour
Figure 9.17: Instance types in the Pareto front that offer at least 16 CPU cores and 90GB ofRAM memory, with a cost of at most 2 USD/hour
174
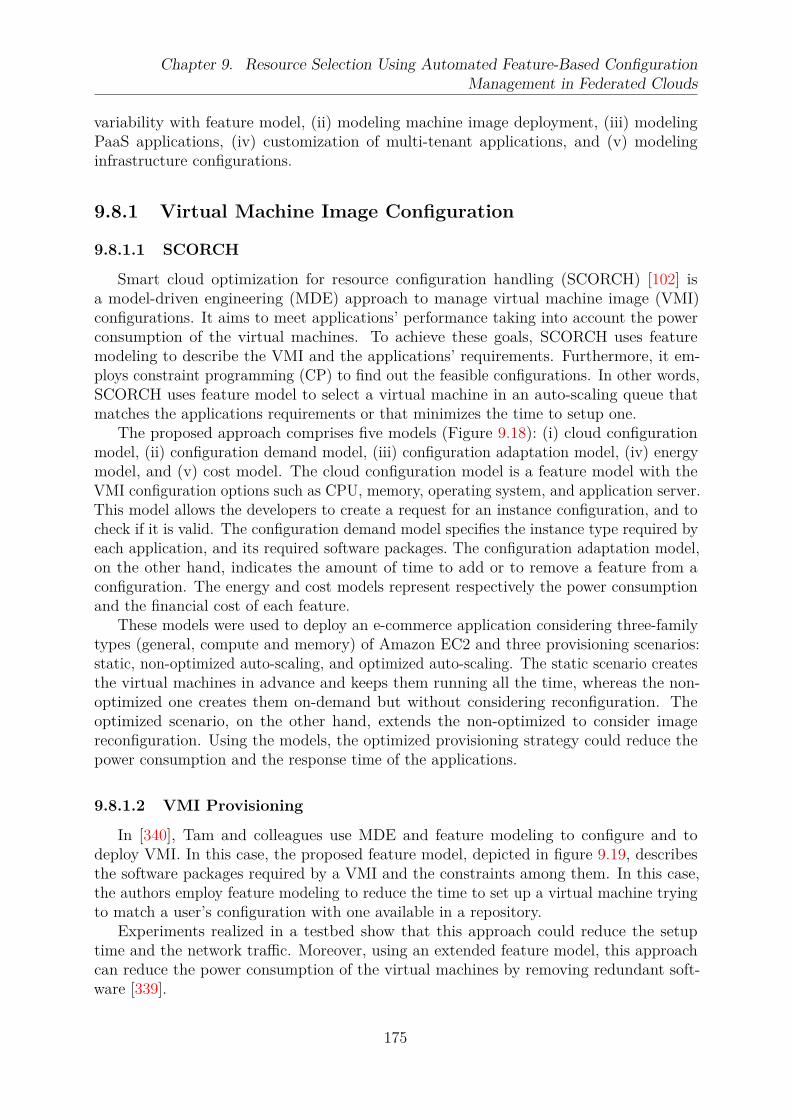
Chapter 9. Resource Selection Using Automated Feature-Based Configuration
Management in Federated Clouds
variability with feature model, (ii) modeling machine image deployment, (iii) modelingPaaS applications, (iv) customization of multi-tenant applications, and (v) modelinginfrastructure configurations.
9.8.1 Virtual Machine Image Configuration
9.8.1.1 SCORCH
Smart cloud optimization for resource configuration handling (SCORCH) [102] isa model-driven engineering (MDE) approach to manage virtual machine image (VMI)configurations. It aims to meet applications’ performance taking into account the powerconsumption of the virtual machines. To achieve these goals, SCORCH uses featuremodeling to describe the VMI and the applications’ requirements. Furthermore, it em-ploys constraint programming (CP) to find out the feasible configurations. In other words,SCORCH uses feature model to select a virtual machine in an auto-scaling queue thatmatches the applications requirements or that minimizes the time to setup one.
The proposed approach comprises five models (Figure 9.18): (i) cloud configurationmodel, (ii) configuration demand model, (iii) configuration adaptation model, (iv) energymodel, and (v) cost model. The cloud configuration model is a feature model with theVMI configuration options such as CPU, memory, operating system, and application server.This model allows the developers to create a request for an instance configuration, and tocheck if it is valid. The configuration demand model specifies the instance type required byeach application, and its required software packages. The configuration adaptation model,on the other hand, indicates the amount of time to add or to remove a feature from aconfiguration. The energy and cost models represent respectively the power consumptionand the financial cost of each feature.
These models were used to deploy an e-commerce application considering three-familytypes (general, compute and memory) of Amazon EC2 and three provisioning scenarios:static, non-optimized auto-scaling, and optimized auto-scaling. The static scenario createsthe virtual machines in advance and keeps them running all the time, whereas the non-optimized one creates them on-demand but without considering reconfiguration. Theoptimized scenario, on the other hand, extends the non-optimized to consider imagereconfiguration. Using the models, the optimized provisioning strategy could reduce thepower consumption and the response time of the applications.
9.8.1.2 VMI Provisioning
In [340], Tam and colleagues use MDE and feature modeling to configure and todeploy VMI. In this case, the proposed feature model, depicted in figure 9.19, describesthe software packages required by a VMI and the constraints among them. In this case,the authors employ feature modeling to reduce the time to set up a virtual machine tryingto match a user’s configuration with one available in a repository.
Experiments realized in a testbed show that this approach could reduce the setuptime and the network traffic. Moreover, using an extended feature model, this approachcan reduce the power consumption of the virtual machines by removing redundant soft-ware [339].
175

Chapter 9. Resource Selection Using Automated Feature-Based Configuration
Management in Federated Clouds
Figure 9.18: SCORCH MDE process [102]
Legend:MandatoryOptionalOrAlternativeAbstractConcrete
Virtual Machine Image
Operating System
Database
Monitoring
Windows 7
Ubuntu 11.10
.Net Framework 4.0
Java Runtime
IBM Websphere AppServer 8.0
JRE 1.6 Linux
JRE 1.6 Win
Eclipse 3.5 Windows
Eclipse 3.5 Linux
Tomcat 5.5 Windows
Tomcat 5.5 Linux
Tomcat 5.5 Linux or Eclipse 3.5 Linux or JRE 1.6 Linux requires Ubuntu 11.10 Tomcat 5.5 Windows or Eclipse 3.5 Windows or JRE 1.6 Win or .Net Framework 4.0 requires Windows 7Visual Sudio 2010 requires .Net Framework 4.0Eclipse 3.5 requires Java Runtime
Visual Studio 2010
Eclipse 3.5
Apache Tomcat Server 5.5
IDE
Framework
Application Server
Figure 9.19: MDE approach for VMI configuration. Adapted from [340]
176

Chapter 9. Resource Selection Using Automated Feature-Based Configuration
Management in Federated Clouds
9.8.1.3 Typical Virtual Appliances
Zhang and colleagues [389] present a model called typical virtual appliance (TVA) forprovisioning and management of virtual machines. A TVA is a template describing a set ofpopular softwares, and the frequently used services. The main objective of this approachis to minimize both storage space wasted with pre-built virtual machine images and thetime to set up a virtual appliance. In this context, when a user requests a configurationthat the system cannot match with one available in a repository, the system tries to selectone that requires the minimal time to be converted to the requested configuration.
Simulation results show that this approach can reduce the setup time when there aresufficient data about popular software demands.
9.8.2 Virtual Machine Image Deployment
9.8.2.1 Virtual Appliance Model
In [200], Konstantinou and colleagues present an MDE approach for virtual machineimage deployment using a virtual appliance model. A virtual appliance model is anabstract deployment plan that describes the configuration options of virtual machines.These configuration options are pre-built virtual machine images defined by domainexperts. This approach, depicted in figure 9.20, works as follows. First, a solutionarchitect creates a virtual solution model (VSM) by selecting virtual appliance modelsand specifying configuration options such as placement constraints, network zones, andresource consumption requirements. Then, a deployment architect transforms the VSMinto a cloud-specific virtual solution deployment model (VSDM), where specific cloudconfigurations are added. Finally, the deployment model is converted into an executableplan called virtual solution deployment plan (VSDP). Then, the VSDP invokes the cloud’soperations to configure the environment and the virtual machines based on the virtualsolution model.
According to the authors, the idea of using these different models is first to capturethe deployment logic of possible software service topologies and layers. Moreover, theyenable a new kind of service called composition-as-a-service.
Experimental results show that using these models, a software architecture could deploya virtual machine in a cloud.
9.8.2.2 Composite Appliance
Chieu and colleagues [78] introduce the concept of composite appliance to deploy appli-cations in the cloud. A composite appliance is a set of virtual machine images configuredto work as a single configuration option. In this case, the proposed model (Figure 9.21)has five classes that describe and capture the constraints of a virtual appliance such asmemory size, number of CPUs and required software packages.
The proposed model aims to reduce the time to deploy a VM in the cloud by reusingthe images configured for a deployment scenario.
177

Chapter 9. Resource Selection Using Automated Feature-Based Configuration
Management in Federated Clouds
DomainExpert
VirtualImage
ConfigurationOperations
Virtual Appliance
Create
SolutionArchitect
Virtual SolutionModel
Compose
Virtual SolutionDeployment Plan
DeploymentArchitect
ApplianceModel Zone 1 Zone 2
Virtual SolutionDeployment Model
AmazonSecurityGroup 1
AMI AMIElastic
IP
AmazonSecurityGroup 2
Transform
Generate
Deployer /User
Parameterize &Execute
Figure 9.20: Virtual appliance model [200]
NameDescription
Node
Req_MemoryReq_CPUReq_DiskSizeReq_Network
Image RequirementVal_OSTypeVal_ImageIdVal_FilenameVal_VirtualizationTypeVal_RunOnceScriptVal_UseridVal_Password
Image Specification
NameValue
Software Attributes
1
1
1
1
1
*
NameDescription
Node
1
*
Figure 9.21: Composite appliance model [78]
178

Chapter 9. Resource Selection Using Automated Feature-Based Configuration
Management in Federated Clouds
9.8.3 Deploying PaaS Applications
9.8.3.1 HW-CSPL
Cavalcante and colleagues [9, 67] propose an adaptation of SPL-based development todeploy a Health Watcher application in the cloud (Figure 9.22). This approach works asfollowing. First, the feature model of the application is modified to include cloud featuressuch as storage and database type. Second, the developers change the source code ofthe application to implement cloud’s variability. In such case, feature modeling helps thedevelopers in identifying the clouds that meet the application’s requirements, as well as touse the services of the clouds.
They validated this model using conditional compiling techniques and dynamic aspect-oriented programming (DAOP) to implement logging and database services offered by twodifferent clouds.
Deployment
PersistenceMemory
DataStore
Database
Blobstore
Legend:MandatoryOptionalAlternativeAbstractConcrete
Property Provider: String = "AWS"Pricing: String =
Relational_Persistence
Property Provider: String = "GAE"Pricing: String =
DataStore
"http://aws.amazon.com/rds/pricing"
"http://code.google.com/appengine/billing.html"
Amazon Web Services
Google App Engine
Non Relational Persistence
Relational Persistence
Google Authentication
GAE Log Service
Amazon SimpleDB
Amazon S3
Log System
File Storage
Login SystemHW-CSPL
Figure 9.22: HW-CSPL’s feature model. Adapted from [67]
9.8.3.2 SALOON
SALOON [287] is a framework that combines feature models and ontology to supportthe developers on deploying their applications on multiple PaaS providers. In such case,it uses feature models to capture clouds variability, and ontologies to describe the fea-tures (Figure 9.23). SALOON has two ontologies, namely OntoCloud and OntoDim. TheOntoCloud translates general cloud concepts to the terms used by each cloud provider,whereas the OntoDim describes the attributes of the feature models. In other words, in thiswork, feature models handle cloud configurations, and ontologies translate the featuresand the attributes of each cloud model to general cloud concepts.
Experiments show that SALOON was able to select four different PaaS providers basedon two configuration options of an application. Moreover, it could also generate the scriptsto deploy the application in the clouds [288].
179

Chapter 9. Resource Selection Using Automated Feature-Based Configuration
Management in Federated Clouds
(a) SALOON approach
PaaS
Database
ApplicationServer
SQL
NoSQL
provides
Cloud
IaaS
Resource
RAM
CPU
uses
CapacityMemory
Dimension
Storage
Frequency
range
OntoCloud OntoDim
(b) SALOON’s ontologies
Figure 9.23: SALOON framework [287]
9.8.4 Configuration options of multi-tenant applications
9.8.4.1 Multi-Tenant Deployment
Mietzner and colleagues [247] use variability modeling to support SaaS providersin managing configuration options of their applications. They consider two types ofvariability options: external and internal. On the one hand, external variability comprisesthe configuration options that (i) are visible and can be managed by the users (i.e., tenants),and (ii) do not change the application deployment such as changing the logo or the titleof an application. On the other hand, internal variability concerns the infrastructure ordeployment options that are only managed by the providers such as replication, clustering,and database sharding.
Figure 9.24 shows the feature model with external and internal options of the applicationmodeled by the authors. In this case, feature modeling helped the users on changing theapplication’s requirements (e.g., functional and non-functional) on-the-fly and supportedthe SaaS providers on generating the deployment scripts for each configuration.
9.8.4.2 Capturing Functional and Deployment Variability
Ruehl and colleagues [304, 305] use feature modeling to allow the users on customizingSaaS applications taking into account four different data-sharing models. Based onconfiguration templates, an execution engine adjusts a generic application to a configurationrequested by a user5.
In this context, a provider creates a catalog with the variability options supported bythe applications, and the users utilize this catalog to deploy their applications (Figure 9.25).In such case, each variability option is implemented as a component that is instantiatedaccording to a deployment model. The deployment model can be private, public, whitehybrid, or black hybrid. In the private model, an application runs without sharing its
5In the context of this work, a user (i.e., tenant) may be a company and it may have multiple users.
180

Chapter 9. Resource Selection Using Automated Feature-Based Configuration
Management in Federated Clouds
MeetR
WorkflowLong
Short
Logo
DataSeparationNotguaranteed
Guaranteed
Title
StoreEmails Yes
AvailabilityStandard
High
DBPatternSingleInstance
MultipleInstances
EnvironmentNon_Clustered
Clustered
Legend:MandatoryOptionalAlternativeAbstractConcrete
Long ⇒ StoreEmailsNotguaranteed ⇒ DBPattern
Yes ⇒ DBPatternHigh ⇒ Clustered
Guaranteed ⇒ MultipleInstances
External variability
Internal variability
Figure 9.24: Feature model showing external and internal variability options of a multi-tenantSaaS application. Adapted from [247]
181
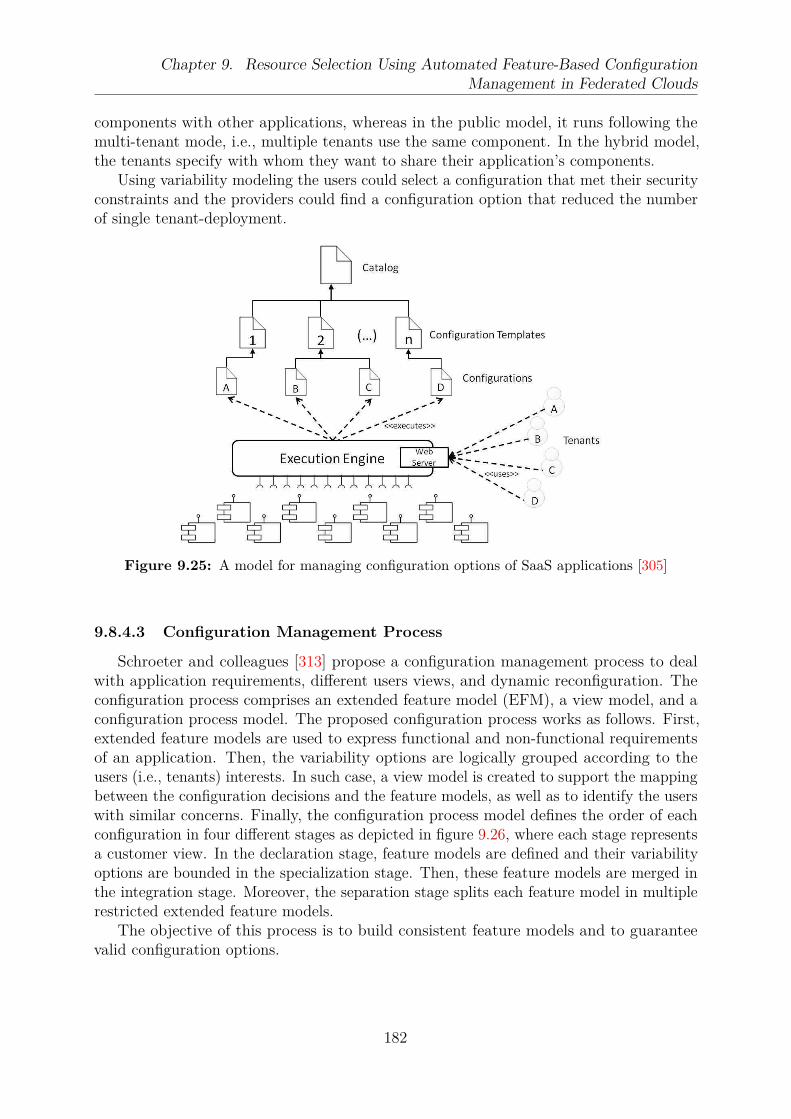
Chapter 9. Resource Selection Using Automated Feature-Based Configuration
Management in Federated Clouds
components with other applications, whereas in the public model, it runs following themulti-tenant mode, i.e., multiple tenants use the same component. In the hybrid model,the tenants specify with whom they want to share their application’s components.
Using variability modeling the users could select a configuration that met their securityconstraints and the providers could find a configuration option that reduced the numberof single tenant-deployment.
Figure 9.25: A model for managing configuration options of SaaS applications [305]
9.8.4.3 Configuration Management Process
Schroeter and colleagues [313] propose a configuration management process to dealwith application requirements, different users views, and dynamic reconfiguration. Theconfiguration process comprises an extended feature model (EFM), a view model, and aconfiguration process model. The proposed configuration process works as follows. First,extended feature models are used to express functional and non-functional requirementsof an application. Then, the variability options are logically grouped according to theusers (i.e., tenants) interests. In such case, a view model is created to support the mappingbetween the configuration decisions and the feature models, as well as to identify the userswith similar concerns. Finally, the configuration process model defines the order of eachconfiguration in four different stages as depicted in figure 9.26, where each stage representsa customer view. In the declaration stage, feature models are defined and their variabilityoptions are bounded in the specialization stage. Then, these feature models are merged inthe integration stage. Moreover, the separation stage splits each feature model in multiplerestricted extended feature models.
The objective of this process is to build consistent feature models and to guaranteevalid configuration options.
182
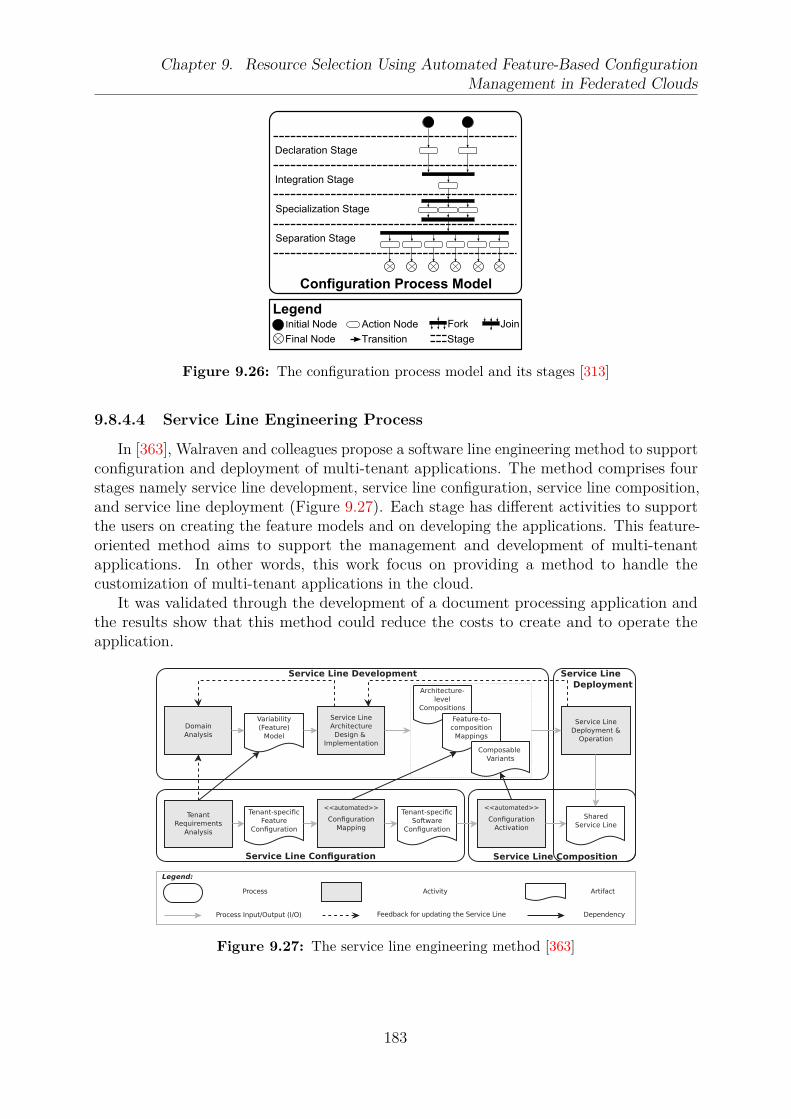
Chapter 9. Resource Selection Using Automated Feature-Based Configuration
Management in Federated Clouds
Figure 9.26: The configuration process model and its stages [313]
9.8.4.4 Service Line Engineering Process
In [363], Walraven and colleagues propose a software line engineering method to supportconfiguration and deployment of multi-tenant applications. The method comprises fourstages namely service line development, service line configuration, service line composition,and service line deployment (Figure 9.27). Each stage has different activities to supportthe users on creating the feature models and on developing the applications. This feature-oriented method aims to support the management and development of multi-tenantapplications. In other words, this work focus on providing a method to handle thecustomization of multi-tenant applications in the cloud.
It was validated through the development of a document processing application andthe results show that this method could reduce the costs to create and to operate theapplication.
Figure 9.27: The service line engineering method [363]
183

Chapter 9. Resource Selection Using Automated Feature-Based Configuration
Management in Federated Clouds
9.8.5 Infrastructure Configuration
9.8.5.1 AWS EC2 Service Provisioning
García-Galán and colleagues [130] uses an extended feature model (EFM) to describesome AWS services. They aim to support the users on selecting valid service configurationsbasing on high-level constraints such as the number of CPUs, the minimum memory orstorage size, and the maximum financial cost (Figure 9.28). Functional requirements (e.g.instance type) were modeled as features and non-functional requirements (e.g., cost andusage) as attributes.
The proposed approach comprises two phases. The first-phase validates if a user’sconfiguration meets the constraints of a model; and the second one selects the configurationsthat fulfill a given objective. These phases were validated using a customized version ofthe FaMa tool6 [348] to show the users which Amazon EC2 configurations fulfill the givenobjective.
9.8.6 Comparative View
Table 9.9 summarizes the papers reviewed in this section. The first column showsthe paper or the name of the solution presented in the paper. Then, the second columnpresents how feature modeling is used to deal with the clouds’ variabilities. The cloudservice model considered by each paper is described in the third column. The last column,on the other hand, presents the objectives of each paper.
In the domain of cloud computing, feature modeling has also been used to handle thevariabilities of VMI, multi-tenant applications, and services offered by the cloud providers.
Most of the reviewed works [78, 102, 200, 340, 389] handle the variabilities of virtualmachine images. In this case, they aim to minimize the time to setup a virtual machineconsidering performance constraints and in some case, power consumption [102, 339].Feature modeling has also used to reduce storage space [389] used with pre-built imagesor to support the users on deploying a virtual machine in the cloud.
At the PaaS layer, one solution [9, 67] uses feature modeling to help the developers onchanging the code of an application to use cloud’s services; and another solution [287, 288]uses it to support the developers on deploying their native cloud applications.
The variabilities of SaaS applications have also be considered by some works [247,304, 305, 313, 363] with different objectives. In such case, they aim to avoid invalidconfigurations, to minimize the time to configure or to create an application, and to avoidsingle tenant deploys.
There is one work that considers resource selection [363] in an specific cloud. In thiscase, based on the users’ requirements, a feature model is used to obtain the configurationsof the cloud and to check that a user’s configuration is valid.
Our work handles the variabilities at the infrastructure layer, and similar to [363],we use feature modeling to select the resources according to the users’ requirements.However, we consider multiple users’ objectives and multiple clouds, employing an abstractfeature model. This abstract model allows us to select different resources like virtual
6FaMa is a tool to analyze feature models.
184

Chapter 9. Resource Selection Using Automated Feature-Based Configuration
Management in Federated Clouds
AmazonFM
EC2
OS
Windows
StdWindows
SQLStd
SQLWeb
Linux
StdLinux
RedHat
Suse
EBSProvisionedStorage
StdStorage
InstanceType
Default
S
M
L
XL
HighIO
HighMem
HighMemXL
HighMem2XL
HighMem4XL
HighCPUHighCPUM
HighCPUXL
Cluster
Cluster4XL
Cluster8XL
GPU4XL
DetailedMonitoring
S3ReduncedRedundancy
Standard
SpecialReqs
GPU
IO_Performance
IOMedium
IOHigh
IOVeryHigh
SO64Bits
SSD
RedHat ⇒ ¬ ClusterSQLStd ⇒ XL ∨ GPU4XL ∨ HighCPUM
Requests: IOPSsize: GB
usage: % monthcu: compute unitsram: GBdataOut: GB
cost: $
size: GB
Figure 9.28: Extended feature model for EC2, EBS, and S3 services. Adapted from [130]
185

Chapter 9. Resource Selection Using Automated Feature-Based Configuration
Management in Federated Clouds
machine image, disks, and to describe the whole environment. Moreover, it avoids invalidconfigurations and it can deploy the configurations in the clouds.
186

Chapter
9.
Reso
urce
Selectio
nU
sing
Auto
mated
Fea
ture-B
ased
Configura
tion
Managem
ent
inFed
erated
Clo
uds
Table 9.9: Comparative view of cloud variability models
Usage of Cloud MultiPaper
feature model model cloudObjectives
SCORCHIaaS No Minimize power consumption taking into account performance constraints
[102]VMI configuration
[339, 340] VMI configuration IaaS No Minimize the time to setup a VM and power consumption[389] VMI configuration IaaS No Minimize storage space with pre-built VMI and the time to setup a VM[200] VMI deployment IaaS No Minimize the time to deploy a VM[78] VMI deployment IaaS No Minimize the time to deploy an application
HW-CSPL Development of a PaaS Yes[9, 67] cloud-aware application
Minimize the time to change an application to use clouds’ services
SALOON Deployment ofPaaS Yes Minimize the time/effort to deploy native cloud applications
[287, 288] cloud-aware applications[247] CMMTA⋆ SaaS No Minimize the time to configure an application
[304, 305] CMMTA⋆ SaaS No Minimize the number of single-tenant deploys taking into account users’ security constraints[313] CMMTA⋆ SaaS No Minimize inconsistent feature models[363] CMMTA⋆ SaaS No Minimize the time to create a cloud-aware application[130] Instance selection IaaS No Minimize invalid configurations considering a single objective
This work IS and IC♯ IaaS Yes Avoid invalid configurations and select the instances taking into account multiple objectives
⋆ Configuration management of multi-tenant applications (CMMTA)♯ Instance selection and infrastructure configuration
187

Chapter 9. Resource Selection Using Automated Feature-Based Configuration
Management in Federated Clouds
9.9 Summary
In this chapter, we presented our solution to help the users on selecting the clouds andthe instance types to execute their applications, taking into account multiple objectives.The proposed solution is based on a product line engineering (PLE) process that comprisesdifferent phases and roles (Figure 9.1). In the first phase, an abstract feature model (FM)is created to describe the variabilities of the IaaS clouds. Next, this model is instantiatedwith the features and characteristics (i.e., qualitative and quantitative attributes) of theproducts available in the clouds. After, the users specify their requirements and objectives,and the configurations that are optimal with regard to the objectives are selected anddeployed in the clouds.
We validated our model employing constraint programming (CP) implemented throughthe Choco [178], a well-established satisfaction problem solver, considering two differentcloud providers and multiple objectives. The experimental results show that with ourapproach, the users can get optimal configurations with regard to their objectives, whichwithout the support of a system it may be difficult for users deciding for the suggestedones.
Our solution deals with the challenges identified in section 9.2 as follows. To facethe first challenge (capturing clouds heterogeneity and constraints), we proposed a cloudmodel and an abstract feature model that specify the characteristics and constraints of theclouds. The product line engineering approach deals with the second challenge (matchingapplication requirements with the resources characteristics) enabling resource selectionbased on a declarative strategy and on the users’ objectives. In this case, the engineersbenchmark the clouds and include the results in the models. We used our abstract modelto handle the configuration options of two different clouds (Figures 9.8 and 9.9), helping usto deal with the third challenge (describing a multi-cloud deployment environment). Thesemodels consider the dependencies between the resources in a multi-cloud environment.Finally, as our models have functional and non-functional data about the clouds, it cansupport auto-scaling systems without the usage of virtual machine images, dealing withthe fourth challenge (supporting auto-scaling decisions).
Our solution can be used to implement a control loop, where a system continuouslymonitors the environment and takes decisions in order to meet the users’ objectives. Inother words, it can be used to support a system that aims to implement autonomicproperties such as self-configuration and self-optimization.
188

Chapter 10
Dohko: An Autonomic and
Goal-Oriented System for Federated
Clouds
Contents
10.1 Introduction and Motivation . . . . . . . . . . . . . . . . . . . . 190
10.2 System Architecture . . . . . . . . . . . . . . . . . . . . . . . . . 191
10.2.1 Client Layer . . . . . . . . . . . . . . . . . . . . . . . . . . . . . 191
10.2.2 Core Layer . . . . . . . . . . . . . . . . . . . . . . . . . . . . . 193
10.2.3 Infrastructure Layer . . . . . . . . . . . . . . . . . . . . . . . . 196
10.2.4 Monitoring Cross-Layer . . . . . . . . . . . . . . . . . . . . . . 197
10.2.5 Autonomic Properties . . . . . . . . . . . . . . . . . . . . . . . 197
10.2.6 Executing an Application in the Architecture . . . . . . . . . . 200
10.3 Experimental Results . . . . . . . . . . . . . . . . . . . . . . . . 201
10.3.1 Experimental Setup . . . . . . . . . . . . . . . . . . . . . . . . 201
10.3.2 Scenario 1: application deployment . . . . . . . . . . . . . . . . 205
10.3.3 Scenario 2: application execution . . . . . . . . . . . . . . . . . 206
10.3.4 Scenario 3: application deployment and execution with failures 206
10.4 Related Work . . . . . . . . . . . . . . . . . . . . . . . . . . . . . 209
10.5 Summary . . . . . . . . . . . . . . . . . . . . . . . . . . . . . . . 211
In the previous chapter, we described proposed a method based on software productline that allowed automated configuration and deployment of the resources in the cloud,enabling a generative approach. In this chapter, we use this method to build an autonomic
189
Chapter 10. Dohko: An Autonomic and Goal-Oriented System for Federated Clouds
and goal-oriented cloud system. This system aims to help the users on executing theirapplications on federated IaaS clouds. Moreover, our system tackles the issues identifiedin the second contribution (Chapter 7) of this doctoral thesis, relying on top of a P2Player. Finally, it meets most of the functional requirements identified for multiple cloudsystems such as [277]: (a) it provides a way to describe functional and non-functionalrequirements through the usage of our software product line engineering method describedin the previous chapter; (b) it can aggregate services from different clouds; (c) it providesa homogeneous interface to access services of multiple clouds; (d) it allows the serviceselection of the clouds; (e) it can deploy its components on multiple clouds; (f) it providesautomatic procedures for deployments; (g) it utilizes an overlay network to connect and toorganize the resources; (h) it does not impose constraints for the connected clouds.
The reminder of this chapter is organized as follows. Section 10.1 presents the intro-duction and motivation behind this chapter. Section 10.2 presents the proposed systemarchitecture and its main components, followed by a description of its autonomic proper-ties. Experimental results are presented and discussed in 10.3. Section 10.4 presents acomparative view of some important features of cloud architectures. Finally, section 10.5concludes this chapter.
10.1 Introduction and Motivation
Deploying and executing an application in an IaaS cloud demand a considerable amountof work. This amount of work is mostly due to the kind of applications considered bythese clouds. While the clouds focus on Web applications, the users’ applications aremany times batch-oriented, performing parameter sweep operations. Furthermore, usersapplications may require specific configurations and some of them may take days or evenweeks to complete their executions.
While the former issue can be dealt with virtual machine image (VMI), the latterrequires monitoring and fault-tolerance strategies in order to reduce the chances of losing thework (i.e., the application execution) just before it completes. Nonetheless, creating VMIsis often time-consuming and demands advanced technical skills. Monitoring, on theother hand, is usually realized by employing heartbeats [153]. Heartbeats are presencenotification messages sent by each virtual machine to a monitor [88]. In this case, when aheartbeat message fails to reach the monitor within a given threshold, the VM is consideredunavailable and a process to recovery it or to create a new one starts.
Since clouds are susceptible to failures, it is interesting to consider a multi-cloudscenario. This scenario increases the difficulties to deploy and to execute an application.These difficulties are mainly due to the clouds’ heterogeneity and because of the cost ofexporting and importing virtual machine images between the clouds. In addition, theusers should be aware of the clouds’ internals and the communication pattern of theirapplications in order to reduce the cost, for instance. For example, in some clouds, the costof data transfers between virtual machines in the same data center using their external IPaddresses is the same as the cost of transferring data between different clouds or regions.Moreover, the network throughput is often lower when using external IP addresses. Hence,changing the applications to consider the location of the nodes or realizing this workmanually may be very difficult for the users, especially when there are multiple clouds and
190

Chapter 10. Dohko: An Autonomic and Goal-Oriented System for Federated Clouds
the environment can change at runtime. In this context, we advocate the use of autonomicsystems (Chapter 4) to do this work automatically.
Therefore, in this chapter we propose and evaluate an autonomic cloud architecture. Theproposed architecture implements self-configuration, self-healing, and context-awarenessproperties to help users on executing their applications in multiple clouds and to tacklethe difficulties described previously. Our architecture relies on a hierarchical P2P overlayto organize the virtual machines and to deal with inter-cloud communication.
The reminder of this chapter is organized as follows. Section 10.2 presents the proposedarchitecture and its main components, followed by a description of its autonomic properties.Then, experimental results are discussed in 10.3. Next, a comparative view of someimportant features of cloud architectures is presented in section 10.4. Finally, section 10.5presents final considerations.
10.2 System Architecture
In our proposal, we assume a multi-cloud environment, where each cloud has a pub-lic API that implements the operations to: (a) manage the virtual machines (e.g., tocreate, to start, to shutdown) and their disks; (b) get the list of the available VMs andtheir state (e.g., running, stopped, terminated, among others); (c) complement the VMs’descriptions through the usage of metadata. We also consider that the virtual machinesfail following the fail-stop model. In other words, when a VM fails, its state changes tostopped and the system can either restart it or replace it by a new one.
As the proposed architecture organizes the nodes using a P2P overlay, we assumethat there is a set of nodes (e.g., super-peers) responsible for executing some specializedfunctions such as system bootstrapping and communication management. It is importantto notice that the presence of such nodes does not mean a centralized control, as describedin section 2.4. In addition, the number of these specialized nodes may vary according tosome objective, e.g., the number of clouds.
The architecture uses a message queue system (MQS) to implement a publish/subscribepolicy. The publish/subscribe interaction pattern is employed due to its properties suchas [108]: space decoupling, time decoupling, and synchronization decoupling. These prop-erties help the system to increase scalability and to make its communication infrastructureready to work on distributed environments. Moreover, message queue systems normally donot impose any constraint for the infrastructure. In this case, all messages are persisted tosupport both node’s and services’ failures; and a message continues in the queue until asubscriber consumes it or until a defined timeout is achieved.
The proposed architecture comprises three layers: client, core, and infrastructure, asdepicted in figure 10.1. There is also a cross-layer called monitoring. In the context ofthis work, the rationale for using a layered architecture is that it enables a loosely coupleddesign and a service-oriented architecture (SOA).
10.2.1 Client Layer
The client layer provides the job submission module. This module takes an applicationdescriptor as input, and submits it to a node in the cloud. This node is called application
191
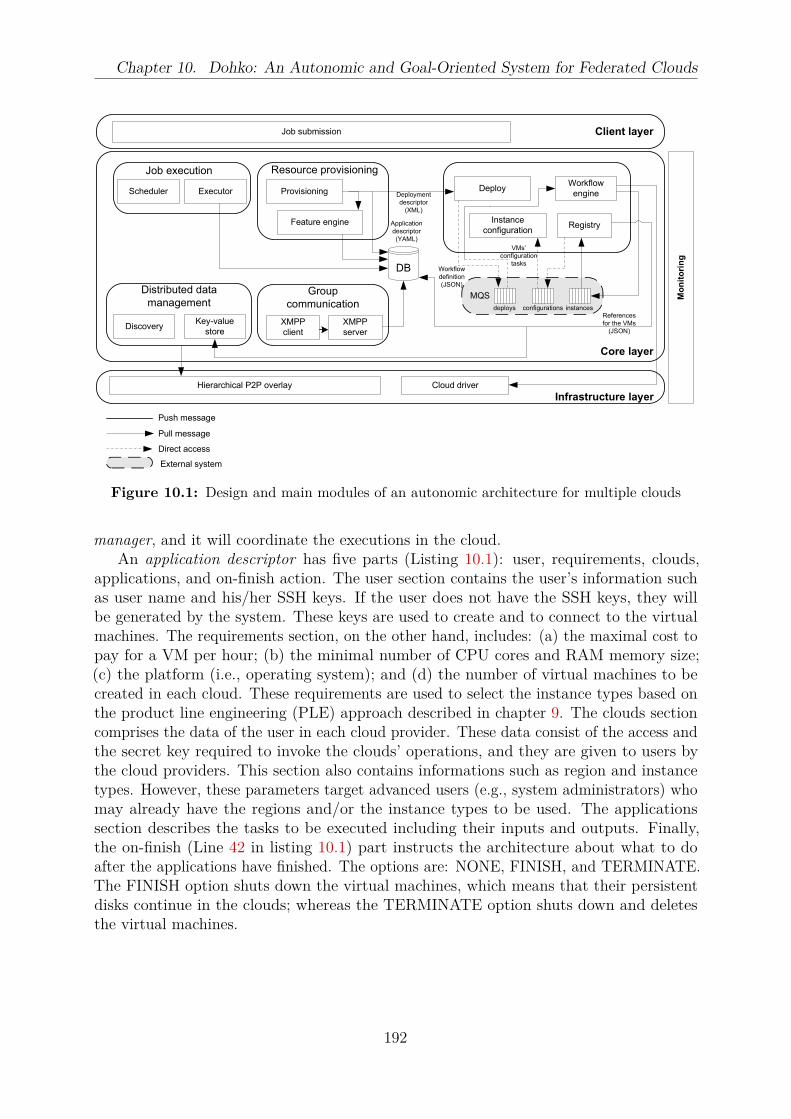
Chapter 10. Dohko: An Autonomic and Goal-Oriented System for Federated Clouds
Provisioning Deploy
Instance
configurationRegistryFeature engine
Resource provisioningWorkflow
engine
DB
Executor
XMPP
server
XMPP
client
Group
communication
Scheduler
Job execution
MQS Mo
nit
ori
ng
Discovery
Hierarchical P2P overlay
Key-value
store
Cloud driver
Push message
Pull message
Direct access
Infrastructure layer
Core layer
Client layer
External system
Job submission
Deployment
descriptor
(XML)
Workflow
definition
(JSON)
References
for the VMs
(JSON)
Distributed data
management
Application
descriptor
(YAML)
VMs’
configuration
tasks
deploys configurations instances
Figure 10.1: Design and main modules of an autonomic architecture for multiple clouds
manager, and it will coordinate the executions in the cloud.An application descriptor has five parts (Listing 10.1): user, requirements, clouds,
applications, and on-finish action. The user section contains the user’s information suchas user name and his/her SSH keys. If the user does not have the SSH keys, they willbe generated by the system. These keys are used to create and to connect to the virtualmachines. The requirements section, on the other hand, includes: (a) the maximal cost topay for a VM per hour; (b) the minimal number of CPU cores and RAM memory size;(c) the platform (i.e., operating system); and (d) the number of virtual machines to becreated in each cloud. These requirements are used to select the instance types based onthe product line engineering (PLE) approach described in chapter 9. The clouds sectioncomprises the data of the user in each cloud provider. These data consist of the access andthe secret key required to invoke the clouds’ operations, and they are given to users bythe cloud providers. This section also contains informations such as region and instancetypes. However, these parameters target advanced users (e.g., system administrators) whomay already have the regions and/or the instance types to be used. The applicationssection describes the tasks to be executed including their inputs and outputs. Finally,the on-finish (Line 42 in listing 10.1) part instructs the architecture about what to doafter the applications have finished. The options are: NONE, FINISH, and TERMINATE.The FINISH option shuts down the virtual machines, which means that their persistentdisks continue in the clouds; whereas the TERMINATE option shuts down and deletesthe virtual machines.
192

Chapter 10. Dohko: An Autonomic and Goal-Oriented System for Federated Clouds
1 ---
2 name:
4 user:
5 username:
6 keys:
7 key: []
9 requirements:
10 cpu:
11 memory:
12 platform:
13 cost:
14 number-of-instances-per-cloud:
16 clouds:
17 cloud:
18 - name:
19 provider:
20 name:
21 access-key:
22 access-key:
23 secret-key:
24 region:
25 - name:
26 zone:
27 - name:
28 instance-types:
29 instance-type:
30 - name:
31 number-of-instances:
33 applications:
34 application:
35 name:
36 command-line:
37 file:
38 - name:
39 path:
40 generated:
42 on-finish:
Listing 10.1: Structure of an application descriptor
10.2.2 Core Layer
The core layer of the architecture (Figure 10.1) comprises the modules to provision, tocreate, to configure, to implement group communication, and to manage data distribution,as well as to execute the applications.
The provisioning module is responsible for receiving an application descriptor and forgenerating a deployment descriptor. It utilizes the feature engine to obtain the instancetypes that meet the users’ requirements. The feature engine implements the feature model
193

Chapter 10. Dohko: An Autonomic and Goal-Oriented System for Federated Clouds
(FM) described in chapter 9. The deployment descriptor comprises all data requiredto create a virtual machine. These data are: (a) the cloud provider; (b) the instancetype; (c) the zone (data center); (d) the virtual machine image; (e) the network securitygroup and its inbound and outbound traffic rules; (f) the disks; and (g) the metadata.Listing 10.2 shows an example of an deployment descriptor. In this example, one virtualmachine should be created with the name e8e4b9711d36f4fb9814fa49b74f1b724-1 in thezone us-east-1a of region us-east-1. The cloud provider should be Amazon, using theinstance type t2.micro and the virtual machine image ami-864d84ee. Furthermore, twometadata (tags) are added to the virtual machine (app-deployment-id and manager).
1 <?xml version="1.0" encoding="UTF-8"?>
2 <deployment user="username">
3 <uuid>f4070433-a551-4a60-ba57-3e771ceb145f</uuid>
4 <node name="e8e4b9711d36f4fb9814fa49b74f1b724-1" count="1" region="us-east-1"
5 zone="us-east-1a">
6 <provider name="amazon">
7 <image>ami-864d84ee</image>
8 <instance-type>t2.micro</instance-type>
9 </provider>
10 <tags>
11 <tag>
12 <name>app-deployment-id</name>
13 <value>e8e4b9711d36f4fb9814fa49b74f1b724</value>
14 </tag>
15 <tag>
16 <name>manager</name>
17 <value>i-a1f8798c</value>
18 </tag>
19 </tags>
20 </node>
21 </deployment>
Listing 10.2: An example of a deployment descriptor generated by the pro-
visioning module
The deployment descriptor is sent to the deploy module. Then, the deploy modulecreates a workflow (deployment workflow) with the tasks to instantiate the VMs. Aworkflow is used since there are some precedent steps that must be performed in order toguarantee the creation of the VMs. For example, (a) the SSH keys must be generated andimported into the clouds; (b) if the instance types support the group feature (Figure 9.6),the system must check if one exists in the given zone and if not, create it. Furthermore,using workflow enables the architecture to support partial failures of the deploymentprocess. In addition, it decouples the architecture from the clouds’ drivers. In this case,based on the provider’s name, the deploy module selects in the database its correspondentdriver to be instantiated at runtime by the workflow engine. This deployment workflowis enqueued by the deploy module and dequeued by the workflow engine. The workflowengine executes the workflow and enqueues the references to the created virtual machinesin another queue.
The registry module is responsible for: (a) storing the instances informations in a localdatabase and in the distributed key-value store; and (b) selecting the configurations (i.e.,software packages) to be applied in each instance. These configurations are usually defined
194
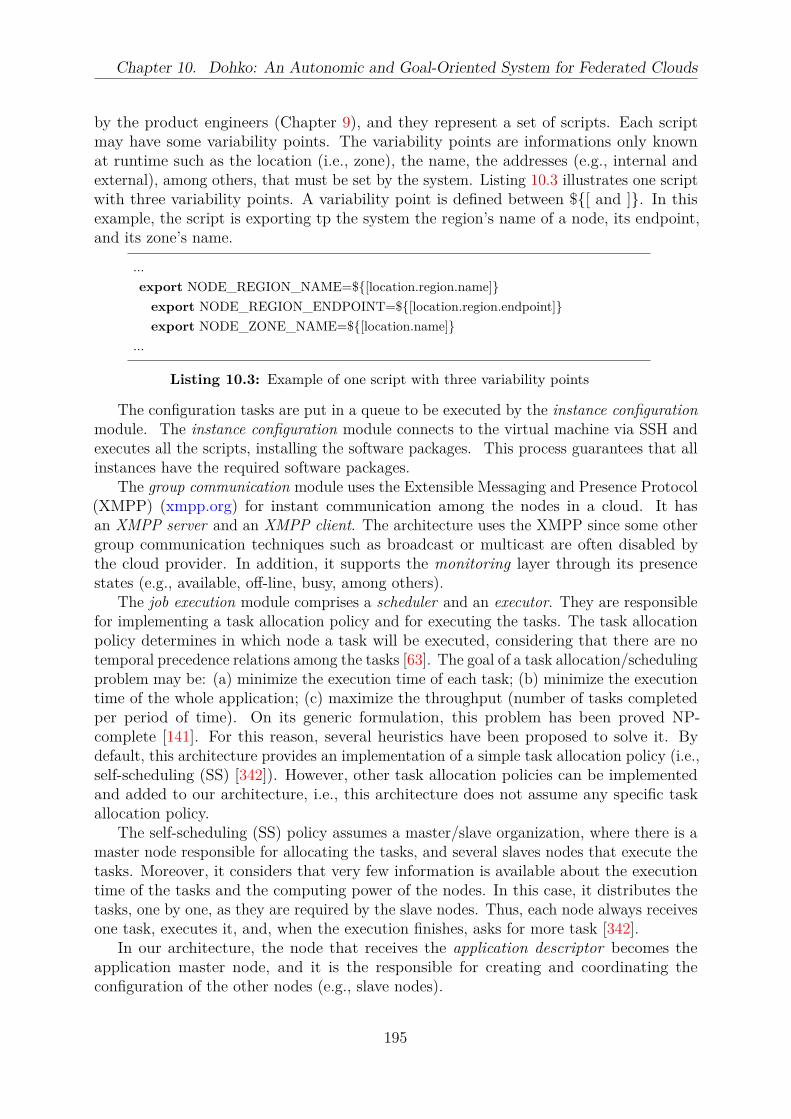
Chapter 10. Dohko: An Autonomic and Goal-Oriented System for Federated Clouds
by the product engineers (Chapter 9), and they represent a set of scripts. Each scriptmay have some variability points. The variability points are informations only knownat runtime such as the location (i.e., zone), the name, the addresses (e.g., internal andexternal), among others, that must be set by the system. Listing 10.3 illustrates one scriptwith three variability points. A variability point is defined between $[ and ]. In thisexample, the script is exporting tp the system the region’s name of a node, its endpoint,and its zone’s name.
...
export NODE_REGION_NAME=$[location.region.name]
export NODE_REGION_ENDPOINT=$[location.region.endpoint]
export NODE_ZONE_NAME=$[location.name]
...
Listing 10.3: Example of one script with three variability points
The configuration tasks are put in a queue to be executed by the instance configurationmodule. The instance configuration module connects to the virtual machine via SSH andexecutes all the scripts, installing the software packages. This process guarantees that allinstances have the required software packages.
The group communication module uses the Extensible Messaging and Presence Protocol(XMPP) (xmpp.org) for instant communication among the nodes in a cloud. It hasan XMPP server and an XMPP client. The architecture uses the XMPP since some othergroup communication techniques such as broadcast or multicast are often disabled bythe cloud provider. In addition, it supports the monitoring layer through its presencestates (e.g., available, off-line, busy, among others).
The job execution module comprises a scheduler and an executor. They are responsiblefor implementing a task allocation policy and for executing the tasks. The task allocationpolicy determines in which node a task will be executed, considering that there are notemporal precedence relations among the tasks [63]. The goal of a task allocation/schedulingproblem may be: (a) minimize the execution time of each task; (b) minimize the executiontime of the whole application; (c) maximize the throughput (number of tasks completedper period of time). On its generic formulation, this problem has been proved NP-complete [141]. For this reason, several heuristics have been proposed to solve it. Bydefault, this architecture provides an implementation of a simple task allocation policy (i.e.,self-scheduling (SS) [342]). However, other task allocation policies can be implementedand added to our architecture, i.e., this architecture does not assume any specific taskallocation policy.
The self-scheduling (SS) policy assumes a master/slave organization, where there is amaster node responsible for allocating the tasks, and several slaves nodes that execute thetasks. Moreover, it considers that very few information is available about the executiontime of the tasks and the computing power of the nodes. In this case, it distributes thetasks, one by one, as they are required by the slave nodes. Thus, each node always receivesone task, executes it, and, when the execution finishes, asks for more task [342].
In our architecture, the node that receives the application descriptor becomes theapplication master node, and it is the responsible for creating and coordinating theconfiguration of the other nodes (e.g., slave nodes).
195
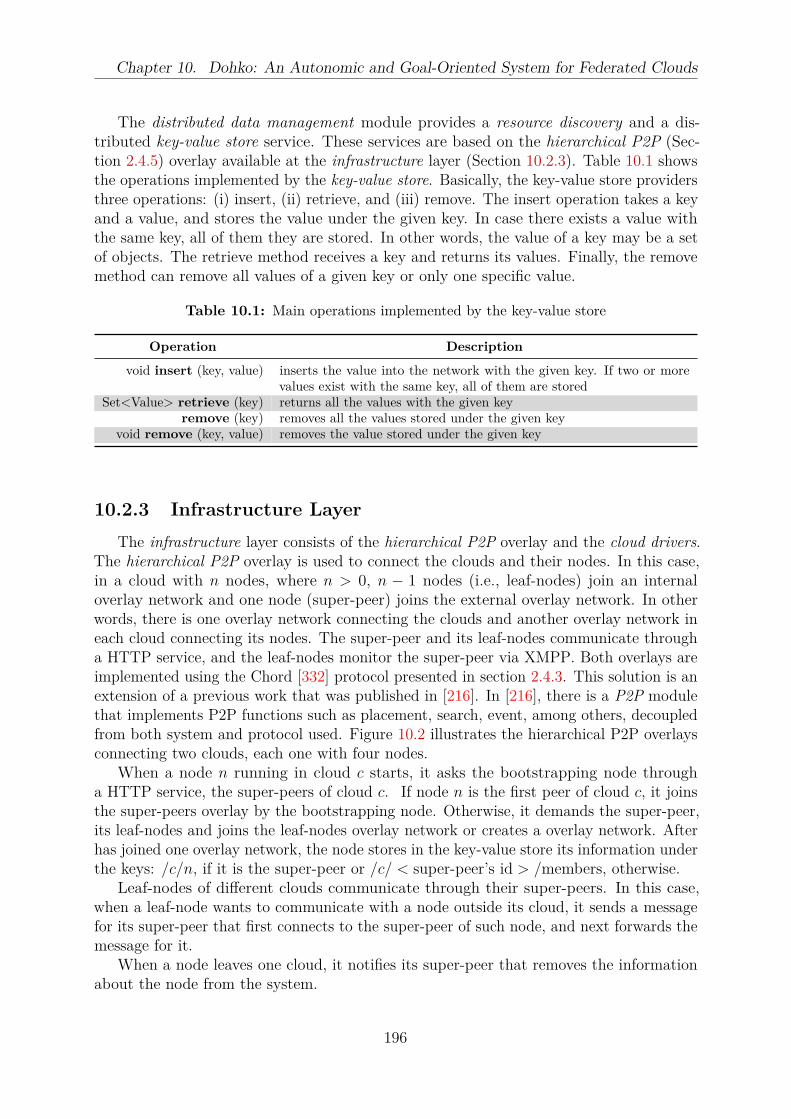
Chapter 10. Dohko: An Autonomic and Goal-Oriented System for Federated Clouds
The distributed data management module provides a resource discovery and a dis-tributed key-value store service. These services are based on the hierarchical P2P (Sec-tion 2.4.5) overlay available at the infrastructure layer (Section 10.2.3). Table 10.1 showsthe operations implemented by the key-value store. Basically, the key-value store providersthree operations: (i) insert, (ii) retrieve, and (iii) remove. The insert operation takes a keyand a value, and stores the value under the given key. In case there exists a value withthe same key, all of them they are stored. In other words, the value of a key may be a setof objects. The retrieve method receives a key and returns its values. Finally, the removemethod can remove all values of a given key or only one specific value.
Table 10.1: Main operations implemented by the key-value store
Operation Description
void insert (key, value) inserts the value into the network with the given key. If two or morevalues exist with the same key, all of them are stored
Set<Value> retrieve (key) returns all the values with the given keyremove (key) removes all the values stored under the given key
void remove (key, value) removes the value stored under the given key
10.2.3 Infrastructure Layer
The infrastructure layer consists of the hierarchical P2P overlay and the cloud drivers.The hierarchical P2P overlay is used to connect the clouds and their nodes. In this case,in a cloud with n nodes, where n > 0, n − 1 nodes (i.e., leaf-nodes) join an internaloverlay network and one node (super-peer) joins the external overlay network. In otherwords, there is one overlay network connecting the clouds and another overlay network ineach cloud connecting its nodes. The super-peer and its leaf-nodes communicate througha HTTP service, and the leaf-nodes monitor the super-peer via XMPP. Both overlays areimplemented using the Chord [332] protocol presented in section 2.4.3. This solution is anextension of a previous work that was published in [216]. In [216], there is a P2P modulethat implements P2P functions such as placement, search, event, among others, decoupledfrom both system and protocol used. Figure 10.2 illustrates the hierarchical P2P overlaysconnecting two clouds, each one with four nodes.
When a node n running in cloud c starts, it asks the bootstrapping node througha HTTP service, the super-peers of cloud c. If node n is the first peer of cloud c, it joinsthe super-peers overlay by the bootstrapping node. Otherwise, it demands the super-peer,its leaf-nodes and joins the leaf-nodes overlay network or creates a overlay network. Afterhas joined one overlay network, the node stores in the key-value store its information underthe keys: /c/n, if it is the super-peer or /c/ < super-peer’s id > /members, otherwise.
Leaf-nodes of different clouds communicate through their super-peers. In this case,when a leaf-node wants to communicate with a node outside its cloud, it sends a messagefor its super-peer that first connects to the super-peer of such node, and next forwards themessage for it.
When a node leaves one cloud, it notifies its super-peer that removes the informationabout the node from the system.
196
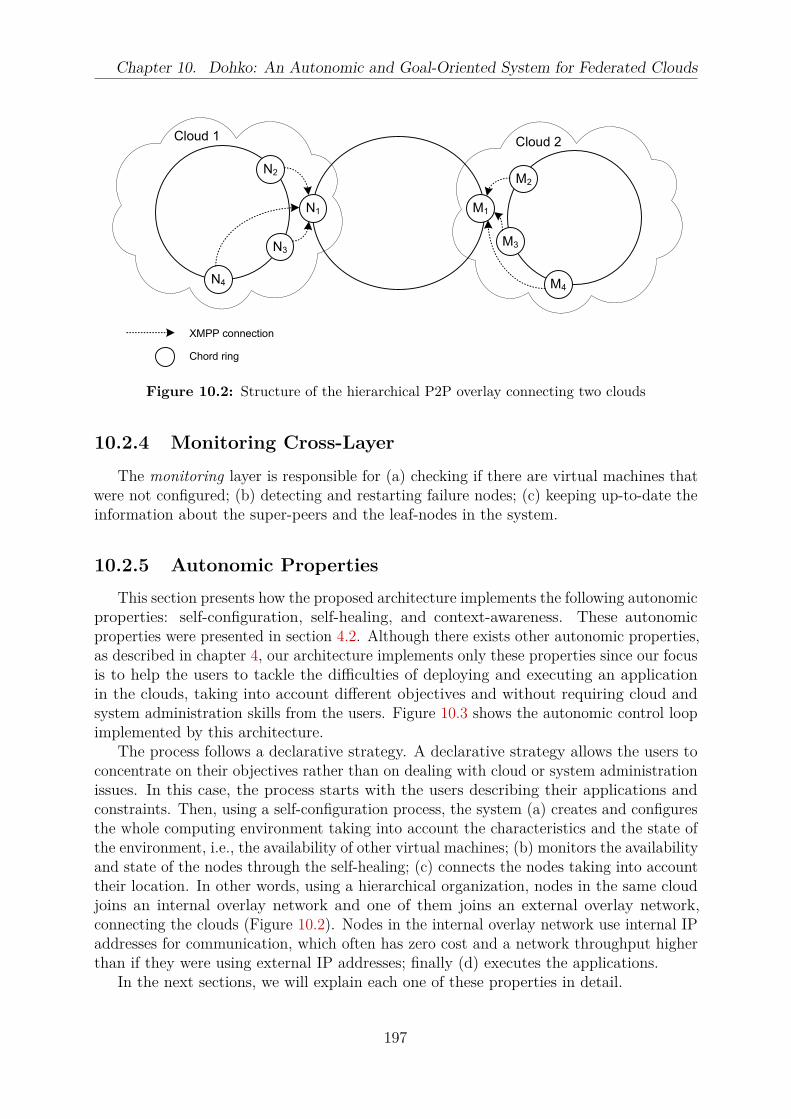
Chapter 10. Dohko: An Autonomic and Goal-Oriented System for Federated Clouds
N1 M1
N2
N3
N4
M2
M3
M4
Cloud 1 Cloud 2
XMPP connection
Chord ring
Figure 10.2: Structure of the hierarchical P2P overlay connecting two clouds
10.2.4 Monitoring Cross-Layer
The monitoring layer is responsible for (a) checking if there are virtual machines thatwere not configured; (b) detecting and restarting failure nodes; (c) keeping up-to-date theinformation about the super-peers and the leaf-nodes in the system.
10.2.5 Autonomic Properties
This section presents how the proposed architecture implements the following autonomicproperties: self-configuration, self-healing, and context-awareness. These autonomicproperties were presented in section 4.2. Although there exists other autonomic properties,as described in chapter 4, our architecture implements only these properties since our focusis to help the users to tackle the difficulties of deploying and executing an applicationin the clouds, taking into account different objectives and without requiring cloud andsystem administration skills from the users. Figure 10.3 shows the autonomic control loopimplemented by this architecture.
The process follows a declarative strategy. A declarative strategy allows the users toconcentrate on their objectives rather than on dealing with cloud or system administrationissues. In this case, the process starts with the users describing their applications andconstraints. Then, using a self-configuration process, the system (a) creates and configuresthe whole computing environment taking into account the characteristics and the state ofthe environment, i.e., the availability of other virtual machines; (b) monitors the availabilityand state of the nodes through the self-healing; (c) connects the nodes taking into accounttheir location. In other words, using a hierarchical organization, nodes in the same cloudjoins an internal overlay network and one of them joins an external overlay network,connecting the clouds (Figure 10.2). Nodes in the internal overlay network use internal IPaddresses for communication, which often has zero cost and a network throughput higherthan if they were using external IP addresses; finally (d) executes the applications.
In the next sections, we will explain each one of these properties in detail.
197

Chapter 10. Dohko: An Autonomic and Goal-Oriented System for Federated Clouds
Cloud users
Self-configuration
Self-healing
Context-awareness
Autonomic
properties
Application
descriptor
Submit applications’
and environment’s
requirements
Figure 10.3: The autonomic properties implemented by our architecture
10.2.5.1 Self-Configuration
Our architecture automatically creates and configures the virtual machines in theclouds. The configuration process is based on the concrete feature model defined by theproduct engineers (Section 9.6) and on the users requirements. When the architecturereceives an application descriptor, it (a) creates the SSH keys (i.e., private and publickeys) to be used by the virtual machines, and imports them into the clouds; (b) createsa security group with the inbound and outbound rules; (c) uses the clouds’ metadatasupport to describe the VMs, allowing the users to trace the origin of each resource, andto access them without using the architecture, if necessary. In addition, these metadataprovide support for the self-healing process; (d) selects one data center (i.e., availabilityzone) to deploy the virtual machines according to the availability of VMs running in thesame zone; (e) selects the instance types; (f) configures the instances with all the softwarepackages; (g) starts all the required services considering the instance state. For example, ifa service requires one information (e.g., its region’s name, up-to-date IP addresses) aboutthe environment where it is running, it is automatically assigned by the architecture beforeit starts. For instance, when an instance fails or needs to be restarted, the architecturedetects the new values of its ephemeral properties such as the IP addresses (i.e., privateand public IPs) and starts its services to use up-to-date informations.
The metadata of an instance include: (i) the user name to access the VM, (ii) thevalue of the keys, (iii) the name of its virtual machine image (VMI), (iv) the owner (i.e.,the user), (v) the name of its application manager, and (vi) the name of the feature modelused to configure it. These data help the system to support failures of both the managerand the architecture. For example, suppose that just after having created the virtualmachines, the application manager node fails. Without these metadata, another nodecould not access the instances to configure them, leaving for the system only the optionto terminate the instances, which implies a financial cost as the users will pay for theinstances without having used them.
10.2.5.2 Self-Healing
The cross-layer monitor module uses the XMPP to monitor the availability of the virtualmachines. In this case, every virtual machine runs an XMPP server, which periodically,requests the discovery service to list the VMs running in the cloud. The returned VMs
198
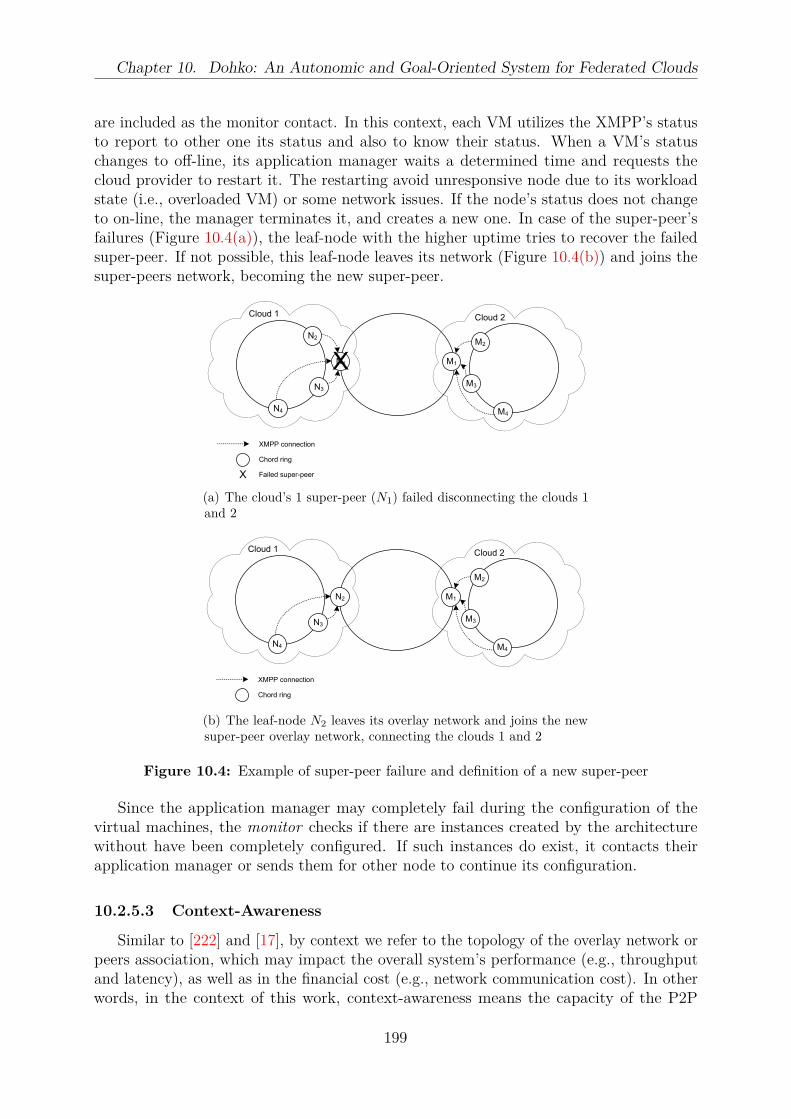
Chapter 10. Dohko: An Autonomic and Goal-Oriented System for Federated Clouds
are included as the monitor contact. In this context, each VM utilizes the XMPP’s statusto report to other one its status and also to know their status. When a VM’s statuschanges to off-line, its application manager waits a determined time and requests thecloud provider to restart it. The restarting avoid unresponsive node due to its workloadstate (i.e., overloaded VM) or some network issues. If the node’s status does not changeto on-line, the manager terminates it, and creates a new one. In case of the super-peer’sfailures (Figure 10.4(a)), the leaf-node with the higher uptime tries to recover the failedsuper-peer. If not possible, this leaf-node leaves its network (Figure 10.4(b)) and joins thesuper-peers network, becoming the new super-peer.
N1 M1
N2
N3
N4
M2
M3
M4
Cloud 1 Cloud 2
XMPP connection
Chord ring
X
X Failed super-peer
(a) The cloud’s 1 super-peer (N1) failed disconnecting the clouds 1and 2
N2 M1
N3
N4
M2
M3
M4
Cloud 1 Cloud 2
XMPP connection
Chord ring
(b) The leaf-node N2 leaves its overlay network and joins the newsuper-peer overlay network, connecting the clouds 1 and 2
Figure 10.4: Example of super-peer failure and definition of a new super-peer
Since the application manager may completely fail during the configuration of thevirtual machines, the monitor checks if there are instances created by the architecturewithout have been completely configured. If such instances do exist, it contacts theirapplication manager or sends them for other node to continue its configuration.
10.2.5.3 Context-Awareness
Similar to [222] and [17], by context we refer to the topology of the overlay network orpeers association, which may impact the overall system’s performance (e.g., throughputand latency), as well as in the financial cost (e.g., network communication cost). In otherwords, in the context of this work, context-awareness means the capacity of the P2P
199

Chapter 10. Dohko: An Autonomic and Goal-Oriented System for Federated Clouds
communication protocol be aware of the peers’ locations and of adapting the system’sbehavior based on the situation changes [222, 380].
As described in section 10.2, the nodes are organized into two overlay networks. Thisavoids unnecessary data transfers between the clouds and often increases the networkthroughput between the nodes in the internal overlay. Furthermore, it helps to decreasethe cost of the application execution, avoiding inter-cloud data transferring due to theoverlay stabilization activities (Section 2.4.3). If all nodes were organized in the same P2Poverlay network, they would have to communicate using external IP addresses (i.e., publicIP), which implies in Internet traffic cost, even if the nodes are located in the same datacenter. In addition, in a high churn rate scenario (Section 2.4.2), it decreases the cost ofmaintaining the distributed hash tables (DHTs) (Section 2.4.3) up-to-date since it doesnot require inter-cloud communication.
10.2.6 Executing an Application in the Architecture
In order to illustrate the usage of our architecture, consider that one user is interestedin executing his/her application in the cloud (Figure 10.5). In this example, the applicationmanager is the node that receives the user’s demand (application descriptor), and theworker is a node that receives a task to execute.
The process starts when the user defines an application descriptor depicted in list-ing 10.4, with the requirements and applications. In this example, one virtual machinewith at least 1 CPU core and 1 GB of RAM memory is requested, with the Linux operatingsystem, and a cost of at most 0.02 USD/hour. Moreover, this instance should be createdon Amazon using the given access and secret key. Finally, the task consists of getting theinformation about the CPU (Line 25 in listing 10.4).
The application descriptor is submitted to the system through the job submissionmodule (Figure 10.5 (1)). Then, the job submission module looks for an appropriate nodethrough the discovery service (Figure 10.5 (2)), and sends the application descriptor toit (Figure 10.5 (3)).
After, the provisioning module in the application manager takes the applicationdescriptor and persists into its database (Figure 10.5 (4)). Next, the provisioning moduledemands the feature engine module: (a) an instance type that meets the user’s constraints,and (b) a virtual machine image (VMI). The feature engine returns the t2.micro (Table 9.3)instance type in the us-east-1 region, and the virtual machine image ami-864d84ee. Withthese data, the provisioning module: (a) selects a zone to host the virtual machine,(b) generates the deployment descriptor (Listing 10.2), and (c) submits it to the deploymentmodule (Figure 10.5 (5)).
The deployment module creates a workflow (Figure 10.6) with the steps to instantiatethe VM, and enqueues it through the MQS (Figure 10.5 (6), queue: deploys). The workflowengine executes the deployment workflow, i.e., it connects to the cloud and creates thevirtual machine (Figure 10.5 (7 and 8)). The data about the VM are enqueued in in-stances queue (Figure 10.5 (9)). Next, the registry module dequeues the instance fromthe queue instances and inserts its information into the database and into the key-valuestore (Figure 10.5 (10)). After, it creates the configuration tasks to be executed in thevirtual machine (Figure 10.5 (11)). Each task comprises a host, a user name, the SSH keys,and the scripts to be executed. After, the instance configuration module: (a) connects
200
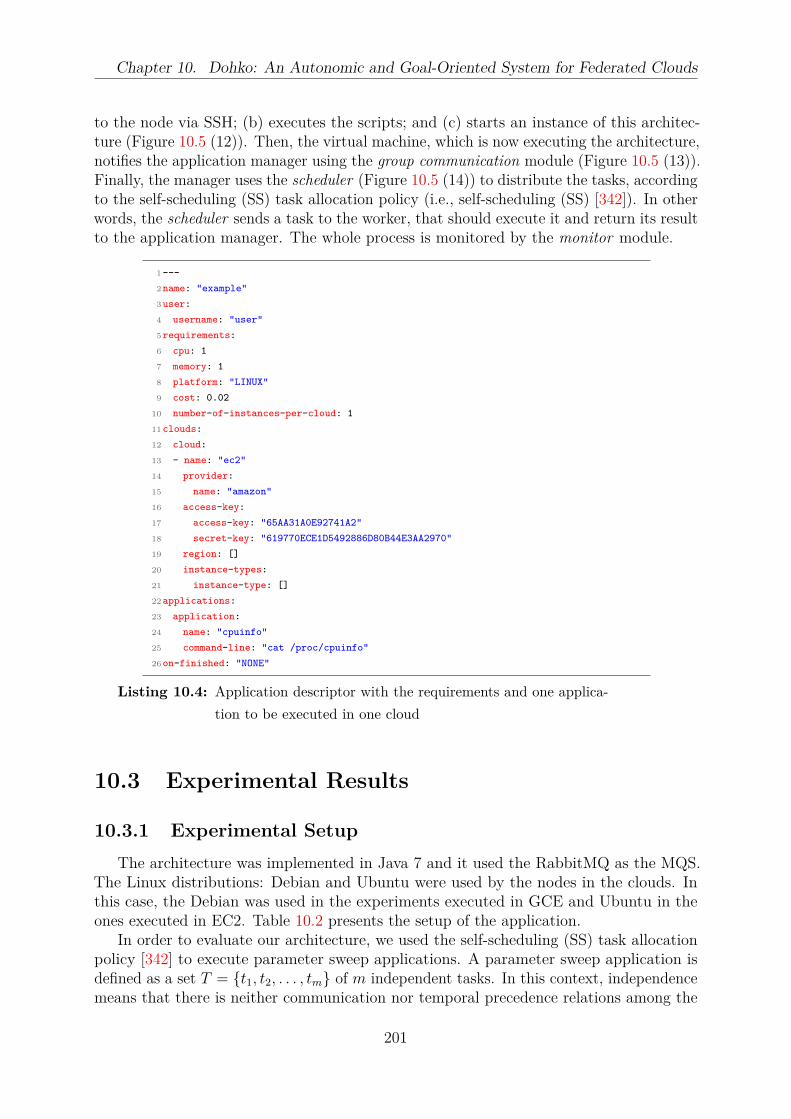
Chapter 10. Dohko: An Autonomic and Goal-Oriented System for Federated Clouds
to the node via SSH; (b) executes the scripts; and (c) starts an instance of this architec-ture (Figure 10.5 (12)). Then, the virtual machine, which is now executing the architecture,notifies the application manager using the group communication module (Figure 10.5 (13)).Finally, the manager uses the scheduler (Figure 10.5 (14)) to distribute the tasks, accordingto the self-scheduling (SS) task allocation policy (i.e., self-scheduling (SS) [342]). In otherwords, the scheduler sends a task to the worker, that should execute it and return its resultto the application manager. The whole process is monitored by the monitor module.
1 ---
2 name: "example"
3 user:
4 username: "user"
5 requirements:
6 cpu: 1
7 memory: 1
8 platform: "LINUX"
9 cost: 0.02
10 number-of-instances-per-cloud: 1
11 clouds:
12 cloud:
13 - name: "ec2"
14 provider:
15 name: "amazon"
16 access-key:
17 access-key: "65AA31A0E92741A2"
18 secret-key: "619770ECE1D5492886D80B44E3AA2970"
19 region: []
20 instance-types:
21 instance-type: []
22 applications:
23 application:
24 name: "cpuinfo"
25 command-line: "cat /proc/cpuinfo"
26 on-finished: "NONE"
Listing 10.4: Application descriptor with the requirements and one applica-
tion to be executed in one cloud
10.3 Experimental Results
10.3.1 Experimental Setup
The architecture was implemented in Java 7 and it used the RabbitMQ as the MQS.The Linux distributions: Debian and Ubuntu were used by the nodes in the clouds. Inthis case, the Debian was used in the experiments executed in GCE and Ubuntu in theones executed in EC2. Table 10.2 presents the setup of the application.
In order to evaluate our architecture, we used the self-scheduling (SS) task allocationpolicy [342] to execute parameter sweep applications. A parameter sweep application isdefined as a set T = t1, t2, . . . , tm of m independent tasks. In this context, independencemeans that there is neither communication nor temporal precedence relations among the
201

Chapter
10.
Dohko:
An
Auto
nom
icand
Goal-O
riented
System
for
Fed
erated
Clo
uds
Provisioning Deploy
Instance
configurationRegistryFeature engine
Resource provisioningWorkflow
engine
DB
Executor
XMPP
server
XMPP
client
Group
communication
Scheduler
Job execution
MQS
Mon
itoring
Discovery
Hierarchical P2P overlay
Key-value
store
Cloud driver
Push message
Pull message
Direct access
Infrastructure layer
Core layer
Client layer
External system
Job submission
An application
descriptor (YAML)
Application
manager
1
3
5Deployment
descriptor
(XML)
6Workflow
definition
(JSON)
7
9References
for the VMs
(JSON)Persists the data
about the VMs
11
Distributed data
management
2Requests the IP
address of an
appropriate node
Submits the application descriptor
4Application
descriptor
(YAML)
10
VMs’
configuration
tasks
Worker
12Configures the VM and
starts the system
(architecture)
(SSH connection)
13Registers itself as
a contact of the
manager
Instance of the
architecture
14
Sends a task for
the idle VM
(HTTP request -
JSON format)
8 Creates the VMs
deploys configurations instances
Figure 10.5: Interaction between the architecture’s module when submitted an application to execute
202

Chapter 10. Dohko: An Autonomic and Goal-Oriented System for Federated Clouds
Deployment workflow
Creates the SSH keys
Imports the SSH keys
Does the instance type support group feature?
Creates a group
Creates the security group
Authorizes inbound and outbound traffic
[Yes]
Creates the virtual machines
Are the virtual machines running?
Waits t seconds
[No]
[Yes]
[No]
Figure 10.6: Workflow to create one virtual machine in the cloud
Table 10.2: Setup of the application
Software Version
GNU/Linux x86_64 3.2.0-4-amd64GNU/Linux x86_64 3.13.0-29-generic
OpenJDK 1.7.0_65RabbitMQ 3.3.5SSEARCH 36.3.6
203
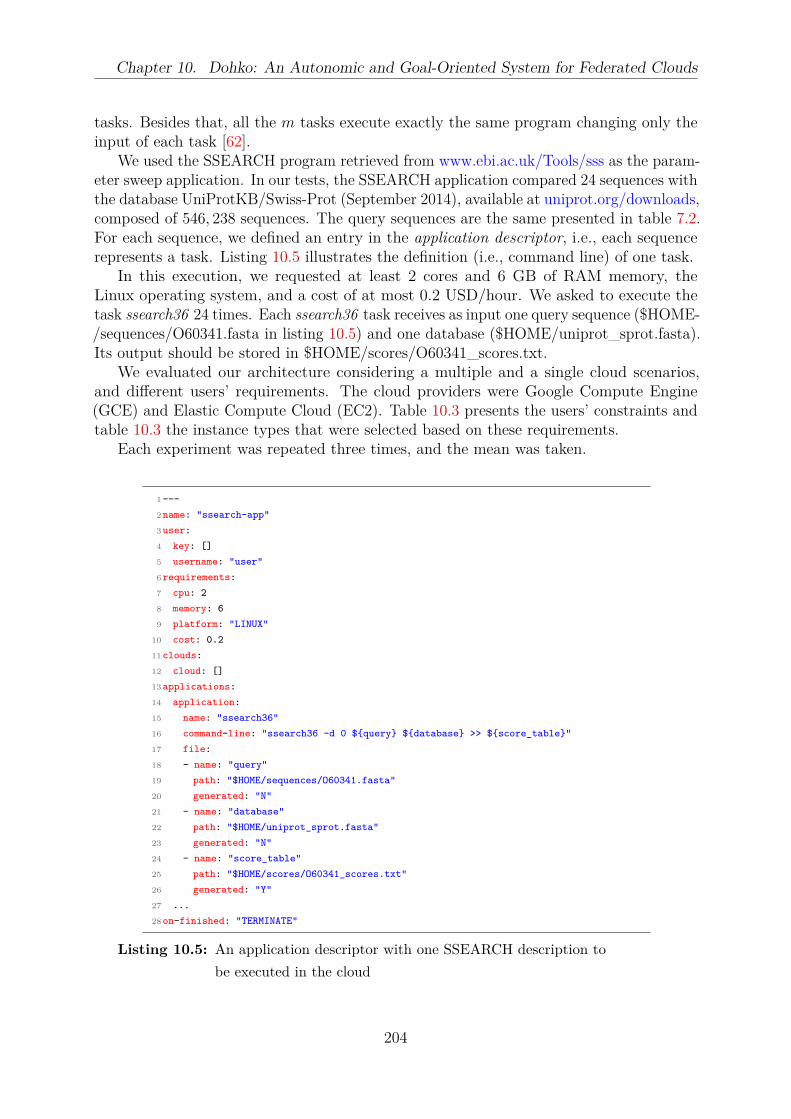
Chapter 10. Dohko: An Autonomic and Goal-Oriented System for Federated Clouds
tasks. Besides that, all the m tasks execute exactly the same program changing only theinput of each task [62].
We used the SSEARCH program retrieved from www.ebi.ac.uk/Tools/sss as the param-eter sweep application. In our tests, the SSEARCH application compared 24 sequences withthe database UniProtKB/Swiss-Prot (September 2014), available at uniprot.org/downloads,composed of 546, 238 sequences. The query sequences are the same presented in table 7.2.For each sequence, we defined an entry in the application descriptor, i.e., each sequencerepresents a task. Listing 10.5 illustrates the definition (i.e., command line) of one task.
In this execution, we requested at least 2 cores and 6 GB of RAM memory, theLinux operating system, and a cost of at most 0.2 USD/hour. We asked to execute thetask ssearch36 24 times. Each ssearch36 task receives as input one query sequence ($HOME-/sequences/O60341.fasta in listing 10.5) and one database ($HOME/uniprot_sprot.fasta).Its output should be stored in $HOME/scores/O60341_scores.txt.
We evaluated our architecture considering a multiple and a single cloud scenarios,and different users’ requirements. The cloud providers were Google Compute Engine(GCE) and Elastic Compute Cloud (EC2). Table 10.3 presents the users’ constraints andtable 10.3 the instance types that were selected based on these requirements.
Each experiment was repeated three times, and the mean was taken.
1 ---
2 name: "ssearch-app"
3 user:
4 key: []
5 username: "user"
6 requirements:
7 cpu: 2
8 memory: 6
9 platform: "LINUX"
10 cost: 0.2
11 clouds:
12 cloud: []
13 applications:
14 application:
15 name: "ssearch36"
16 command-line: "ssearch36 -d 0 $query $database >> $score_table"
17 file:
18 - name: "query"
19 path: "$HOME/sequences/O60341.fasta"
20 generated: "N"
21 - name: "database"
22 path: "$HOME/uniprot_sprot.fasta"
23 generated: "N"
24 - name: "score_table"
25 path: "$HOME/scores/O60341_scores.txt"
26 generated: "Y"
27 ...
28 on-finished: "TERMINATE"
Listing 10.5: An application descriptor with one SSEARCH description to
be executed in the cloud
204
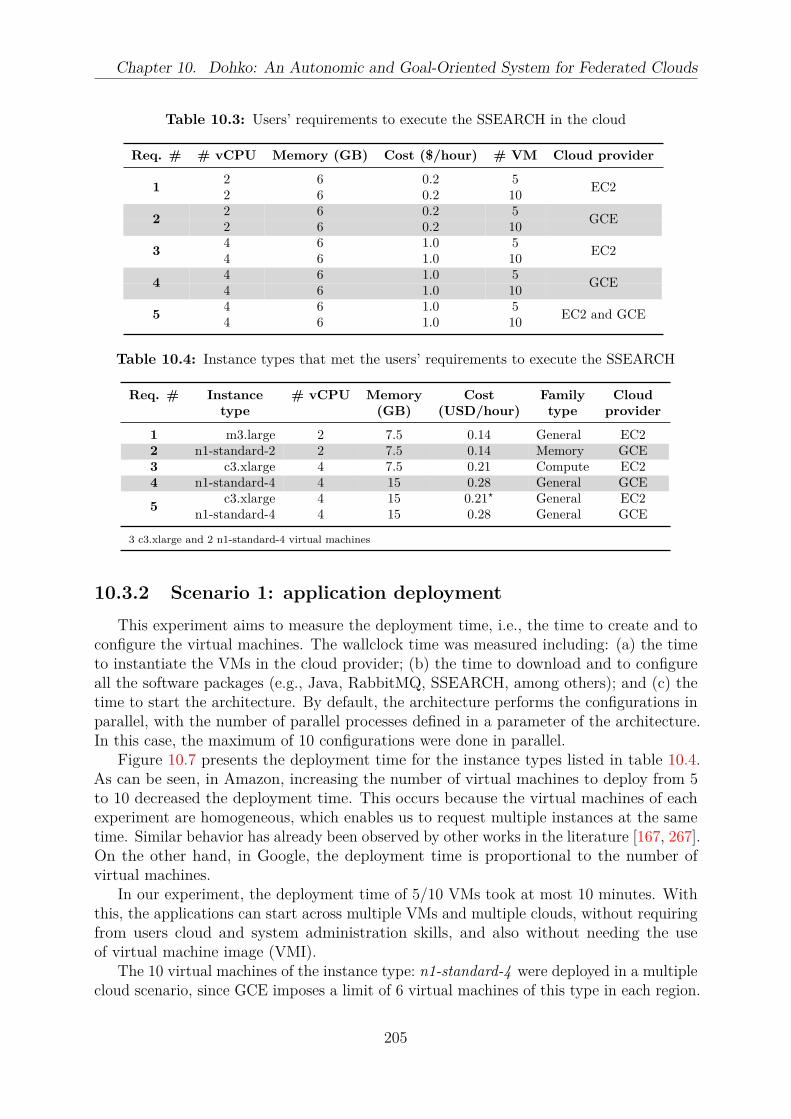
Chapter 10. Dohko: An Autonomic and Goal-Oriented System for Federated Clouds
Table 10.3: Users’ requirements to execute the SSEARCH in the cloud
Req. # # vCPU Memory (GB) Cost ($/hour) # VM Cloud provider
2 6 0.2 51
2 6 0.2 10EC2
2 6 0.2 52
2 6 0.2 10GCE
4 6 1.0 53
4 6 1.0 10EC2
4 6 1.0 54
4 6 1.0 10GCE
4 6 1.0 55
4 6 1.0 10EC2 and GCE
Table 10.4: Instance types that met the users’ requirements to execute the SSEARCH
Req. # Instance # vCPU Memory Cost Family Cloudtype (GB) (USD/hour) type provider
1 m3.large 2 7.5 0.14 General EC22 n1-standard-2 2 7.5 0.14 Memory GCE3 c3.xlarge 4 7.5 0.21 Compute EC24 n1-standard-4 4 15 0.28 General GCE
c3.xlarge 4 15 0.21⋆ General EC25
n1-standard-4 4 15 0.28 General GCE
3 c3.xlarge and 2 n1-standard-4 virtual machines
10.3.2 Scenario 1: application deployment
This experiment aims to measure the deployment time, i.e., the time to create and toconfigure the virtual machines. The wallclock time was measured including: (a) the timeto instantiate the VMs in the cloud provider; (b) the time to download and to configureall the software packages (e.g., Java, RabbitMQ, SSEARCH, among others); and (c) thetime to start the architecture. By default, the architecture performs the configurations inparallel, with the number of parallel processes defined in a parameter of the architecture.In this case, the maximum of 10 configurations were done in parallel.
Figure 10.7 presents the deployment time for the instance types listed in table 10.4.As can be seen, in Amazon, increasing the number of virtual machines to deploy from 5to 10 decreased the deployment time. This occurs because the virtual machines of eachexperiment are homogeneous, which enables us to request multiple instances at the sametime. Similar behavior has already been observed by other works in the literature [167, 267].On the other hand, in Google, the deployment time is proportional to the number ofvirtual machines.
In our experiment, the deployment time of 5/10 VMs took at most 10 minutes. Withthis, the applications can start across multiple VMs and multiple clouds, without requiringfrom users cloud and system administration skills, and also without needing the useof virtual machine image (VMI).
The 10 virtual machines of the instance type: n1-standard-4 were deployed in a multiplecloud scenario, since GCE imposes a limit of 6 virtual machines of this type in each region.
205

Chapter 10. Dohko: An Autonomic and Goal-Oriented System for Federated Clouds
In this case, the system allocated 5 VMs in the U.S. and 5 in Europe.
514
432468
549
502
441414
515
0
100
200
300
400
500
600
m3.large(EC2)
n1−standard−2(GCE)
c3.xlarge(EC2)
n1−standard−4(GCE)
Con
figu
rati
on t
ime
(sec
onds
)
5 instances
10 instances
Figure 10.7: Configuration time of the virtual machines on the clouds
10.3.3 Scenario 2: application execution
Figure 10.8 presents the wallclock execution time for the four standalone experi-ments (i.e., requirements 1 to 4 of table 10.3), and table 10.5 their total financial cost.We can see that the instances that belong to the same family type have almost thesame performance. The lower execution time (89 seconds) was achieved by the instancetype c3.xlarge (40 vCPU cores) with a cost of 2.10 USD. Considering that the applicationdoes not take a long time to finish neither it demands many computing resources, thisrepresents a high cost. If the users wait 33% more (43 seconds), they can pay 50% less (1.05USD).
In figure 10.9, we present the execution time for a multi-cloud scenario. In this case,for the requirement of 5 instances (i.e., requirement 5 of table 10.3), 3 virtual machineswere used from EC2 and 2 instances from GCE. If we compare figure 10.8 with figure 10.9,we can see that the execution time increased almost 34%. One reason for this differenceis probably the network throughput between the clouds of different providers, since wedo not observe such overhead in the scenario with ten n1-standard-4 virtual machinesdistributed across two GCE’s clouds.
Figure 10.10 presents the total time (i.e., deployment + execution time) for theexperiments. In this figure, we can observe the impact of deploying 10 virtual machineshas in the total execution time. In this case, the deploy time of 5 virtual machines wasbetter than the deploy time of 10 virtual machines.
10.3.4 Scenario 3: application deployment and execution with
failures
To evaluate the self-healing property of our architecture, we simulated two types offailures. In the first case, we stopped the application manager just after it had received the
206
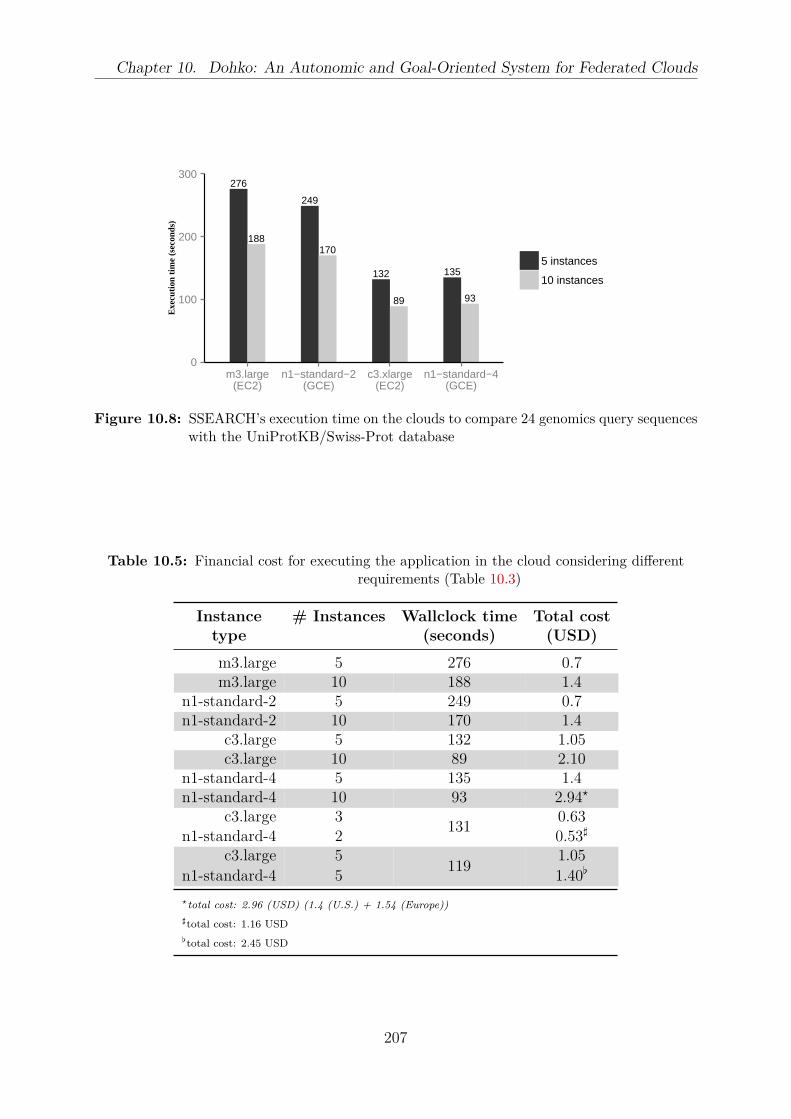
Chapter 10. Dohko: An Autonomic and Goal-Oriented System for Federated Clouds
276
188
249
170
132
89
135
93
0
100
200
300
m3.large(EC2)
n1−standard−2(GCE)
c3.xlarge(EC2)
n1−standard−4(GCE)
Exe
cuti
on t
ime
(sec
onds
)
5 instances
10 instances
Figure 10.8: SSEARCH’s execution time on the clouds to compare 24 genomics query sequenceswith the UniProtKB/Swiss-Prot database
Table 10.5: Financial cost for executing the application in the cloud considering differentrequirements (Table 10.3)
Instance # Instances Wallclock time Total costtype (seconds) (USD)
m3.large 5 276 0.7m3.large 10 188 1.4
n1-standard-2 5 249 0.7n1-standard-2 10 170 1.4
c3.large 5 132 1.05c3.large 10 89 2.10
n1-standard-4 5 135 1.4n1-standard-4 10 93 2.94⋆
c3.large 3 0.63n1-standard-4 2
1310.53♯
c3.large 5 1.05n1-standard-4 5
1191.40
⋆total cost: 2.96 (USD) (1.4 (U.S.) + 1.54 (Europe))
♯total cost: 1.16 USD
total cost: 2.45 USD
207

Chapter 10. Dohko: An Autonomic and Goal-Oriented System for Federated Clouds
131
119
0
50
100
150
c3.xlarge (EC2) andn1−standard−4 (GCE)
Exe
cuti
on t
ime
(sec
onds
)
5 instances
10 instances
Figure 10.9: Execution time of the SSEARCH application to compare 24 genomics querysequences with the UniProtKB/Swiss-Prot database in a multi-cloud scenario
519
442473
559
507
451419
525
0
100
200
300
400
500
600
m3.large(EC2)
n1−standard−2(GCE)
c3.xlarge(EC2)
n1−standard−4(GCE)
Con
figu
rati
on a
nd e
xecu
tion
tim
e (s
econ
ds)
5 instances
10 instances
Figure 10.10: Deployment and execution time of the experiments
208

Chapter 10. Dohko: An Autonomic and Goal-Oriented System for Federated Clouds
tasks to execute. In the second case, we executed a process that, at each minute, selectedand stopped a worker. These failures were evaluated in a multi-cloud scenario (10 virtualmachines – 5 c3.xlarge and 5 n1-standard-4 ). Figure 10.11 presents the execution time foreach failure scenario.
The failure of the application manager has a high impact in the total execution time,however, it is low than of the workers. This is mostly occurs because worker’s failures,demands a time from the application manager to detect it and to reassign the task of thefailed worker to another one. Moreover, since multiple workers failed, this highly impactedthe total execution time compared with both the failure-free scenario and the failure ofthe application manager. Moreover, when the application manager fails, the workers canstill continue the execution of their tasks.
119
572
240
Failure−free
Workers
Applicationmanager
0 100 200 300 400 500 600Execution time (seconds)
Figure 10.11: Execution time of the application on the clouds with three different type offailures
10.4 Related Work
Over the years, different cloud architectures have been proposed in the literature, withdifferent objectives. We discussed some of these proposals in section 3.5 and chapter 4.In table 10.6, we present a comparative view of important features of these architectures.The architecture is presented in the first column. The second column presents if thearchitecture implements self-configuration, which means that it can select and configurethe resources automatically. The third column presents if the system implements failurerecovery policy. The fourth and the fifth columns show if the architectures are context-aware and if they implement self-optimization. Context-aware in this case, means ifnodes are organized considering their location. The cloud model of the architecture ispresented in the sixth column. Finally, the last column presents if the system can work ina multi-cloud environment.
As can be seen, half of the works implement self-configuration properties. In this case,the developers specify their needs in a service manifest, and the architecture automaticallyselects a cloud provider and deploys the applications. Moreover, self-healing property isimplemented by some of the works. For example, Snooze [111] employs a hierarchicalresource management, and uses multicast to locate the different nodes (e.g., group managers,
209
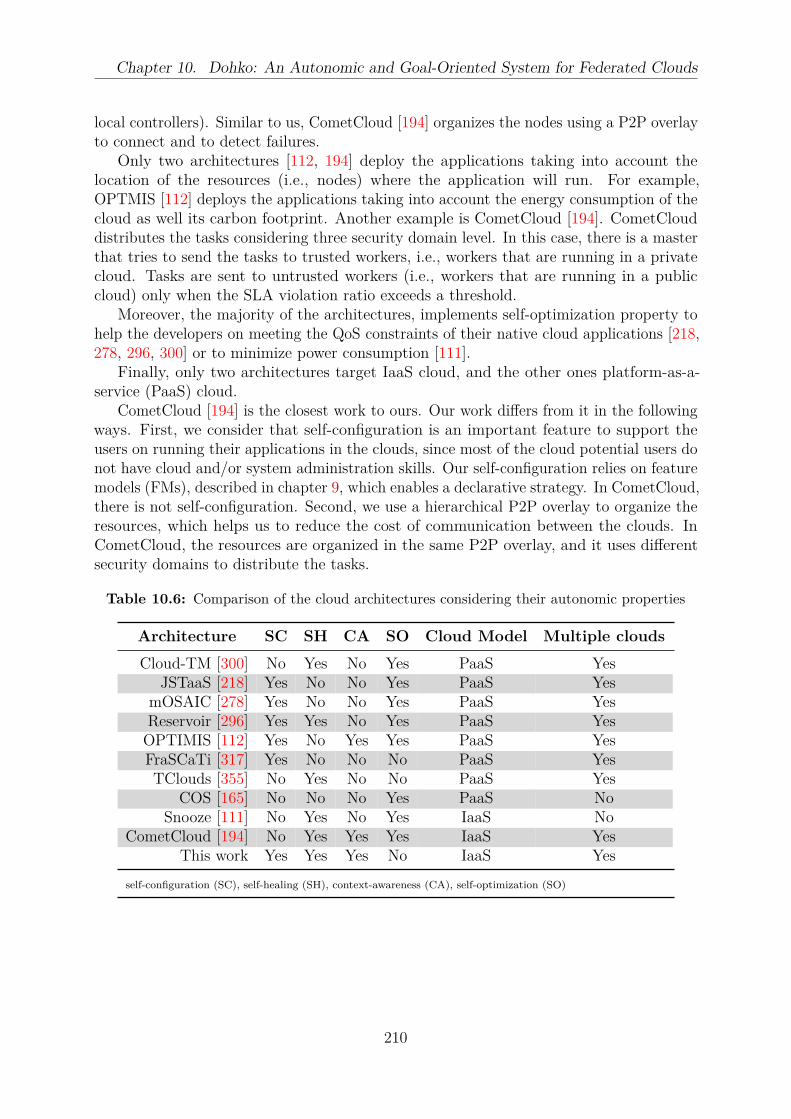
Chapter 10. Dohko: An Autonomic and Goal-Oriented System for Federated Clouds
local controllers). Similar to us, CometCloud [194] organizes the nodes using a P2P overlayto connect and to detect failures.
Only two architectures [112, 194] deploy the applications taking into account thelocation of the resources (i.e., nodes) where the application will run. For example,OPTMIS [112] deploys the applications taking into account the energy consumption of thecloud as well its carbon footprint. Another example is CometCloud [194]. CometClouddistributes the tasks considering three security domain level. In this case, there is a masterthat tries to send the tasks to trusted workers, i.e., workers that are running in a privatecloud. Tasks are sent to untrusted workers (i.e., workers that are running in a publiccloud) only when the SLA violation ratio exceeds a threshold.
Moreover, the majority of the architectures, implements self-optimization property tohelp the developers on meeting the QoS constraints of their native cloud applications [218,278, 296, 300] or to minimize power consumption [111].
Finally, only two architectures target IaaS cloud, and the other ones platform-as-a-service (PaaS) cloud.
CometCloud [194] is the closest work to ours. Our work differs from it in the followingways. First, we consider that self-configuration is an important feature to support theusers on running their applications in the clouds, since most of the cloud potential users donot have cloud and/or system administration skills. Our self-configuration relies on featuremodels (FMs), described in chapter 9, which enables a declarative strategy. In CometCloud,there is not self-configuration. Second, we use a hierarchical P2P overlay to organize theresources, which helps us to reduce the cost of communication between the clouds. InCometCloud, the resources are organized in the same P2P overlay, and it uses differentsecurity domains to distribute the tasks.
Table 10.6: Comparison of the cloud architectures considering their autonomic properties
Architecture SC SH CA SO Cloud Model Multiple clouds
Cloud-TM [300] No Yes No Yes PaaS YesJSTaaS [218] Yes No No Yes PaaS Yes
mOSAIC [278] Yes No No Yes PaaS YesReservoir [296] Yes Yes No Yes PaaS Yes
OPTIMIS [112] Yes No Yes Yes PaaS YesFraSCaTi [317] Yes No No No PaaS YesTClouds [355] No Yes No No PaaS Yes
COS [165] No No No Yes PaaS NoSnooze [111] No Yes No Yes IaaS No
CometCloud [194] No Yes Yes Yes IaaS YesThis work Yes Yes Yes No IaaS Yes
self-configuration (SC), self-healing (SH), context-awareness (CA), self-optimization (SO)
210

Chapter 10. Dohko: An Autonomic and Goal-Oriented System for Federated Clouds
10.5 Summary
In this chapter, we presented and evaluated an IaaS cloud architecture. Our architectureenables a declarative approach, where the users describe their applications and submit itto the system. Then, the system automatically creates and configures the virtual machinesin one or multiple clouds, taking into account the users’ constraints; and executes theapplications. In addition, the architecture implements self-healing strategies to supportfailures of the resources.
In our experiments, we could execute the SSEARCH to compare up to 24 querysequences with the database UniProtKB/Swiss-Prot (September 2014) in two differentcloud providers and five different scenarios.
211

Chapter 11
Conclusion
Contents
11.1 Overview . . . . . . . . . . . . . . . . . . . . . . . . . . . . . . . 212
11.2 Summary of the Contributions . . . . . . . . . . . . . . . . . . 213
11.3 Threat to Validity . . . . . . . . . . . . . . . . . . . . . . . . . . 217
11.4 Perspectives . . . . . . . . . . . . . . . . . . . . . . . . . . . . . . 218
11.5 Summary . . . . . . . . . . . . . . . . . . . . . . . . . . . . . . . 219
11.1 Overview
In the 1960s, time-sharing pushed up the development of computer networks [152].Nowadays, cloud computing is being seen as the new time-sharing [71] due to characteristicssuch as on-demand, pay-per-usage, and elasticity.
In addition, it is pushing down the cost of the users pay for having their own large-scalecomputing infrastructures, and removing the need for up-front investments to establishthese computing infrastructures. In other words, cloud computing has enabled a utilitycomputing model, offering computing, storage, and software as a service.
The utility model yields the notion of resource democratization and provides thecapability for a pool of resources accessible to anyone on the Internet in nearly real-time.This notion is the main difference between cloud computing and other paradigms (e.g.,grid computing systems) that have tried to deliver computing resources over the Internetbefore cloud [388]. Besides that, clouds offer services without knowing who the users areand unaware of the technology they use to access the services. Finally, cloud computinghas also gained popularity since it can help data centers to reduce monetary costs andcarbon footprint.
However, considering the cloud users and the cloud data center viewpoints, we identifiedfour major concerns related to the cloud: (a) the high amount of energy consumed bycloud data centers; (b) the difficulty to select an appropriate cloud to execute applications
212

Chapter 11. Conclusion
at reduced cost; (c) the difficulty to configure cloud resources in an appropriate way; and(d) the difficulty to model different clouds in a uniform way.
In this context, this thesis has focused on federated clouds. Particularly, we haveset out one general goal:“ to investigate the use of federated clouds to achieve differentobjectives taking into account multiple users’ profiles, i.e., providers, developers, andboth experienced (e.g., system administrators) and inexperienced cloud users”. This maingoal was broken down into four objectives delineated in chapter 1. In order to achievethese objectives, we, firstly, presented the state-of-the-art in large-scale distributed sys-tems (Chapter 2), which included cluster, grid, P2P, and cloud. The descriptions of thesesystems were followed by some important and related concepts such as virtualization (Sec-tion 3.1.1), MapReduce (Section 3.1.3), autonomic computing (Chapter 4), and greencomputing (Chapter 5). Furthermore, a review of IaaS cloud architectures (Section 3.5)and autonomic computing systems (Section 4.4) were also presented.
We observed a convergence between grid, P2P, and cloud computing systems. On theone hand, many grid environments have employed virtualization techniques to providecustomized execution environments and to increase resource control [4, 310, 368]. More-over, some grid systems have relied on P2P techniques to deal with large-scale resourcesharing [123]. On the other hand, clouds have started to make use of grid concepts suchas resource federation [56] to increase cloud’s capacity on-demand, to increase resourceavailability, and to help the users (i.e., cloud providers and cloud users) on decreasingfinancial costs. As a result, the complexity of managing, using, and developing for theseenvironments increased. In such context, autonomic computing has taken place. Auto-nomic computing systems can autonomously optimize themselves according to the users’objectives [162], adapting to changes in the environment.
In the domain of large-scale distributed systems, autonomic computing systems have beused to decrease power consumption [239, 298], to meet performance guarantees [105, 272],and to deal with failures [111]. Nevertheless, the majority of the autonomic systemsavailable in the literature has addressed only one autonomic property of the eight prop-erties (Section 4.2) proposed by Horn [162]. Furthermore, it has relied on a centralizedarchitecture, which limits the systems’ scalability.
After the state-of-the-art, we presented our contributions, which are summarized inthe next section.
11.2 Summary of the Contributions
This work has succeeded in achieving the objectives pointed out in the Introductionand in addressing the issues already presented all over this document. In this section, wedescribe the contributions of this doctoral thesis.
A power-aware server consolidation for federated clouds
In chapter 6, we presented the first contribution of this thesis: a server consolidationstrategy to reduce power consumption on cloud federations, which tackles concern (a)cited in section 11.1. Our server consolidation strategy aims to reduce power consumptionon cloud federations while trying to meet QoS requirements. We assumed that clouds have
213

Chapter 11. Conclusion
a limited power consumption defined by a third party agent. In this case, we addressedapplications’ workloads, considering the costs to turn servers on/off and to migrate the vir-tual machines in the same data center and between different data centers [215]. Simulationresults showed that our strategy could reduce up to 46% of the power consumption, witha slowdown of 22% in the execution time. Similar to other works [319, 375, 387], theexperiments were realized through the CloudSim [58] simulator with two clouds and 400simultaneous virtual machines. Altogether, the results demonstrated that cloud federationcan provide an interesting solution to deal with power consumption, by using the computinginfrastructure of other clouds when a cloud runs out of resources or when other clouds havepower-efficient resources. Even though we achieved very good results with our strategy, wenoticed that other variables should also be considered such as the workload type, the datacenter characteristics (i.e., location, power source), and the network bandwidth as thesevariables may impact the whole power consumption of a data center. In addition, since theCPU no longer dominates the nodes’ power consumption [249], the power consumption ofother components (e.g., memory, disks) must be taken into account. Moreover, resourceheterogeneity should also be considered, as data centers usually comprise heterogeneousresources that can have different power consumption and curves. This requires energy andperformance-aware load distribution strategies. We leave these extensions for future work.
An architecture to execute native cloud applications on a vertical
cloud federation
In chapter 7, we proposed and evaluated an architecture to execute a native cloudapplication on a vertical cloud federation (Section 3.2.3.2) at zero-cost [214], which tacklesconcern (b) presented in section 11.1. The architecture used a hierarchical and distributedmanagement strategy to allow the developers to execute their applications using servicesoffered by two different types of cloud providers, i.e., PaaS and IaaS clouds (Section 3.2.1).In our architecture, there is a cloud coordinator, several cloud masters, and slaves. The userssubmit their applications to the cloud coordinator, which sends them to the cloud masters.Then, the cloud masters distribute the tasks to the slaves following a publish/subscribemodel. The application was a MapReduce version of a biological sequence comparisonapplication, which was also implemented in this work. Experimental results showedthat (i) using five public clouds, the proposed architecture could outperform up to 22.55%the execution time of the best stand-alone cloud execution; (ii) the execution time wasreduced from 5 hours and 44 minutes (SSEARCH sequential tool) to 13 minutes (ourcloud execution). This result is comparable to the ones achieved with biological sequencecomparison executions in multi-core clusters and Cell/BEs (Table 7.3 on page 127); and(iii) the federation could enable the execution of huge cloud-aware application at noexpense and without being tied to any cloud provider. In this experiment, we executedbiological sequence comparisons. Although we could execute a huge application in avertical cloud federation, our architecture had some issues such as: (i) the usage of acentralized coordinator to distribute the tasks, and (ii) the lack of fault-tolerance strategiesfor both cloud coordinator and cloud masters. The first issue limited the scalability ofthe architecture and its usage in a dynamic environment. In addition, the failure of thecoordinator required the re-execution of the whole application, as the architecture did
214

Chapter 11. Conclusion
not provide a way to discover the tasks distributed to each cloud master. In this case,the masters continued the execution of their tasks, but the results are inaccessible for theusers.
Besides that, even though MapReduce applications are computing infrastructureagnostic, it became clear for us that designing and developing applications for differentclouds represent a difficult task even for experienced cloud developers, due to the variousconstraints and resource types offered by the clouds, i.e., clouds’ heterogeneity. Hence, atthis point, we decided to investigate: (a) the feasibility of the use of a cloud environment byordinary users to execute cloud-unaware applications, without needing to re-engineering theapplications; and (b) models that may help the users on dealing with cloud heterogeneity,offering a level of abstraction that can be understood by different user profiles and thatcan also promote reuse.
Excalibur
In chapter 8, we proposed and evaluated a cloud architecture that aims to: (i) helpunskilled cloud users on executing their applications on the cloud; (ii) scale the applicationsrequiring minimal users’ intervention; and (iii) try to meet the users objectives such asperformance and reduced financial cost [217]. To achieve such goals and also to tackle theconcern (c) cited in section 11.1, our architecture sets up the whole cloud environment,and it tries to speed up the execution of the applications by implementing an auto-scalingstrategy. Our auto-scaling targets applications that comprise independent tasks, althoughthe applications were developed to execute sequentially. The independent tasks are identi-fied based on high-level descriptions provided by the user. We evaluated the architectureexecuting a genomics workflow on Amazon EC2, considering two scenarios. In the firstscenario, the users selected the resources, whereas in the second one, our architecture, basedon historical data, automatically selected the resources. The experiments showed that ourauto-scaling strategy could outperform the execution time of the resource chosen by theusers,dynamically scaling the applications up to 11 virtual machines (VMs). Moreover,it also helped on reducing the monetary cost in 84%. However, this architecture has thefollowing issues: (i) the users had to select the resources in the first execution of theapplications; (ii) it assumed an environment where the constraints associated to a resourcewere the same between all the clouds belonging to a cloud provider. Nevertheless, theclouds of a provider are commonly heterogeneous.
A software product line engineering method for resource selection
and configuration on federated clouds
Motivated by the difficulties which we have observed when developing for multipleclouds and by the complexity tasks required to configure a real cloud environment, asexplained in our two previous contributions, we decided to investigate models that wouldtackle these problems. Particularly, we were interested in models that would (i) supportthe description of clouds’ services independent of cloud providers; (ii) enable automaticresources provisioning on multiple clouds, taking into account temporal and functionaldependencies between the resources, thus leaving the environments in a consistent state;
215

Chapter 11. Conclusion
(iii) help on achieving the goals (i.e., functional and non-functional requirements) of differentuser profiles, i.e., cloud experts, system administrators, developers, and novice users; and(iv) provide a level of abstraction suitable for these different kinds of users. To the bestof our knowledge, the literature lacked such models. In order to tackle these problems,in chapter 9, we used a software product line (SPL) engineering method. Using SPL, wedefined a feature-based variability model for the cloud configurations. Using this model,we were able to define an architecture and to derive appropriate products. By employingan SPL engineering method, we could capture the knowledge of creating and configuringcloud computing environments in the form of reusable assets. Moreover, non-technicalusers understand feature models, as they refer to domain concepts. In the context of thisthesis, a valid product is a cloud computing environment (i.e., virtual machine (VM) andapplications) that meets the users’ requirements, where the requirements can be eitherbased on high or low-level descriptions.
While high-level descriptions include the number of CPU cores, the operating system,the minimal amount of RAM memory, and the maximum financial cost per hour, low-level descriptions include the virtualization type, the sustainable performance, the disktechnology, among others. Besides that, a cloud computing environment must also matchcloud’s configuration constraints and applications dependencies. From the users’ viewpoint,using an SPL engineering method led to customizable cloud environments at lower financialcosts. In addition, as various assets were reused, it increased reliability and correctness [92].Thus, in particular, our contributions in this part are the following: (i) the use of extendedfeature model (EFM) (Section 9.4) with attributes to describe IaaS cloud environments.The feature model (FM) handles the commonalities and variabilities at the IaaS layer,enabling the description of the whole computing environment (i.e., hardware and software)independent of cloud provider and without requiring the usage of virtual machine image;(ii) a declarative and automated strategy that allows resource selection and configurationon a multi-cloud scenario; (iii) a domain configuration knowledge mapping the featuremodels into reusable assets; (iv) the automated deployment of the computing environmenton the clouds.
We also developed a prototype to evaluate our method considering two differentcloud providers. In this prototype, we used Choco [178], an off-the-shelf constraintsatisfaction problem (CSP) solver, to implement our feature-based model and to selectthe configurations that meet the users’ objectives. Experimental results showed thatusing the proposed method the users could get an optimal configuration with regard totheir objectives without needing to know the constraints and variabilities of each cloud.Moreover, our model enabled application deployment and reconfiguration at runtime in afederated cloud scenario, without requiring the usage of virtual machine image (VMI). Theproposed SPL engineering method was used to implement an autonomic system, whichtackles the concerns (c) and (d) pointed out in section 11.1.
Dohko
In chapter 10, we proposed and evaluated our last contribution: an autonomic andgoal-oriented system for federated clouds. Our autonomic system aims to tackle the issuesidentified in our second contribution (Chapter 7) and to enable a declarative strategy toexecute the users’ applications on multiple clouds, following the SPL engineering method
216

Chapter 11. Conclusion
described in the previous section and in chapter 9. Our system implements the followingautonomic properties: self-configuration, self-healing, and context-awareness. Moreover,it relies on a hierarchical P2P overlay [216] to deal with failures and to reduce inter-cloud communication. By employing a declarative strategy, the system could execute abiological sequence comparison application in a single and in a federated cloud scenario,requiring minimal users’ intervention to select, to deploy, and to configure the whole cloudenvironment. In particular, our system tackled the lack of middleware prototypes that cansupport different scenarios when using services from multiple IaaS clouds. Moreover, it metthe various functional requirements identified for multiple cloud-unaware systems [277]such as: (i) it provides a way to describe functional and non-functional requirementsthrough the usage of a product line engineering (PLE) method (Chapter 9); (ii) it canaggregate services from different clouds; (iii) it provides a homogeneous interface to accessservices of multiple clouds; (iv) it allows the service selection of the clouds; (v) it can deployits components on multiple clouds; (vi) it provides automatic procedures for deployments;(vii) it utilizes an overlay network to connect and to organize the resources; (viii) it doesnot impose constraint for the connected clouds.
One issue of our system is the lack of a self-optimization strategy, since it does not focuson task scheduling. We leave this extension as our future work. The software prototype isavailable at dohko.io.
11.3 Threat to Validity
There are some concerns related to the validity of our contributions described in thesecond part of this doctoral thesis. First, the systems and feature models illustrated in thiswork were built based on our experience in developing, deploying, and configuring IaaScloud services, as well as in administrating computing environments. Seconds, thesemodels were limited to the features released by the cloud providers. Third, since ourmethod relied on benchmarks to gather the qualitative attributed of the resources, smallvariations in their result values might occur mostly for two reasons: (i) we cannot controlthe allocation of the physical resources to the virtual ones and (ii) clouds’ workloadmay change over time, as well as the cloud providers’ objectives. Fourth, due to theevolution of cloud computing, some resources, clouds or even providers may appearand/or disappear. Thus, the experiments and concrete feature models presented inthis thesis might not be valid anymore over the long term. However, this does notinvalidate our abstract feature model (Figure 9.6 on page 163), it is independent ofcloud provider. Moreover, our architecture (Figures 10.1 and 10.5) is not invalidatedtoo. Finally, although the examples deal with public clouds such as EC2, GCE, andHeroku, our contributions are not limited to these clouds, as the cloud platforms followthe same principles employed by these cloud providers. Examples of cloud platformsinclude OpenStack (openstack.org), OpenNebula [248], CloudStack (cloudstack.apache.org),Eucalyptus [263], and Nimbus [186]
217
Chapter 11. Conclusion
11.4 Perspectives
In this section, we present some future research directions for this work. They canbe categorized as follows: (a) energy management models for multiple clouds; (b) cloudcomputing management and opportunistic computing; (c) supporting other autonomicproperties; and (d) improved mechanisms to support the developers on writing self-adaptiveapplications.
Energy management models for multiple clouds: it should be interesting to considera dynamic multi-cloud scenario, where the objectives and incentives of the providers changeover time. In this case, we intend to investigate strategies based on game theory to modelthe different interactions among cloud entities (e.g., users, providers), taking into accountselfish behaviors and conflicts. Moreover, we want to extend our power-aware strategy totake into consideration other variables as the type of power source, data center location,and carbon neutrality. For example, carbon neutrality can be achieved by purchasingcarbon credits from the providers on the federation, distributing the workload acrossthe clouds with both low electricity cost and carbon footprint, and/or using workloadconsolidation to reduce the number of underutilized resources.
Cloud computing management and opportunistic computing: we also intend tocombine the computational power of mobile devices with the cloud in such a way thatapplications autonomously decide which code can be performed locally and which oneshould be offloaded to the cloud. This can be used to reduce financial cost or to reducepower consumption of both portable devices and data center, as well as to maximize theusage of mobile devices. A difficulty may be the coordination and distribution of the workfor the devices. In this case, a P2P coordination model can be employed together withthe usage of a product line engineering method, as the one described in the chapter 9, todeal with functional and non-functional dependencies. Moreover, distributed resourcesmight be aggregated to create micro-clouds1 in order to provide enough resource to anapplication.
Supporting other autonomic properties: we plan to implement self-optimization andto extend our context-awareness implementation to consider other reconfiguration scenariosat runtime, according to the characteristics of the applications and the appearance of newclouds or resources. In addition, we also intend to investigate the implementation of taskscheduling strategies such as work stealing [177, 303] in cloud federation environments.
Improved mechanisms to support the developers on writing self-adaptive ap-plications: although software product line helps on improving maintainability of anapplication, there is still a needing for tools and frameworks to support the developmentof self-adaptive applications for large-scale environments. In this case, domain-specificlanguages might be developed. Today, we have Class feature reference (Clafer) [25] thatallows the domain engineers to validate the domain models and to generate the represen-tation of the models to be reasoned by some solvers such as Alloy [169] and Choco [178].
1A micro-cloud represents the usage of commodity computing infrastructures to aggregate computationalcapacity at a low financial cost. In this scenario, the clouds are similar to a peer on a P2P system.
218
Chapter 11. Conclusion
Thus, similar strategy might be created to validate the development of product lines, andto support autonomic applications’ decisions at runtime.
11.5 Summary
Cloud represents a computing model for providing high performance computing asutility, promoting the cooperation among different organizations and also to push downthe costs. We expect that studies, such as the ones presented in this thesis, contributefor the development of cloud’s systems, i.e., to the development of the metacomputer,approximating to the utility computing concept envisioned by McCarthy [132], Smarr andCatlett [326], and Dertouzos [99].
219

Bibliography
[1] Moustafa AbdelBaky, Manish Parashar, Hyunjoo Kim, Kirk E. Jordan, VipinSachdeva, James Sexton, Hani Jamjoom, Zon-Yin Shae, Gergina Pencheva, RezaTavakoli, and Mary F. Wheeler. Enabling high-performance computing as a service.Computer, 45(10):72–80, 2012. (Cited on pages 129 and 141)
[2] Karl Aberer. P-Grid: A self-organizing access structure for P2P information systems.In 9th International Conference on Cooperative Information Systems, pages 179–194,2001. (Cited on page 25)
[3] Ajith Abraham and Lakhmi Jain. Evolutionary multiobjective optimization. In AjithAbraham, Lakhmi Jain, and Robert Goldberg, editors, Evolutionary MultiobjectiveOptimization, pages 1–6. Springer, 2005. (Cited on page 152)
[4] Sumalatha Adabala, Vineet Chadha, Puneet Chawla, Renato Figueiredo, José Fortes,Ivan Krsul, Andrea Matsunaga, Mauricio Tsugawa, Jian Zhang, Ming Zhao, LipingZhu, and Xiaomin Zhu. From virtualized resources to virtual computing grids: Thein-vigo system. Future Generation Computer Systems, 21(6):896–909, 2005. (Citedon page 213)
[5] Keith Adams and Ole Agesen. A comparison of software and hardware techniquesfor x86 virtualization. In 12th International Conference on Architectural Supportfor Programming Languages and Operating Systems, pages 2–13, 2006. (Cited onpage 39)
[6] G. Agosta, M. Bessi, E. Capra, and C. Francalanci. Dynamic memoization for energyefficiency in financial applications. In International Green Computing Conferenceand Workshops, pages 1–8, 2011. (Cited on pages 91 and 109)
[7] A.M. Aji and Wu chun Feng. Optimizing performance, cost, and sensitivity in pairwisesequence search on a cluster of PlayStations. In IEEE International Conference onBioInformatics and BioEngineering, pages 1–6, 2008. (Cited on pages 115 and 127)
[8] M. Albano, L. Ricci, and L. Genovali. Hierarchical P2P overlays for DVE: Anadditively weighted Voronoi based approach. In International Conference on UltraModern Telecommunications Workshops, pages 1–8, 2009. (Cited on page 27)
[9] André Almeida, Everton Cavalcante, Thais Batista, Nélio Cacho, Frederico Lopes,Flavia Delicato, and Paulo Pires. Dynamic adaptation of cloud computing applica-tions. In 25th International. Conference on Software Engineering and KnowledgeEngineering, pages 67–72, 2013. (Cited on pages 179, 184, and 187)
220
Bibliography
[10] Amazon. Summary of the Amazon EC2 and Amazon RDS service disruption in theUS east region. aws.amazon.com/message/65648, 2011. Last accessed in July 2014.(Cited on page 48)
[11] Amazon. Summary of the AWS service event in the US east region. aws.amazon.
com/message/67457, 2012. Last accessed in July 2014. (Cited on page 48)
[12] David P. Anderson, Jeff Cobb, Eric Korpela, Matt Lebofsky, and Dan Werthimer.SETI@Home: An experiment in public-resource computing. Communications of theACM, 45(11):56–61, 2002. (Cited on pages 15 and 34)
[13] Sergio Andreozzi, Natascia De Bortoli, Sergio Fantinel, Antonia Ghiselli, Gian LucaRubini, Gennaro Tortone, and Maria Cristina Vistoli. GridICE: A monitoring servicefor grid systems. Future Generation Computer Systems, 21(4):559–571, 2005. (Citedon page 53)
[14] Stephanos Androutsellis-Theotokis and Diomidis Spinellis. A survey of peer-to-peercontent distribution technologies. ACM Computing Surveys, 36(4):335–371, 2004.(Cited on pages 15, 21, 23, 24, 25, 28, and 34)
[15] Samuel V Angiuoli, Malcolm Matalka, Aaron Gussman, Kevin Galens, MaheshVangala, David R Riley, Cesar Arze, James R White, and W Florian Fricke. CloVR:A virtual machine for automated and portable sequence analysis from the desktopusing cloud computing. BMC Bioinformatics, 12(1):1–15, 2011. (Cited on pages 132,141, and 143)
[16] Tomonori Aoyama and Hiroshi Sakai. Inter-cloud computing. Business & InformationSystems Engineering, 3(3):173–177, 2011. (Cited on pages 52 and 53)
[17] Knarig Arabshian and Henning Schulzrinne. Distributed context-aware agent ar-chitecture for global service discovery. In 2nd International Workshop on SemanticWeb Technology For Ubiquitous and Mobile Applications, 2006. (Cited on page 199)
[18] Danilo Ardagna, Elisabetta Di Nitto, Giuliano Casale, Dana Petcu, Parastoo Mo-hagheghi, Sébastien Mosser, Peter Matthews, Anke Gericke, Cyril Ballagny, FrancescoD’Andria, Cosmin-Septimiu Nechifor, and Craig Sheridan. MODAClouds: A model-driven approach for the design and execution of applications on multiple clouds. InICSE Workshop on Modeling in Software Engineering, pages 50–56, 2012. (Cited onpage 60)
[19] Danilo Ardagna, Barbara Panicucci, Marco Trubian, and Li Zhang. Energy-aware au-tonomic resource allocation in multitier virtualized environments. IEEE Transactionson Services Computing, 5(1):2–19, 2012. (Cited on pages 86, 88, and 113)
[20] Michael Armbrust, Armando Fox, Rean Griffith, Anthony D. Joseph, Randy H.Katz, Andrew Konwinski, Gunho Lee, David A. Patterson, Ariel Rabkin, IonStoica, and Matei Zaharia. Above the clouds: A Berkeley view of cloud computing.Technical Report UCB/EECS-2009-28, EECS Department, University of California,Berkeley, February 2009. URL www.eecs.berkeley.edu/Pubs/TechRpts/2009/
221
Bibliography
EECS-2009-28.html. Last accessed in January 2014. (Cited on pages 16, 31, 35,and 54)
[21] James Aspnes and Gauri Shah. Skip Graphs. In 14th Annual ACM-SIAM Symposiumon Discrete Algorithms, pages 384–393, 2003. (Cited on page 25)
[22] Arutyun I. Avetisyan, Roy Campbell, Indranil Gupta, Michael T. Heath, Steven Y.Ko, Gregory R. Ganger, Michael A. Kozuch, David O’Hallaron, Marcel Kunze,Thomas T. Kwan, Kevin Lai, Martha Lyons, Dejan S. Milojicic, Hing Yan Lee,Yeng Chai Soh, Ng Kwang Ming, Jing-Yuan Luke, and Han Namgoong. Open Cirrus:A global cloud computing testbed. Computer, 43(4):35–43, 2010. (Cited on pages 69,70, and 74)
[23] Dan Azevedo and Andy Rawson. Measuring data center productivity. Technicalreport, AMD Metrics and Measurements Work Group, 2008. URL bit.ly/1ynfWzp.Last accessed in April 2014. (Cited on page 99)
[24] Lee Badger, Tim Grance, Robert Patt-Corner, and Jeff Voas. Cloud computingsynopsis and recommendations. Technical Report NIST Special Publication 800-146,National Institute of Standards and Technology, May 2012. URL csrc.nist.gov/
publications/nistpubs/800-146/sp800-146.pdf. Last accessed in July 2014.(Cited on pages 30 and 47)
[25] Kacper Bak, Krzysztof Czarnecki, and Andrzej Wasowski. Feature and meta-modelsin Clafer: Mixed, specialized, and coupled. In 3rd International Conference onSoftware Language Engineering, pages 102–122, 2011. (Cited on page 218)
[26] H.M.N. Dilum Bandara and Anura P. Jayasumana. Collaborative applicationsover peer-to-peer systems-challenges and solutions. Peer-to-Peer Networking andApplications, 6(3):257–276, 2013. (Cited on page 28)
[27] D.F. Bantz, C. Bisdikian, D. Challener, J.P. Karidis, S. Mastrianni, A. Mohindra,D.G. Shea, and M. Vanover. Autonomic personal computing. IBM Systems Journal,42(1):165–176, 2003. (Cited on page 77)
[28] Paul Barham, Boris Dragovic, Keir Fraser, Steven Hand, Tim Harris, Alex Ho, RolfNeugebauer, Ian Pratt, and Andrew Warfield. Xen and the art of virtualization. In19th ACM Symposium on Operating Systems Principles, pages 164–177, 2003. (Citedon page 38)
[29] Luiz André Barroso. The price of performance. ACM Queue, 3(7):48–53, 2005.(Cited on pages 90 and 99)
[30] Luiz André Barroso and Urs Hölzle. The case for energy-proportional computing.IEEE Computer, 40:33–37, 2007. (Cited on page 89)
[31] Luiz André Barroso, Jimmy Clidaras, and Urs Hölzle. The Datacenter as a Computer:An Introduction to the Design of Warehouse-Scale Machines. Synthesis Lectures onComputer Architecture. Morgan and Claypool Publishers, 2nd edition, 2013. (Citedon pages 2, 3, and 101)
222

Bibliography
[32] Don Batory. Feature models, grammars, and propositional formulas. In 9th Interna-tional Conference on Software Product Lines, pages 7–20, 2005. (Cited on pages 154and 155)
[33] J.-P. Baud, J. Casey, S. Lemaitre, and C. Nicholson. Performance analysis of a filecatalog for the LHC computing grid. In 14th IEEE International Symposium HighPerformance Distributed Computing, pages 91–99, 2005. (Cited on page 11)
[34] Christian L. Belady. In the data center, power and cooling costs more than the itequipment it supports. Electronics Cooling, 13(1), 2007. (Cited on page 99)
[35] Anton Beloglazov and Rajkumar Buyya. Optimal online deterministic algorithmsand adaptive heuristics for energy and performance efficient dynamic consolidationof virtual machines in cloud data centers. Concurrency and Computation: Practiceand Experience, 24(13), 2012. (Cited on page 112)
[36] Anton Beloglazov, Rajkumar Buyya, Young Choon Lee, and Albert Zomaya. Ataxonomy and survey of energy-efficient data centers and cloud computing systems.In Advances in Computers, volume 82, pages 47–111. Elsevier, 2011. (Cited onpages 41, 90, 91, 101, and 102)
[37] David Benavides, Sergio Segura, and Antonio Ruiz-Cortés. Automated Analysis ofFeature Models 20 Years Later: A Literature Review. Information Systems, 35(6):615–636, 2010. (Cited on page 155)
[38] Andreas Berl, Erol Gelenbe, Marco Di Girolamo, Giovanni Giuliani, HermannDe Meer, Minh Quan Dang, and Kostas Pentikousis. Energy-efficient cloud computing.Computer Journal, 53:1045–1051, 2010. (Cited on page 90)
[39] Tim Berners-Lee. Information management: A proposal. www.w3.org/History/
1989/proposal.html, 1989. Last accessed in January 2014. (Cited on page 13)
[40] Tim Berners-Lee. WWW: past, present, and future. Computer, 29(10):69–77, 1996.(Cited on page 13)
[41] David Bernstein, Erik Ludvigson, Krishna Sankar, Steve Diamond, and MoniqueMorrow. Blueprint for the intercloud - protocols and formats for cloud computinginteroperability. In 4th International Conference on Internet and Web Applicationsand Services, pages 328–336, 2009. (Cited on page 51)
[42] Alysson Bessani, Rüdiger Kapitza, Dana Petcu, Paolo Romano, Spyridon V. Gogou-vitis, Dimosthenis Kyriazis, and Roberto G. Cascella. A look to the old-world*sky:Eu-funded dependability cloud computing research. ACM SIGOPS Operating Sys-tems Review, 46(2):43–56, 2012. (Cited on page 62)
[43] Cor-Paul Bezemer and Andy Zaidman. Multi-tenant saas applications: Maintenancedream or nightmare? In International Workshop on Principles of Software Evolution,pages 88–92, 2010. (Cited on page 31)
[44] Ricardo Bianchini and Ram Rajamony. Power and energy management for serversystems. IEEE Computer, 37(11):68–74, 2004. (Cited on page 89)
223

Bibliography
[45] Philip Bianco, Grace A. Lewis, and Paulo Merson. Service level agreements inservice-oriented architecture environments. Technical Report CMU/SEI-2008-TN-021, Software Engineering Institute, September 2008. URL sei.cmu.edu/reports/
08tn021.pdf. Last accessed in February 2014. (Cited on page 41)
[46] Ken Birman, Gregory Chockler, and Robbert van Renesse. Toward a cloud computingresearch agenda. ACM SIGACT News, 40(2):68–80, 2009. (Cited on page 32)
[47] Andrew D. Birrell and Bruce Jay Nelson. Implementing remote procedure calls.In 9th ACM Symposium on Operating Systems Principles, page 3, 1983. (Cited onpage 13)
[48] Günter Böckle, Klaus Pohl, and Frank van der Linden. A framework for softwareproduct line engineering. In Software Product Line Engineering, pages 19–38.Springer, 2005. (Cited on page 161)
[49] Robert B. Bohn, John Messina, Fang Liu, Jin Tong, and Jian Mao. NIST cloudcomputing reference architecture. In IEEE World Congress on Services, pages594–596, 2011. (Cited on page 51)
[50] Pat Bohrer, Elmootazbellah N. Elnozahy, Tom Keller, Michael Kistler, CharlesLefurgy, Chandler McDowell, and Ram Rajamony. The case for power managementin web servers, pages 261–289. Kluwer Academic Publishers, 2002. (Cited on page 89)
[51] David Booth, Hugo Haas, Francis McCabe, Eric Newcomer, Michael Champion,Chris Ferris, and David Orchard. Web Services Architecture. www.w3.org/TR/2004/
NOTE-ws-arch-20040211, 2004. Last accessed in January 2014. (Cited on page 15)
[52] Damien Borgetto, Michael Maurer, Georges Da-Costa, Jean-Marc Pierson, andIvona Brandic. Energy-efficient and SLA-aware management of IaaS clouds. In 3rdInternational Conference on Future Energy Systems: Where Energy, Computing andCommunication Meet, pages 25:1–25:10, 2012. (Cited on page 41)
[53] David Brooks, Vivek Tiwari, and Margaret Martonosi. Wattch: a framework forarchitectural-level power analysis and optimizations. In International Symposium onComputer architecture, pages 83–94, 2000. (Cited on page 91)
[54] Edouard Bugnion, Scott Devine, Mendel Rosenblum, Jeremy Sugerman, and Ed-ward Y. Wang. Bringing virtualization to the x86 architecture with the originalVMware workstation. ACM Transactions on Computer Systems, 30(4):12:1–12:51,2012. (Cited on page 15)
[55] Rajkumar Buyya. High Performance Cluster Computing: Architectures and Systems.Prentice Hall PTR, 1999. (Cited on page 17)
[56] Rajkumar Buyya, Chee Shin Yeo, Srikumar Venugopal, James Broberg, and IvonaBrandic. Cloud computing and emerging it platforms: Vision, hype, and reality fordelivering computing as the 5th utility. Future Generation Computer Systems, 25:599–616, 2009. (Cited on pages 29, 48, 90, and 213)
224

Bibliography
[57] byte-unixbench. A Unix benchmark suite. code.google.com/p/byte-unixbench,2014. Last accessed in July 2014. (Cited on page 168)
[58] Rodrigo N. Calheiros, Rajiv Ranjan, Anton Beloglazov, César A. F. De Rose,and Rajkumar Buyya. CloudSim: a toolkit for modeling and simulation of cloudcomputing environments and evaluation of resource provisioning algorithms. Software:Practice and Experience, 41(1):23–50, 2011. (Cited on pages 32, 61, 103, 106, 107,112, 113, and 214)
[59] Zhibo Cao and Shoubin Dong. An energy-aware heuristic framework for virtualmachine consolidation in cloud computing. The Journal of Supercomputing, 69(1):429–451, 2014. (Cited on pages 112 and 113)
[60] Eugenio Capra, Chiara Francalanci, and Sandra A. Slaughter. Is software "green"?application development environments and energy efficiency in open source ap-plications. Information and Software Technology, 54(1):60–71, 2012. (Cited onpage 90)
[61] Emanuele Carlini, Massimo Coppola, Patrizio Dazzi, Laura Ricci, and GiacomoRighetti. Cloud federations in Contrail. In International Conference on ParallelProcessing, pages 159–168, 2011. (Cited on pages 71, 72, and 74)
[62] Henri Casanova, Dmitrii Zagorodnov, Francine Berman, and Arnaud Legrand.Heuristics for scheduling parameter sweep applications in grid environments. In 9thHeterogeneous Computing Workshop, pages 349–363, 2000. (Cited on page 204)
[63] T. L. Casavant and J. G. Kuhl. A taxonomy of scheduling in general-purposedistributed computing systems. IEEE Transactions on Software Engineering, 14(2):141–154, 1988. (Cited on page 195)
[64] Miguel Castro, Peter Druschel, Anne-Marie Kermarrec, and Antony I. T. Rowstron.One ring to rule them all: service discovery and binding in structured peer-to-peeroverlay networks. In ACM SIGOPS European Workshop, pages 140–145, 2002. (Citedon page 27)
[65] Miguel Castro, Manuel Costa, and Antony Rowstron. Debunking some mythsabout structured and unstructured overlays. In 2nd Conference on Symposium onNetworked Systems Design & Implementation, pages 85–98. USENIX, 2005. (Citedon page 27)
[66] Danielle Catteddu and Gilles Hogben. Cloud computing: Benefits,risks and recommendations for information security. Technical report,European Network and Information Security Agency (ENISA), Febru-ary 2009. URL www.enisa.europa.eu/act/rm/files/deliverables/
cloud-computing-risk-assessment/at_download/fullReport. Last accessed inFebruary 2014. (Cited on page 41)
[67] Everton Cavalcante, André Almeida, Thais Batista, Nélio Cacho, Frederico Lopes,Flavia C. Delicato, Thiago Sena, and Paulo F. Pires. Exploiting software product
225

Bibliography
lines to develop cloud computing applications. In 16th International Software ProductLine Conference, pages 179–187, 2012. (Cited on pages 148, 179, 184, and 187)
[68] Antonio Celesti, Francesco Tusa, Massimo Villari, and Antonio Puliafito. How toenhance cloud architectures to enable cross-federation. In 3rd IEEE InternationalConference on Cloud Computing, pages 337–345, 2010. (Cited on page 49)
[69] Antonio Celesti, Francesco Tusa, Massimo Villari, and Antonio Puliafito. Three-phasecross-cloud federation model: The cloud SSO authentication. In 2nd InternationalConference on Advances in Future Internet, pages 94–101, 2010. (Cited on page 51)
[70] Antonio Celesti, Francesco Tusa, and Massimo Villari. Toward Cloud Federation:Concepts and Challenges. In Ivona Brandic, Massimo Villari, and Francesco Tusa,editors, Achieving Federated and Self-Manageable Cloud Infrastructures: Theory andPractice, pages 1–17. IGI Global, 2012. (Cited on page 74)
[71] Vinton G. Cerf. ACM and the professional programmer. Queue, 12(7):10:10–10:11,2014. (Cited on page 212)
[72] Vinton G. Cerf and Robert E. Kahn. A protocol for packet network intercommuni-cation. IEEE Transactions on Communications, Com-22(5):627–641, 1974. (Citedon page 12)
[73] Kelly Chard, Michael Russell, Yves A. Lussier, Eneida A Mendonça, and Jonathan C.Silverstein. Scalability and cost of a cloud-based approach to medical NLP. In 24thInternational Symposium on Computer-Based Medical Systems, pages 1–6, 2011.(Cited on page 147)
[74] Ramnath Chellappa. Intermediaries in cloud-computing: A new computing paradigm.INFORMS, 1997. (Cited on page 15)
[75] Yee Ming Chen and Hsin-Mei Yeh. An implementation of the multiagent system formarket-based cloud resource allocation. Journal of Computing, 2(11):27–33, 2010.(Cited on pages 112 and 113)
[76] Dazhao Cheng, Changjun Jiang, and Xiaobo Zhou. Heterogeneity-aware workloadplacement and migration in distributed sustainable datacenters. In 28th IEEEInternal Parallel and Distributed Processing Symposium, pages 307–316, 2014. (Citedon page 92)
[77] Ann Chervenak and Shishir Bharathi. Peer-to-peer approaches to grid resourcediscovery. In Making Grids Work. Springer, 2008. (Cited on page 24)
[78] Trieu C. Chieu, Ajay Mohindra, Alexei Karve, and Alla Segal. Solution-baseddeployment of complex application services on a cloud. In IEEE InternationalConference on Service Operations and Logistics and Informatics, pages 282–287,2010. (Cited on pages 177, 178, 184, and 187)
[79] Wu chun Feng, Xizhou Feng, and Rong Ge. Green supercomputing comes of age.IT Professional, 10:17–23, 2008. (Cited on page 93)
226
Bibliography
[80] Christopher Clark, Keir Fraser, Steven Hand, Jacob Gorm Hansen, Eric Jul, ChristianLimpach, Ian Pratt, and Andrew Warfield. Live migration of virtual machines. In2nd Conference on Symposium on Networked Systems Design & Implementation,pages 273–286. USENIX Association, 2005. (Cited on page 39)
[81] Stuart Clayman, Alex Galis, Clovis Chapman, Giovanni Toffetti, Luis Rodero-Merino,Luis M. Vaquero, Kenneth Nagin, and Benny Rochwerger. Monitoring service cloudsin the future internet. In Georgios Tselentis, John Domingue, Alex Galis, AnastasiusGavras, David Hausheer, Srdjan Krco, Volkmar Lotz, and Theodore Zahariadis,editors, Towards the Future Internet: Emerging Trends from European Research,pages 115–126. IOS Press, 2010. (Cited on page 53)
[82] Paul Clements and Linda Northrop. Software Product Lines: Practices and Patterns.Addison-Wesley, 2001. (Cited on pages 147 and 154)
[83] Carlos A. Coello Coello, Gary B. Lamont, and David A. Van Veldhuizen. Evolutionaryalgorithms for solving multi-objective problems, volume 242. Springer, 2 edition, 2002.(Cited on page 152)
[84] Jared L. Cohon. Multiobjective programming and planning. Academic Press, 1978.(Cited on page 152)
[85] Gary Cook, Tom Dowdall, David Pomerantz, and Yifei Wang. Clicking Clean: Howcompanies are creating the green Internet 2014. Technical report, Greenpeace, April2014. URL greenpeace.org/usa/Global/usa/planet3/PDFs/clickingclean.
pdf. Last accessed in May 2014. (Cited on pages 90 and 92)
[86] Stefania Costache, Nikos Parlavantzas, Christine Morin, and Samuel Kortas. Aneconomic approach for application QoS management in clouds. In InternationalConference on Parallel Processing, pages 426–435, 2012. (Cited on pages 81 and 88)
[87] Maria Couceiro, Paolo Romano, Nuno Carvalho, and Luís Rodrigues. D2STM:Dependable distributed software transactional memory. In 15th IEEE Pacific RimInternational Symposium on Dependable Computing, pages 307–313, 2009. (Cited onpage 62)
[88] George Coulouris, Jean Dollimore, Tim Kindberg, and Gordon Blair. DistributedSystems: Concepts and Design. Addison-Wesley, 5th edition, 2011. (Cited onpages 11, 12, 13, 14, and 190)
[89] Adina Crainiceanu, Prakash Linga, Johannes Gehrke, and Jayavel Shanmugasun-daram. Querying peer-to-peer networks using p-trees. In 7th International Workshopon the Web and Databases, pages 25–30, 2004. (Cited on page 25)
[90] Adina Crainiceanu, Prakash Linga, Ashwin Machanavajjhala, Johannes Gehrke,and Jayavel Shanmugasundaram. P-ring: An efficient and robust P2P range indexstructure. In ACM SIGMOD International Conference on Management of Data,pages 223–234, 2007. (Cited on page 25)
227

Bibliography
[91] Cycle Computing. New cyclecloud HPC cluster is a triple threat: 30000 cores,$1279/hour, & grill monitoring GUI for Chef. bit.ly/cyclecomputing, 2011. Lastaccessed in February 2014. (Cited on page 16)
[92] Krzysztof Czarnecki and Ulrich W. Eisenecker. Generative Programming: Methods,Tools, and Applications. ACM Press/Addison-Wesley, 2000. (Cited on pages 154and 216)
[93] Rajarshi Das, Jeffrey O. Kephart, Charles Lefurgy, Gerald Tesauro, David W. Levine,and Hoi Chan. Autonomic multi-agent management of power and performance indata centers. In AAMAS, pages 107–114, 2008. (Cited on pages 112 and 113)
[94] Doug Davis and Gilbert Pilz. Cloud Infrastructure Management Interface (CIMI)Model and RESTful HTTP-based Protocol: An interface for managing cloud infras-tructure. Technical Report DSP0263, Distributed Management Task Force, May2012. URL dmtf.org/sites/default/files/standards/documents/DSP0263_1.
0.0.pdf. Last accessed in July 2014. (Cited on page 53)
[95] Daniel de Oliveira, Eduardo Ogasawara, Fernanda Baião, and Marta Mattoso.SciCumulus: A lightweight cloud middleware to explore many task computingparadigm in scientific workflows. In 3rd IEEE International Conference on CloudComputing, pages 378–385, 2010. (Cited on pages 60, 62, and 74)
[96] Frederico Alvares de Oliveira, Jr. and Thomas Ledoux. Self-management of cloudapplications and infrastructure for energy optimization. ACM SIGOPS OperatingSystems Review, 46(2):10–18, 2012. (Cited on pages 82 and 88)
[97] Edans Flavius de Oliveira Sandes and Alba Cristina Magalhães Alves de Melo.Retrieving Smith-Waterman Alignments with Optimizations for Megabase BiologicalSequences Using GPU. IEEE Transactions on Parallel and Distributed Systems, 24(5):1009–1021, 2013. (Cited on pages 115 and 127)
[98] Jeffrey Dean and Sanjay Ghemawat. MapReduce: Simplified data processing onlarge clusters. In Conference on Symposium on Opearting Systems Design & Imple-mentation, pages 137–149. USENIX Association, 2004. (Cited on pages xxii, 16, 17,43, and 44)
[99] Michael L. Dertouzos. The Unfinished Revolution: Human-Centered Computers andWhat They Can Do for Us. HarperInformation, 2001. (Cited on page 219)
[100] Scott W Devine, Edouard Bugnion, and Mendel Rosenblum. Virtualization systemincluding a virtual machine monitor for a computer with a segmented architecture,1998. US Patent 6397242. (Cited on page 38)
[101] Roger Dingledine, Michael J. Freedman, and David Molnar. The free haven project:Distributed anonymous storage service. In Workshop on Design Issues in Anonymityand Unobservability, pages 67–95, 2000. (Cited on page 24)
[102] Brian Dougherty, Jules White, and Douglas C. Schmidt. Model-driven auto-scalingof green cloud computing infrastructure. Future Generation Computer Systems, 28(2):371–378, 2012. (Cited on pages 146, 148, 175, 176, 184, and 187)
228
Bibliography
[103] Corentin Dupont, Thomas Schulze, Giovanni Giuliani, Andrey Somov, and FabienHermenier. An energy aware framework for virtual machine placement in cloudfederated data centres. In 3rd International Conference on Future Energy Systems:Where Energy, Computing and Communication Meet, pages 4:1–4:10, 2012. (Citedon pages 111 and 113)
[104] Richard Durbin, Sean R. Eddy, Anders Krogh, and Graeme Mitchison. BiologicalSequence Analysis. Cambridge, UK:Cambridge University Press, 1998. (Cited onpage 116)
[105] Sourav Dutta, Sankalp Gera, Akshat Verma, and Balaji Viswanathan. SmartScale:Automatic application scaling in enterprise clouds. In 5th International Conferenceon Cloud Computing (CLOUD), pages 221–228, 2012. (Cited on pages 85, 86, 88,and 213)
[106] Rubin Ellen. Cloud federation and the intercloud. ellenrubin.sys-con.com/node/
1249746, 2010. Last accessed in May 2014. (Cited on page 51)
[107] Google App Engine. Google App Engine post-mortem for February 24th, 2010outage. goo.gl/uYnQFf, 2010. Last accessed in July 2014. (Cited on page 48)
[108] Patrick Th. Eugster, Pascal A. Felber, Rachid Guerraoui, and Anne-Marie Kermarrec.The many faces of publish/subscribe. ACM Computing Surveys, 35(2):114–131, 2003.(Cited on page 191)
[109] Faiza Fakhar, Barkha Javed, Raihan ur Rasool, Owais Malik, and Khurram Zulfiqar.Software level green computing for large scale systems. Journal of Cloud Computing,1(1):1–17, 2012. (Cited on page 91)
[110] Xiaobo Fan, Wolf-Dietrich Weber, and Luiz André Barroso. Power provisioning fora warehouse-sized computer. In 34th annual international symposium on Computerarchitecture, pages 13–23, 2007. (Cited on page 89)
[111] Eugen Feller, Louis Rilling, and Christine Morin. Snooze: A scalable and autonomicvirtual machine management framework for private clouds. In IEEE/ACM Inter-national Symposium on Cluster, Cloud and Grid Computing, pages 482–489, 2012.(Cited on pages 82, 83, 87, 88, 209, 210, and 213)
[112] Ana Juan Ferrer, Francisco Hernández, Johan Tordsson, Erik Elmroth, Ahmed Ali-Eldin, Csilla Zsigri, Raül Sirvent, Jordi Guitart, Rosa M. Badia, Karim Djemame,Wolfgang Ziegler, Theo Dimitrakos, Srijith K. Nair, George Kousiouris, KleopatraKonstanteli, Theodora Varvarigou, Benoit Hudzia, Alexander Kipp, Stefan Wesner,Marcelo Corrales, Nikolaus Forgó, Tabassum Sharif, and Craig Sheridan. OPTIMIS:A holistic approach to cloud service provisioning. Future Generation ComputerSystems, 28(1):66–77, 2012. (Cited on pages 50, 72, 73, 74, and 210)
[113] Tiago C. Ferreto, Marco A. S. Netto, Rodrigo N. Calheiros, and César A. F. De Rose.Server consolidation with migration control for virtualized data centers. FutureGeneration Computer Systems, 27(8):1027–1034, 2011. (Cited on pages 40 and 102)
229
Bibliography
[114] Roy T. Fielding and Richard N. Taylor. Principled design of the modern webarchitecture. ACM Transactions on Internet Technology, 2(2):115–150, 2002. (Citedon page 14)
[115] Roy T Fielding, J. Gettys, H. Frystyk, L. Masinter, and Tim Berners-Lee. Hyper-text Transfer Protocol – HTTP/1.1. www.ietf.org/rfc/rfc2616.txt, 1999. Lastaccessed in January 2014. (Cited on page 15)
[116] Roy Thomas Fielding. Architectural styles and the design of network-based softwarearchitectures. PhD thesis, University of California, Irvine, 2000. (Cited on page 119)
[117] Brian W. Fitzpatrick and JJ Lueck. The case against data lock-in. Communicationsof the ACM, 53(11):42–46, 2010. (Cited on page 33)
[118] Michael J. Flynn. Some computer organizations and their effectiveness. IEEETransactions on Computers, 21(9):948–960, 1972. (Cited on page 12)
[119] Carlos M. Fonseca and Peter J. Fleming. An overview of evolutionary algorithms inmultiobjective optimization. Evolutionary Computation, 3(1):1–16, 1995. (Cited onpage 153)
[120] Global Inter-Cloud Technology Forum. Use cases and functional requirements forinter-cloud computing. Technical report, Global Inter-Cloud Technology Forum, Au-gust 2010. URL gictf.jp/doc/GICTF_Whitepaper_20100809.pdf. Last accessedin January 2014. (Cited on page 48)
[121] I. Foster, Yong Zhao, I. Raicu, and S. Lu. Cloud computing and grid computing360-degree compared. In Grid Computing Environments Workshop, pages 1–10, 2008.(Cited on pages 29, 31, 32, 45, and 46)
[122] Ian Foster. Globus Toolkit version 4: Software for service-oriented systems. InInternational Conference on Network and Parallel Computing, pages 2–13. Springer-Verlag, 2005. (Cited on pages 21, 22, and 35)
[123] Ian Foster and Adriana Iamnitchi. On death, taxes, and the convergence of peer-to-peer and grid computing. In 2nd International Workshop on Peer-to-Peer Systems,pages 118–128, 2003. (Cited on pages 34 and 213)
[124] Ian Foster and Carl Kesselman. Globus: A metacomputing infrastructure toolkit.International Journal of Supercomputer Applications, 11:115–128, 1996. (Cited onpage 14)
[125] Ian Foster and Carl Kesselman. The Grid: Blueprint for a New Computing Infras-tructure. Morgan Kaufmann Publishers Inc., 1999. (Cited on page 14)
[126] Ian Foster, Carl Kesselman, and Steven Tuecke. The anatomy of the grid: Enablingscalable virtual organizations. International Journal of High Performance ComputingApplications, 15(3):200–222, 2001. (Cited on pages 19, 20, and 34)
230

Bibliography
[127] Geoffrey Fox, Xiaohong Qiu, Scott Beason, Jong Choi, Jaliya Ekanayake, ThilinaGunarathne, Mina Rho, Haixu Tang, Neil Devadasan, and Gilbert Liu. BiomedicalCase Studies in Data Intensive Computing. In IEEE International Conference onCloud Computing, pages 2–18, 2009. (Cited on pages 125 and 127)
[128] Guilherme Galante and Luis Carlos Erpen Bona. Constructing elastic scientific appli-cations using elasticity primitives. 13th International Conference on ComputationalScience and Applications, 5:281–294, 2013. (Cited on page 60)
[129] Peter Xiang Gao, Andrew R. Curtis, Bernard Wong, and Srinivasan Keshav. It’s noteasy being green. In Conference on Applications, Technologies, Architectures, andProtocols for Computer Communication, pages 211–222, 2012. (Cited on page 90)
[130] Jesús García-Galán, Omer Rana, Pablo Trinidad, and Antonio Ruiz-Cortés. Mi-grating to the cloud: a software product line based analysis. In 3rd InternationalConference on Cloud Computing and Services Science, pages 416–426, 2013. (Citedon pages 148, 162, 184, 185, and 187)
[131] L. Garcés-Erice, K.W. Ross, E.W. Biersack, P.A. Felber, and G. Urvoy-Keller.Topology-centric look-up service. In 5th International Workshop on NetworkedGroup Communications, pages 58–69, 2003. (Cited on page 28)
[132] Simson Garfinkel. The computer utility. In Harold Abelson, editor, Architects of theInformation Society: 35 Years of the Laboratory for Computer Science at MIT. MITPress, 1999. (Cited on pages 11, 35, and 219)
[133] Saurabh Kumar Garg, Steve Versteeg, and Rajkumar Buyya. SMICloud: A frame-work for comparing and ranking cloud services. In 4th IEEE International Conferenceon Utility and Cloud Computing, pages 210–218, 2011. (Cited on page 91)
[134] Vijay K. Garg, Ph.D. Elements of Distributed Computing. John Wiley & Sons, 2002.(Cited on page 12)
[135] Rong Ge, Xizhou Feng, Wu-chun Feng, and Kirk W. Cameron. CPU MISER: Aperformance-directed, run-time system for power-aware clusters. In InternationalConference on Parallel Processing, pages 18–26, 2007. (Cited on page 91)
[136] Christos Gkantsidis, Milena Mihail, and Amin Saberi. Random walks in peer-to-peernetworks: Algorithms and evaluation. Performance Evaluation, 63(3):241–263, 2006.(Cited on pages 24 and 28)
[137] Íñigo Goiri, Ferran Julia, J. Oriol Fitó, Mario Macías, and Jordi Guitart. SupportingCPU-based Guarantees in Cloud SLAs via Resource-level QoS Metrics. FutureGeneration Computer Systems, 28(8):1295–1302, 2012. (Cited on page 55)
[138] Robert P. Goldberg. Survey of virtual machine research. IEEE Computer, 7(9):34–45, 1974. (Cited on pages 12, 37, and 38)
[139] Pam Frost Gorder. Coming soon: Research in a cloud. Computing in Science andEngineering, 10(6):6–10, 2008. (Cited on page 35)
231
Bibliography
[140] Andrzej Goscinski and Michael Brock. Toward dynamic and attribute based publi-cation, discovery and selection for cloud computing. Future Generation ComputerSystems, 26(7):947–970, 2010. (Cited on page 52)
[141] R.L. Graham, E.L. Lawler, J.K. Lenstra, and A.H.G.Rinnooy Kan. Optimizationand approximation in deterministic sequencing and scheduling: a survey. Annals ofdiscrete Mathematics, 5:287–326, 1979. (Cited on page 195)
[142] Greenpeace. Make it green: Cloud computing and its contribution to climate change.Technical report, Greenpeace International, March 2010. URL greenpeace.org/
usa/Global/usa/report/2010/3/make-it-green-cloud-computing.pdf. Lastaccessed in April 2014. (Cited on pages 2 and 90)
[143] Sam Griffiths-Jones, Simon Moxon, Mhairi Marshall, Ajay Khanna, Sean R. Eddy,and Alex Bateman. Rfam: annotating non-coding RNAs in complete genomes.Nucleic Acids Research, 33:D121–D124, 2005. (Cited on page 136)
[144] Bernd Grobauer, Tobias Walloschek, and Elmar Stocker. Understanding cloudcomputing vulnerabilities. IEEE Security and Privacy, 9:50–57, 2011. (Cited onpage 32)
[145] Nikolay Grozev and Rajkumar Buyya. Inter-Cloud architectures and applicationbrokering: taxonomy and survey. Software: Practice and Experience, 44(3):369–390,2014. (Cited on pages 48 and 49)
[146] P. H. Gum. System/370 extended architecture: Facilities for virtual machines. IBMJournal of Research and Development, 27(6):530–544, 1983. (Cited on page 12)
[147] Tian Guo, Upendra Sharma, Prashant Shenoy, Timothy Wood, and Sambit Sahu.Cost-aware cloud bursting for enterprise applications. ACM Transactions on InternetTechnology, 13(3):10:1–10:24, 2014. (Cited on page 60)
[148] Hongmu Han, Jie He, and Cuihua Zuo. A hybrid P2P overlay network for highefficient search. In 2nd IEEE International Conference on Information and FinancialEngineering, pages 241–245, 2010. (Cited on page 27)
[149] Vinay Hanumaiah and Sarma Vrudhula. Energy-efficient operation of multi-coreprocessors by DVFS, task migration and active cooling. IEEE Transactions onComputers, 99, 2012. (Cited on page 91)
[150] Nicholas J. A. Harvey, Michael B. Jones, Stefan Saroiu, Marvin Theimer, and AlecWolman. SkipNet: A scalable overlay network with practical locality properties.In 4th Conference on USENIX Symposium on Internet Technologies and Systems,pages 9–21, 2003. (Cited on page 25)
[151] Mohammad Mehedi Hassan, M.Shamim Hossain, A.M.Jehad Sarkar, and Eui-NamHuh. Cooperative game-based distributed resource allocation in horizontal dynamiccloud federation platform. Information Systems Frontiers, pages 1–20, 2012. (Citedon page 52)
232
Bibliography
[152] Michael Hauben and Ronda Hauben. Netizens: On the History and Impact of Usenetand the Internet. Wiley-IEEE Computer Society, 1997. (Cited on page 212)
[153] Naohiro Hayashibara and Adel Cherif. Failure detectors for large-scale distributedsystems. In 21st IEEE Symposium on Reliable Distributed Systems, pages 404–409,2002. (Cited on page 190)
[154] Brian Hayes. Cloud computing. Communications of the ACM, 51:9–11, 2008. (Citedon pages 1 and 15)
[155] Fabien Hermenier, Xavier Lorca, Jean-Marc Menaud, Gilles Muller, and JuliaLawall. Entropy: A consolidation manager for clusters. In ACM SIGPLAN/SIGOPSInternational Conference on Virtual Execution Environments, pages 41–50, 2009.(Cited on pages 111 and 113)
[156] Z. Hill and M. Humphrey. CSAL: A cloud storage abstraction layer to enableportable cloud applications. In 2nd International Conference on Cloud ComputingTechnology and Science, pages 504–511, 2010. (Cited on page 33)
[157] Michael R. Hines, Umesh Deshpande, and Kartik Gopalan. Post-copy live migrationof virtual machines. ACM SIGOPS Operating Systems Review, 43(3):14–26, 2009.(Cited on page 39)
[158] C. N. Hoefer and G. Karagiannis. Taxonomy of cloud computing services. In IEEEGLOBECOM Workshops, pages 1345–1350, 2010. (Cited on page 162)
[159] I. L. Hofacker, W. Fontana, P. F. Stadler, L. S. Bonhoeffer, M. Tacker, and P. Schuster.Fast folding and comparison of RNA secondary structures. Chemical Monthly, 125(2):167–188, 1994. (Cited on page 136)
[160] Steve Hoffmann, Christian Otto, Stefan Kurtz, Cynthia M. Sharma, PhilippKhaitovich, Jörg Vogel, Peter F. Stadler, and Jörg Hackermüller. Fast mapping ofshort sequences with mismatches, insertions and deletions using index structures.PLoS computational biology, 5:e1000502, 2009. (Cited on pages 136 and 137)
[161] Q. Hofstatter, S. Zols, M. Michel, Z. Despotovic, and W. Kellerer. Chordella - ahierarchical peer-to-peer overlay implementation for heterogeneous, mobile environ-ments. In 8th International Conference on Peer-to-Peer Computing, pages 75–76,2008. (Cited on pages 27 and 28)
[162] Paul Horn. Autonomic computing: IBM’s perspective on the state of infor-mation technology. www.research.ibm.com/autonomic/manifesto/autonomic_
computing.pdf, 2001. Last accessed in January 2014. (Cited on pages 16, 77, 78,and 213)
[163] Markus C. Huebscher and Julie A. McCann. A survey of autonomic comput-ing—degrees, models, and applications. ACM Computing Surveys, 40(3):7:1–7:28,2008. (Cited on pages 76 and 80)
233

Bibliography
[164] IBM. An architectural blueprint for autonomic computing. Technical Re-port Third edition, IBM, June 2005. URL www-03.ibm.com/autonomic/pdfs/
ACBlueprintWhitePaperV7.pdf. Last accessed in January 2014. (Cited on pages 77and 79)
[165] Shigeru Imai, Thomas Chestna, and Carlos A. Varela. Elastic scalable cloud comput-ing using application-level migration. In 5th IEEE/ACM International Conferenceon Utility and Cloud Computing, pages 91–98, 2012. (Cited on pages 66, 67, 74,and 210)
[166] Anca Iordache, Christine Morin, Nikos Parlavantzas, Eugen Feller, and Pierre Riteau.Resilin: Elastic MapReduce over multiple clouds. In 13th IEEE/ACM InternationalSymposium on Cluster, Cloud and Grid Computing, pages 261–268, 2013. (Cited onpages 141 and 143)
[167] Alexandru Iosup, Simon Ostermann, Nezih Yigitbasi, Radu Prodan, ThomasFahringer, and Dick Epema. Performance analysis of cloud computing servicesfor many-tasks scientific computing. IEEE Transactions on Parallel and DistributedSystem, 22(6):931–945, 2011. (Cited on pages 32, 147, 164, and 205)
[168] iperf3. software.es.net/iperf, 2014. Last accessed in July 2014. (Cited onpages 150 and 168)
[169] Daniel Jackson. Software Abstractions: Logic, Language, and Analysis. The MITPress, revised edition, 2012. (Cited on page 218)
[170] Keith R. Jackson, Lavanya Ramakrishnan, Krishna Muriki, Shane Canon, ShreyasCholia, John Shalf, Harvey J. Wasserman, and Nicholas J. Wright. Performanceanalysis of high performance computing applications on the Amazon Web Servicescloud. In 2nd IEEE International Conference on Cloud Computing Technology andScience, pages 159–168, 2010. (Cited on pages 54 and 164)
[171] H. V. Jagadish, Beng Chin Ooi, and Quang Hieu Vu. BATON: A balanced treestructure for peer-to-peer networks. In 31st International Conference on Very LargeData Bases, pages 661–672, 2005. (Cited on page 25)
[172] H.V. Jagadish, Beng-Chin Ooi, Quang Hieu Vu, Rong Zhang, and Aoying Zhou.VBI-Tree: A peer-to-peer framework for supporting multi-dimensional indexingschemes. In 22nd International Conference on Data Engineering, pages 34–34, 2006.(Cited on page 25)
[173] Pelle Jakovits and Satish Narayana Srirama. Adapting scientific applications tocloud by using distributed computing frameworks. In 13th IEEE/ACM InternationalSymposium on Cluster, Cloud and Grid Computing, pages 164–167, 2013. (Cited onpage 146)
[174] Márk Jelasity, Spyros Voulgaris, Rachid Guerraoui, Anne-Marie Kermarrec, andMaarten van Steen. Gossip-based peer sampling. ACM Transactions on ComputerSystems, 25(3):1–36, 2007. (Cited on page 80)
234

Bibliography
[175] Xing Jin and S.-H.Gary Chan. Unstructured peer-to-peer network architectures. InXuemin Shen, Heather Yu, John Buford, and Mursalin Akon, editors, Handbook ofPeer-to-Peer Networking, pages 117–142. Springer, 2010. (Cited on page 24)
[176] Laurent Jourdren, Maria Bernard, Marie-Agnès Dillies, and Stéphane Le Crom. Eoul-san: A cloud computing-based framework facilitating high throughput sequencinganalyses. Bioinformatics, 28(11):1541–1543, 2012. (Cited on pages 125 and 127)
[177] Robert H. Halstead Jr. Implementation of Multilisp: Lisp on a Multiprocessor. InACM Symposium on LISP and Functional Programming, pages 9–17, 1984. (Citedon page 218)
[178] Narendra Jussien, Guillaume Rochart, and Xavier Lorca. Choco: an Open SourceJava Constraint Programming Library. In Workshop on Open-Source Software forInteger and Contraint Programming, pages 1–10, 2008. (Cited on pages 6, 149, 164,188, 216, and 218)
[179] Gideon Juve, Mats Rynge, Ewa Deelman, Jens-S. Vockler, and G. Bruce Berriman.Comparing FutureGrid, Amazon EC2, and Open Science Grid for Scientific Work-flows. Computing in Science & Engineering, 15(4):20–29, 2013. (Cited on pages 2,129, 141, and 146)
[180] Steffen Kächele and Franz J. Hauck. Component-based scalability for cloud applica-tions. In 3rd International Workshop on Cloud Data and Platforms, pages 19–24,2013. (Cited on pages 60 and 74)
[181] Yoshiaki Kakuda, Hideki Yukitomo, Shinji Kusumoto, and Tohru Kikuno. Scientificcomputing in the cloud. IEEE Design & Test, 12(3):34–43, 2010. (Cited on page 35)
[182] Kyo C Kang, Sholom G Cohen, James A Hess, William E Novak, and A SpencerPeterson. Feature-oriented domain analysis (FODA) feasibility study. TechnicalReport CMU/SEI-90-TR-21, Software Engineering Institute, November 1990. URLwww.sei.cmu.edu/reports/90tr021.pdf. Last accessed in June 2014. (Cited onpages 147 and 154)
[183] Krishna Kant and Prasant Mohapatra. Internet data centers. IEEE Computer, 37:35–37, 2004. (Cited on page 89)
[184] David Karger, Eric Lehman, Tom Leighton, Rina Panigrahy, Matthew Levine, andDaniel Lewin. Consistent hashing and random trees: Distributed caching protocolsfor relieving hot spots on the World Wide Web. In 29th Annual ACM Symposiumon Theory of Computing, pages 654–663, 1997. (Cited on page 25)
[185] Lori M. Kaufman. Can a trusted environment provide security? IEEE Security andPrivacy, 8(1):50–52, 2010. (Cited on pages 33 and 34)
[186] K. Keahey, I. Foster, T. Freeman, and X. Zhang. Virtual workspaces: Achievingquality of service and quality of life in the grid. Scientific Programming, 13(4):265–275, 2005. (Cited on pages 55 and 217)
235
Bibliography
[187] Katarzyna Keahey and Tim Freeman. Contextualization: Providing one-click virtualclusters. In 4th IEEE International Conference on eScience, pages 301–308, 2008.(Cited on page 59)
[188] Katarzyna Keahey, Mauricio Tsugawa, Andrea Matsunaga, and Jose Fortes. Skycomputing. IEEE Internet Computing, 13(5):43–51, 2009. (Cited on page 51)
[189] Gabor Kecskemeti, Attila Kertesz, Attila Marosi, and Peter Kacsuk. Interoperableresource management for establishing federated clouds. In Ivona Brandic, MassimoVillari, and Francesco Tusa, editors, Achieving Federated and Self-Manageable CloudInfrastructures: Theory and Practice, pages 18–35. IGI Global, 2012. (Cited onpage 50)
[190] Alexander Keller and Heiko Ludwig. The WSLA framework: Specifying and moni-toring service level agreements for web services. Journal of Network and SystemsManagement, 11:57–81, 2003. (Cited on page 42)
[191] Jeffrey O. Kephart and David M. Chess. The vision of autonomic computing. IEEEComputer, 36(1):41–50, 2003. (Cited on pages 76, 77, 78, 79, and 80)
[192] Anne-Marie Kermarrec and Peter Triantafillou. XL peer-to-peer pub/sub systems.ACM Computing Surveys, 46(2):16:1–16:45, 2013. (Cited on page 11)
[193] Hamzeh Khazaei, Jelena Misic, and Vojislav B. Misic. Performance Analysis of CloudComputing Centers Using M/G/m/m+r Queuing Systems. IEEE Transactions onParallel and Distributed Systems, 23(5):936–943, 2012. (Cited on pages 91 and 111)
[194] Hyunjoo Kim and Manish Parashar. CometCloud: An Autonomic Cloud Engine,pages 275–297. John Wiley & Sons, Inc., 2011. (Cited on pages 70, 71, 74, and 210)
[195] Kyong Hoon Kim, Wan Yeon Lee, Jong Kim, and Rajkumar Buyya. SLA-basedscheduling of bag-of-tasks applications on power-aware cluster systems. Transactionson Information and Systems, E93-D(12):3194–3201, 2010. (Cited on pages 111and 113)
[196] Alexander Kipp, Tao Jiang, Mariagrazia Fugini, and Ioan Salomie. Layered greenperformance indicators. Future Generation Computer Systems, 28(2):478–489, 2012.(Cited on page 98)
[197] Avi Kivity, Yaniv Kamay, Dor Laor, Uri Lublin, and Anthony Liguori. kvm: theLinux virtual machine monitor. In PLinux Symposium, volume 1, pages 225–230,2007. (Cited on page 38)
[198] Dzmitry Kliazovich, Pascal Bouvry, and Samee Ullah Khan. Greencloud: A packet-level simulator of energy-aware cloud computing data centers. In IEEE GlobalTelecommunications Conference, pages 1–5, 2010. (Cited on page 32)
[199] Sonja Klingert, Thomas Schulze, and Christian Bunse. GreenSLAs for the energy-efficient management of data centres. In 2nd International Conference on Energy-Efficient Computing and Networking, pages 21–30, 2011. (Cited on page 41)
236
Bibliography
[200] Alexander V. Konstantinou, Tamar Eilam, Michael Kalantar, Alexander A. Totok,William Arnold, and Edward Snible. An architecture for virtual solution compo-sition and deployment in infrastructure clouds. In 3rd International Workshop onVirtualization Technologies in Distributed Computing, pages 9–18, 2009. (Cited onpages 146, 177, 178, 184, and 187)
[201] Jonathan G Koomey. Estimating total power consumption by servers in the U.S.and the world. Technical report, Lawrence Berkeley National Laboratory andConsulting Professor, Stanford University, February 2007. URL hightech.lbl.gov/
documents/DATA_CENTERS/svrpwrusecompletefinal.pdf. Last accessed in April2014. (Cited on pages 2 and 89)
[202] Jonathan G Koomey. Growth in data center electricity use 2005 to 2010. Oakland,CA: Analytics Press, 2011. (Cited on page 2)
[203] Pawel Koperek and Wlodzimierz Funika. Dynamic business metrics-driven resourceprovisioning in cloud environments. In 9th International Conference on ParallelProcessing and Applied Mathematics - Volume Part II, pages 171–180, 2012. (Citedon page 55)
[204] Hugo H. Kramer, Vinicius Petrucci, Anand Subramanian, and Eduardo Uchoa. Acolumn generation approach for power-aware optimization of virtualized heteroge-neous server clusters. Computers and Industrial Engineering, 63(3):652–662, 2012.(Cited on page 91)
[205] William T.C. Kramer, John M. Shalf, and Erich Strohmaier. The NERSC sustainedsystem performance (SSP) metric. In 9AD, pages 6–12, 2005. (Cited on pages 55and 56)
[206] Rouven Krebs, Christof Momm, and Samuel Kounev. Metrics and techniques forquantifying performance isolation in cloud environments. In 8th International ACMSIGSOFT Conference on Quality of Software Architectures, pages 91–100, 2012.(Cited on page 55)
[207] Rakesh Kumar. Important power, cooling and green it concerns. Tech-nical report, Gartner Report, 2007. URL gartner.com/doc/500296/
important-power-cooling-green-it. Last accessed in April 2014. (Cited onpage 89)
[208] Shun Kit Kwan and J.K. Muppala. Bag-of-tasks applications scheduling on volunteerdesktop grids with adaptive information dissemination. In IEEE 35th Conferenceon Local Computer Networks, pages 544–551, 2010. (Cited on page 27)
[209] Bill Laing. Windows Azure service disruption update. azure.microsoft.com/blog/
2012/02/29/windows-azure-service-disruption-update/, 2012. Last accessedin July 2014. (Cited on page 48)
[210] Klaus-Dieter Lange. Identifying shades of green: The SPECpower benchmarks.IEEE Computer, 42:95–97, 2009. (Cited on pages 93 and 94)
237

Bibliography
[211] Jason Lango. Toward software-defined SLAs. ACM Queue, 11(11):20:20–20:31, 2013.(Cited on page 150)
[212] Young Choon Lee and Albert Y. Zomaya. Energy efficient utilization of resources incloud computing systems. The Journal of Supercomputing, pages 1–13, 2010. (Citedon pages 103, 105, 112, and 113)
[213] Charles Lefurgy, Xiaorui Wang, and Malcolm Ware. Server-level power control. InFourth Autonomic Computing, 2007. (Cited on page 89)
[214] Alessandro Ferreira Leite and Alba Cristina Magalhães Alves de Melo. Executing abiological sequence comparison application on a federated cloud environment. In19th International Conference on High Performance Computing, pages 1–9, 2012.(Cited on pages 5, 116, 127, and 214)
[215] Alessandro Ferreira Leite and Alba Cristina Magalhães Alves de Melo. Energy-awaremulti-agent server consolidation in federated clouds. In Mazin Yousif and LutzSchubert, editors, Cloud Computing, volume 112 of Lecture Notes of the Institute forComputer Sciences, Social Informatics and Telecommunications Engineering, pages72–81. 2013. (Cited on pages 4, 5, 102, 103, 113, and 214)
[216] Alessandro Ferreira Leite, Hammurabi Chagas Mendes, Li Weigang, Alba CristinaMagalhães Alves Melo, and Azzedine Boukerche. An architecture for P2P bag-of-tasks execution with multiple task allocation policies in desktop grids. ClusterComputing, 15(4):351–361, 2012. (Cited on pages 196 and 217)
[217] Alessandro Ferreira Leite, Claude Tadonki, Christine Eisenbeis, Tainá Raiol, MariaEmilia M. T. Walter, and Alba Cristina Magalhães Alves de Melo. Excalibur: Anautonomic cloud architecture for executing parallel applications. In 4th InternationalWorkshop on Cloud Data and Platforms, pages 2:1–2:6, 2014. (Cited on pages 5, 6,129, 143, and 215)
[218] Philipp Leitner, Zabolotnyi Rostyslav, Alessio Gambi, and Schahram Dustdar.A framework and middleware for application-level cloud bursting on top ofinfrastructure-as-a-service clouds. In 6th IEEE/ACM International Conferenceon Utility and Cloud Computing, pages 163–170, 2013. (Cited on pages 68, 74,and 210)
[219] Feng Li, Beng Chin Ooi, M. Tamer Özsu, and Sai Wu. Distributed data managementusing MapReduce. ACM Computing Surveys, 46(3):31:1–31:42, 2014. (Cited onpage 45)
[220] Heng Li, Bob Handsaker, Alec Wysoker, Tim Fennell, Jue Ruan, Nils Homer, GaborMarth, Goncalo Abecasis, Richard Durbin, and 1000 Genome Project Data ProcessingSubgroup. The sequence alignment/map format and SAMtools. Bioinformatics, 25(16):2078–2079, 8 2009. (Cited on page 136)
[221] Mei Li, Wang-Chien Lee, and Anand Sivasubramaniam. DPTree: A balanced treebased indexing framework for peer-to-peer systems. In International Conference onNetwork Protocols, pages 12–21, 2006. (Cited on page 25)
238
Bibliography
[222] Qing Li, Hongkun Li, Paul Russell Jr., Zhuo Chen, and Chonggang Wang. CA-P2P: Context-aware proximity-based peer-to-peer wireless communications. IEEECommunications Magazine, 52(6):32–41, 2014. (Cited on pages 199 and 200)
[223] X. Li and J Wu. Searching techniques in peer-to-peer networks. In Handbook ofTheoretical and Algorithmic Aspects of Ad Hoc, Sensor, and Peer-to-Peer Networks,pages 613–642. Averbach, 2006. (Cited on page 25)
[224] Zheng Li, Liam O’Brien, He Zhang, and Rainbow Cai. Boosting metrics for cloudservices evaluation – the last mile of using benchmark suites. In 27th InternationalConference on Advanced Information Networking and Applications, pages 381–388,2013. (Cited on page 55)
[225] Xiangke Liao, Liquan Xiao, Canqun Yang, and Yutong Lu. MilkyWay-2 supercom-puter: system and application. Frontiers of Computer Science, 8(3):345–356, 2014.(Cited on page 18)
[226] J. C. R. Licklider and Robert W. Taylor. The computer as a communication device.Science and Technology, 76:21–31, 1968. (Cited on page 11)
[227] LINPACK. netlib.org/linpack, 2012. Last accessed in July 2014. (Cited onpages 93, 164, and 168)
[228] Meirong Liu, Timo Koskela, Zhonghong Ou, Jiehan Zhou, Jukka Riekki, and MikaYlianttila. Super-peer-based coordinated service provision. Journal of Network andComputer Applications, 34(4):1210–1224, 2011. (Cited on page 27)
[229] Yongchao Liu, Douglas L Maskell, and Bertil Schmidt. CUDASW++: optimizingSmith-Waterman sequence database searches for CUDA-enabled graphics processingunits. BMC Bioinformatics, 2, 2009. (Cited on pages 115 and 127)
[230] Zhenhua Liu, Yuan Chen, Cullen Bash, Adam Wierman, Daniel Gmach, ZhikuiWang, Manish Marwah, and Chris Hyser. Renewable and cooling aware workloadmanagement for sustainable data centers. In 12th ACM SIGMETRICS/PERFOR-MANCE Joint International Conference on Measurement and Modeling of ComputerSystems, pages 175–186, 2012. (Cited on page 90)
[231] Boon Thau Loo, Ryan Huebsch, Ion Stoica, and Joseph M. Hellerstein. The casefor a hybrid P2P search infrastructure. In International workshop on Peer-To-PeerSystems, pages 141–150, 2004. (Cited on pages 26 and 27)
[232] Yung-Hsiang Lu, Qinru Qiu, Ali R. Butt, and Kirk W. Cameron. End-to-end energymanagement. IEEE Computer, 44(11):75–77, 2011. (Cited on page 93)
[233] Piotr R Luszczek, David H Bailey, Jack J Dongarra, Jeremy Kepner, Robert F Lucas,Rolf Rabenseifner, and Daisuke Takahashi. The HPC Challenge (HPCC) benchmarksuite. In ACM/IEEE conference on Supercomputing, 2006. (Cited on page 94)
[234] Qin Lv, Pei Cao, Edith Cohen, Kai Li, and Scott Shenker. Search and replica-tion in unstructured peer-to-peer networks. In 16th International Conference onSupercomputing, pages 84–95, 2002. (Cited on pages 24 and 28)
239
Bibliography
[235] Qin Lv, Sylvia Ratnasamy, and Scott Shenker. Can heterogeneity make Gnutellascalable? In International workshop on Peer-To-Peer Systems, volume 2429, pages94–103, 2002. (Cited on page 24)
[236] Evaristus Mainsah. Autonomic computing: the next era of computing. ElectronicsCommunication Engineering Journal, 14(1):2–3, 2002. (Cited on pages 77 and 80)
[237] Madhavi Maiya, Sai Dasari, Ravi Yadav, Sandhya Shivaprasad, and Dejan Milojicic.Quantifying manageability of cloud platforms. In 5th IEEE International Conferenceon Cloud Computing, pages 993–995, 2012. (Cited on page 55)
[238] Attila Csaba Marosi, Gabor Kecskemeti, Attila Kertesz, and Peter Kacsuk. FCM: anarchitecture for integrating IaaS cloud systems. In 2nd International Conference onCloud Computing, GRIDs, and Virtualization, pages 7–12, 2011. (Cited on page 60)
[239] Moreno Marzolla, Ozalp Babaoglu, and Fabio Panzieri. Server consolidation inclouds through gossiping. In IEEE International Symposium on a World of Wireless,Mobile and Multimedia Networks, pages 1–6. IEEE Computer, 2011. (Cited onpages 40, 80, 88, and 213)
[240] Matthew L. Massie, Brent N. Chun, and David E. Culler. The Ganglia distributedmonitoring system: Design, implementation and experience. Parallel Computing, 30(7):817–840, 2003. (Cited on page 53)
[241] Petar Maymounkov and David Mazières. Kademlia: A peer-to-peer informationsystem based on the XOR metric. In First International Workshop on Peer-to-PeerSystems, pages 53–65, 2002. (Cited on page 25)
[242] Piyush Mehrotra, Jahed Djomehri, Steve Heistand, Robert Hood, Haoqiang Jin,Arthur Lazanoff, Subhash Saini, and Rupak Biswas. Performance evaluation ofAmazon EC2 for NASA HPC applications. In 3rd Workshop on Scientific CloudComputing Date, pages 41–50, 2012. (Cited on page 164)
[243] Peter Mell and Timothy Grance. The NIST definition of Cloud Computing, NationalInstitute of Standards and Technology. Technical Report SP800-145, NIST Informa-tion Technology Laboratory, 2011. URL csrc.nist.gov/publications/nistpubs/
800-145/SP800-145.pdf. Last accessed in January 2014. (Cited on pages 29, 30,45, 46, and 47)
[244] Alexandre Mello Ferreira, Kyriakos Kritikos, and Barbara Pernici. Energy-awaredesign of service-based applications. In Service-Oriented Computing, volume 5900,pages 99–114. Springer-Verlag, 2009. (Cited on page 90)
[245] Víctor Méndez Muñoz, Adrian Casajús Ramo, Víctor Fernández Albor, RicardoGraciani Diaz, and Gonzalo Merino Arévalo. Rafhyc: An architecture for constructingresilient services on federated hybrid clouds. Journal of Grid Computing, 11(4):753–770, 2013. (Cited on pages 66, 67, and 74)
240

Bibliography
[246] Kaisa Miettinen. Introduction to multiobjective optimization: Noninteractive ap-proaches. In Jürgen Branke, Kalyanmoy Deb, Kaisa Miettinen, and Roman Słowiński,editors, Multiobjective Optimization, volume 5252, pages 1–26. Springer Berlin Hei-delberg, 2008. (Cited on page 151)
[247] R. Mietzner, A. Metzger, F. Leymann, and K. Pohl. Variability modeling tosupport customization and deployment of multi-tenant-aware software as a serviceapplications. In Workshop on Principles of Engineering Service Oriented Systems,pages 18–25, 2009. (Cited on pages 180, 181, 184, and 187)
[248] Dejan Milojicic, Ignacio M. Llorente, and Ruben S. Montero. OpenNebula: A cloudmanagement tool. IEEE Internet Computing, 15(2):11–14, 2011. (Cited on pages 54,55, 60, and 217)
[249] Laurl Minas and Brad Ellison. Energy Efficiency for Information Technology: Howto Reduce Power Consumption in Servers and Data Centers. Intel Press, 2009. (Citedon page 214)
[250] Alan Mislove and Peter Druschel. Providing administrative control and autonomyin structured peer-to-peer overlays. In International workshop on Peer-To-PeerSystems, pages 162–172, 2004. (Cited on page 27)
[251] Isi Mitrani. Service center trade-offs between customer impatience and powerconsumption. Performance Evaluation, 68(11):1222–1231, 2011. (Cited on pages 91and 111)
[252] Anirban Mondal, Yi Lifu, and Masaru Kitsuregawa. P2PR-Tree: An r-tree-basedspatial index for peer-to-peer environments. In International Conference on CurrentTrends in Database Technology, pages 516–525. Springer-Verlag, 2004. (Cited onpage 25)
[253] Rafael Moreno-Vozmediano, Ruben Montero, and Ignacio Llorente. IaaS cloud archi-tecture: From virtualized datacenters to federated cloud infrastructures. Computer,45(12):65–72, 2012. (Cited on page 49)
[254] Mosaic: The First Global Web Browser. www.livinginternet.com/w/wi_mosaic.
htm, 2014. Last accessed in January 2014. (Cited on page 14)
[255] David Mount. Bioinformatics: Sequence and Genome Analysis. Cold Spring HarborLaboratory Press, 1st edition, 2004. (Cited on pages 117 and 122)
[256] Victor Ion Munteanu, Teodor-Florin Fortis, and Adrian Copie. Building a cloudgovernance bus. International Journal of Computers, Communications & Control, 7(5):900–906, 2012. (Cited on page 51)
[257] Mihir Nanavati, Patrick Colp, Bill Aiello, and Andrew Warfield. Cloud security:A gathering storm. Communications of the ACM, 57(5):70–79, 2014. (Cited onpages 33 and 54)
241
Bibliography
[258] Susanta Nanda and Tzi cker Chiueh. A survey of virtualization technologies. TechnicalReport TR–179, Stony Brook University, February 2005. URL www.ecsl.cs.sunysb.
edu/tr/TR179.pdf. Last accessed in February 2014. (Cited on page 37)
[259] Eric Nawrocki and Sean Eddy. INFERNAL user’s guide. selab.janelia.org/
software/infernal/Userguide.pdf, 2014. Last accessed in May 2014. (Cited onpage 137)
[260] Eric P. Nawrocki, Diana L. Kolbe, and Sean R. Eddy. Infernal 1.0: inference of RNAalignments. Bioinformatics, 25(10):1335–1337, 2009. (Cited on page 136)
[261] Mahdi Noorian, Hamidreza Pooshfam, Zeinab Noorian, and Rosni Abdullah. Perfor-mance enhancement of Smith-Waterman algorithm using hybrid model: comparingthe MPI and hybrid programming paradigm on SMP clusters. In IEEE InternationalConference on Systems, Man and Cybernetics, pages 492–497, 2009. (Cited onpages 115 and 127)
[262] Henrik Nordberg, Karan Bhatia, Kai Wang, and Zhong Wang. BioPig: a Hadoop-based analytic toolkit for large-scale sequence data. Bioinformatics, 29(23):3014–3019,2013. (Cited on pages 129, 134, 141, and 143)
[263] Daniel Nurmi, Rich Wolski, Chris Grzegorczyk, Graziano Obertelli, Sunil So-man, Lamia Youseff, and Dmitrii Zagorodnov. The eucalyptus open-source cloud-computing system. In 9th IEEE/ACM International Symposium on Cluster Com-puting and the Grid, pages 124–131, 2009. (Cited on pages 55 and 217)
[264] Anne-Cecile Orgerie, Laurent Lefevre, and Jean-Patrick Gelas. Demystifying energyconsumption in grids and clouds. In International Conference on Green Computing,pages 335–342, 2010. (Cited on page 90)
[265] Anne-Cecile Orgerie, Marcos Dias de Assuncao, and Laurent Lefevre. A survey ontechniques for improving the energy efficiency of large-scale distributed systems.ACM Computing Surveys, 46(4):47:1–47:31, 2014. (Cited on page 90)
[266] Anne-Cecile Orgerie, Marcos Dias de Assuncao, and Laurent Lefevre. A survey ontechniques for improving the energy efficiency of large-scale distributed systems.ACM Computing Surveys, 46(4):47:1–47:31, 2014. (Cited on page 102)
[267] Simon Ostermann, Alexandru Iosup, Nezih Yigitbasi, Radu Prodan, ThomasFahringer, and Dick Epema. A performance analysis of EC2 cloud computingservices for scientific computing. In Cloud Computing, pages 115–131. Springer, 2010.(Cited on pages 147, 164, and 205)
[268] Andrzej Osyczka. Multicriteria optimization for engineering design, pages 193–227.Academic Press, 1985. (Cited on page 151)
[269] Zhonghong Ou, Hao Zhuang, Andrey Lukyanenko, Jukka K. Nurminen, Pan Hui,Vladimir Mazalov, and Antti Ylä-Jääski. Is the same instance type created equal?exploiting heterogeneity of public clouds. IEEE Transactions on Cloud Computing,1(2):201–214, 2013. (Cited on pages 17, 150, and 164)
242

Bibliography
[270] Harris Papadakis, Paolo Trunfio, Domenico Talia, and Paraskevi Fragopoulou. Designand implementation of a hybrid P2P-based grid resource discovery system. In MakingGrids Work, pages 89–101. Springer, 2008. (Cited on page 27)
[271] Michael P. Papazoglou, Paolo Traverso, Schahram Dustdar, and Frank Leymann.Service-oriented computing: State of the art and research challenges. Computer, 40(11):38–45, 2007. (Cited on page 65)
[272] Giuseppe Papuzzo and Giandomenico Spezzano. Autonomic management of work-flows on hybrid grid-cloud infrastructure. In 7th International Conference on Networkand Services Management, pages 230–233. International Federation for InformationProcessing, 2011. (Cited on pages 80, 81, 88, and 213)
[273] Fawaz Paraiso, Nicolas Haderer, Philippe Merle, Romain Rouvoy, and Lionel Sein-turier. A federated multi-cloud PaaS infrastructure. In 5th International Conferenceon Cloud Computing, pages 392–399, 2012. (Cited on pages 63 and 65)
[274] Przemyslaw Pawluk, Bradley Simmons, Michael Smit, Marin Litoiu, and SergeMankovski. Introducing STRATOS: A cloud broker service. In 5th IEEE Interna-tional Conference on Cloud Computing, pages 891–898, 2012. (Cited on pages 65,66, and 74)
[275] Dana Petcu. Portability and interoperability between clouds: Challenges and casestudy. In 4th European Conference on Towards a Service-based Internet, pages 62–74,2011. (Cited on pages 33, 50, and 51)
[276] Dana Petcu. Multi-cloud: Expectations and current approaches. In InternationalWorkshop on Multi-cloud Applications and Federated Clouds, pages 1–6, 2013. (Citedon pages 33 and 52)
[277] Dana Petcu. Consuming resources and services from multiple clouds. Journal ofGrid Computing, pages 1–25, 2014. (Cited on pages 49, 50, 51, 190, and 217)
[278] Dana Petcu, Ciprian Craciun, and Massimiliano Rak. Towards a cross platform cloudAPI. In 1st International Conference on Cloud Computing and Services Science,pages 166–169, 2011. (Cited on pages 50, 63, 74, and 210)
[279] Dana Petcu, BeniaminoDi Martino, Salvatore Venticinque, Massimiliano Rak, TamásMáhr, GorkaEsnal Lopez, Fabrice Brito, Roberto Cossu, Miha Stopar, SvatoplukŠperka, and Vlado Stankovski. Experiences in building a mOSAIC of clouds. Journalof Cloud Computing, 2(1), 2013. (Cited on pages 63 and 64)
[280] Guillaume Pierre and Corina Stratan. ConPaaS: a platform for hosting elastic cloudapplications. IEEE Internet Computing, 16(5):88–92, 2012. (Cited on pages 60and 72)
[281] Eduardo Pinheiro, Ricardo Bianchini, Enrique V. Carrera, and Taliver Heath. Loadbalancing and unbalancing for power and performance in cluster-based systems.Workshop on Compilers and Operating Systems for Low Power, pages 182–195, 2001.(Cited on page 91)
243

Bibliography
[282] Klaus Pohl, Günter Böckle, and Frank J. van der Linden. Software Product LineEngineering: Foundations, Principles and Techniques. Springer-Verlag New York,2005. (Cited on page 147)
[283] Gerald J. Popek and Robert P. Goldberg. Formal requirements for virtualizablethird generation architectures. Communications of the ACM, 17(7):412–421, 1974.(Cited on page 38)
[284] R. Prodan and S. Ostermann. A survey and taxonomy of infrastructure as a serviceand web hosting cloud providers. In 10th IEEE/ACM International Conference onGrid Computing, pages 17–25, 2009. (Cited on pages 162 and 164)
[285] William Pugh. Skip Lists: A probabilistic alternative to balanced trees. Communi-cations of the ACM, 33(6):668–676, 1990. (Cited on page 25)
[286] Flavien Quesnel, Adrien Lèbre, and Mario Südholt. Cooperative and reactive schedul-ing in large-scale virtualized platforms with DVMS. Concurrency and Computation:Practice and Experience, 25(12):1643–1655, 2013. (Cited on pages 83, 84, and 88)
[287] Clément Quinton, Nicolas Haderer, Romain Rouvoy, and Laurence Duchien. Towardsmulti-cloud configurations using feature models and ontologies. In InternationalWorkshop on Multi-cloud Applications and Federated Clouds, pages 21–26, 2013.(Cited on pages 179, 180, 184, and 187)
[288] Clément Quinton, Daniel Romero, and Laurence Duchien. Automated selection andconfiguration of cloud environments using software product lines principles. In 7thIEEE International Conference on Cloud Computing, 2014. (Cited on pages 148,179, 184, and 187)
[289] Asfandyar Qureshi, Rick Weber, Hari Balakrishnan, John Guttag, and Bruce Maggs.Cutting the electric bill for internet-scale systems. In ACM SIGCOMM conferenceon Data communication, pages 123–134, 2009. (Cited on page 113)
[290] S. Rajko and S. Aluru. Space and time optimal parallel sequence alignments. IEEETransactions on Parallel and Distributed Systems, 15(12):1070–1081, 2004. (Citedon pages 115 and 127)
[291] Sylvia Ratnasamy, Paul Francis, Mark Handley, Richard Karp, and Scott Shenker. Ascalable content-addressable network. In Conference on Applications, Technologies,Architectures, and Protocols for Computer Communications, pages 161–172, 2001.(Cited on page 25)
[292] Mikael Ricknäs. Microsoft’s Windows Azure cloud hit by world-wide management interuption. pcworld.com/article/2059901/
microsofts-windows-azure-cloud-hit-by-worldwide-management-interuption.
html, 2013. Last accessed in July 2014. (Cited on page 48)
[293] Matthias Riebisch, Kai Matthias, Böllert, Detlef Streitferdt, and Ilka Philippow.Extending feature diagrams with UML multiplicities. In 6th World Conference onIntegrated Design and Process Technology, volume 50, pages 1–7, 2002. (Cited onpage 156)
244
Bibliography
[294] Suzanne Rivoire, Mehul A. Shah, Parthasarathy Ranganathan, and ChristosKozyrakis. JouleSort: a balanced energy-efficiency benchmark. In ACM SIG-MOD international conference on Management of Data, pages 365–376, 2007. (Citedon page 94)
[295] Suzanne Rivoire, Mehul A. Shah, Parthasarathy Ranganathan, Christos Kozyrakis,and Justin Meza. Models and metrics to enable energy-efficiency optimizations.IEEE Computer, 40(12):39–48, 2007. (Cited on page 93)
[296] B. Rochwerger, D. Breitgand, E. Levy, A. Galis, K. Nagin, I.M. Llorente, R. Montero,Y. Wolfsthal, E. Elmroth, J. Caceres, M. Ben-Yehuda, W. Emmerich, and F. Galan.The Reservoir model and architecture for open federated cloud computing. IBMJournal of Research and Development, 53(4):4:1–4:11, 2009. (Cited on pages 49, 68,69, 74, and 210)
[297] Benny Rochwerger, David Breitgand, Amir Epstein, David Hadas, Irit Loy, KennethNagin, Johan Tordsson, Carmelo Ragusa, Massimo Villari, Stuart Clayman, EliezerLevy, Alessandro Maraschini, Philippe Massonet, Henar Munoz, and Giovanni Tofetti.Reservoir - when one cloud is not enough. Computer, 44(3):44–51, 2011. (Cited onpage 51)
[298] Ivan Rodero, Hariharasudhan Viswanathan, Eun Kyung Lee, Marc Gamell, DarioPompili, and Manish Parashar. Energy-efficient thermal-aware autonomic manage-ment of virtualized HPC cloud infrastructure. Journal of Grid Computing, 10(3):447–473, 2012. (Cited on pages 85, 88, and 213)
[299] Luis Rodero-Merino, Luis M. Vaquero, Victor Gil, Fermín Galán, Javier Fontán,Rubén S. Montero, and Ignacio M. Llorente. From infrastructure delivery to servicemanagement in clouds. Future Generation Computer Systems, 26(8):1226–1240,2010. (Cited on pages 60, 61, and 74)
[300] Paolo Romano, Luis Rodrigues, Nuno Carvalho, and Joäo Cachopo. Cloud-TM:Harnessing the cloud with distributed transactional memories. ACM SIGOPSOperating Systems Review, 44(2):1–6, 2010. (Cited on pages 61, 74, and 210)
[301] Mendel Rosenblum and Tal Garfinkel. Virtual machine monitors: Current technologyand future trends. IEEE Computer, 38:39–47, 2005. (Cited on pages 13 and 38)
[302] Antony I. T. Rowstron and Peter Druschel. Pastry: Scalable, decentralized objectlocation, and routing for large-scale peer-to-peer systems. In IFIP/ACM InternationalConference on Distributed Systems Platforms Heidelberg, pages 329–350, 2001. (Citedon page 25)
[303] Larry Rudolph, Miriam Slivkin-Allalouf, and Eli Upfal. A simple load balancingscheme for task allocation in parallel machines. In 3rd Annual ACM Symposium onParallel Algorithms and Architectures, pages 237–245, 1991. (Cited on page 218)
[304] Stefan T. Ruehl and Urs Andelfinger. Applying software product lines to createcustomizable software-as-a-service applications. In 15th International Software
245

Bibliography
Product Line Conference, pages 16:1–16:4, 2011. (Cited on pages 148, 180, 184,and 187)
[305] Stefan T. Ruehl, Urs Andelfinger, Andreas Rausch, and Stephan A. W. Verclas.Toward realization of deployment variability for software-as-a-service applications.In IEEE 5th International Conference on Cloud Computing, pages 622–629, 2012.(Cited on pages 148, 180, 182, 184, and 187)
[306] Stuart J. Russell and Peter Norvig. Artificial Intelligence: A Modern Approach.Pearson Education, 3rd edition, 2009. (Cited on page 79)
[307] A. Samba. Logical data models for cloud computing architectures. IT Professional,14(1):19–26, 2012. (Cited on page 1)
[308] Thomas Sandholm and Jarek Gawor. Globus Toolkit 3 core-a grid service containerframework. toolkit.globus.org/toolkit/3.0/ogsa/docs/gt3_core.pdf, July2003. Last accessed in January 2014. (Cited on pages 20 and 21)
[309] Sriram Sankar and Kushagra Vaid. Addressing the stranded power problem indatacenters using storage workload characterization. In 1st Joint WOSP/SIPEWInternational Conference on Performance engineering, pages 217–222, 2010. (Citedon page 94)
[310] Sriya Santhanam, Pradheep Elango, Andrea Arpaci-Dusseau, and Miron Livny.Deploying virtual machines as sandboxes for the grid. In 2nd Conference on Real,Large Distributed Systems, pages 7–12, 2005. (Cited on page 213)
[311] Constantine Sapuntzakis and Monica S. Lam. Virtual appliances in the collective:A road to hassle-free computing. In 9th Conference on Hot Topics in OperatingSystems, pages 55–60, 2003. (Cited on page 53)
[312] Yoshikazu Sawaragi, Hirotaka Nakayama, and Tetsuzo Tanino. Theory of Multiob-jective Optimization. Academic Press, 1985. (Cited on page 152)
[313] Julia Schroeter, Peter Mucha, Marcel Muth, Kay Jugel, and Malte Lochau. Dynamicconfiguration management of cloud-based applications. In 16th International SoftwareProduct Line Conference, pages 171–178, 2012. (Cited on pages 148, 182, 183, 184,and 187)
[314] Greg Schulz. The Green and Virtual Data Center. CRC Press, 2009. (Cited onpage 93)
[315] André Schumacher, Luca Pireddu, Matti Niemenmaa, Aleksi Kallio, Eija Korpelainen,Gianluigi Zanetti, and Keijo Heljanko. SeqPig: simple and scalable scripting forlarge sequencing data sets in Hadoop. Bioinformatics, 30(1):119–120, 2014. (Citedon pages 129, 135, and 143)
[316] Glauber Scorsatto and Alba Cristina Magalhães Alves de Melo. GrAMoS: A flexibleservice for WS-agreement monitoring in grid environments. In 14th internationalEuro-Par conference on Parallel Processing, pages 534–543, 2008. (Cited on page 41)
246
Bibliography
[317] Lionel Seinturier, Philippe Merle, Damien Fournier, Nicolas Dolet, Valerio Schiavoni,and Jean-Bernard Stefani. Reconfigurable SCA Applications with the FraSCAtiPlatform. In IEEE International Conference on Services Computing, pages 268–275,2009. (Cited on pages 74 and 210)
[318] Jin Shao and Qianxiang Wang. A performance guarantee approach for cloud appli-cations based on monitoring. In 35th Annual Computer Software and ApplicationsConference Workshops, pages 25–30, 2011. (Cited on page 55)
[319] Yuxiang Shi, Xiaohong Jiang, and Kejiang Ye. An energy-efficient scheme for cloudresource provisioning based on CloudSim. In IEEE International Conference onCluster Computing, pages 595–599, 2011. (Cited on pages 106 and 214)
[320] Jacopo Silvestro, Daniele Canavese, Emanuele Cesena, and Paolo Smiraglia. A unifiedontology for the virtualization domain. In Confederated International Conferenceon On the Move to Meaningful Internet Systems, pages 617–624, 2011. (Cited onpage 162)
[321] Kwang Mong Sim. Agent-based cloud computing. IEEE Transactions on ServicesComputing, 5(4):564–577, 2012. (Cited on pages 83, 84, and 88)
[322] G. Sinevriotis and T. Stouraitis. A novel list-scheduling algorithm for the low-energyprogram execution. In IEEE International Symposium on Circuits and Systems,volume 4, pages IV–97–IV–100, 2002. (Cited on page 91)
[323] A. Singh and Ling Liu. A hybrid topology architecture for P2P systems. In13th International Conference on Computer Communications and Networks, pages475–480, 2004. (Cited on pages 26 and 28)
[324] Rahul Singh, David Irwin, Prashant Shenoy, and K. K. Ramakrishnan. Yank:Enabling green data centers to pull the plug. In 10th USENIX Conference onNetworked Systems Design and Implementation, pages 143–156, 2013. (Cited onpages 92 and 113)
[325] Dinkar Sitaram and Geetha Manjunath. Moving To The Cloud: Developing Apps inthe New World of Cloud Computing. Syngress Publishing, 2011. (Cited on pages 35and 37)
[326] Larry Smarr and Charles E. Catlett. Metacomputing. Communications of the ACM,35(6):44–52, 1992. (Cited on pages 4, 14, and 219)
[327] T. F. Smith and M. S. Waterman. Identification of common molecular subsequences.Journal of Molecular Biology, 147:195–197, 1981. (Cited on pages 115 and 117)
[328] Borja Sotomayor, Ruben S. Montero, Ignacio M. Llorente, and Ian Foster. Virtualinfrastructure management in private and hybrid clouds. IEEE Internet Computing,13(5):14–22, 2009. (Cited on pages 47 and 55)
[329] Ilango Sriram. SPECI, a simulation tool exploring cloud-scale data centres. In1st International Conference on Cloud Computing, pages 381–392, 2009. (Cited onpage 32)
247

Bibliography
[330] Edward Stanford. Environmental trends and opportunities for computer systempower delivery. In 20th International Symposium on Power Semiconductor Devicesand IC’s, pages 1–3, 2008. (Cited on pages 2 and 89)
[331] John R. Stanley, Kenneth G. Brill, and Jonathan Koomey. Four metrics define datacenter ’greenness’: Enabling users to quantify energy consumption initiatives forenvironmental sustainability and bottom line profitability. Technical report, UptimeInstitute, 2007. URL uptimeinstitute.org/component/docman/doc_download/
16-four-metrics-define-data-center-greenness. Last accessed in April 2014.(Cited on pages 95, 96, and 97)
[332] Ion Stoica, Robert Morris, David Karger, M. Frans Kaashoek, and Hari Balakrish-nan. Chord: A scalable peer-to-peer lookup service for internet applications. InConference on Applications, Technologies, Architectures, and Protocols for ComputerCommunications, pages 149–160, 2001. (Cited on pages 25, 26, 27, and 196)
[333] Balaji Subramaniam and Wu-chun Feng. The green index: A metric for evaluatingsystem-wide energy efficiency in hpc systems. In IEEE 26th International on Paralleland Distributed Processing Symposium Workshops PhD Forum, pages 1007–1013,2012. (Cited on page 93)
[334] Chandrasekar Subramanian, Arunchandar Vasan, and Anand Sivasubramaniam.Reducing data center power with server consolidation: Approximation and evaluation.In International Conference on High Performance Computing, pages 1–10, 2010.(Cited on page 102)
[335] Francis Sullivan. Cloud computing for the sciences. Computing in Science andEngineering, 11(4):10–11, 2009. (Cited on page 35)
[336] Xin Sun, Yong Tian, Yushu Liu, and Yue He. An unstructured P2P network model forefficient resource discovery. In First International Conference on the Applications ofDigital Information and Web Technologies, pages 156–161, 2008. (Cited on page 27)
[337] Vaibhav Sundriyal, Masha Sosonkina, Fang Liu, and Michael W. Schmidt. Dynamicfrequency scaling and energy saving in quantum chemistry applications. In IEEEInternational Symposium on Parallel and Distributed Processing Workshops andPhD Forum, pages 837–845, 2011. (Cited on page 91)
[338] Hassan Takabi, James B. D. Joshi, and Gail-Joon Ahn. Security and privacychallenges in cloud computing environments. IEEE Security and Privacy, 8(6):24–31,2010. (Cited on pages 32 and 33)
[339] Le Nhan Tam, Gerson Sunyé, and Jean-Marc Jezequel. A model-based approachfor optimizing power consumption of IaaS. In 2nd Symposium on Network CloudComputing and Applications, pages 31–39, 2012. (Cited on pages 148, 175, 184,and 187)
[340] Le Nhan Tam, Gerson Sunyé, and Jean-Marc Jézéquel. A model-driven approach forvirtual machine image provisioning in cloud computing. In 1st European Conference
248
Bibliography
on Service-Oriented and Cloud Computing, pages 107–121, 2012. (Cited on pages 148,175, 176, 184, and 187)
[341] Andrew S. Tanenbaum and Maarten van Steen. Distributed Systems: Principles andParadigms. Prentice-Hall, 2nd edition, 2006. (Cited on pages 11, 12, and 17)
[342] Peiyi Tang and Pen-Chung Yew. Processor self-scheduling for multiple-nested parallelloops. In International Conference on Parallel Processing, pages 528–535, 1986.(Cited on pages 195 and 201)
[343] Andrei Tchernykh, Johnatan E. Pecero, Aritz Barrondo, and Elisa Schaeffer. Adaptiveenergy efficient scheduling in peer-to-peer desktop grids. Future Generation ComputerSystems, 2013. (Cited on page 91)
[344] Ralf Teckelmann, Christoph Reich, and Anthony Sulistio. Mapping of cloud standardsto the taxonomy of interoperability in IaaS. In 3rd International Conference onCloud Computing Technology and Science, pages 522–526, 2011. (Cited on page 54)
[345] Thomas Thum, Christian Kastner, Sebastian Erdweg, and Norbert Siegmund. Ab-stract features in feature modeling. In 15th International Software Product LineConference, pages 191–200, 2011. (Cited on page 155)
[346] Adel Nadjaran Toosi, Rodrigo N. Calheiros, and Rajkumar Buyya. Interconnectedcloud computing environments: Challenges, taxonomy, and survey. ACM ComputingSurveys, 47(1):7:1–7:47, 2014. (Cited on page 146)
[347] Joe Touch. Overlay networks. Computer Networks, 36(2–3):115–116, 2001. (Citedon page 23)
[348] Pablo Trinidad, David Benavides, Antonio Ruiz-Cortés, Sergio Segura, and AlbertoJimenez. FAMA Framework. In 12th International Software Product Line Conference,pages 359–359, 2008. (Cited on page 184)
[349] P. Trunfio, D. Talia, H. Papadakis, P. Fragopoulou, M. Mordacchini, M. Pennanen,K. Popov, V. Vlassov, and S. Haridi. Peer-to-peer resource discovery in grids: Modelsand systems. Future Generation Computer Systems, 23(7):864–878, 2007. (Cited onpages 19 and 29)
[350] Dimitrios Tsoumakos and Nick Roussopoulos. A comparison of peer-to-peer searchmethods. In 6th International Workhop on the Web and Databases, 2003. (Cited onpages 24 and 28)
[351] R. Uhlig, G. Neiger, D. Rodgers, A.L. Santoni, F.C.M. Martins, A.V. Anderson,S.M. Bennett, A. Kagi, F.H. Leung, and L. Smith. Intel virtualization technology.IEEE Computer, 38(5):48–56, 2005. (Cited on page 40)
[352] David A. Van Veldhuizen and Gary B. Lamont. Multiobjective evolutionary algo-rithms: Analyzing the state-of-the-art. Evolutionary Computation, 8(2):125–147,2000. (Cited on pages 151, 152, and 153)
249
Bibliography
[353] Luis M. Vaquero, Luis Rodero-Merino, Juan Caceres, and Maik Lindner. A break inthe clouds: towards a cloud definition. ACM SIGCOMM Computer CommunicationReview, 39(1):50–55, 2008. (Cited on pages 29 and 162)
[354] Carlos Varela and Gul Agha. Programming dynamically reconfigurable open systemswith SALSA. ACM SIGPLAN Notices, 36(12):20–34, 2001. (Cited on page 66)
[355] P. Verissimo, A. Bessani, and M. Pasin. The TClouds architecture: Open andresilient cloud-of-clouds computing. In IEEE/IFIP 42nd International Conferenceon Dependable Systems and Networks Workshops, pages 1–6, 2012. (Cited on pages 63,65, 74, and 210)
[356] Akshat Verma, Puneet Ahuja, and Anindya Neogi. pmapper: Power and migrationcost aware application placement in virtualized systems. In ACM/IFIP/USENIXInternational Conference on Middleware, pages 243–264, 2008. (Cited on pages 111and 113)
[357] David Villegas, Norman Bobroff, Ivan Rodero, Javier Delgado, Yanbin Liu, AdityaDevarakonda, Liana Fong, S. Masoud Sadjadi, and Manish Parashar. Cloud federationin a layered service model. Journal of Computer and System Sciences, 78(5):1330–1344, 2012. (Cited on page 51)
[358] Werner Vogels. Beyond server consolidation. Jounal of ACM Queue, 6(1):20–26,2008. (Cited on page 40)
[359] William Voorsluys, James Broberg, Srikumar Venugopal, and Rajkumar Buyya.Cost of virtual machine live migration in clouds: A performance evaluation. In1st International Conference on Cloud Computing, pages 254–265, 2009. (Cited onpage 41)
[360] QuangHieu Vu, Mihai Lupu, and BengChin Ooi. Routing in peer-to-peer networks.In Peer-to-Peer Computing, pages 39–80. Springer, 2010. (Cited on pages 25 and 34)
[361] Marc Waldman, Aviel Rubin, and Lorrie Cranor. Publius: A robust, tamper-evident,censorship-resistant web publishing system. In 9th USENIX Security Symposium,pages 59–72, 2000. (Cited on page 24)
[362] Carl A. Waldspurger. Memory Resource Management in VMware ESX Server.Symposium on operating systems design and implementation, 36(SI):181–194, 2002.(Cited on page 38)
[363] Stefan Walraven, Dimitri Van Landuyt, Eddy Truyen, Koen Handekyn, and WouterJoosen. Efficient customization of multi-tenant software-as-a-service applicationswith service lines. Journal of Systems and Software, 91:48–62, 2014. (Cited onpages 183, 184, and 187)
[364] Cong Wang, Qian Wang, Kui Ren, Ning Cao, and Wenjing Lou. Toward secure anddependable storage services in cloud computing. IEEE Transactions on ServicesComputing, 5:220–232, 2012. (Cited on pages 32 and 34)
250

Bibliography
[365] Lei Wang, Jianfeng Zhan, Weisong Shi, and Yi Liang. In cloud, can scientificcommunities benefit from the economies of scale? IEEE Transactions on Paralleland Distributed Systems, 23(2):296–303, 2012. (Cited on page 32)
[366] Lizhe Wang and Samee Khan. Review of performance metrics for green data centers:a taxonomy study. The Journal of Supercomputing, pages 1–18, 2011. (Cited onpage 92)
[367] Lizhe Wang, Gregor Laszewski, Andrew Younge, He Xi, Marcel Kunze, Tao Jie, andFu Cheng. Cloud computing: a perspective study. New Generation Computing, 28(2):137–146, 2010. (Cited on page 41)
[368] Lizhe Wang, Gregor von Laszewski, Marcel Kunze, Jie Tao, and Jai Dayal. Providevirtual distributed environments for grid computing on demand. Advances inEngineering Software, 41(2):213–219, 2010. (Cited on page 213)
[369] Ucilia Wang. Microsoft pledges to be carbon neutral starting this summer. gigaom.
com/2012/05/08/microsoft-pledges-to-be-carbon-neutral-by-the-summer,2012. Last accessed in July 2014. (Cited on page 92)
[370] Dan Werthimer, Jeff Cobb, Matt Lebofsky, David Anderson, and Eric Korpela.SETI@Home–massively distributed computing for SETI. IEEE Computing in Scienceand Engineering, 3(1):78–83, 2001. (Cited on pages 11 and 34)
[371] James Robert White, Malcolm Matalka, W. Florian Fricke, and Samuel V. Angiuoli.Cunningham: a BLAST runtime estimator. Nature Precedings, pages 1–6, 2011.(Cited on page 141)
[372] Bhathiya Wickremasinghe, Rodrigo N. Calheiros, and Rajkumar Buyya. CloudAna-lyst: A CloudSim-based visual modeller for analysing cloud computing environmentsand applications. In 24th IEEE International Conference on Advanced InformationNetworking and Applications, pages 446–452, 2010. (Cited on page 32)
[373] Erik Wittern, Jörn Kuhlenkamp, and Michael Menzel. Cloud service selectionbased on variability modeling. In 10th International Conference on Service-OrientedComputing, pages 127–141, 2012. (Cited on page 148)
[374] Michael Wooldridge. An Introduction to MultiAgent Systems. Wiley Publishing, 2ndedition, 2009. (Cited on page 102)
[375] Linlin Wu, Saurabh Kumar Garg, and Rajkumar Buyya. SLA-based resourceallocation for software as a service provider (SaaS) in cloud computing environments.In 11th IEEE/ACM International Symposium on Cluster, Cloud and Grid Computing,pages 195–204, 2011. (Cited on pages 106 and 214)
[376] Yunjing Xu, Zachary Musgrave, Brian Noble, and Michael Bailey. Bobtail: Avoidinglong tails in the cloud. In 10th USENIX Conference on Networked Systems Designand Implementation, pages 329–342, 2013. (Cited on page 17)
251
Bibliography
[377] Min Yang and Yuanyuan Yang. An efficient hybrid peer-to-peer system for distributeddata sharing. IEEE Transactions on Computers, 59(9):1158–1171, 2010. (Cited onpage 27)
[378] Sami Yangui, Iain-James Marshall, Jean-Pierre Laisne, and Samir Tata. Compati-bleOne: The open source cloud broker. Journal of Grid Computing, 12(1):93–109,2014. (Cited on page 54)
[379] Yuan Yao, Longbo Huang, Abhishek Sharma, Leana Golubchik, and Michael Neely.Power cost reduction in distributed data centers: A two-time-scale approach fordelay tolerant workloads. IEEE Transactions on Parallel and Distributed System, 25(1):200–211, 2014. (Cited on page 113)
[380] Stephen S. Yau, Yu Wang, and Fariaz Karim. Development of situation-aware appli-cation software for ubiquitous computing environments. In 26th Annual InternationalComputer Software and Applications Conference, pages 233–238, 2002. (Cited onpage 200)
[381] Sungkap Yeo and Hsien-Hsin Lee. Using mathematical modeling in provisioning aheterogeneous cloud computing environment. IEEE Computer, 44(8):55–62, 2011.(Cited on page 91)
[382] Christos A. Yfoulis and Anastasios Gounaris. Honoring SLAs on cloud computingservices: a control perspective. In EUCA/IEEE European Control Conference, 2009.(Cited on page 41)
[383] Lamia Youseff, Maria Butrico, and Dilma da Silva. Toward a unified ontology ofcloud computing. In Grid Computing Environments Workshop, pages 1–10, 2008.(Cited on page 162)
[384] Chi Zhang and Arvind Krishnamurthy. Skipindex: Towards a scalable peer-to-peerindex service for high dimensional data. Technical Report TR-703-04, PrincetonUniversity, 2004. (Cited on page 25)
[385] Qi Zhang, Lu Cheng, and Raouf Boutaba. SWPS3 fast multi-threaded vectorizedSmith-Waterman for IBM Cell/B.E. and x86/SSE2. BMC Research Notes, 1:107–110,2008. (Cited on pages 115 and 127)
[386] Qi Zhang, Lu Cheng, and Raouf Boutaba. Cloud computing: state-of-the-art andresearch challenges. Journal of Internet Services and Applications, 1:7–18, 2010.(Cited on pages 29, 30, 31, 45, and 46)
[387] Qi Zhang, Eren Gürses, Raouf Boutaba, and Jin Xiao. Dynamic resource allocationfor spot markets in clouds. In 11th USENIX Conference on Hot Topics in Manage-ment of Internet, Cloud, and Enterprise Networks and Services, pages 1–6, 2011.(Cited on pages 106 and 214)
[388] Shuai Zhang, Xuebin Chen, Shufen Zhang, and Xiuzhen Huo. The comparisonbetween cloud computing and grid computing. In International Conference onComputer Application and System Modeling, volume 11, pages V11–72–V11–75, 2010.(Cited on pages 16, 35, and 212)
252

Bibliography
[389] Tianle Zhang, Zhihui Du, Yinong Chen, Xiang Ji, and Xiaoying Wang. Typicalvirtual appliances: An optimized mechanism for virtual appliances provisioning andmanagement. Journal of Systems and Software, 84(3):377–387, 2011. (Cited onpages 148, 177, 184, and 187)
[390] Zhizhong Zhang, Chuan Wu, and David W.L. Cheung. A survey on cloud interop-erability: Taxonomies, standards, and practice. ACM SIGMETRICS PerformanceEvaluation Review, 40(4):13–22, 2013. (Cited on pages 51 and 54)
[391] Ben Y. Zhao, Ling Huang, Jeremy Stribling, Sean C. Rhea, Anthony D. Joseph, andJohn Kubiatowicz. Tapestry: a resilient global-scale overlay for service deployment.IEEE Journal on Selected Areas in Communications, 22(1):41–53, 2004. (Cited onpage 25)
[392] Yong Zhao, Xubo Fei, I. Raicu, and Shiyong Lu. Opportunities and challenges inrunning scientific workflows on the cloud. In CyberC, pages 455–462, 2011. (Citedon pages 2, 54, 129, 141, and 146)
[393] Liang Zhou, Baoyu Zheng, Jingwu Cui, and Sulan Tang. Toward green service incloud: From the perspective of scheduling. In International Conference on Computing,Networking and Communications, pages 939–943, 2012. (Cited on pages 112 and 113)
[394] Eckart Zitzler. Evolutionary algorithms for multiobjective optimization: methodsand applications. PhD thesis, Swiss Federal Institute of Technology (ETH), Zurich,Switzerland, 1999. (Cited on page 152)
[395] Stefan Zoels, Zoran Despotovic, and Wolfgang Kellerer. On hierarchical DHT systems- an analytical approach for optimal designs. Computer Communications, 31(3):576–590, 2008. (Cited on page 27)
253