a watershed action plan - haywood waterways
TRANSCRIPT

A WATERSHED ACTION PLAN
FOR THE PIGEON RIVER WATERSHED
OPTIONS FOR IMPROVING OUR WATER
QUALITY
HAYWOOD COUNTY, NORTH CAROLINA
Created By:
Haywood Waterways Association’s
Technical Advisory Committee

2
The Pigeon River Watershed Action Plan is the coordinated effort of Haywood Waterways Association’s Technical Advisory Committee which is composed of agencies, organizations, and
individuals with skills and/or interest in nonpoint source water quality issues. The report also reflects
perspectives shared by residents of the County.
This Plan was adopted on March 7, 2002 and is a living document. It is updated as additional strategies
develop or new information is obtained. The most recent revision was completed in May, 2014.
Additional copies of the Haywood County Watershed Action Plan can be obtained by contacting the
Haywood Waterways Association at [email protected].

3
TABLE OF CONTENTS
Page
Executive Summary ............................................................................................................................ 4
Watershed Perspectives ....................................................................................................................... 7
Natural Setting ........................................................................................................................ 7
Land Use Trends ..................................................................................................................... 8 Clean Water: To Be or Not To Be ..........................................................................................12
Water Quality Measurements..............................................................................................................14
Sources of Nonpoint Pollution ............................................................................................................24
Pigeon River ..........................................................................................................................25
Upper Pigeon .........................................................................................................................29 Lower Pigeon.........................................................................................................................32
Richland Creek ......................................................................................................................35
Jonathan Creek ......................................................................................................................39
Reducing Sediment.............................................................................................................................42
Financial and Technical Assistance.....................................................................................................45
Financial Assistance
Technical Assistance
Other Options for Nonpoint Pollution Abatement ...............................................................................47
Research, Training, and Education
Incentives Regulations and Ordinances
Monitoring and Enforcement
Recommended Strategies ....................................................................................................................52
Action Plan Addendum ......................................................................................................................57
Literature Cited ..................................................................................................................................73
List of Tables
Table 1. Waynesville Climate Summary.8
Table 2. VWIN Classification Grades Based on Parameters and Ranges.17
Table 3. Pigeon River Streams Ranked Against All WNC VWIN Sample Sites.19 Table 4. Basinwide Benthic Macroinvertebrate Monitoring Sites in French Broad River Sub-basin.
Table 5. List of existing public awareness programs.
Table 6. Methods for expanding Haywood Waterways’ public awareness program.

4
Page
List of Figures Figure 1. Pigeon River Watershed Map6
Figure 2. Haywood County Population Trends, 1850-2000.
Figure 3. Railroad logging on lands that were to become part of the Pisgah National Forest.
Figure 4. Number of acres of cropland in Haywood County, 1880-1997. Figure 5. A comparison of annual hardwood harvest, 1895-1930 to 1997.
Figure 6. The number of single family dwelling construction per year in Haywood County, 1989-1998.
Figure 7. VWIN Volunteer Robin Minick samples water in Allen Creek. Figure 8. Volunteer Water Information Network (VWIN) Sample Locations.16
Figure 9. Soil Loss by Land Use.
Figure 10. Sources of Sediment to Streams in the Pigeon River Watershed. Figure 11. Severe erosion from an unpaved road.
Figure 12. Example of IPSI data.
Figure 13. Upper Pigeon Subwatershed Map.30
Figure 14. Sources of Sediment to Streams in the Upper Pigeon River Subwatershed. Figure 15. Lower Pigeon Subwatershed Map.33
Figure 16. Sources of Sediment to Streams in the Lower Pigeon River Subwatershed.
Figure 17. Richland Creek Subwatershed Map.37 Figure 18. Sources of Sediment to Streams in the Richland Creek Subwatershed.
Figure 19. Jonathan Creek Subwatershed Map.40
Figure 20. Sources of Sediment to streams in the Jonathon Creek Subwatershed. Figure 21. Agricultural site in Elk Garden, VA before and after pasture and stream BMPs were installed.
List of Appendices
North Carolina Surface Water Classifications for the Pigeon River ......................................Appendix I
Summary of Technical and Financial Assistance Programs available in Haywood County,
North Carolina.....................................................................................................................Appendix II
Glossary ..............................................................................................................................Appendix III
Technical Advisory Committee Membership ...................................................................... Appendix IV
About Haywood Waterways Association, Inc. .....................................................................Appendix V
5
Executive Summary
The Pigeon River Watershed Action Plan outlines several approaches to improve surface water quality in
the Pigeon River Watershed of Haywood County, North Carolina. This 343,077-acre watershed is
completely contained within the county. All nonpoint source pollution in this watershed is the result of
actions that Haywood County residents have done or allowed to happen to their watershed. However, unlike many areas, Haywood County can have the water quality it wants because no other jurisdictions
can affect its water. At present, the water quality in this watershed is highly variable. The water quality of
some streams is among the highest in the State of North Carolina, but in others it is so degraded that it does not meet the State’s designated use classifications.
The Plan provides an overview of the natural and land use history of the watershed. The conditions we see today reflect changes in the watershed over almost 200 years of history. These changing conditions
also highlight land use trends. They provide a snapshot of where we have been and where we appear to be
going today. It tells us where we need to focus the most attention and resources to minimize the adverse
consequences of the ongoing land use changes. In this watershed, the emphasis is rapidly moving from agriculture to residential development. For the purpose of this plan and the public participation process,
the Pigeon River Watershed was divided into four major subwatersheds: the Upper Pigeon, Lower
Pigeon, Richland Creek, and Jonathan Creek watersheds. The plan summarizes information for each subwatershed, ranging from the water and land uses to the relative significance of pollutant sources.
Many agencies have been collecting water quality data for several years. This data provides evidence of the most significant problem areas and identifies data gaps to address in the future. This water quality
information helps prioritize areas needing the greatest attention to address current concerns. Sediment is
the most significant nonpoint source pollutant in the Pigeon River Watershed.
The Plan includes the results of two Integrated Pollutant Source Identification surveys obtained by
Haywood Waterways Association (HWA) in 1999 and 2006. This nonpoint source pollutant modeling
software identifies the locations and land uses degrading water quality. This data has been quantified within a geographic information system model, providing an effective watershed analysis tool. The
primary sources of sediment in the watershed are eroding stream banks, unpaved roads, pasture in poor
condition, and animal access to streams.
The Plan summarizes options for addressing the water quality issues in this watershed. These options
range from the public awareness and technical assistance efforts currently underway, to possibilities that
would substantially change the way developments are approved and permitted. From this list of options, HWA’s Technical Advisory Committee (TAC) has selected 14 strategies to improve water quality.
Each strategy has a series of action plans. The action plans recognize that there are work priorities but the factors driving them vary. For example, removing all streams from the NC list of impaired waterways,
reducing sediment in Lake Junaluska, and improving water quality in the Fines Creek and Rush Fork
Creek areas would be priorities. However, any work that implements, demonstrates or tests best
management practices and improves water quality in the Pigeon River Watershed would be work worth doing. The targets and goals within these action plans are based on priorities as well as the availability of
the skills needed to get the work done. Some general assumptions were made as to the interest and
willingness of landowners to participate in the various cost-share programs.
This Plan is the coordinated effort of the HWA’s TAC which is composed of agencies, organizations, and
individuals with skills and/or interest in nonpoint source water quality issues. The report also reflects perspectives shared by participants at public forums, as well as contacts with individual landowners. It is
a living document and will be updated as additional strategies develop or new information is obtained.
6
Watershed Perspectives
Natural Setting
The Pigeon River drains practically all of Haywood County (Figure 1). The headwaters arise in Haywood
County and create a unique situation for County residents. We are in control of our own water quality. For the most part, we do not get any trash, sediment, or other pollutants from outside the County. Whatever is
in the water, we put there.
The Pigeon River’s headwaters gather along the southern boundary of the County and flow northwest into
Cocke County, Tennessee. The Pigeon River Watershed in Haywood County contains 343,077 acres.
Almost 40% of this acreage (132,172 acres) is in public ownership. The physiography of this watershed consists of mountain ranges, intermountain hills, coves, floodplains, and stream terraces. The
mountainous terrain is generally very steep, with terraces and flood plains ranging from nearly level to
moderately steep. Elevations in the watershed range from 6,621 feet at the top of Mount Guyot, to about
1,400 feet where the river leaves Haywood County at Waterville, TN. The average elevation in Haywood County is among the highest in the eastern United States, with 18 mountain peaks over 6,000 feet.
This watershed is located in the Southern Blue Ridge Province of the Appalachian Mountain System. The Appalachian Mountain System in the United States extends from Maine to Georgia. The Southern Blue
Ridge Province in western North Carolina is composed of several mountain ranges. The province is
bounded by the Blue Ridge Mountains on the eastern edge and the Great Smoky Mountains to the west. Most of the Pigeon River Watershed is located along the highly dissected eastern slopes and base of the
Great Smokies, and the northwestern headwaters of the watershed rise into the Great Smokies. The Great
Balsams and Plott Balsams bound the southern headwaters of the watershed.
There are several major rock divisions exposed within the Pigeon River Watershed. The west and east
forks of the Pigeon River, as well as portions of the headwaters of Richland Creek, are underlain by rocks
of the Ashe Metamorphic Suite. The rocks in this suite were created some 700 million years ago from sediment layers of gravel, sand, and silt. These layers, after they were buried, compressed, and lithified
into rock, were eventually metamorphosed to form the present-day mica gneisses and schists of the unit.
Migmatitic zones of quartz and feldspar, also created during metamorphism, give much of the rock a
"marble cake" appearance. Much of Richland Creek is underlain by much older biotite gneiss, representing, in part, what geologists refer to as 1.1 billion-year-old "basement" rock. This area of
basement rock extends down Richland Creek and includes much of the Waynesville area and middle
sections of the Pigeon River. Exposures of younger (~700 million years old) metagraywacke, schist, and quartzite of the Great Smoky and Snowbird Groups underlie the balance of the watershed to the north.
There are two general geologic concerns related to engineering and construction in these geologic units. The first is the presence of "hot rocks"—zones of pyritic and sulfitic rocks, which, when exposed to the
atmosphere and begin to weather, produce weak acid. This solution then enters the streams and increases
the acidity, endangering aquatic life. The second concern is jointing in the rock. Joints are natural breaks
in the rock mass. Road construction, or any other type of excavation, can expose intensely jointed, unstable rock, which can fail during rainstorms, creating rock and mudslides. Interstate 40 provides
several examples of this type of problem.
The varied terrain and elevation of the Pigeon River Watershed account for interesting and varied climatic
conditions. Precipitation varies depending on elevation. Reliable climatic data has only been gathered for
the more populated locations at the lower elevations (Table 1). However, precipitation generally increases at higher elevations, and upper elevation temperatures are considerably cooler than lower elevations along
major stream courses. It is not unusual to find a 15 to 20° F temperature range in summer between lower

7
Figure 1. Pigeon River Watershed Map

8
Table 1. Waynesville Climate Summary
Parameter Annual Average
January temperature (F) 39
Rainfall (inches) 45
June temperature (F) 71
Snowfall (inches) 13
Days temperature < 32 degrees 111
Source: National Climatic Data Center (Asheville); LINC
and upper elevations. This basin receives more rainfall than many other regions of the United States, which helps produce the abundant and diverse plant life that is so characteristic of this area. It insures that
most all of our streams are perennial and support miles of excellent trout streams. The ample rainfall also
increases the potential for erosion and creates special challenges for stormwater management.
The soils in this watershed are generally moderately deep to deep and loamy. Most are well drained.
Slope is a major limiting factor affecting land use. Soil instability, depth to soft bedrock, and the presence
of mica in some soils can also be limiting factors to some of the more intensive land uses. For example, Fannin soils have been identified as having a high content of mica. Careless building on such sites can
lead to settling and slope-related failures.
On the other hand, the productive soils, combined with a moderate climate and ample precipitation, encourage a great variety of vegetative growth. Many agricultural crops can be and have been grown in
the area. The climatic diversity and productive sites also create tremendous natural vegetative diversity.
The Southern Blue Ridge Ecoregion is one of the most biologically significant in the United States. There are as many as 130 different species of flowering trees and 11 conifers in the southern Appalachians -
more species than exist in all of Europe. There are also nearly 400 rare plant species.
Land Use Trends
When the Europeans first arrived on the scene, they found streams of outstanding quality. From all
reports, fish abounded in the streams. While Native American activities would have had some minimal impact on the watershed, the first substantive changes started in the early 1800s with European
settlement. Based on our best estimates, naturally occurring erosion contributes about 200 pounds or 0.1
ton per acre of sediment per year to area waters. Since the early European settlement, several “generations” of land use have dramatically increased the affects on our local watersheds.
Unlike some areas in our nation, Haywood County has generally experienced a steady population growth since its inception (Figures 2 and 3). The areas of population concentration in the County have changed
over the years, but the County has continued to grow since 1808. Population growth is significant,
because it creates pressure for change in watershed conditions - whether for agricultural use, residential
use, roads, commercial uses and other activities.
The nature of the land use associated with this growth is significant. Through much of the 1800s the
pattern was one of increasing agricultural use. As land was cleared for farming, sedimentation increased depending on the types of agricultural practices and the consideration given the streams and creek banks.
The soils and climate were well suited to growing a great variety of products. In the 1800s, these crops
included apples, buckwheat, grapes, grasses, Irish and sweet potatoes, vegetables, burley tobacco, corn,
clover, rye, wheat, alfalfa, barley, lespedeza, peaches, blackberries, dewberries, vetch, and watermelons.

9
0
10000
20000
30000
40000
50000
60000
70000
Haywood County Population Trend
Figure 2. Haywood County Population Trends, 1850-2010
Figure 3. Number of single family dwelling construction per year, Haywood County, 1989-1998;
(Haywood County Building Inspection Department).
0
50
100
150
200
250
300
350
400
1989 1990 1991 1992 1993 1994 1995 1996 1997 1998
New
Ho
use
s/Y
r

10
Livestock production has always been an important component of Haywood County agriculture. In the
early life of the County, some land was cleared for crops, and much of the livestock (primarily cattle and hogs) roamed the surrounding land as open range. By the early 1900s, many farmers had begun to move
toward fenced and improved pasture for their livestock. In 1930, there were more than five times as many
people engaged in farming as in any other industry. In 1933, livestock in the County was valued at more
than $500,000, apples at $250,000, and tobacco at $100,000. In 1999, the total income from agriculture is estimated at $23,939,393, with livestock production accounting for about a third of this revenue.
Agricultural use has been gradually declining over the last 20 years, and gross agricultural revenue has declined 30% in the last 10 years. The Integrated Pollutant Source Identification (IPSI) data indicated
pasture was the second largest category of land use after forests in 1999, with 37,667 acres classified as
some form of pasture. The 2006 data found that number reduced to 31,304 acres. Cropland has also reduced (Figure 4). The 2006 IPSI data (4,617 acres) are nearly identical with 1999, which are
significantly less than the previous 120 years.
Figure 4. Number of cropland acres in Haywood County, 1880-1997.
On January 28, 1882, an event occurred that would usher in one of the most dramatic changes in
watershed condition: the completion of the railroad to Haywood County (Figure 5). This allowed the
enormous timber wealth of Haywood County to be exported outside the area (Figure 6). Timber
corporations purchased large tracts of timberland, and harvested and transported great quantities of wood by a variety of means. Entire watersheds were harvested for all the salable timber. In many cases, major
forest fires burned through the resulting slash piles, further degrading the productivity of the land and
adding to the soil loss problems. Huge quantities of silt and sediment filled local streams, damaging fish habitat. While the steep gradient in many of the Pigeon River streams helps flush out sediments, some
streams do not appear to have fully recovered.
0
5000
10000
15000
20000
25000
30000
35000
40000
45000
1880 1940 1987 1997 1999
Ac
res

11
Figure 3. Railroad logging on lands that were to become part of the Pisgah National Forest
Figure 5. Comparison of annual hardwood harvest, 1895-1930 to 1997. (1895-1930 harvest levels
estimated from limited yield data and documented sawmill activity during the 1895-1930 period; 1997
figures from USDA-FS Resource Bulletin SRS-39).
0
20
40
60
80
100
120
140
160
1895-1930 1997
Millio
ns b
oard
feet

12
The railroads started a land use trend that accelerated with the completion of several major highways and strong economic growth since World War II. In addition to the residential needs of a growing population,
Haywood County became a popular vacation and retirement destination. Many folks preferred to live in
the mountains at higher elevations with the associated views. The result has been a proliferation of roads
and homes on slopes and soils that are not well suited for the use and were seldom used for residential purposes. This shift in land use is creating a significant challenge to water quality, which will continue as
economic activity continues to move away from growing food and fiber to growing roads and houses.
These changes in the Pigeon River Watershed have affected the geomorphology of the streams, the
quality of the water, and the fish and wildlife habitat of the streams. For example, the railroad logging in
the early 1900s caused dramatic changes in some watersheds. The cumulative effect of the construction of the railroads, the intensive logging, and the fires that often followed moved large quantities of topsoil into
the streams. Due to the high gradient (steepness) of many of our streams, much of this material eventually
washed out of Haywood County. However, some of this material can still be seen in the bottom of the
streams in the form of “legacy” sediment. This sediment has degraded the biological potential of our streams to provide a high quality fisheries habitat. However, much of this sediment would be removed
naturally over time if the current rate of sedimentation from present-day activities could be reduced.
Clean Water: To Be or Not To Be
Because Pigeon River surface water in Haywood County originates in Haywood County, we are in the unique situation of being able to decide how clean our water will be. The County is blessed with an
abundance of public lands located on many of the headwaters of the Pigeon River. These lands include
the Great Smoky Mountains National Park located on Cataloochee Creek and the Pisgah National Forest
on the headwaters of the Upper Pigeon River. The Town of Waynesville owns the watershed for its municipal water supply, thus insuring some of the highest quality municipal water in the state.
The presence of these high quality waters contributes to the quality of life for area residents. There are many economic and conservation benefits. For example, Haywood County is recognized as having
excellent trout waters. In addition to contributing to the enjoyment of local residents, this resource draws
thousands of fishermen each year from outside our area. The ability of the Town of Waynesville to
provide high quality water to businesses is a significant benefit to our community. Many agricultural and other activities draw water directly from area streams to support their economic activity. Vegetable
growers generate over $2.5 million each year from their crops in the watershed. The natural beauty of
these high quality waters is an aesthetic value and part of the scenery that draws tens of thousands to our area each year. On another level, these high quality waters are home to rare, threatened and endangred
wildlife species. The presence of high quality, protected waters helps maintain high biological diversity.
However, there is sometimes a sharp contrast between the quality of the water originating from these
publicly owned lands and that in other areas in the County. Activities contributing substantial amounts of
sediment are having a variety of adverse impacts. For example, the managers of the Lake Junaluska
Assembly are no longer able to keep up with the current rate of sedimentation. To remove all the sediment in Lake Junaluska at this time could cost $2 million or more. Even if money can be found to
remove the sediment, it will only be a temporary solution unless the rate of erosion and sedimentation is
reduced. In addition, the presence of substantial sediment loads reduces the trout habitat in Haywood County. Subsequent users of water, either in Haywood County or downstream, incur additional costs to
remove sediment and other pollutants from the water. The erosion that is creating the sediment also
destroys valuable land. In many cases, structures and roads are placed at risk as the eroding stream banks wash out land adjacent to the stream. Valuable agricultural land is at risk. Muddy and silt-choked streams
threaten the natural beauty and aquatic habitats of our area.

13
Water Quality Measurements
The State of North Carolina Surface Water Classifications for the Pigeon River provide some insight as to
water quality conditions. Many streams on public lands have classifications reflecting very high quality
water. Examples include the Outstanding Resource Waters and High Quality Water classifications given
certain streams in the National Park and National Forests as well as Rough Creek near Canton. Many streams have also been designated as trout waters.
The Water Supply Watershed Protection Act was passed in 1989 by the N.C. Legislature to improve protection of surface waters that are used as public drinking water supplies. As a result, the
Environmental Management Commission revised water supply watershed classifications and adopted
minimum watershed protection rules. Municipal and county governments are required to implement these regulations by developing watershed protection plans and ordinances for any water supply watershed
within their jurisdiction. As part of this process, each water supply watershed is assigned one of five
classifications, designated WS-I through WS-V, depending on their watershed characteristics. Watersheds
classified as WS-I are essentially natural, undeveloped, and usually are assigned to publicly owned watersheds. In Haywood County, the Waynesville water supply on Allens Creek is classified as WS-I.
The WS-II through WS-IV classifications apply to watersheds with increasing levels of development. The
Pigeon River Watershed includes two other municipal watersheds classified as WS-III (Canton and Maggie Valley).
At the other end of the spectrum are waters classified as 303(d) streams. Streams in this category do not meet water quality standards for their designated uses and hence are identified as impaired waters. There
are far fewer of these than the higher quality waters. However, they illustrate the wide range of water
quality in the Pigeon River Watershed. Most streams reflect conditions somewhere between the
outstanding waters and the streams listed 303(d). Appendix I summarizes the North Carolina Surface Water Classifications for the Pigeon River Watershed in Haywood County.
A number of organizations and agencies have been gathering water quality data in the Pigeon River Watershed for several years. These include the North Carolina Division of Water Quality, NC Wildlife
Resources Commission, Tennessee Valley Authority, Evergreen Packaging (formerly Champion
International), and HWA’s Volunteer Water Information Network (VWIN).
There are a number of ways to monitor and assess water quality. One approach measures specific
chemical and physical parameters of the water based on periodic samples taken from a stream at a defined
point. Samples are gathered under controlled conditions and analyzed in a qualified laboratory. The resulting information describes what was in the water at the time and place where the sample was taken.
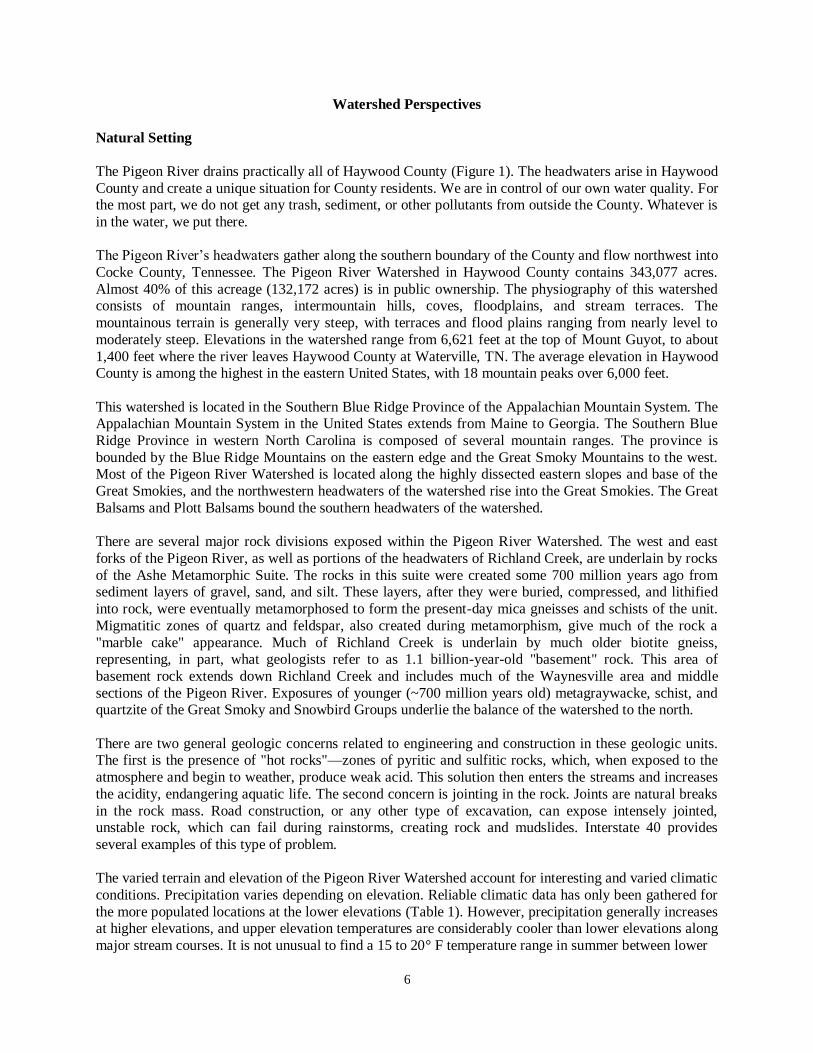
VWIN volunteers have been collecting water quality data in this manner since August of 1996. It began
as an effort funded by the Pigeon River Fund. The first efforts consisted of 12 water quality sampling sites in various watersheds of the Pigeon River. The effort has grown in number to the present 24
monitoring stations in Haywood County. Volunteers collect water samples once a month at the same
location. The samples are analyzed by the Environmental Quality Institute (EQI) in Asheville, NC (a part
of the University of North Carolina at Asheville system). An annual report is produced by EQI at the end of each sampling year.
The EQI tests for pH, alkalinity, turbidity, total suspended solids, conductivity, copper, lead, zinc, orthophosphate, ammonia nitrogen, and nitrate/nitrite-nitrogen. The results are compared to estimates of
naturally occurring concentration ranges of each substance or quality and established state water quality
standards. Based on how the steams compare over time, the stream segment covered by the sample is then assigned a quality letter grade of A (very good), B (good), C (fair), or D (poor). All the stream segments
being sampled across all of western North Carolina (more than 148 sample sites) are ranked against each

14
other with a weighted scoring system. The top score for any stream was 100 points, and the minimum was
25. Since sediment is the biggest water quality issue in western North Carolina, the suspended solids parameter was given double weight. The following chart summarizes how the Pigeon River Watershed
sample sites ranked when compared to other sampled waters in western North Carolina.
Figure 7. VWIN Volunteer Robin Minick
samples water in Allen Creek
15
Figure 8. Volunteer Water Information Network (VWIN) Sample Locations

16
Table 2. VWIN Classifications
Site Stream Year 1
1996-97 Year 2
1997-98 Year 3
1998-99 Year 4
1999-00 Year 5
2000-01 Year 6
2001-02 Year 7
2002-03 Year 8
2003-04 Year 9
2004-05 Year 10 2005-06
Year 11 2006-07
Year 12 2007-08
Year 13 2008-09
Richland Creek and Jonathan Creek Watersheds
13 Allens Creek 91 75 83 81 92 87 87 87 96 98 98 98
Excellent Average Good Good Excellent Good Good Good Excellent Excellent Excellent Excellent
8 Eaglenest Creek
84 82 77 78 67 68 68 74 74 67 74 78 74
Good Good Average Average Below
Average Below
Average Below
Average Average Average
Below Average
Average Average Average
21 Hyatt Creek upstream
47 49 51 51 53 51 51 51 53 51
Poor Poor Poor Poor Poor Poor Poor Poor Poor Poor
22 Hyatt Creek downstream
57 55 50 53 50 52 50 56 56 56
Poor Poor Poor Poor Poor Poor Poor Poor Poor Poor
28 Hyatt Creek Left Branch
52 72 65 65
Poor Average Below
Average Below
Average
29 Hyatt Creek Owl Ridge Branch
56 60 56 56
Poor Below
Average Poor Poor
30 Hyatt Creek Green Valley Branch
47 58 52 52
Poor Poor Poor Poor
9 Plott Creek
84 84 82 81 78 69 69 69 81 81 81 83 83
Good Good Good Good Average Below
Average Below
Average Below
Average Good Good Good Good Good

17
Site Stream Year 1
1996-97 Year 2
1997-98 Year 3
1998-99 Year 4
1999-00 Year 5
2000-01 Year 6
2001-02 Year 7
2002-03 Year 8
2003-04 Year 9
2004-05 Year 10 2005-06
Year 11 2006-07
Year 12 2007-08
Year 13 2008-09
23 Ratcliff Cove Branch
78 76 74 74 67 63 67 67 67
Average Average Average Average Below
Average Below
Average Below
Average Below
Average Below
Average
24 Raccoon Creek upstream
74 81 76 72 60 67 67 73 75
Average Good Average Average Below
Average Below
Average Below
Average Average Average
25 Raccoon Creek downstream
81 76 81 76 71 73 73 71 77
Good Average Good Average Average Average Average Average Average
10 Richland Creek upstream
86 89 89 88 87 80 80 85 85 85 91 91 91
Good Good Excellent Good Good Good Good Good Good Good Excellent Excellent Excellent
11 Richland Creek at Lake Junaluska
80 82 80 69 69 66 88 90 87 87 95 83 83
Good Good Good Below
Average Below
Average Below
Average Good Excellent Good Good Excellent Good Good
27 Jonathan Creek in Maggie Valley
94 97 97 78 78 76 81 81 81
Excellent Excellent Excellent Average Average Average Good Good Good
12 Jonathan Creek downstream
80 75 75 71 69 69 78 78 91 87 83 81 81
Good Average Average Average Below
Average Below
Average Average Average Excellent Good Good Good Good
Average for this group 84 86 81 72 72 71 73 73 72 67 73 73 73
Rural Northeastern Watersheds
32 Beaverdam Creek upstream
70 72
Average Average

18
Site Stream Year 1
1996-97 Year 2
1997-98 Year 3
1998-99 Year 4
1999-00 Year 5
2000-01 Year 6
2001-02 Year 7
2002-03 Year 8
2003-04 Year 9
2004-05 Year 10 2005-06
Year 11 2006-07
Year 12 2007-08
Year 13 2008-09
31 Beaverdam Creek downstream
82 82
Good Good
20 Cove Creek (Fines Creek watershed)
56 57 57 62 58 58 58 58 58 58
Poor Poor Poor
Below Average
Poor Poor Poor Poor Poor Poor
26 Crabtree Creek 83 70 72 72 75 75 71 79 75
Good Average Average Average Average Average Average Average Average
19 Fines Creek upstream
63 65 65 69 69 65 65 67 67 67
Below Average
Below Average
Below Average
Below Average
Below Average
Below Average
Below Average
Below Average
Below Average
Below Average
15 Fines Creek midstream
75 73 58 66 60 60 59 55 64 60 64 64
Average Average Poor Below
Average Below
Average Below
Average Poor Poor
Below Average
Below Average
Below Average
Below Average
7 Fines Creek downstream
68 71 55 49 59 54 67 70 66 66 66 72 68
Below Average
Average Poor Poor Poor Poor Below
Average Average
Below Average
Below Average
Below Average
Average Below
Average
14 Rush Fork upstream (Crabtree Creek watershed)
75 66 60 62 58 62 65 60 60 60 60 60
Average Below
Average Below
Average Below
Average Poor
Below Average
Below Average
Below Average
Below Average
Below Average
Below Average
Below Average
6
Rush Fork downstream (Crabtree Creek watershed)
66 61 50 58 55 55 55 53 69 79 76 78 78
Below Average
Below Average
Poor Poor Poor Poor Poor Poor Below
Average Average Average Average Average
Average for this group 67 71 61 57 64 60 64 64 64 67 65 70 69
19
Site Stream Year 1
1996-97 Year 2
1997-98 Year 3
1998-99 Year 4
1999-00 Year 5
2000-01 Year 6
2001-02 Year 7
2002-03 Year 8
2003-04 Year 9
2004-05 Year 10 2005-06
Year 11 2006-07
Year 12 2007-08
Year 13 2008-09
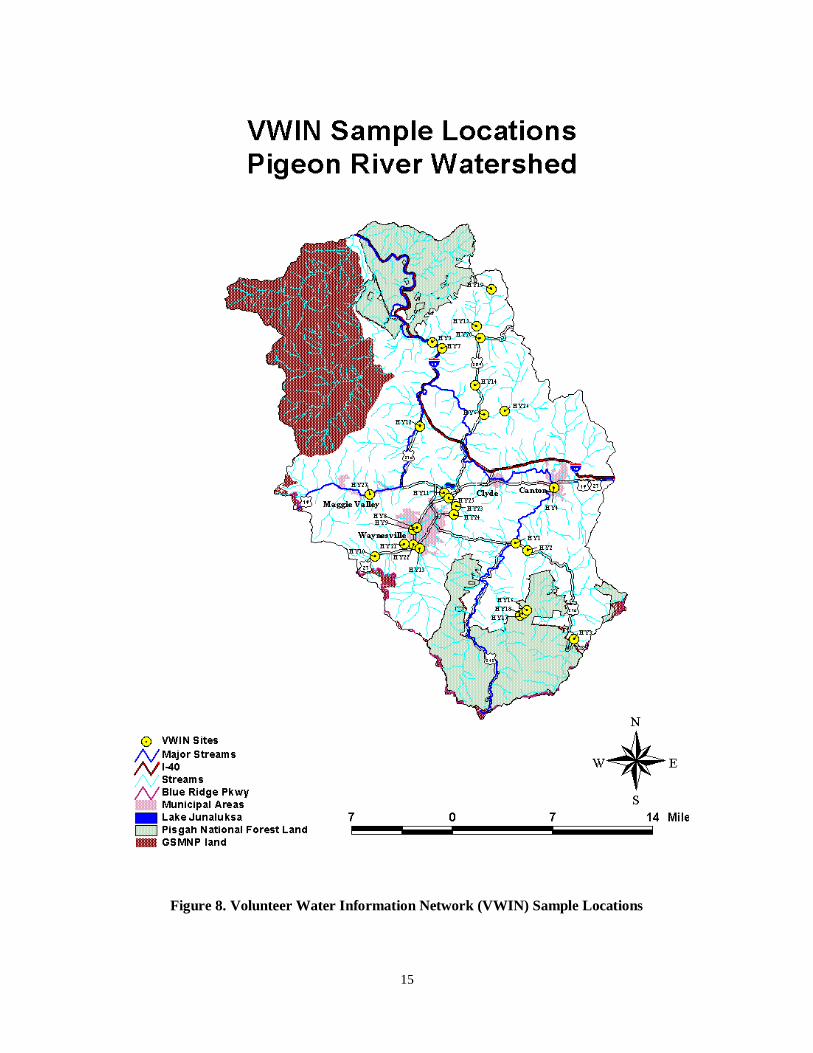
Pigeon River and Upper Forks
2 East Fork Pigeon River at Bethel
93 84 93 92 92 92 100 100 100 100 100 100 100
Excellent Good Excellent Excellent Excellent Excellent Excellent Excellent Excellent Excellent Excellent Excellent Excellent
3 East Fork Pigeon River at Cruso
100 100 100 100 98 98 98 100 100 98 98 96 96
Excellent Excellent Excellent Excellent Excellent Excellent Excellent Excellent Excellent Excellent Excellent Excellent Excellent
4 Pigeon River downstream from Canton
68 61 55 60 60 60 74 68 72 75 74 72 72
Below Average
Below Average
Poor Below
Average Below
Average Below
Average Average
Below Average
Average Average Average Average Average
5 Pigeon River at Hepco Bridge
73 73 55 46 38 48 63 63 77 69 69 66 66
Average Average Poor Poor Poor Poor Below
Average Below
Average Average
Below Average
Below Average
Below Average
Below Average
1 West Fork Pigeon River at Bethel
93 96 96 98 98 95 98 98 98 100 100 100 100
Excellent Excellent Excellent Excellent Excellent Excellent Excellent Excellent Excellent Excellent Excellent Excellent Excellent
16 Sorrell's Creek (upstream of fish farm)
96 96
Excellent Excellent
17 Sorrell's Creek downstream of fish farm)
84 84
Good Good
18 Sorrell's Creek (effluent of fish farm)
89
Good
Average for this group 85 85 84 79 77 79 87 86 89 88 88 87 87

20
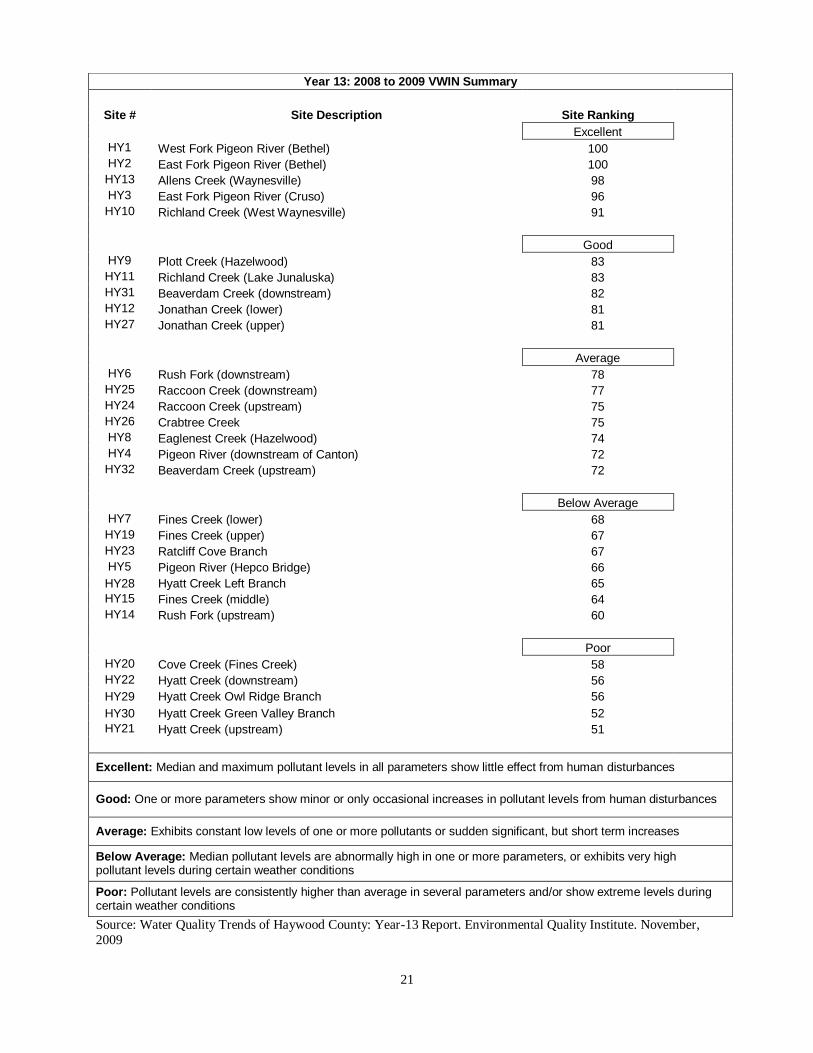
Table 3. Pigeon River Stream classifications; 2008 to 2009 VWIN Summary
Site pH Alk Turb TSS Cond Cu Pb Zn Ortho P NH3-N NO3-N
1- West Fork Pigeon River (Bethel) A D A A A A A A A A A
2- East Fork Pigeon River (Bethel) A D A A A A A A A A A
3- East Fork Pigeon River (Cruso) A D A A A B A B A A A
4- Pigeon River (downstream of Canton) A A B A D B A B D C A
5- Pigeon River (Hepco Bridge) A A C B D B A B D A B
6- Rush Fork (downstream) A A B A C A A A D A C
7- Fines Creek (lower) A B C C C A A A C A C
8- Eaglenest Creek (Hazelwood) A B C C C B A A A A B
9- Plott Creek (Hazelwood) A C B C B A A A A A B
10- Richland Creek (West Waynesville) A C B A B A A A A A B
11- Richland Creek (Lake Junaluska) A B C A C B A A A A B
12- Jonathan Creek (lower) A C C B B B A A A A B
13- Allens Creek (Waynesville) A D A A B A A A A A A
14- Rush Fork (upstream) A B D D D A A A C A B
15- Fines Creek (middle) A B C D C A A A C A C
19- Fines Creek (upper) A B D D B A A A B A B
20- Cove Creek (Fines Creek) A B D D D A A A C A C
21- Hyatt Creek (upstream) A B D D C C A B C B C
22- Hyatt Creek (downstream) A A D D C B A B C A C
23- Ratcliff Cove Branch A A D C C A A A B A C
24- Raccoon Creek (upstream) A A C B C A A A B A C
25- Raccoon Creek (downstream) A A C A C B A A B A C
26- Crabtree Creek A B C B C A A A C A B
27- Jonathan Creek (upper) A D C B B B A A A A B
28- Hyatt Creek Left Branch A A C D C B A B B A B
29- Hyatt Creek Owl Ridge Branch A A D D C C A B B A C
30- Hyatt Creek Green Valley Branch A A C C D B A D C C C
31- Beaverdam Creek (downstream) A A B B C A A A B A B
32- Beaverdam Creek (upstream) A B C D C A A A A A B
21
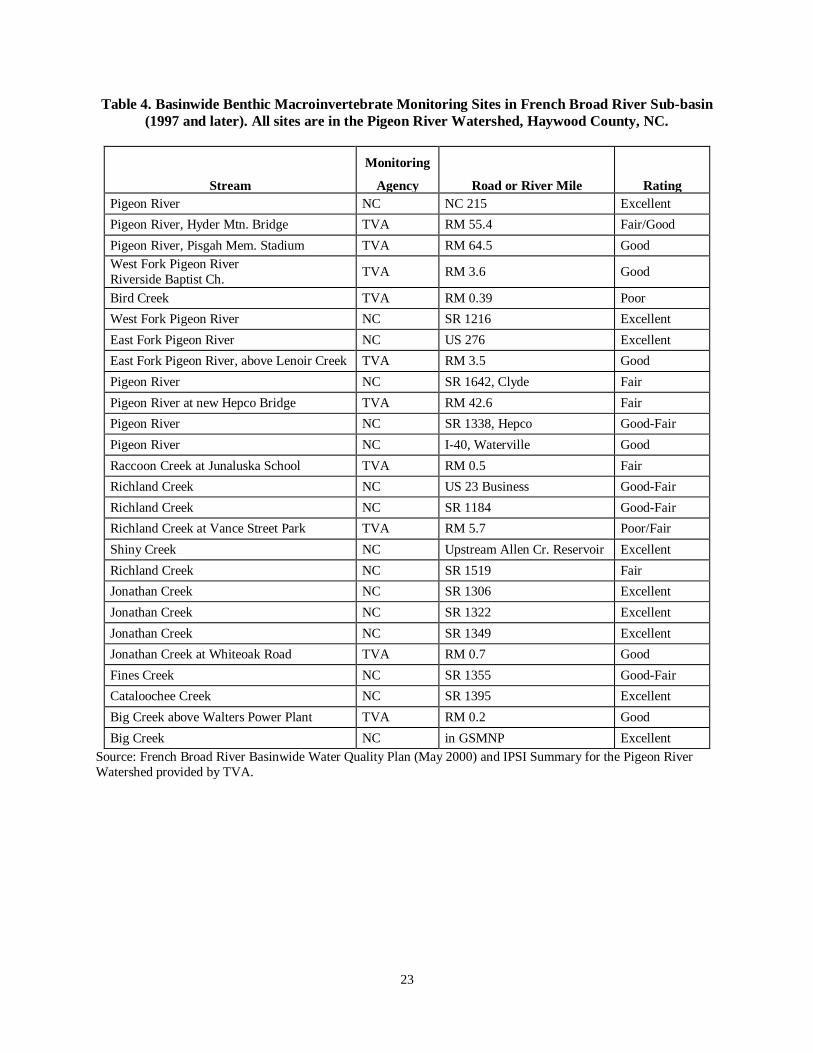
Source: Water Quality Trends of Haywood County: Year-13 Report. Environmental Quality Institute. November,
2009
Year 13: 2008 to 2009 VWIN Summary
Site # Site Description Site Ranking
Excellent
HY1 West Fork Pigeon River (Bethel) 100
HY2 East Fork Pigeon River (Bethel) 100
HY13 Allens Creek (Waynesville) 98
HY3 East Fork Pigeon River (Cruso) 96
HY10 Richland Creek (West Waynesville) 91
Good
HY9 Plott Creek (Hazelwood) 83
HY11 Richland Creek (Lake Junaluska) 83
HY31 Beaverdam Creek (downstream) 82
HY12 Jonathan Creek (lower) 81
HY27 Jonathan Creek (upper) 81
Average
HY6 Rush Fork (downstream) 78
HY25 Raccoon Creek (downstream) 77
HY24 Raccoon Creek (upstream) 75
HY26 Crabtree Creek 75
HY8 Eaglenest Creek (Hazelwood) 74
HY4 Pigeon River (downstream of Canton) 72
HY32 Beaverdam Creek (upstream) 72
Below Average
HY7 Fines Creek (lower) 68
HY19 Fines Creek (upper) 67
HY23 Ratcliff Cove Branch 67
HY5 Pigeon River (Hepco Bridge) 66
HY28 Hyatt Creek Left Branch 65
HY15 Fines Creek (middle) 64
HY14 Rush Fork (upstream) 60
Poor
HY20 Cove Creek (Fines Creek) 58
HY22 Hyatt Creek (downstream) 56
HY29 Hyatt Creek Owl Ridge Branch 56
HY30 Hyatt Creek Green Valley Branch 52
HY21 Hyatt Creek (upstream) 51
Excellent: Median and maximum pollutant levels in all parameters show little effect from human disturbances
Good: One or more parameters show minor or only occasional increases in pollutant levels from human disturbances
Average: Exhibits constant low levels of one or more pollutants or sudden significant, but short term increases
Below Average: Median pollutant levels are abnormally high in one or more parameters, or exhibits very high pollutant levels during certain weather conditions
Poor: Pollutant levels are consistently higher than average in several parameters and/or show extreme levels during certain weather conditions

22
The VWIN ranking for Richland Creek and Jonathan Creek streams have declined since the 1999 data
was gathered. The lower site on Jonathon Creek has declined one stream rank for three successive years (1999 – 2001), dropping from good, to average, to below average. The longer this data is gathered, the
easier it will be to assess meaningful trends.
Other approaches use biological indicators to assess the health of the stream. TVA has been compiling an Index of Biotic Integrity (IBI) for the Pigeon River Watershed during the 1990s. The index is compiled by
sampling to determine which fish are in the water, and in what numbers. The ecological health of a body
of water is its ability to support communities of animals and aquatic plants that characterize the best expected environmental conditions. Declining environmental health is usually characterized by a loss of
species, increased numbers of organisms tolerant of poor environmental conditions, increased disease
rate, and eventually decreased number of animals. Since fish are relatively long-lived and use different habitats during their life cycles, they are useful in detecting problems over a longer term (years) as well as
problems affecting one or more habitats. TVA has sampled thousands of streams throughout their multi-
state area and developed indices or metrics from these samples as a basis for assessing the quality of
sampled streams. However, they recognize the higher elevation streams (above 2,000 feet), particularly trout waters, do not have the same diversity of species as lower elevation streams, and the established
metrics may not provide a totally accurate assessment of stream conditions for such waters. TVA has
rated some Pigeon River Watershed stream segments according to their metrics, recognizing that this information may need to be adjusted as more data is gathered.
The State of North Carolina Department of Environment and Natural Resources (DENR) has also been collecting fish samples to obtain biological indicators of biological health. As with the TVA, they have
found that the metrics developed for other streams in the state have limited application for mountain
waters. Therefore, the State is continuing to refine its metrics for mountain streams and has not rated
Pigeon River streams based on fish sampling data.
Several methods have also been developed for ecological indices using the macroinvertebrate
communities. These methods range from a simple count of intolerant species (mayflies, stoneflies, and caddisflies) to indices that use several measures of the macroinvertebrate community. The acronym for
this type of survey is EPT, for the first letters of the orders of the mayflies, stoneflies, and caddisflies
(Ephemeroptera, Plecoptera, and Trichoptera). Generally, macroinvertebrates are more resilient to
environmental problems than fish, less mobile than fish, and may require only a limited amount of preferred habitat for survival. These differences make macroinvertebrate indices more suitable for
measuring short-term and localized ecological health. TVA and the State of North Carolina have been
collecting this type of biological data in the Pigeon River Watershed for several years. The State of North Carolina relies more heavily on this EPT information when rating stream segments. However, the EPT
sampling to date has limitations in assessing sediment problems. Part of this problem is due to the stream
segments being sampled, but other limitations are inherent in this type of sampling. The following chart summarizes the biological sampling results in the Pigeon River Watershed.
23
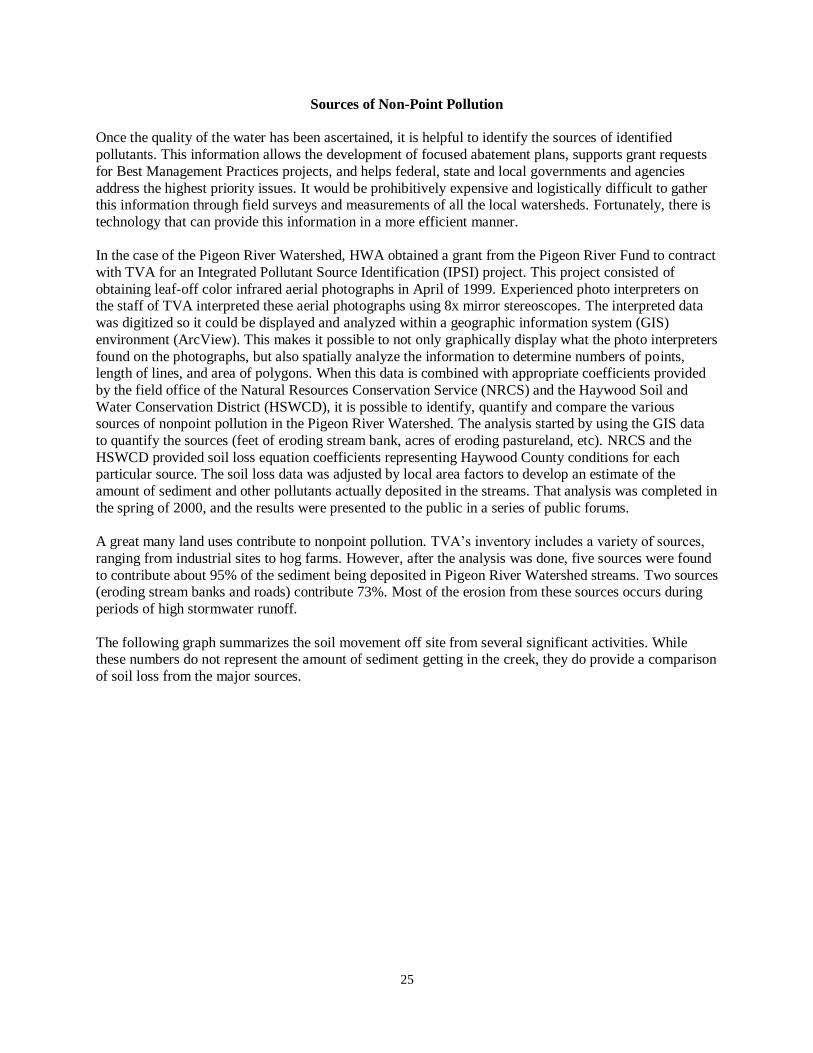
Table 4. Basinwide Benthic Macroinvertebrate Monitoring Sites in French Broad River Sub-basin
(1997 and later). All sites are in the Pigeon River Watershed, Haywood County, NC.
Stream
Monitoring
Agency Road or River Mile Rating
Pigeon River NC NC 215 Excellent
Pigeon River, Hyder Mtn. Bridge TVA RM 55.4 Fair/Good
Pigeon River, Pisgah Mem. Stadium TVA RM 64.5 Good
West Fork Pigeon River
Riverside Baptist Ch. TVA RM 3.6 Good
Bird Creek TVA RM 0.39 Poor
West Fork Pigeon River NC SR 1216 Excellent
East Fork Pigeon River NC US 276 Excellent
East Fork Pigeon River, above Lenoir Creek TVA RM 3.5 Good
Pigeon River NC SR 1642, Clyde Fair
Pigeon River at new Hepco Bridge TVA RM 42.6 Fair
Pigeon River NC SR 1338, Hepco Good-Fair
Pigeon River NC I-40, Waterville Good
Raccoon Creek at Junaluska School TVA RM 0.5 Fair
Richland Creek NC US 23 Business Good-Fair
Richland Creek NC SR 1184 Good-Fair
Richland Creek at Vance Street Park TVA RM 5.7 Poor/Fair
Shiny Creek NC Upstream Allen Cr. Reservoir Excellent
Richland Creek NC SR 1519 Fair
Jonathan Creek NC SR 1306 Excellent
Jonathan Creek NC SR 1322 Excellent
Jonathan Creek NC SR 1349 Excellent
Jonathan Creek at Whiteoak Road TVA RM 0.7 Good
Fines Creek NC SR 1355 Good-Fair
Cataloochee Creek NC SR 1395 Excellent
Big Creek above Walters Power Plant TVA RM 0.2 Good
Big Creek NC in GSMNP Excellent
Source: French Broad River Basinwide Water Quality Plan (May 2000) and IPSI Summary for the Pigeon River
Watershed provided by TVA.

24
The VWIN and biological sampling water quality findings demonstrate considerable variability,
depending on the sampling station. As a general rule, the VWIN data ranks streams better than the EPT or IBI approaches. EPT data often provides higher rankings than the fish information at specific stations.
Some of these differences are probably a result of the unresolved standards issue mentioned above. In
addition, some sample stations may reflect very localized conditions (like straight piping in the vicinity). However, some of these differences may reflect the watershed history. The intensive upstream uses, such
as agriculture and railroad logging, have created a large streambed load of sediment in many area streams.
The water flowing above this sediment may appear clean, but the sediment has destroyed considerable biological habitat. Research at Coweta Hydrologic Laboratory indicates that some of these affects may be
reduced if the current levels of erosion and sedimentation are reduced. The steep gradients and intense
storms that occasionally visit the mountains will help flush out these stream channels. However, they will never clean themselves if sediment continues to be added as rapidly as it is removed.
For the purpose of this report, priority has been given to addressing problems in subwatersheds where the
majority of the water quality information indicates a problem. Stream segments with mixed sampling results or more limited data have been assessed based on any available specific knowledge about the
sample site and sampling conditions. Where local knowledge helps explain the variability, the data has
been considered accordingly.
The Pigeon River has very variable water quality. Some of its headwaters are producing very high quality
water. Examples include the West Fork of the Pigeon River on National Forest land, Allen Creek above the Town of Waynesville Municipal reservoir, and Big Creek and Cataloochee Creek in the Great Smoky
Mountains National Park. However, some stream segments are also rated in poor condition. The summary
table in Appendix I indicates the state stream classification by segment for all streams in the Pigeon River
Watershed.
The VWIN sampling has identified the primary pollutants affecting the surface waters of the Pigeon River
Watershed. As in so much of the nation, sediment from nonpoint sources is the most significant pollutant. A few subwatersheds also show higher than average nitrogen levels. While this issue is not as significant
as sediment, it may provide clues as to the source of the sediment.
Stormwater management issues are an integral part of any discussion of nonpoint pollution issues in the Pigeon River Watershed. As human activities increase within an area, various pollutants are deposited on
the surface of the land. These pollutants are washed off by precipitation and flushed into storm drains or
directly into streams, rivers, and lakes. Sediment, nutrients, bacteria and viruses, oil and grease, trace metals, toxic chemicals, and other pollutants are commonly found in stormwater runoff. The increased
amount of impervious area in roads, parking lots, roofs, and driveways accelerates the rate of runoff,
increasing the erosion potential from any storm event. Most of the sediment that washes into Pigeon River Watershed streams occurs during periods of high precipitation when stormwater runoff is at its greatest.
Although this report focuses on nonpoint pollution issues, the sampling results in the Lower Pigeon River
also reflect the effects of point source pollution from the paper mill at Canton, NC. During the last 10
years, Champion International and now Blue Ridge Paper Products have greatly reduced the point source discharges from the mill. The 2000 French Broad River Basinwide Water Quality Plan documents
substantial improvements in the quality of water below the Blue Ridge Paper Products discharge.
Conductivity dropped by about 50% at the Clyde sampling station. The report also states that the water quality conditions have improved tremendously since 1990. More detail about these improvements can be
found in the French Broad River Basinwide Water Quality Plan, published by the North Carolina
Department of Environment and Natural Resources.
25
Sources of Non-Point Pollution
Once the quality of the water has been ascertained, it is helpful to identify the sources of identified
pollutants. This information allows the development of focused abatement plans, supports grant requests
for Best Management Practices projects, and helps federal, state and local governments and agencies
address the highest priority issues. It would be prohibitively expensive and logistically difficult to gather this information through field surveys and measurements of all the local watersheds. Fortunately, there is
technology that can provide this information in a more efficient manner.
In the case of the Pigeon River Watershed, HWA obtained a grant from the Pigeon River Fund to contract
with TVA for an Integrated Pollutant Source Identification (IPSI) project. This project consisted of
obtaining leaf-off color infrared aerial photographs in April of 1999. Experienced photo interpreters on the staff of TVA interpreted these aerial photographs using 8x mirror stereoscopes. The interpreted data
was digitized so it could be displayed and analyzed within a geographic information system (GIS)
environment (ArcView). This makes it possible to not only graphically display what the photo interpreters
found on the photographs, but also spatially analyze the information to determine numbers of points, length of lines, and area of polygons. When this data is combined with appropriate coefficients provided
by the field office of the Natural Resources Conservation Service (NRCS) and the Haywood Soil and
Water Conservation District (HSWCD), it is possible to identify, quantify and compare the various sources of nonpoint pollution in the Pigeon River Watershed. The analysis started by using the GIS data
to quantify the sources (feet of eroding stream bank, acres of eroding pastureland, etc). NRCS and the
HSWCD provided soil loss equation coefficients representing Haywood County conditions for each particular source. The soil loss data was adjusted by local area factors to develop an estimate of the
amount of sediment and other pollutants actually deposited in the streams. That analysis was completed in
the spring of 2000, and the results were presented to the public in a series of public forums.
A great many land uses contribute to nonpoint pollution. TVA’s inventory includes a variety of sources,
ranging from industrial sites to hog farms. However, after the analysis was done, five sources were found
to contribute about 95% of the sediment being deposited in Pigeon River Watershed streams. Two sources (eroding stream banks and roads) contribute 73%. Most of the erosion from these sources occurs during
periods of high stormwater runoff.
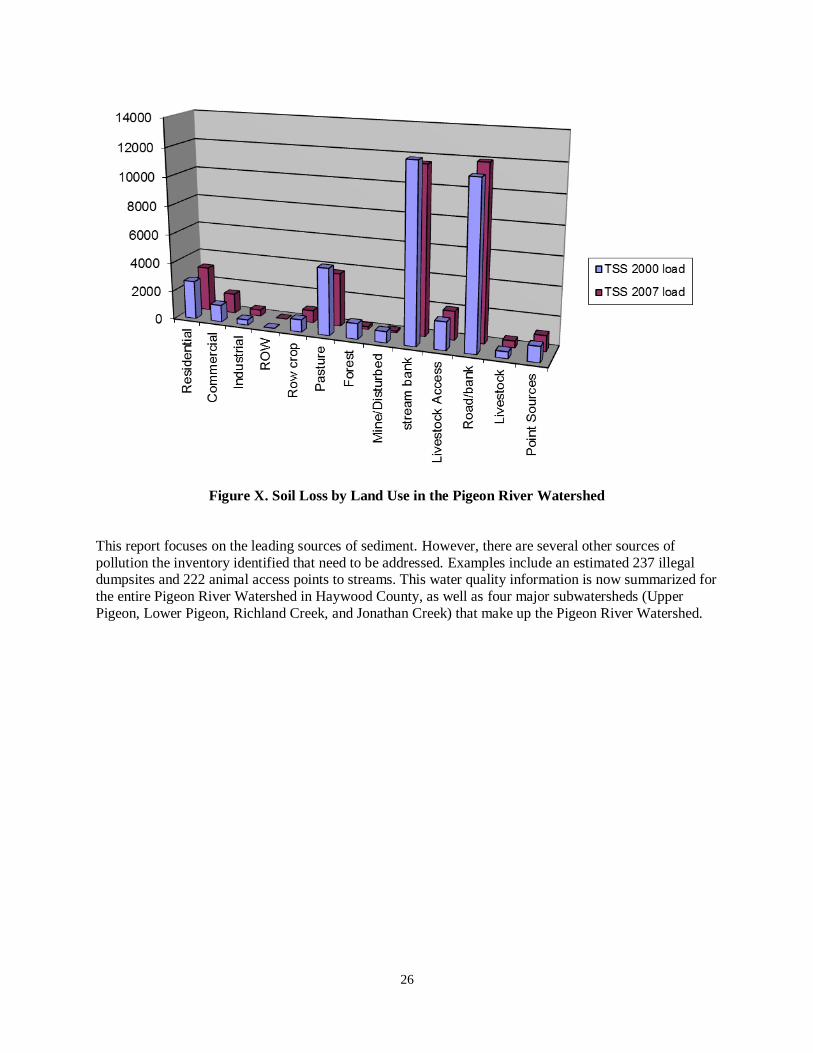
The following graph summarizes the soil movement off site from several significant activities. While these numbers do not represent the amount of sediment getting in the creek, they do provide a comparison
of soil loss from the major sources.
26
Figure X. Soil Loss by Land Use in the Pigeon River Watershed
This report focuses on the leading sources of sediment. However, there are several other sources of
pollution the inventory identified that need to be addressed. Examples include an estimated 237 illegal dumpsites and 222 animal access points to streams. This water quality information is now summarized for
the entire Pigeon River Watershed in Haywood County, as well as four major subwatersheds (Upper
Pigeon, Lower Pigeon, Richland Creek, and Jonathan Creek) that make up the Pigeon River Watershed.

27
Pigeon River
As part of the IPSI analysis, TVA classified all the land in the Pigeon River Watershed into 24 land
use/land cover classes. Many of these subdivisions were a qualitative subdivision of a larger group, such
as good pasture, fair pasture, woodland pasture, heavily overgrazed pasture, and poor pasture. In the
interest of illustrating relationships and watershed differences, these categories were aggregated into six land use groups: forest, pasture, cropland, residential, commercial and other.
The cropland figure was based on the appearance of the land in April of 1999. It was classified as cropland if evidence of row cropping was visible from the air. In some cases, farmers had planted cover
crops on their cropland, and some of what USDA classifies as cropland was interpreted as pasture,
probably in the good pasture category.
The predominant land cover in the watershed is forest. TVA classed about 77% of the watershed as forest.
However, that is the visible cover on the aerial photographs or what a visitor sees when driving for
pleasure. It does not reflect infrastructure and institutional changes that have committed these forested lands to other uses. These changes can often be illustrated by examining the TVA road information and
the Haywood County land records. In some watersheds, the majority of the forest area has been
committed to residential uses through the construction of subdivision roads and/or the sale of small parcels for residential use. The future of some areas of Haywood County has already been determined—it
was just not visible in April of 1999. The development of these more intensive uses will have long-lasting
effects on the watershed.
Pastures are the next largest land use category, representing about 11% of the watershed. The condition of
these pastures varies widely, with the largest area represented by pasture in fair condition. Residential use
makes up about 6% of the land area, with low density residential use (fewer than two residences per acre) representing over 85% of this category. Several uses were included in an “other” category (open water,
mines, orchards, and brushland). This group accounts for about 4% of the land area. Commercial and
cropland uses account for 3%.
There are numerous sources that contribute sediment to area streams. Even undisturbed forestland
contributes sediment, albeit at a very low level. While the data is available for all uses, this report focuses
on those activities and land uses that contribute the majority of sediment in the Pigeon River Watershed. The two most significant contributors are eroding stream banks and roads. These two sources contribute
73% of the total sediment being deposited in Pigeon River Watershed streams. The third most significant
contributor was pastureland (15%) with pastures in fair condition contributing 11% of sediment to streams. The following chart summarizes the primary sources of sediment in the watershed.

28
Figure 10. Primary Sources of Sediment to Streams in the Pigeon River Watershed (source: IPSI)
Eroding stream banks represent a small percentage of the total mileage of streams in the County. However, every cubic foot of soil that falls off the bank goes directly into the stream. The IPSI data
indicates that 6% of the Pigeon River Watershed streams have eroding stream banks. Much of this is
concentrated in a few subwatersheds. Analyses of the aerial photographs identified the eroding stream banks along the larger, perennial streams. There are additional eroding steam banks on several small
tributaries.
The roads category includes runoff from road surfaces, ditches, and eroding cut and fills slopes. Roads
serve a variety of purposes. Many are constructed for residential subdivisions. However, roads are also
built as access to individual residences, as well as for forestry, agricultural, and industrial purposes.
The land use changes occurring in the watershed have important implications for this source of sediment.
We are experiencing a “sustained yield” of new roads. The hundreds of new houses being built each year
often require new or upgraded roads. An annual flush of sediment from new roads is maintained in the watershed by building new homes and roads. In addition, the “background” sediment level continues to
increase from the roads added in previous years.

29
Figure 11. Severe erosion from an unpaved road
The impact of the roads on Pigeon River water quality reflects a number of factors. These include whether
the road is paved or unpaved. If it is a gravel surface, how good a gravel surface is on the road? A well-graveled road surface will contribute substantially less than one where the protection of the surface
material has been worn away. What is the grade on the road? Steep roads are at much greater risk for
erosion. Another significant item is the condition of the road ditches. Much of the sediment from roads comes from road ditches, where the storm runoff is concentrated. Are there adequate culverts to avoid
long grades where the water can gather force? Have the ditches been vegetated or hardened? Is the
stormwater concentrated or dispersed? Have the road banks (cut and fill banks) been vegetated and
stabilized? Is the road newly constructed? What type of soil is the road constructed across?
Haywood County has a substantial number of roads and road mileage. There are about 3,200 miles of
private and state roads in the Pigeon River Watershed. This is a road density of one mile of road for every 107 acres. This density is increasing every year. Much of the new mileage is on steep slopes with erodible
soils. Haywood County does have a Subdivision and Predevelopment Ordinance to provide some
guidelines on slope for road construction, but some consider it to be limited. Many roads are built in support of new housing developments. The roads and associated housing and driveways are substantially
increasing the percent of impervious area in some watersheds. The more impervious area there is, the

30
faster stormwater will run off into the creeks and river. This accelerated runoff causes streams to rise
more rapidly. The increased flows can damage stream banks, property, roads, bridges, and important wildlife habitat. The faster it runs off, the more damage it does, and the more sediment it carries with it.
Downstream stream banks will be eroded away at increasing rates, and flooding will be a greater risk.
Many residents have experienced the results of a new house being constructed on the hill above them.
There is suddenly a lot more water to deal with. Multiply that hundreds of times in a small watershed and the consequences are significant.
The Pigeon River Watershed has a small percentage of its land base (1.9%) in impervious surfaces such as roads, roofs, driveways, parking lots, etc. However, this watershed includes large acreages of public
land where there are few impervious areas. Focusing on a smaller watershed can give a more accurate
picture. A good example is the Plott Creek Watershed off Richland Creek. The TVA data indicates that about 76% of this small watershed is forested. However, the road data indicates that much of the forested
land has already been committed to subdivision development, with some houses already in place. Once
this portion of Plott Creek is fully developed as a low density residential subdivision, over 60% of this
small watershed will go from almost 0% impervious areas to around 10% of the area dedicated to impervious surfaces, increasing runoff rates and pressure on downstream lands and resources.
Figure 12. Example of IPSI data
Upper Pigeon

31
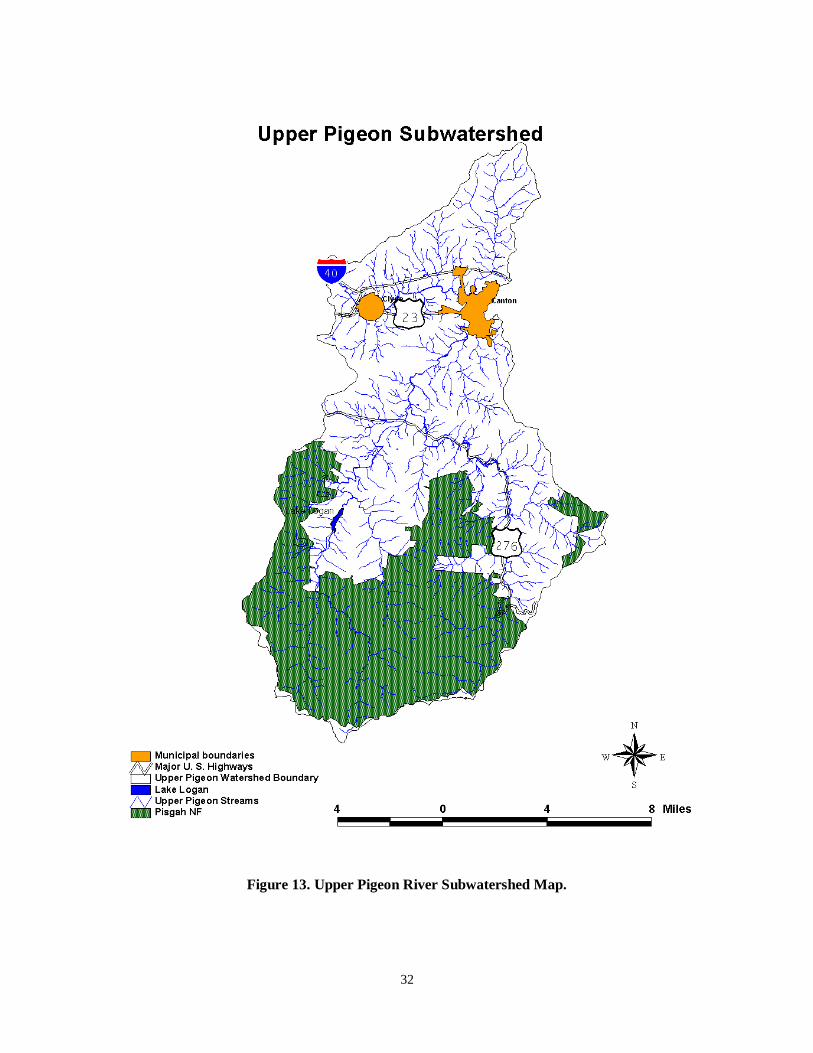
The Upper Pigeon River Watershed consists of 107,569 acres of land on the waters of the Pigeon River above the point where Richland Creek joins the Pigeon River. It includes the East and West Forks of the
Pigeon River and that portion of the watershed between the junction of the Forks and Richland Creek
(including the towns of Canton and Clyde). The State of North Carolina has classified the upper portion
of this watershed a WS-III watershed (Water Supply III). This imposes certain land use guidelines within the watershed. Much of the headwater acreage is part of the Pisgah National Forest. There are many
designated trout streams in the upper portion of this watershed, as well as a significant acreage the state
has classified as High Quality Waters. Land uses intensify below the Forks of the Pigeon, and water quality reflects these changes.
There is a smaller watershed of note near the town of Canton. The Rough Creek Watershed is less than 1,000 acres in size and has been designated as WS I, Outstanding Resource Waters, and a trout stream.
Much of this watershed is owned by the town of Canton and had been acquired as a site for a municipal
reservoir. The presence of this high quality water so close to developed areas represents a significant
resource.
Blue Ridge Paper Products obtains water for their Canton mill from Upper Pigeon Watershed, as does the
Town of Canton. Water quality is an important consideration for both uses. In addition, this watershed contains popular trout streams.
The Episcopal Church Diocese for Western North Carolina recently acquired the property around Lake Logan on the West Fork of the Pigeon River. This property was acquired to serve as a major retreat center
for the Episcopal Church. The public acquisition of much of the land above this reservoir will help assure
a permanent source of high quality water for this facility. Clean water and minimum sedimentation of the
lake are important issues for the success of the retreat center.
There are two active trout farms on the West Fork of the Pigeon River. These aquaculture businesses
produce fish for commercial markets and recreational use.
About 73% of this subwatershed is classified as forest. Pasture is the next largest category of land use,
accounting for about 11% of the acreage. About 9,400 acres (8.7% of the total) are classified as pasture in
fair condition. Since the towns of Canton and Clyde are located in this watershed, about 8% of the watershed is dedicated to residential uses, with the majority of this acreage being low density residential
use. The percent of the watershed in impervious area is 2.3%. The “other” land use category accounts for
5% of the acreage. Lands dedicated to commercial uses account for 2% of the land area, and croplands occupy about 1%.
There are 1007 miles of all categories of roads in the Upper Pigeon Watershed. This is a road density of 1 mile of road for 107 acres of land.
32
Figure 13. Upper Pigeon River Subwatershed Map.
33
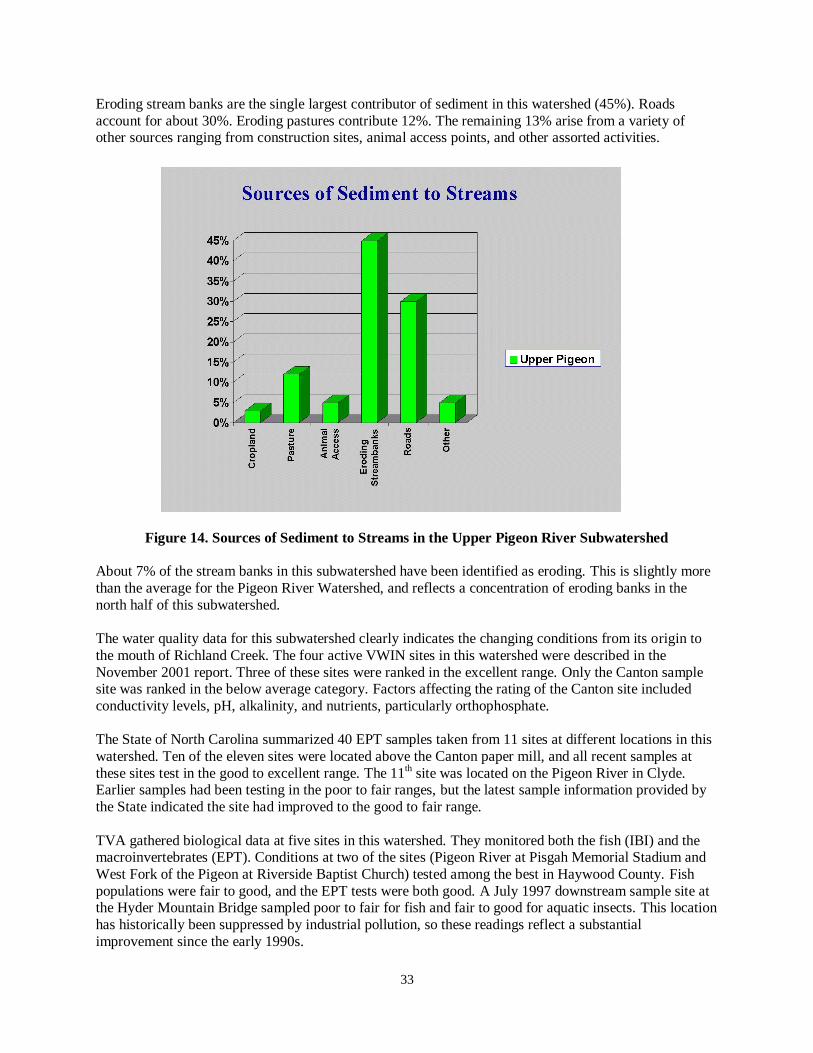
Eroding stream banks are the single largest contributor of sediment in this watershed (45%). Roads
account for about 30%. Eroding pastures contribute 12%. The remaining 13% arise from a variety of other sources ranging from construction sites, animal access points, and other assorted activities.
Figure 14. Sources of Sediment to Streams in the Upper Pigeon River Subwatershed
About 7% of the stream banks in this subwatershed have been identified as eroding. This is slightly more
than the average for the Pigeon River Watershed, and reflects a concentration of eroding banks in the
north half of this subwatershed.
The water quality data for this subwatershed clearly indicates the changing conditions from its origin to
the mouth of Richland Creek. The four active VWIN sites in this watershed were described in the
November 2001 report. Three of these sites were ranked in the excellent range. Only the Canton sample site was ranked in the below average category. Factors affecting the rating of the Canton site included
conductivity levels, pH, alkalinity, and nutrients, particularly orthophosphate.
The State of North Carolina summarized 40 EPT samples taken from 11 sites at different locations in this
watershed. Ten of the eleven sites were located above the Canton paper mill, and all recent samples at
these sites test in the good to excellent range. The 11th site was located on the Pigeon River in Clyde.
Earlier samples had been testing in the poor to fair ranges, but the latest sample information provided by
the State indicated the site had improved to the good to fair range.
TVA gathered biological data at five sites in this watershed. They monitored both the fish (IBI) and the macroinvertebrates (EPT). Conditions at two of the sites (Pigeon River at Pisgah Memorial Stadium and
West Fork of the Pigeon at Riverside Baptist Church) tested among the best in Haywood County. Fish
populations were fair to good, and the EPT tests were both good. A July 1997 downstream sample site at the Hyder Mountain Bridge sampled poor to fair for fish and fair to good for aquatic insects. This location
has historically been suppressed by industrial pollution, so these readings reflect a substantial
improvement since the early 1990s.
34
One of the sites on Bird Creek tested poor for fish and macroinvertebrates in April of 1999. This sample
reflects unexpected conditions, and may be the result of some localized habitat and nutrient pollution. In addition, physical habitat problems were evident at the sample site. A site on the East Fork of the Pigeon
River above Lenoir Creek tested poor for fish, but good for the insects. The cause for the poor fish rating
may reflect long-term degradation of habitat, unresolved metric issues, or localized environmental
problems.
While this watershed has significant sources of sediment contributing to downstream degradation, it
generally supports higher water quality than many other mixed ownership watersheds on the Pigeon River Watershed. Local residents have suggested that one of the factors that may be helping is the designation
of much of this watershed as a WS-III watershed by the State of North Carolina. The presence of the
public land at the headwaters also helps protect the water quality. However, there are also localized sources of pollution affecting certain stream segments.
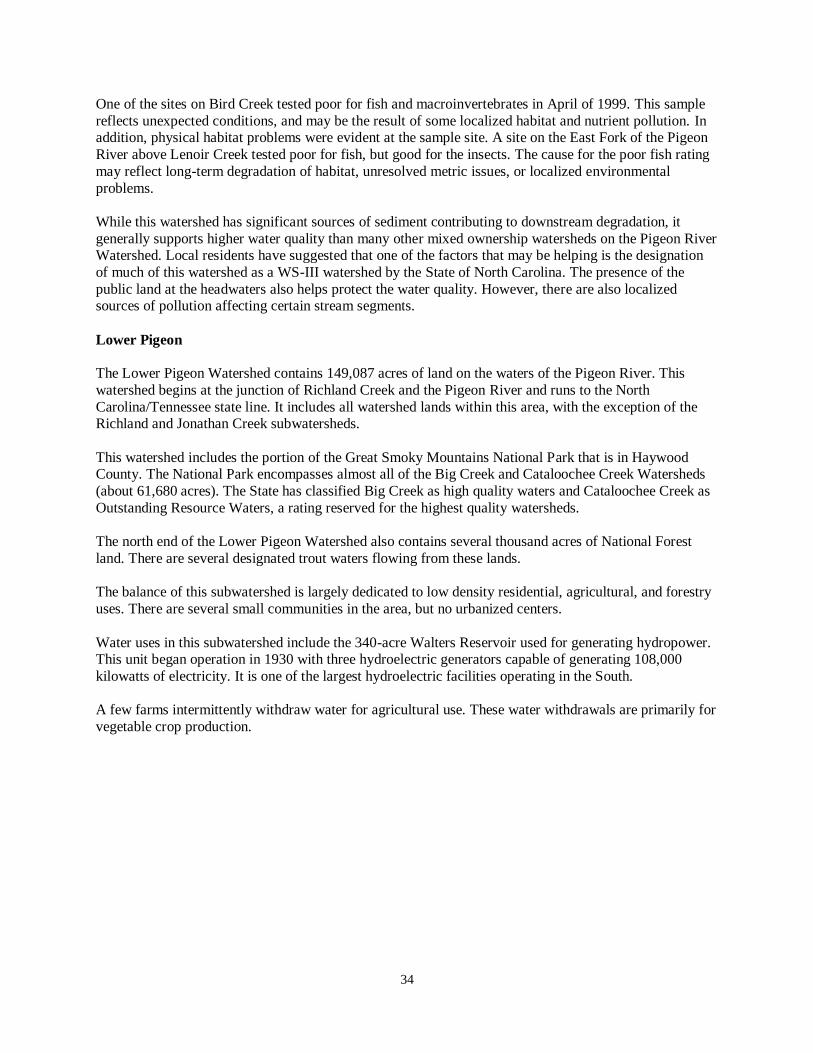
Lower Pigeon
The Lower Pigeon Watershed contains 149,087 acres of land on the waters of the Pigeon River. This
watershed begins at the junction of Richland Creek and the Pigeon River and runs to the North
Carolina/Tennessee state line. It includes all watershed lands within this area, with the exception of the Richland and Jonathan Creek subwatersheds.
This watershed includes the portion of the Great Smoky Mountains National Park that is in Haywood County. The National Park encompasses almost all of the Big Creek and Cataloochee Creek Watersheds
(about 61,680 acres). The State has classified Big Creek as high quality waters and Cataloochee Creek as
Outstanding Resource Waters, a rating reserved for the highest quality watersheds.
The north end of the Lower Pigeon Watershed also contains several thousand acres of National Forest
land. There are several designated trout waters flowing from these lands.
The balance of this subwatershed is largely dedicated to low density residential, agricultural, and forestry
uses. There are several small communities in the area, but no urbanized centers.
Water uses in this subwatershed include the 340-acre Walters Reservoir used for generating hydropower. This unit began operation in 1930 with three hydroelectric generators capable of generating 108,000
kilowatts of electricity. It is one of the largest hydroelectric facilities operating in the South.
A few farms intermittently withdraw water for agricultural use. These water withdrawals are primarily for
vegetable crop production.

35
Figure 15. Lower Pigeon River Subwatershed Map
36
This segment of the Pigeon River is located below the Evergreen Packaging paper mill in Canton.
Substantial investments in the latest environmental technology by the owners have improved the quality of the water in this segment of the river. This portion of the river is now used for occasional fishing and
limited recreational use by canoeists and kayakers.
About 84% of this subwatershed is classified as forest—the highest percentage in the Pigeon River Watershed. Pasture accounts for 11% of the remaining acreage, with 9% of the total watershed being
classified as pasture in fair condition. Cropland, commercial, and residential uses each account for about
1% of the land area. The “Other” category accounts for the remaining acreage. The residential and commercial figures confirm that this is the most rural of all the subwatersheds in the Pigeon River
Watershed.
There are 1032 miles of all categories of roads in this subwatershed. This represents a road density of 1
mile of road for every 144 acres.
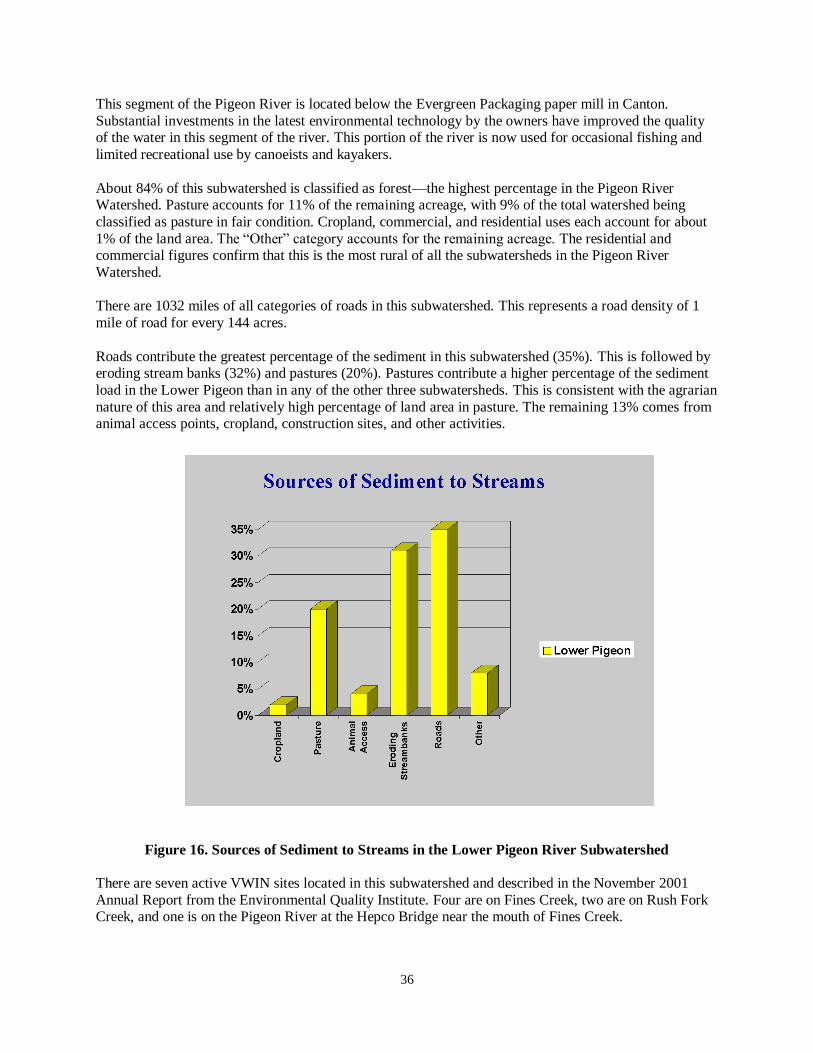
Roads contribute the greatest percentage of the sediment in this subwatershed (35%). This is followed by eroding stream banks (32%) and pastures (20%). Pastures contribute a higher percentage of the sediment
load in the Lower Pigeon than in any of the other three subwatersheds. This is consistent with the agrarian
nature of this area and relatively high percentage of land area in pasture. The remaining 13% comes from animal access points, cropland, construction sites, and other activities.
Figure 16. Sources of Sediment to Streams in the Lower Pigeon River Subwatershed
There are seven active VWIN sites located in this subwatershed and described in the November 2001
Annual Report from the Environmental Quality Institute. Four are on Fines Creek, two are on Rush Fork Creek, and one is on the Pigeon River at the Hepco Bridge near the mouth of Fines Creek.

37
The six sites on Fines Creek and Rush Fork Creek show some of the most significant sedimentation and
nutrient loading problems of the 24 Haywood County VWIN monitoring sites. The lower sites in these streams have median levels for almost all parameters that exceed the average median for the VWIN
monitoring region in western North Carolina. Maximum levels at the two downstream sites also tend to
be higher than the average maximum levels for the region. This is particularly true for the nutrient
parameters. The upstream sites on Fines Creek and Rush Fork Creek rank as below average. All downstream sites on Fines Creek and Rush Fork Creek are in the poor range. These two watersheds
consistently have some of the poorest ratings among the streams being sampled in Haywood County.
Nutrient loading is significant and persistent in both of these creeks. Sediment and nutrient loading in
Rush Fork Creek and Fines Creek, which flow from the western slopes of the Newfound Mountains,
closely resembles levels common to streams on the eastern slopes of this mountain range in Buncombe County. This region has long been deforested and cleared for agriculture, even to the headwaters of the
watersheds. Streams have been extensively straightened and buffer zones largely eliminated. Much of the
land, especially in Haywood County, is pasture. Some areas that were once agricultural are now being
developed with rural housing, but remain largely clear of trees. The steep slopes and weakened stream banks make stream sedimentation a persistent problem. In fact, the upstream sites show even higher
median levels of turbidity than the downstream sites. Even median turbidity levels exceed the water
quality standard for trout waters at these sites. The downstream sites show higher maximum levels than most other sites in the County and exceed the majority of maximum levels in the region as well.
Very few sites in the VWIN monitoring program have ever exceeded the nutrient loading maximums that have occurred on Fines Creek and Rush Fork Creek. The downstream site on Rush Fork Creek reached a
peak in July 1999 when nitrate/nitrite concentrations were 4.5 mg/L and ammonia-nitrogen
concentrations were 1.55 mg/L, exceeding the ammonia nitrogen (NH3) water quality standard of 1 mg/L
in the summer.
There has been no biological sampling completed in either Rush Fork Creek or Fines Creek. However,
since the chemical and physical sampling generally indicates higher water quality than the biological samples, these subwatersheds warrant further study and assistance to address the identified concerns.
The State of North Carolina has collected several EPT samples from this section of the Pigeon River. The
latest results from those samples indicate good to fair results for this stream segment. The TVA has also collected biological samples at the Hepco Bridge on the Pigeon River. They gave that site an EPT rating
of fair and an IBI rating of poor. As mentioned previously, the IBI rating may reflect limited comparison
data for higher elevation mountain streams, the consequences of long-term impacts to the habitat, or both. As a point of comparison, the VWIN rating for this site was the poorest of any stream segment sampled in
the six county area.
Richland Creek
The Richland Creek Watershed contains 43,647 acres. This watershed originates on the southwestern
boundary of the Pigeon River Watershed and flows to the northeast through the most heavily developed portion of Haywood County. The municipal water supply for the Town of Waynesville is located on the
headwaters of Allen Creek. It is one of the highest quality municipal water supplies in North Carolina.
The State has classified it as a WS-I watershed. It is a publicly owned watershed, dedicated to the preservation of high quality water. The Town has shown considerable initiative in maintaining the quality
of this water supply for its residents and businesses.
The balance of the watershed is privately owned. The Town of Waynesville, numerous industries, and
thousands of residences are located in this watershed. The largest rock quarry in Haywood County is
38
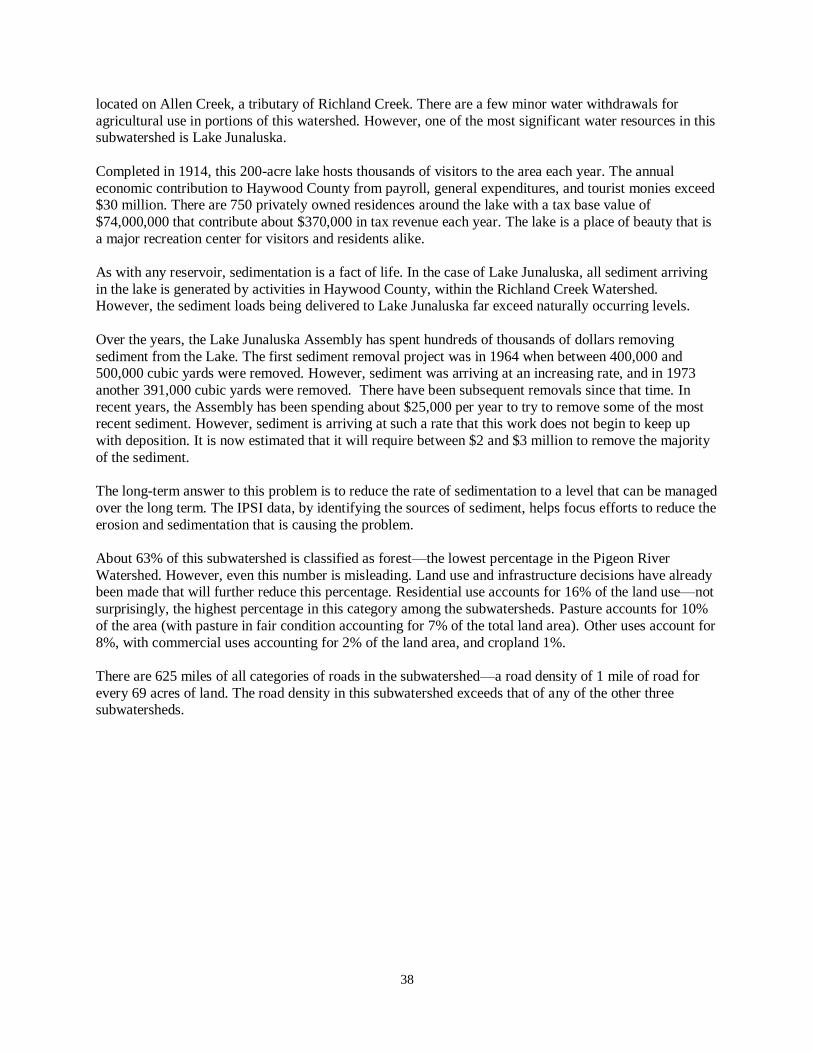
located on Allen Creek, a tributary of Richland Creek. There are a few minor water withdrawals for
agricultural use in portions of this watershed. However, one of the most significant water resources in this subwatershed is Lake Junaluska.
Completed in 1914, this 200-acre lake hosts thousands of visitors to the area each year. The annual
economic contribution to Haywood County from payroll, general expenditures, and tourist monies exceed $30 million. There are 750 privately owned residences around the lake with a tax base value of
$74,000,000 that contribute about $370,000 in tax revenue each year. The lake is a place of beauty that is
a major recreation center for visitors and residents alike.
As with any reservoir, sedimentation is a fact of life. In the case of Lake Junaluska, all sediment arriving
in the lake is generated by activities in Haywood County, within the Richland Creek Watershed. However, the sediment loads being delivered to Lake Junaluska far exceed naturally occurring levels.
Over the years, the Lake Junaluska Assembly has spent hundreds of thousands of dollars removing
sediment from the Lake. The first sediment removal project was in 1964 when between 400,000 and 500,000 cubic yards were removed. However, sediment was arriving at an increasing rate, and in 1973
another 391,000 cubic yards were removed. There have been subsequent removals since that time. In
recent years, the Assembly has been spending about $25,000 per year to try to remove some of the most recent sediment. However, sediment is arriving at such a rate that this work does not begin to keep up
with deposition. It is now estimated that it will require between $2 and $3 million to remove the majority
of the sediment.
The long-term answer to this problem is to reduce the rate of sedimentation to a level that can be managed
over the long term. The IPSI data, by identifying the sources of sediment, helps focus efforts to reduce the
erosion and sedimentation that is causing the problem.
About 63% of this subwatershed is classified as forest—the lowest percentage in the Pigeon River
Watershed. However, even this number is misleading. Land use and infrastructure decisions have already been made that will further reduce this percentage. Residential use accounts for 16% of the land use—not
surprisingly, the highest percentage in this category among the subwatersheds. Pasture accounts for 10%
of the area (with pasture in fair condition accounting for 7% of the total land area). Other uses account for
8%, with commercial uses accounting for 2% of the land area, and cropland 1%.
There are 625 miles of all categories of roads in the subwatershed—a road density of 1 mile of road for
every 69 acres of land. The road density in this subwatershed exceeds that of any of the other three subwatersheds.
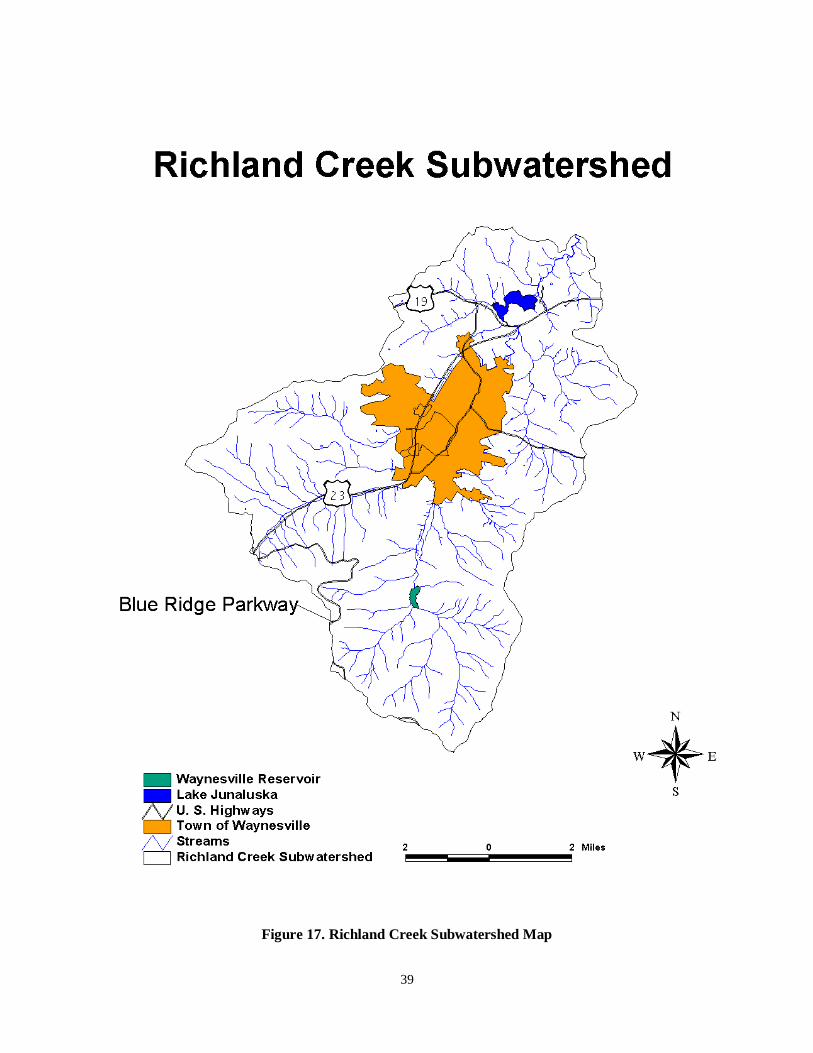
39
Figure 17. Richland Creek Subwatershed Map
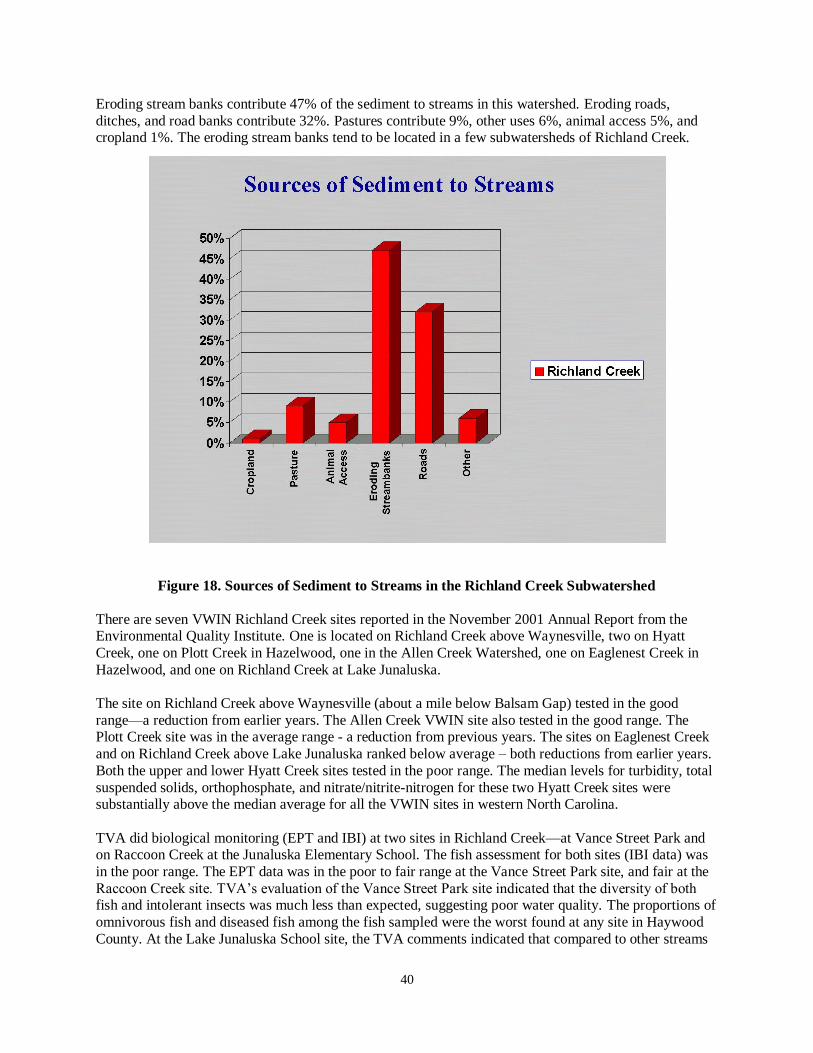
40
Eroding stream banks contribute 47% of the sediment to streams in this watershed. Eroding roads,
ditches, and road banks contribute 32%. Pastures contribute 9%, other uses 6%, animal access 5%, and cropland 1%. The eroding stream banks tend to be located in a few subwatersheds of Richland Creek.
Figure 18. Sources of Sediment to Streams in the Richland Creek Subwatershed
There are seven VWIN Richland Creek sites reported in the November 2001 Annual Report from the Environmental Quality Institute. One is located on Richland Creek above Waynesville, two on Hyatt
Creek, one on Plott Creek in Hazelwood, one in the Allen Creek Watershed, one on Eaglenest Creek in
Hazelwood, and one on Richland Creek at Lake Junaluska.
The site on Richland Creek above Waynesville (about a mile below Balsam Gap) tested in the good
range—a reduction from earlier years. The Allen Creek VWIN site also tested in the good range. The Plott Creek site was in the average range - a reduction from previous years. The sites on Eaglenest Creek
and on Richland Creek above Lake Junaluska ranked below average – both reductions from earlier years.
Both the upper and lower Hyatt Creek sites tested in the poor range. The median levels for turbidity, total
suspended solids, orthophosphate, and nitrate/nitrite-nitrogen for these two Hyatt Creek sites were substantially above the median average for all the VWIN sites in western North Carolina.
TVA did biological monitoring (EPT and IBI) at two sites in Richland Creek—at Vance Street Park and on Raccoon Creek at the Junaluska Elementary School. The fish assessment for both sites (IBI data) was
in the poor range. The EPT data was in the poor to fair range at the Vance Street Park site, and fair at the
Raccoon Creek site. TVA’s evaluation of the Vance Street Park site indicated that the diversity of both fish and intolerant insects was much less than expected, suggesting poor water quality. The proportions of
omnivorous fish and diseased fish among the fish sampled were the worst found at any site in Haywood
County. At the Lake Junaluska School site, the TVA comments indicated that compared to other streams

41
of its type, the aquatic communities would be classified as poor. Severe problems observed in the physical
habitat included reduced instream cover, sedimentation, low habitat diversity, bank instability, and limited riparian vegetation. These TVA site observations in 1998 seemed to be borne out by some of the IPSI
source data.
The State of North Carolina listed six EPT sample sites in the Richland Creek subwatershed. One was in the Shiny Creek Watershed above the Allen Creek reservoir, and it tested in the excellent range. Two
were in the Hyatt Creek Watershed and they tested in the poor to fair range. Two of the sites were on
Richland Creek at SR 1519 and the old Dayco site—they both tested in the fair or fair to good range. The most encouraging site was in Waynesville at SR 1184. Several samples were taken over a 14-year period
from 1983 to 1997. The first samples tested poor but gradually tests improved to fair, and the latest sites
were ranked in the fair to good range.
There are a variety of water quality conditions in this subwatershed. The contrast between the biological
data indicates some long-term habitat issues that are not being picked up by the grab samples taken by the
VWIN volunteers. Some of the volunteers have commented on the fact that it is seldom raining when they take samples, so sediment levels would be low. Stormwater events quickly turn the streams brown with
sediment. More detailed sediment monitoring is needed to better identify the nature and quantity of the
material actually moving down Richland Creek. At this point, Lake Junaluska provides one of the best measures of sediment movement within the watershed.
Jonathan Creek
The Jonathan Creek Watershed contains 42,777 acres. It is the smallest of the four subwatersheds.
Originating on the western boundary of the Pigeon River Watershed, it flows in a northeasterly direction
to its confluence with the Pigeon River. The Town of Maggie Valley is located along Jonathan Creek. The Town of Maggie Valley obtains their municipal water from an intakes on Campbell Creek and
Jonathan Creek. The State has designated this municipal supply watershed as WS-III. However, unlike
the Waynesville water supply, this watershed is privately owned. The quality of the water supply, and the cost of treatment, depends on minimizing the adverse effects of upstream activities.
The Town of Maggie Valley has initiated greenway efforts along a portion of Jonathan Creek. These
efforts, in addition to providing additional recreation opportunities, will provide permanent streamside buffer for Jonathan Creek and increase public awareness of water quality issues.
The IPSI data classified 74% of this watershed as forested. As with Richland Creek, this percentage does not reflect the infrastructure changes that have already been made with planned and developing
subdivisions. The forested acreage will be substantially less in a few years. Residential land use accounts
for 10% of the land area—second highest to Richland Creek. Pasture accounts for 9% (pasture in fair condition accounts for 7.5% of the subwatershed acreage). Commercial use accounts for 2% of the land
area. Other uses account for 4%, and tilled cropland accounts for 1%.
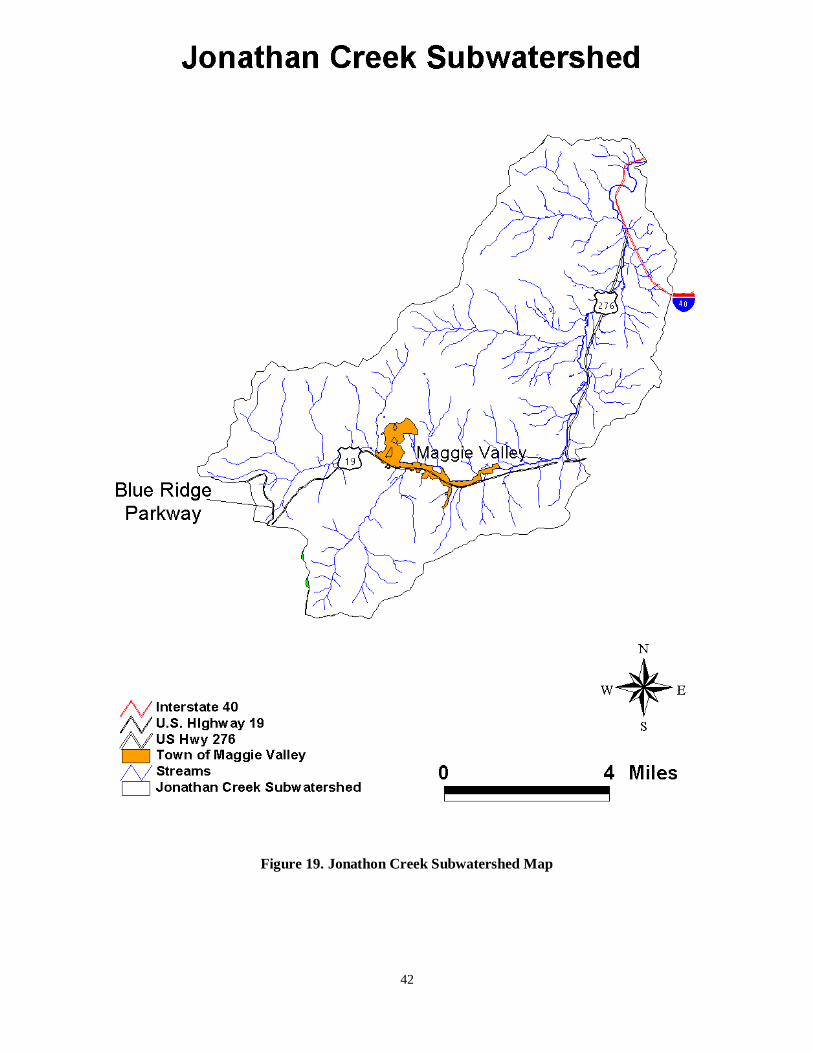
42
Figure 19. Jonathon Creek Subwatershed Map

43
There are 567 miles of all categories of roads in this subwatershed. This amounts to a road density of one
mile of road for 75.4 acres of land. This road density is second only to the Richland Creek Watershed.
Erosion along roads accounts for 46% of the sedimentation originating in this subwatershed. Eroding
stream banks account for 29%. Eroding pastures account for 9%, animal access 7%, cropland 5%, and
other uses about 4%.
Figure 20. Sources of Sediment to streams in the Jonathon Creek Subwatershed
Two VWIN site were included in the 2001 report. The upstream site is located at Moody Farm Road; the lower site is located near the confluence with the Pigeon River. The upstream site tested in the excellent
range, but the lower site fell to below average. This is the third consecutive drop in the rankings for this
site. TVA conducted biological monitoring on one site in Jonathan Creek in July of 1997. That site is located where White Oak Road crosses the creek. The EPT ratings were in the good range, with a good
variety of intolerant insects and no serious problems in observed stream habitat. The IBI (fish) sampling
indicated the site was in the poor/fair range, with too many omnivorous and diseased fish. There were also moderate deficiencies in expected fish diversity and abundance. The State of North Carolina lists
three EPT stations in Jonathan Creek, at SRs 1306, 1322, and 1349. These sites were sampled in August
of 1992 and July of 1997. The site off SR 1306 tested in the excellent range both times. The other two
sites tested good or fair to good in 92, but in the excellent range in 1997.
As with the Upper Pigeon Watershed, this watershed is in better shape than either Richland Creek or the
Lower Pigeon. The long-term concern is protecting the riparian corridor and minimizing adverse affects from increased development in the watershed. Careless mountainside development is one of the greatest
risks to the long-term health of this watershed.
44
Reducing Sediment
Sediment originates from hundreds of sources. This report focuses on the major sources, as it is more cost
effective to apply limited funds to the activities causing the greatest problems. However, all of us can
identify localized sources of sediment in our own neighborhoods and often in our own yards.
Sediment in streams originates from water flowing over exposed soil and carrying it to nearby
watercourses. It has been defined as soil particles, namely sand, silt, and clay, being carried by flowing
water. The amount of soil carried off the site is a function of a number of factors, including soil types and conditions, slope, rate of precipitation (volume), land use, and land form. To reduce the amount of
sediment produced from an activity, it is necessary to interrupt some aspect of the erosional process that
carries sediment to the stream. The North Carolina Sedimentation Pollution Control Act of 1973 requires that sediment be retained on site. Current attempts to achieve this goal in the Pigeon River Watershed
have been ineffective.
Any discussion about reducing sediment in the mountains of the Pigeon River Watershed must focus on managing runoff from storm events. Practically all soil loss and sedimentation occurs during periods of
heavy rains. For example, while an established roadway will erode as long as it is in use, at least 10-20
times the average annual erosion occurs as a result of storm events during the first year of its existence. Until effective practices can be found to eliminate this flush of sediment during this initial construction
phase, we will continue to have a serious sedimentation issue in this watershed.
The following concepts are a few of the components in an integrated approach to reduced erosion and
sedimentation. They often have to be combined in creative ways to address the challenges of developing
land and resources on steep and fragile sites.
One of the simplest approaches is to revegetate exposed soil areas. The key to successful use of this
approach is rapid revegetation. Much of the soil loss occurs when the site is newly disturbed. The sooner
vegetation is restored, the less soil will leave the site. The type of vegetation depends on the site, but in many cases sediment can be substantially reduced by proper and timely application of seed, fertilizer, soil
amendments, and mulch.
As the Pigeon River Watershed is developed, some changes made to the landscape can cause expensive problems in the future. It is far more economical to prevent pollution and degradation of our waterways
than it is to clean them up after the damage has been done. Simply leaving a buffer strip of natural plants
along our streams can help avoid problems that would be costly to correct. This vegetation helps protect the riparian zone of the stream.
“Riparian” comes from the Latin riparius, meaning “that which frequents river banks,” which in turn was taken from the Latin noun ripa meaning “bank of the river.” The riparian area is the land adjacent to
rivers and streams, and it is influenced by the stream’s natural hydrologic cycle. Riparian areas improve
water quality by serving as buffer zones that help protect our waterways from nonpoint source pollution.
Healthy functioning wetlands and riparian areas are important for a variety of reasons. They provide
ecological, social, and economic benefits. They also provide income from commercial and recreational
uses and provide savings from improved water quality.
Wetlands and riparian areas are critical to wildlife. They improve water quality and provide wildlife
habitat by:
Slowing and reducing stormwater runoff and reducing soil erosion

45
Removing chemicals and excess nutrients
Recycling nutrients and removing sediment from surface water
Serving as habitat for fish, shellfish, waterfowl, endangered species, and other wildlife
Providing shade and cooling trout streams
Providing transportation corridors for wildlife to move from one area to another
Retaining water during heavy rainfall and slowly releasing it to downstream areas, thus lowering
floodwater peaks and maintaining stream flows during dry periods
Softening the landscape with ribbons of green and undeveloped natural areas
Providing opportunities for recreation, scientific study, and aesthetic enjoyment of our wildlife in
their natural habitat.
As wetlands and riparian areas are lost to development, soil erosion, flooding and sedimentation of our
lakes, rivers, and streams will increase. These problems can be reduced with proper planning and conservation-based development. The quality of life and outdoor experience enjoyed in Haywood County
is directly related to our water quality, and water quality depends on the existence of wetlands and
riparian areas.
In cases where there is no adequate streamside buffer at the time of site disturbance, a number of artificial
means can be employed to reduce erosion. The effectiveness of these practices depends on proper
installation and maintenance. They operate on the same principle as the buffer—slowing the water flow so the sediment load can settle out on the land rather than in the stream. These approaches include silt
fences, hay bales, and other filter materials placed so as to intercept overland water flows.
Retention ponds can also serve to slow the running water, allowing the sediment to settle out on site before the water moves downstream.
Another approach is to avoid concentrating water flows, particularly in steep terrain. Concentrating flows greatly increases the erosive capacity of the water. Culvert spacing on roads illustrates this concept. If
there are not enough culverts along road sections, the volume and velocity of the water will greatly
accelerate erosion in the ditch line of the road and eventually the adjacent cut banks and roadbed. Intercepting the water with properly spaced and installed culverts, then dispersing the water from the
culvert outlet so it can be readily absorbed into the ground, will reduce this problem.
Concentrating stormwater runoff creates major problems downstream in the watershed. Concentrating large volumes of water from roads, driveways, roofs, and other impervious sources can alter stream
morphology. Destabilizing stream courses not only destroys aquatic habitat but also greatly accelerates
the rate of bed and stream bank erosion. If enough water is concentrated in a stream course, there may be no option short of hardening the stream course to hold the banks in place. However, this practice merely
transfers the problem to other downstream segments.
The most effective tool to minimize erosion is a good plan. A good plan will identify where the desired
practices will best fit on the landscape and incorporate proven measures to minimize erosion. Avoiding
problem areas and sites during the planning and design phase is one of the most cost-effective strategies
for good project design and good conservation.
Installing these planned sediment retention structures and practices before construction may be one of the
most effective ways to minimize downstream impacts. Installing properly designed sediment retention practices before the first earth is moved for the project avoids having to play catch-up later during the
project.

46
Financial and Technical Assistance
Management of our watersheds and the water quality of our streams, lakes, and river are closely related.
The stewards of land resources can and do impact the water quality of our streams. The land management
decisions they make are critical for present and future water quality in Haywood County. Reducing
erosion on one parcel of land not only benefits that landowner but all those downstream whose land was impacted by the problem before it was corrected.
Most landowners want to be sure that their practices have a minimum impact on the streams that flow through their property. In some cases, an individual or corporation may inherit or acquire problem sites.
In both cases, the landowner may not fully recognize the nature of the problem, and may not have the
experience, training, or resources to design and implement the most effective ways to maintain or improve water quality. Many forms of technical and financial assistance have been developed to help
landowners in these situations.
Almost all assistance will involve some form of professional help to insure that the planned measures accomplish the desired objective. Cost share payments can substantially reduce the cost to the landowner
of implementing specific practices. Cash payments and/or tax incentives are also available to landowners
interested in protecting critical resource areas in perpetuity through conservation easements and similar instruments. Much of the assistance available for Pigeon River projects is summarized in Appendix II.
Financial Assistance
A variety of financial incentives and assistance are available to qualifying landowners. Some conservation
programs offer cash payments, others offer tax relief for income tax and estate taxes. Qualifying program
uses may include riparian area improvements and protection, wetland restoration, and cost share programs for other qualifying land improvements.
Proven conservation techniques called Best Management Practices (BMPs) can be employed to minimize the impact of land-disturbing activities. Some BMPs are simple and inexpensive. Others may require
extensive analysis, careful planning, and significant investment. Due to the cost of some land
improvements, cash payments are often needed to enable landowner participation. Cost share payments
for such things as stream bank repairs, excluding cattle from streams, providing alternate water sources, and revegetating riparian areas are a few examples of direct financial assistance.
Figure 21. Agricultural site in Elk Garden, VA before and after pasture and stream
BMPs were installed. BMPs were in place for one year.
Indirect benefits in the form of tax credits or reduced state and federal taxable income may interest other landowners. In some instances, a substantial reduction in estate taxes will be possible. Reduced tax

47
obligations may enable the heirs to keep the estate intact. If the primary incentive is tax benefits,
landowners should consult a qualified tax advisor.
Landowners interested in permanently protecting important riparian areas on their properties could benefit
from a variety of conservation easement programs supported by the state and federal government. Some
programs provide cash payments for conservation easements or fee purchase of riparian areas. The State of North Carolina provides significant income tax credits for the donation of conservation easement to an
appropriate entity. The federal government may provide income tax deductions for such donations. If so
desired, easements can be written to maintain less intensive land uses—such as agriculture in lieu of subdivision development. Such easements may serve to reduce property and inheritance taxes, permitting
a property to remain in the family.
Technical Assistance
Technical assistance, including engineering in some cases, is available through the Haywood Soil and
Water Conservation District and the local offices of the USDA Natural Resources Conservation Service. These organizations work with landowners on a variety of programs and administer cost share programs
for agricultural improvements. They provide help in analyzing land and water quality problems, help
landowners select BMP options best suited to their land, and provide current information on the availability of program funds they administer. Their local personnel, addresses, and telephone numbers
are listed in Appendix II of this plan.
Landowners have a range of options and may select those programs that meet their individual needs and
land management strategies. Appendix II outlines some basic program information that may be helpful in
identifying programs of interest to the reader. The North Carolina publication “A Guide for North
Carolina Landowners” goes into a more in-depth discussion of the available programs and the types of property, such as riparian areas, wetlands, prior converted wetlands, agricultural land, and forests that
may qualify. The availability of program funds varies annually with appropriation levels approved in state
and federal budgets and public demand for these funds. Contact the administering agency for current funding levels and eligibility criteria.

48
Other Options for Nonpoint Pollution Abatement
Technical and financial assistance addresses current problems. However, it is more effective to prevent
problems in advance. This approach has the greatest potential for avoiding water quality degradation of
the Pigeon River and its tributaries in Haywood County. There is substantial information in this field for
many agricultural practices. There is considerably less guidance for managing stormwater runoff and erosion from mountainside development. Therefore, much of this section will focus on issues associated
with stormwater runoff, roads, and mountainside development.
Research, Training, and Education
Most individuals want to insure that their particular use of a property does not adversely affect water quality. However, as became evident during discussions of the Lake Junaluska issue, many people do not
recognize erosion issues in their neighborhood until faced with an immediate problem directly affecting
them. One of the first priorities must be to increase awareness and understanding of nonpoint pollution
and its consequences within the Pigeon River Watershed.
Some awareness training is already occurring and needs to continue. Examples include the annual Kids in
the Creek program where all 8th graders in Haywood County have a hands-on introduction to water
quality issues. Increasing the awareness of students will pay large dividends in the future. The Haywood
Soil and Water Conservation District also provides classroom training to Haywood County school
children through classroom programs tailored to the specific needs of the class. Conservationists also provide staffing for public information booths at local fairs and other events.
The North Carolina Cooperative Extension Service, Haywood Soil and Water Conservation District, and
the Natural Resource and Conservation Service have considerable information to assist landowners in determining everything from the best plants to grow under various conditions to the best practices to
apply to prevent or cure an erosion problem. Helping people find and use this information is an ongoing
challenge.
The Haywood Waterways Association makes regular presentations to interested organizations and
individuals about the sources of and solutions to nonpoint source pollution in the Pigeon River
Watershed. That information provides perspective on the issues we are facing, and these efforts need to continue.
More education and training is needed in the area of stormwater management. Stormwater management is often thought of as an urban issue. However, mountainside development greatly concentrates water
runoff. Certain stormwater control practices can be effective in reducing problems within and
downstream of the development. These practices utilize the processes of detention/retention, settling, percolation, evaporation, evapotranspiration, filtration, adsorption, and biological uptake to reduce flows
and remove pollutants. Proper maintenance of such practices on a long-term basis in new developments
could reduce the impacts of the development on downstream waters. The Land Of Sky Regional Council
publication Stormwater Management in North Carolina: A Guide for Local Officials provides more information about these specific practices.
However, reducing nonpoint pollution in the face of accelerating development pressure requires new initiatives. For example, state approved BMPs do not exist for roads in mountainside developments.
There are some guidelines in a few brochures published by various agencies. Such information needs to
be made available to builders, contractors, realtors, property owners, and others. However, more is needed. Substantial research is necessary to find practices that actually contain the sediment on the site.
This research will require new partnerships between landowners, developers, local governments, and

49
qualified research institutions and agencies. Our soils, slopes, and precipitation patterns provide special
challenges. Various practices need to be applied and monitored to gauge their effectiveness in road construction, subdivision design, and stormwater management. A collection of proven local practices
could then be made available through local training sessions, local, state, and federal conservation
agencies, the public libraries, the Haywood Waterways Association website, and other locations.
Examples, principles, and practices associated with conservation-based development need to be collected
and distributed. There is a gradually developing body of knowledge associated with development that
begins with the objective of minimizing impact while maintaining profitability. Before the first spade of earth is turned, the site is evaluated based on its assets and suitability. Problem areas (such as steep
slopes, wet areas, unstable soils, etc.) are dedicated to open space with the appropriate trails and other
amenities. Houses are built closer together on the more suitable lands. The result is that up to 50% fewer miles of roads are built, and almost as many lots are sold at higher prices. The net profit remains about the
same, and land and water resources are less impaired.
Part of the education process involves learning more about the nature of the sediment problem. There is a lot of helpful water quality information being collected by a variety of entities for a number of purposes.
However, sediment is the greatest water quality issue we face, and there is no specific sediment
monitoring occurring in the watershed. Proportional sediment and bedload monitoring stations at key points in the watershed would provide useful information about the nature of the sediment (particularly
particle size), the quantity, and changes over time. Sediment monitoring would help assess the
effectiveness of BMPs and assess trends over time.
There is a need to better understand the factors controlling basin sediment yields, sediment transport and
storage dynamics, and channel stability within the Pigeon River Watershed. Much of this understanding
can be obtained by analyzing the watershed’s geomorphic history; more specifically, how the channels have responded to catastrophic flooding, previous land use alterations, natural shifts in climate, wildfires,
and a host of other disturbances. For example, railroad logging in the early 1900s may still be affecting
drainage systems and sediment delivery within the Pigeon River Watershed. Without understanding how the river system is responding to these past impacts, we may be treating more of the symptoms than the
overriding problems. Unfortunately, there is little data related to these factors in the southern
Appalachians. Studies that focus on the river systems geomorphic stability and sediment transport
kinematics would help explain and address some of the underlying causes of the current degradation in water quality.
Incentives
Incentives can be effective tools in implementing change. A common tool used by many public and
private organizations is a performance bond. Before an undertaking commences, the contractor is required to post a performance bond. Compliance with the terms of the contract insures that the bond is released
after the project is completed. However, if there are portions of the contract that are not completed to
standard, the bond can be used to correct those problems. In the case of subdivision development,
Haywood County already includes provisions for obtaining performance bonds for soil and water conservation measures. Implementing this existing authority would provide another tool for insuring that
agreed upon BMPs are properly applied during development.
Another approach would be to establish a fee for a development permit. All or part of the fee could be
waived for those builders and developers that have successfully completed training in soil and water
conservation practices for road and subdivision development, including stormwater management.
50
County or town impact fees could be assessed based on the acres disturbed. These funds could be used to
correct nonpoint pollution problems in Haywood County.
Another form of incentive is to place attractive features beside waterways. Greenways provide a number
of watershed benefits. The undisturbed space adjacent to the stream serves as a filter and buffer for runoff
entering the stream. Much of the sediment is trapped before it reaches the stream. The woody vegetation along the stream maintains cooler stream temperatures, enhancing aquatic habitat conditions. Greenways
are also good places to locate recreational facilities, such as trails. Trails provide outstanding places to
educate visitors about watershed conditions. In addition, recreation users will be concerned and effective monitors of changing water quality conditions. This public awareness will generate its own incentives to
encourage good stewardship of watershed lands.
The State of North Carolina has passed laws to encourage the donation of conservation easements.
Individuals or corporations making such donations receive a $250,000/ $500,000 tax credit for such
donations. In addition, donors may qualify for tax deductions from the federal government. If developers
or other landowners were encouraged to make such donations, either to the County/Towns or a qualifying nonprofit land trust, it would help minimize the adverse affects of the associated surface disturbance
while enhancing the attractiveness of the development. It would also be an effective way of reducing the
development density and pressure on the watersheds.
Regulations and Ordinances
Haywood County officials are very aware of the issues associated with roads on steep mountain slopes.
There are ongoing efforts to develop appropriate ordinances for road construction. If such ordinances
could be written to incorporate the most effective BMPs for roads and stormwater management, they
could lessen some of the problems associated with new roads.
A number of communities are dealing with similar issues in western North Carolina. Some municipalities
and counties are developing innovative approaches to reducing watershed impacts. In Haywood County, the Town of Waynesville has implemented a slope/density ordinance that is intended to reduce the density
of development on the steeper slopes. Effective sharing of these experiences and practices can benefit all
communities.
Some of the current procedures in the building trade industry tend to encourage builders to do their
stabilization work after all other work is done. Some lending institutions currently include stabilization
work as a part of the last “draw” on the approved construction funds. Stabilization work could be more effective if some of the practices could be encouraged as soon as the site is graded and foundation
completed.
By the same token, occupancy permits could incorporate staged stabilization requirements. This would
help insure that appropriate erosion control measures are in place before the interior work begins on the
house.
Regulations/ordinances could also be developed for riparian zones. Establishing requirements that
minimize the disturbance of the riparian areas and encourage revegetation of problem areas would be an
effective tool in the efforts to maintain water quality.
There are other approaches being used in other jurisdictions. While they may not all be applicable to
Haywood County situations, they indicate the range of options used to address the issue of rapidly expanding development adjacent to fragile resources.
51
The first of these addresses the protection of riparian areas. As mentioned previously, riparian areas play
key roles in water quality protection. They serve as buffers, stabilize stream banks, and keep the water cool. They are also great “open space” places that attract people. They can make good locations for trails
and are important wildlife habitat components.
Montgomery County, Maryland, places a lot of value on its riparian corridors. Because of the water quality issues affecting the Chesapeake Bay, the State of Maryland has provided statutory guidance to
counties to insure that riparian zones are protected. The counties adopt various approaches. Montgomery
County is a suburban county adjacent to Washington, DC, with a population of about 800,000. The development permitting process involves sign off by several County agencies. During the process, the
riparian corridors on the property are evaluated based on their water protection needs as well as their
value as corridors for trails, utilities, etc. Depending on the location, terrain, and infrastructure needs of the area, the developer is required to donate a no-disturbance easement, or an easement that does not
allow residential development in the corridor, but will accommodate such needs as utility corridors, trails,
etc. The easement width on each side of the stream will vary between 100 and 200 feet.
The State of Vermont has enacted statutes to guide or regulate development in all areas of the State. One
of the best known is Act 250, which was originally enacted in 1970 and subsequently has been amended.
The legislature created a state environmental board and district environmental commissions with the power to regulate the use of lands and to establish state planning capability. The control of the
commissions is exercised through a permitting process. The permitting process is often triggered by
project or lot size. For example, subdivisions containing more than ten lots require an Act 250 permit.
Some states have tried legislative approaches to encourage local planning that addresses a number of
issues, including conservation and nonpoint pollution issues. During the past quarter-century, at least nine
states have adopted laws that establish policy and regulatory frameworks for governmental guidance of urban development and conservation. These statutes followed many decades in which states generally
authorized local governments to control the location and nature of development. These states erected new
legal and institutional structures that integrate state, regional, and local guidance of urban development and conservation of natural resources. The laws establish comprehensive state goals and policy priorities
for community development and institute new intergovernmental procedures for achieving those goals
and priorities.
Monitoring and Enforcement
There are a number of good guidelines already in place. Haywood County has an erosion and sediment control ordinance. While it does not address all of the issues mentioned above, full compliance with the
provisions will reduce sedimentation. However, there is only one person to enforce the provisions of this
ordinance. Due to workload, violations may go unchecked. The more support and assistance the County can give that position, the cleaner our waters will be.
State and federal agencies also have effective erosion control practices built into contracts. However,
these entities have limited resources dedicated to monitoring and enforcement of these important provisions. It is always easier to obtain appropriations to build than to monitor. In the rush of a project,
situations can develop in which erosion control practices are ignored or improperly applied. This can be
particularly critical on watersheds like Richland Creek where Lake Junaluska collects all the sediment that gets into the stream. It would be in the best interest of Haywood County for interested individuals to
become familiar with these erosion control requirements and alert the appropriate state or federal official
of observed problems. Such action to enforce existing requirements will not only reduce erosion, but also let everyone know that folks in Haywood County do not want their waters to serve as settling ponds for
poorly implemented projects.
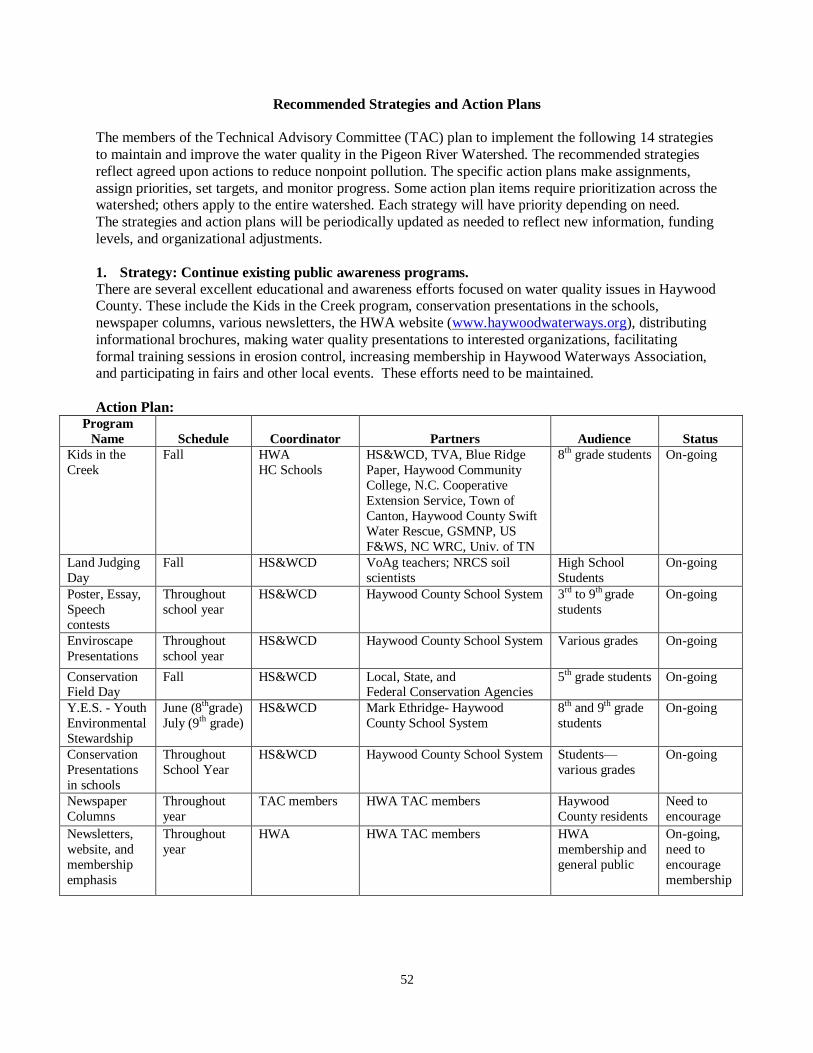
52
Recommended Strategies and Action Plans
The members of the Technical Advisory Committee (TAC) plan to implement the following 14 strategies
to maintain and improve the water quality in the Pigeon River Watershed. The recommended strategies
reflect agreed upon actions to reduce nonpoint pollution. The specific action plans make assignments,
assign priorities, set targets, and monitor progress. Some action plan items require prioritization across the watershed; others apply to the entire watershed. Each strategy will have priority depending on need.
The strategies and action plans will be periodically updated as needed to reflect new information, funding
levels, and organizational adjustments.
1. Strategy: Continue existing public awareness programs.
There are several excellent educational and awareness efforts focused on water quality issues in Haywood County. These include the Kids in the Creek program, conservation presentations in the schools,
newspaper columns, various newsletters, the HWA website (www.haywoodwaterways.org), distributing
informational brochures, making water quality presentations to interested organizations, facilitating
formal training sessions in erosion control, increasing membership in Haywood Waterways Association, and participating in fairs and other local events. These efforts need to be maintained.
Action Plan: Program
Name Schedule Coordinator Partners Audience Status
Kids in the
Creek
Fall HWA
HC Schools
HS&WCD, TVA, Blue Ridge
Paper, Haywood Community
College, N.C. Cooperative
Extension Service, Town of
Canton, Haywood County Swift
Water Rescue, GSMNP, US
F&WS, NC WRC, Univ. of TN
8th grade students On-going
Land Judging
Day
Fall HS&WCD VoAg teachers; NRCS soil
scientists
High School
Students
On-going
Poster, Essay,
Speech
contests
Throughout
school year
HS&WCD Haywood County School System 3rd to 9th grade
students
On-going
Enviroscape
Presentations
Throughout
school year
HS&WCD Haywood County School System Various grades On-going
Conservation Field Day
Fall HS&WCD Local, State, and Federal Conservation Agencies
5th grade students On-going
Y.E.S. - Youth
Environmental
Stewardship
June (8thgrade)
July (9th grade)
HS&WCD Mark Ethridge- Haywood
County School System
8th and 9th grade
students
On-going
Conservation
Presentations
in schools
Throughout
School Year
HS&WCD Haywood County School System Students—
various grades
On-going
Newspaper
Columns
Throughout
year
TAC members HWA TAC members Haywood
County residents
Need to
encourage
Newsletters,
website, and
membership
emphasis
Throughout
year
HWA HWA TAC members HWA
membership and
general public
On-going,
need to
encourage
membership

53
Program
Name Schedule Coordinator Partners Audience Status
Water quality,
nonpoint
source
presentations
to community
Throughout
year
TAC members HWA TAC members Interested
organizations
and general
public
On-going,
have given >
60 present.
Training in
erosion control practices
Annually HWA HWA TAC members
Clear Water Contractor Wkshop
Homebuilders,
realtors, farmers, etc.
On-going
Displays at
community
events
During event TAC members HWA TAC members General public On-going
HWA Summer
Youth
Program
Summer HWA HWA, HC Schools Rising 6th and 7th
grader students
On-going
Distributing
informational
brochures
Throughout
year
TAC members HWA TAC members General public Some
members are
doing this
2. Strategy: Expand public awareness programs.
The public has expressed concerns about how invisible the technical and financial assistance programs are
to folks with water quality issues on their property. Part of this perception results from the fact that the target audience for some of these services is changing. The TAC will explore a variety of options to
increase public awareness of what is available and where to get information and/or help. These ideas
include major newspaper inserts, coverage on local TV broadcast and Haywood County access channels,
public service announcements on local radio stations, participating in on-air interviews, and meeting with property owner associations and community organizations. We must respond to every opportunity to
increase public understanding of the water quality issues facing residents of the Pigeon River Watershed.
Action Plan:
New Initiative Schedule Coordinator Partners Target Audience Status
Training in stormwater
management
Phase II SW
permit period
HWA TAC
members
Canton, Clyde and
Waynesville,
developers
Starting 2006
Create library of mitigation
measures for land disturbing activities.
On-going HWA TAC
members
Developers, public
officials
Starting 2006
TV PSAs on local access
channels and WLOS—TV;
Radio Interviews
On-going HWA, Project
Leader
TAC
members
Haywood County
Residents
Some events have
occurred but more
should be done
Presentations for property
owners, realtors, builders,
farmers, and other
community associations
On-going HWA, Project
Leader
TAC
members
Organizations with
specific activities
directly affecting the
watershed
On-going but
could do more
Distribute copies of the
revised Watershed Action
Plan
On-going HWA, Project
Leader
TAC
members
Haywood County
residents, local, state,
and federal agencies,
granting institutions
Starting 2006

54
3. Strategy: Continue and improve water quality monitoring.
The VWIN monitoring by local volunteers will be continued. The data that is gathered and the need for more sites are good reasons for future grants. Continued biological monitoring by DWQ, WRC, TVA,
and others will be encouraged. In addition, sediment-monitoring stations will be continued and
established in the watershed as funding permits. These stations are needed to better define our current
situation, validate model estimates, assess trends over time, and monitor the effectiveness of pollution abatement practices and projects installed in the watershed.
Action Plan: Water quality monitoring can be performed through several methods: physical/chemical monitoring, such
as is obtained through the VWIN program; biological monitoring, such as the EPT and IBI data; and
sediment monitoring, such as provided by bedload and proportional samplers. The VWIN program is developing good baseline data from a growing number of stations. However, the number and location of
some of the stations need to be adjusted from time to time to provide assessments of changing conditions.
The EPT and IBI data provide longer-term indicators of water quality, but there are still unresolved issues
as to the appropriate metrics for IBI information. Sediment is the most significant issue in the Pigeon River Watershed. However, sediment-monitoring efforts have been limited to total suspended solids and
turbidity samples taken during the VWIN process. Therefore, the TAC plans the following measures to
enhance the water quality monitoring process in the Pigeon River Watershed: 1. Share information about changing conditions and threats to the watershed to determine if the VWIN
sites need to be increased or relocated. Annually assess the number and location of the sample
stations to insure they represent the highest priority needs for water quality information. 2. Annually review the parameters included in the VWIN tests to determine if they are the
measurements that provide the most useful information about watershed conditions.
3. Insure that grant requests incorporate appropriate levels of funding to support monitoring. Adding
sediment-monitoring stations will be a priority. 4. Stay current with water quality sampling science and technology to insure that the Pigeon River
Watershed monitoring provides cost-effective and useful information.
5. Increase monitoring to evaluate the success of BMP projects. 6. Support the Pigeon River Recovery Project with mapping the Pigeon River and collect habitat and
sediment data, which can be used as baseline for achieving measurable results.
7. Support TVA with IBI evaluations on target streams.
8. Evaluate DWQ monitoring sites and recommend moving, if necessary.
4. Strategy: Encourage studies of sediment yields, transport, and storage and channel stability. What is occurring in stream channels is a reflection of upstream watershed conditions; both current and
past. Upstream changes can have long-lasting effects. However, there is little information about these
dynamics in the Pigeon River Watershed. Geomorphic and stratigraphic studies in the watershed are needed to better understand the forces shaping the drainage system. In cooperation with interested
universities, research organizations, and agencies, funding will be sought to initiate such studies.
Action Plan: The long-term effectiveness of many stream stabilization and erosion control practices depends on a
sound understanding of the dynamics at work within the watershed. For example, it is critical to
determine how much of the sediment being deposited in Lake Junaluska is a function of past practices, how much is stored in the stream bed, and how much of it originates from overland flows over new
disturbance. Of that which is eroded as a result of new activities, it is essential to refine our information
on where most of the sediment is derived. Also of importance is an assessment of whether the current stream course is down cutting or aggrading and why. Sediment monitoring will provide some of these
55
answers, but will not answer the important question of “why” they are occurring. The following actions
are planned to address the lack of needed information: 1. A literature search will be conducted to gather what information exists for the southern Appalachians.
2. Public and private research organizations will be contacted to determine where the interest and
capability resides to develop cost-effective geomorphic-stratigraphic studies.
3. A study approach will be developed with interested cooperators. 4. Grant funding will be sought for these studies.
5. The results will be published to disseminate the information to those involved with restoration efforts;
and assist in the development of sound, fiscally responsible restoration activities. 6. Rate Haywood County streams using the Rosgen stream classification system; this information will
help identify needs for stream restoration projects and possibly help resolve sedimentation issues.
7. Use the 2006 IPSI data set to locate new areas of erosion and compare to the 1999 data to determine how the watershed has changed with development and the 2004 floods.
5. Strategy: Coordinate with the Haywood Erosion Control Board and County Commissioners. The Erosion Control Board and the County Commissioners share an interest in clean water for Haywood
County. They are in a position to effect some of the most beneficial long-term watershed protection
measures for the Pigeon River Watershed. The TAC must keep these County officials fully informed of all pollution abatement efforts underway on the Pigeon River Watershed. On another level, these officials
often struggle with the appropriate responses to the changes occurring in Haywood County. The TAC can
increase their ability to assess the watershed impacts of a variety of “what if” scenarios.
Action Plan:
The Erosion Control Board generally meets on a quarterly basis and the County Commissioners meet
twice a month. 1. The TAC will periodically request opportunities to brief the Board and Commissioners when
significant actions are about to occur (release of WAP, receipt of grant funds, initiation of significant
watershed research or other initiatives, release of potentially controversial information, etc.). 2. In order to further a regular dialog, the Project Leader of HWA will submit quarterly summaries of
HWA/TAC activities to both organizations.
3. Representatives of these County organizations will be invited to annual HWA meetings and
significant field trips within and adjacent to Haywood County. 4. The Chairman of the Erosion Control Board and the County Manager will be given ad hoc briefings
on current activities and issues.
6. Strategy: Encourage development of greenways along riparian corridors.
Riparian corridors are critical elements for water quality. Greenways can serve as multi-use corridors along streams that protect riparian values while providing recreation and wildlife corridors. In many
cases, they can be coordinated with corridor planning to provide sites for certain types of linear land uses
that do not conflict with riparian protection objectives. There are several ongoing efforts in Haywood
County focused on greenways; examples include efforts at Canton Recreation Park, Maggie Valley, and Richland Creek Greenway between Lake Junaluska and Vance Street Park. These efforts often need
support and specific resources to succeed, including grant writing, trail planning and design, easement-
drafting services, negotiating skills, and other assistance.
Action Plan:
Greenways are multi-function corridors providing multiple public benefits while conserving critical resources. Many are located adjacent to streams. Greenways provide a site for a variety of linear uses,
including recreation trails. They help maintain wildlife corridors and habitat. However, one of their most

56
significant values is that they protect riparian zones along streams. In this capacity, they help stabilize
stream channels, maintain cooler water temperatures, and serve as effective filters that prevent harmful pollutants from entering the stream.
There are several greenway efforts currently underway in the Pigeon River Watershed. These include the
greenway at the Canton Recreation Park, the Maggie Valley Greenway effort, and the Richland Creek greenway currently being developed between Lake Junaluska and Vance Street Park. The TAC will
support the Greenways Advisory Council efforts in the following ways:
1. Provide publicity and public support to these efforts through conservation columns in local newspapers, organization newsletters, web sites, and other media.
2. Provide technical support where members of the TAC and HWA have skills and/or resources that can
further the establishment and long-term maintenance of the greenways. 3. Assist in grant writing where the proposed greenway will provide significant riparian protection in
threatened stream corridors.
4. Host public forums as needed to focus attention and support for greenway initiatives.
5. Maintain a library of resources to assist in the planning and development of greenways.
7. Strategy: Encourage donation of conservation easements. Conservation easements can be gifts that keep on giving. They provide a mechanism whereby a
landowner can donate property rights to a public agency or qualifying nonprofit corporation. The rights
they donate can insure that the property is maintained in its present use—whether agriculture, forestry, or limited residential. Easements can maintain certain desirable land uses and open space, reduce
development pressure on sensitive watersheds, protect riparian areas, and perform many other functions.
Since such gifts are considered to be in the public interest, the federal government and the State of North
Carolina have enacted favorable tax laws for such gifts. In the case of North Carolina, an individual can receive up to $250,000 in tax credits for a donated conservation easement. The federal government
allows a tax deduction for the donation. Conservation easements can also provide a substantial estate and
inheritance tax advantage. Federal estate taxes imposed on the value of a person’s assets after he or she passes away can be severe, sometimes forcing heirs to sell the land to pay the taxes. An easement reduces
the value of the taxable assets, therefore lowering the potential estate tax liability.
There are a number of ways to encourage such donations, ranging from public support to providing specialized skills to complete such transactions. There are numerous situations in Haywood County
where such easements could reduce the pressure on the watershed, allowing other watershed improvement
practices to be more effective and long-lasting.
Action Plan:
The value of conservation easements includes protecting special places; maintaining open spaces; protecting water quality, wildlife habitat, and viewsheds; providing recreation and educational
opportunities; and maintaining prime farmland in agriculture. From the standpoint of the Pigeon River
Watershed, one of the key values is reducing development density on steep mountain slopes. Reducing
development density means fewer roads, house sites, driveways, and other watershed impacts. Reducing density also reduces the amount of impervious surfaces in the watershed and the associated stormwater
runoff. The TAC plans the following actions to support the Haywood Soil &Water Conservation District
and the Southwestern NC Resource Conservation & Development Council: 1. Provide publicity and public support to easements through conservation columns in local newspapers,
organization newsletters, web sites, and other media.
2. Provide technical support where members of the TAC and HWA have skills and/or resources that can further the donation of conservation easements.
57
3. Maintain a library of resources providing introductory information on the nature of easements; their
structure, form, and function; and the federal and state tax implications. 4. Link up interested landowners with the appropriate agencies and organizations to facilitate the
donation of appropriate easements.
5. Support efforts to obtain state, federal, and grant funding to acquire easements to protect prime
farmland and sensitive mountain resources. 6. Maintain membership in the Southern Appalachian Highlands Conservancy, a regional land trust
serving the southern mountains.
7. Identify and prioritize sites for easements.
8. Strategy: Continue to provide financial and technical assistance. The TAC members represent the organizations in Haywood County providing technical and financial
assistance for correcting sources on nonpoint pollution. These efforts will continue and focus on specific
problem areas, such as the Lake Junaluska Watershed. The variety of GIS data available to the TAC,
together with the knowledge and experience of committee members should help obtain funds to address many of the most significant existing sources of nonpoint pollution. Grants will be sought from the
Pigeon River Fund, the NC Clean Water Management Trust Fund, EPA Section 319 Program, and other
grant-making organizations with conservation goals. Other sources of funding and assistance, including state and federal appropriations, will be investigated.
Action Plan: Haywood County has access to a variety of state and federally funded programs that can assist
landowners in dealing with a variety of conservation issues. Many of the TAC members are responsible
for delivering those services. Funding for this work is generally very limited, but the existing programs
and service contacts are listed in Appendix II.
9. Strategy: Design and implement BMPs to improve water quality. Once landowners have indicated an interest in correcting a problem on their property, and agreed on an
approach, the specific practice must be designed and installed. In some cases, the practice may be very
simple, such as planting appropriate tree species along a creek bank. In other cases, considerable thought
and design goes into identifying the most effective practice and designing it to achieve the desired result. This is particularly true of structural modifications along streams and roadways, as well as those designed
to manage stormwater runoff. The TAC members include a number of people with experience and skills
to implement the BMPs. Also, the revised 2006 IPSI data will update the extent of impact, measure possible improvements, and identify possible new sites to focus efforts.
Action Plan (the specific action items are found at the end of this section): This strategy addresses correcting existing known problems by putting into place practices that will stop
or substantially reduce erosion and sedimentation. There are many approved BMPs for specific land-use
issues. For example, eroding stream banks can be stabilized by establishing woody vegetation along the
banks or hardening the stream banks with gabions or other structures, with several practices between these extremes. The most suitable practice depends on the nature of the stream, soil structure, adjacent
land use, downstream considerations, and other factors. Once the most suitable practice is determined,
that practice must be properly designed to withstand peak water flow conditions as well as accomplish the desired objective. After design, the practice is installed by trained professionals with the Haywood Soil
and Water Conservation District, or by hired contractors specializing in watershed restoration.
These practices can be expensive, and financial resources are limited. Individual landowners decide
whether they are willing to participate in installing the practice on their property. The funding formulas
58
often require some percentage of cost sharing or in-kind support from the landowner. Therefore, while it
may be possible to agree on priorities in the abstract, practical considerations may require a more flexible approach to specific watershed improvement implementation. Improvements that are not in the highest
priority watersheds will still make substantial contributions to the overall condition of the Pigeon River.
In the case of the Pigeon River Watershed, two areas stand out as having the most significant water quality issues: the Lake Junaluska Watershed (primarily the Richland Creek subwatershed) and the Fines
Creek–Rush Fork section of the Lower Pigeon subwatershed. Lake Junaluska has experienced major
sedimentation problems that appear to be increasing in severity and cost to cure. The Lake is of critical importance to Haywood County for its sense of place and substantial economic benefits. There are also a
limited number of acceptable options as to where to place the silt once it is removed. Reducing the rate of
sedimentation is critical to the long-term viability of this resource. The VWIN data indicates the Fines Creek–Rush Fork Creek Watersheds have some of the most significant water quality issues of any
streams flowing into the Pigeon River and should be a priority for water quality improvement efforts.
All streams included on the 303(d) list are also priority. These are streams in the Pigeon River Watershed that the State of North Carolina has classified as being impaired to the point of not meeting the water
quality standards for their designated uses. Since this plan is focused on nonpoint pollution, we are only
concerned with those stream segments that are impaired due to nonpoint pollution. The following stream segments are on the most current list: portions of Richland Creek and Raccoon Creek.
There is also a developing concern in the Jonathan Creek Watershed. The mountainsides around Maggie Valley are subject to substantial development pressure. There are a number of new or planned
developments in the area. The latest VWIN sample indicated a reduction in water quality. Given that
roads are the primary source of sediment in the watershed, and many new roads are being built, it
deserves attention. The first approach has to be the application and enforcement of the existing Haywood County Erosion and Sediment Control Ordinance. In addition, this watershed is an excellent candidate
for applied research on practices to contain sediment on site. Monitoring may need to be enhanced.
There can be special circumstances where nonpoint pollution problems outside the above watershed areas
will rank high for funding. For example, situations threatening public health and safety (road hazards,
etc.) or people’s homes could be priorities regardless of the watershed location. There can also be
situations where a local government may want to cooperate in correcting erosion issues on public property. The opportunity to demonstrate progress in such a visible and cooperative way may outweigh
some other considerations. If there is hesitancy on the part of landowners in a particular watershed to
participate in watershed improvement projects, establishing significant demonstrations in adjacent watersheds may further long-term water quality objectives.
There are many sources of nonpoint pollution. However, the IPSI information indicated certain sources were particularly significant. For purposes of BMP implementation, the focus will be on practices that
address the most significant pollutants and sources.
Richland Creek Eroding stream banks are the number one cause of sedimentation in this watershed. There are 43,654 feet
of eroding stream bank. These eroding banks are on properties ranging from a few tenths of an acre to
farms that are over a hundred acres in size. Hundreds of properties are faced with this problem. While it would be a desirable goal to correct all eroding stream banks, it is probably not feasible. The experience
of a sister association in the Little Tennessee Watershed indicates that after a watershed improvement
program is funded, the long-term limitation will be landowner participation. While many landowners are willing to participate, not everyone will be interested at the time the funds are available. This plan

59
proposes a 5-year goal of stabilizing 23,000 feet of eroding stream bank. This is just over 4,000 feet a
year, and at the end of five years is estimated to reduce sedimentation from current sources by 25%.
Roads are the next most significant source of sediment in this watershed. There are 625 miles of roads,
with 308 miles unpaved. About 26% of the unpaved roads in this watershed have eroding road banks,
visible from aerial photographs. About 8% of the paved roads have eroding road banks. Eroding road banks are one of the greatest contributors of sediment from roadways. Just stabilizing the eroding road
banks in this watershed would make a substantial improvement in water quality.
Making progress in this area may take more time than with the eroding creek banks. There are no state
approved BMPs for stabilizing existing road networks in the mountains. However, roads are a major and
growing source of sediment and stormwater runoff for all the Pigeon River subwatersheds. This plan proposes to obtain funding for one or two demonstration projects within the Richland Creek Watershed
over the next year. The projects will be done in areas with established homeowners associations. The
potential treatment areas will be identified by the number of feet of eroding road banks. Associated
erosion control needs will be addressed while working in the area. These funds will be used to apply and evaluate a variety of practices where needed—stabilizing road banks, hardening ditches, adding culverts,
installing settling ponds, and other practices. Very steep sections of roads may even be considered for
paving to reduce gully and sheet erosion. The work and effects of the practices will be monitored. Those successful practices will be documented and incorporated in subsequent grant requests. The goal for this
plan is to reduce the existing backlog of eroding road banks and other road-associated erosion problems
by 25% over the next five years (about 26 miles of stabilized road banks—just over 5 miles per year). That accomplishment could reduce sediment in Richland Creek by 8%.
Pasture condition and animal access points account for 14% of the sediment in Richland Creek streams.
There are 3,071 acres of land in the watershed classified as pasture in fair condition. There are 35 clearly identified animal access points. The variety of proven practices to address these concerns ranges from
fencing for pasture rotation to providing alternate water sources so livestock can be fenced out of the
streams. Many of the properties with eroding stream banks also have pasture condition and animal access concerns. Therefore, to make the most efficient use of resources, landowners participating in stabilizing
eroding stream banks will also have an opportunity to obtain assistance in improving pasture and animal
access situations. Any additional federal or state funding for programs focused on these resources will
further improve accomplishments in this area. The five-year goal for addressing the agricultural concerns is to move 30% of the pastureland from the fair category to the good category, and to achieve a similar
reduction in animal access points (921 acres of improved pasture, ten animal access points). This
accomplishment would reduce sedimentation by an additional 4%.
Richland Creek has the highest percentage of riparian area in marginal to inadequate condition. Although
the right and left bank totals differ slightly, there are roughly 40 miles of riparian corridor in marginal to inadequate condition along each bank of the streams in this subwatershed. Some of the stream bank
stabilization work may be as easy as reestablishing a narrow tree- or brush-covered strip adjacent to the
stream. In other cases, establishing riparian vegetation may be a component of a larger project that
stabilizes the bank and stream flow characteristics. There will also be a variety of incentives offered to landowners willing to restore riparian conditions along streams. The goal for the 5-year planning period
is to move 10 miles of the riparian corridor on each side Richland Creek streams from inadequate or
marginal to adequate. While there is not a specific sedimentation reduction benefit calculated for this practice, the presence of restored riparian corridors will prevent future stream bank erosion and filter
sediment from other sources before it reaches the stream.
The total targeted reduction for the five-year period is 37% from all BMPs in the Richland Creek
Watershed. This reduction will have a measurable affect on water quality and the amount of sediment
60
arriving in Lake Junaluska, provided the other strategies are implemented concurrently with these
practices. It is as necessary to prevent new sources as it is to fix existing problems.
Fines Creek
Fines Creek is a rural watershed, containing 16,878 acres. Residential use is a fraction of what it is in the
Richland Creek Watershed. However, there are 196 miles of roads in this subwatershed (1 mile for every 86 acres). Agriculture is a significant land use. Pasture uses account for 23% of this watershed area,
compared with 10% in the Richland Creek Watershed. There are over 600 acres of pasture in poor
condition, and 2,637 acres of pasture in fair condition. About 15% of the stream banks are eroding (62,193 feet), and only 7% of the riparian zones were classified as adequate condition. There are about
100,000 feet of eroding road banks. There are at least 16 animal access points.
Based on the assumptions used for the Richland Creek action plan, a 35% reduction in nonpoint pollution
from existing sources in five years would be a reasonable goal. An EPA Section 319 Program grant
obtained by HWA and the Haywood Soil and Water Conservation District will provide funds to begin
work. Those funds are earmarked for Fines Creek and Hyatt Creek (in the Richland Creek Watershed). It is likely that the money available for Fines Creek will correct 5% of the eroding stream banks and up to
10% of the poor pasture conditions. Those funds should also address about 5% of the existing animal
access points. That would leave a five-year target of correcting an additional 30,000 feet of eroding stream banks, fencing livestock out of the creek at five points, and improving the poor pasture conditions.
Rush Fork Creek Rush Fork is also a rural watershed, containing 3,763 acres within the Lower Pigeon subwatershed. Less
than 1% of this watershed is dedicated to light residential land use. However, pasture land accounts for
29% of the land area. The majority of the pasture was classified as being in fair condition, though there
was a small acreage of overgrazed and poor pasture. It has one of the smallest percentages of eroding stream banks in the County; just over 1% of the stream banks in this small watershed were classified as
eroding in the IPSI. However, it has the highest density of animal access points of any of the watersheds
studied in this analysis, about one per 376 acres compared to 1 per 1000 acres in Fines Creek, and one per 1,250 acres in Richland Creek. There are 44 miles of roads in this small watershed (1 mile per 86 acres).
Much of the work in this watershed will need to focus on reducing the number of animal access points by
providing alternate water sources and fencing. Pasture improvement practices will also be a priority. The goal over the next five years will be to reduce the number of animal access points by 50%, improve the
condition of the 60 acres of overgrazed and poor pasture, and assist farmers in improving pasture
conditions on 40% of the pastures in the fair category.
Specific action items:
1. There are many different sources of nonpoint pollution in the Pigeon River Watershed. For the purposes of BMP implementation, the focus will be on practices that address sources contributing the
largest amount of sediment. The following table lists the primary sources of nonpoint source
pollution in the Richland Creek, Fines Creek and Rush Fork Creek subwatersheds and the five-year
goals for improving water quality. Two other concerns in this action item are the limited number of options to place silt from Lake Junaluska
once it is removed and how to address development pressure in the Jonathan Creek watershed. The first
approach to address development pressure mentioned in the WAP was the application and enforcement of the existing Haywood County Erosion and Sediment Control Ordinance.

61
Table 1. Goals and progress for design and implementation of Best Management Practices. (revision needed)
Nonpoint Sources Problem 1 yr goal 5 yr goal Improvementsa Notes
Richland Creek (Lake Junaluska, not including Hyatt Creek): total target sediment reduction for five years is 37%
Eroding stream banks 43,654 ft Stabilize 4,600 ft Stabilize 23,000 ft 6,250 ft Estimate reduce sedimentation
25%.
Eroding road banks 105.5 miles (80.1 unpaved;
25.4 paved)
Stabilize 5.3 miles (4
unpaved, 1.3 paved)
Stabilize 26.4 miles (20
unpaved, 6.4 paved) None
Conceptualb; could reduce
sediment in Richland Creek 8%.
Pasture conditionc 3,071 acres in fair condition Improve 184 acres to
good condition
Improve 921 acres to
good condition
In construction
phase
Along with reducing animal
access points, would reduce
sedimentation 4%.
Animal access pointsc At least 35 Decrease by 2 Decrease by 10 ~1
Along with improving pasture
condition, would reduce
sedimentation 4%.
Riparian corridor ~40 miles in marginal to
inadequate condition
Improve 2 miles on each
stream-side to adequate
Improve 10 miles on each
stream-side to adequate 9,250 ft
Fines Creek: total target sediment reduction for five years is 35%, funding provided by EPA Section 319 grant
Eroding stream banks 62,193 ft Stabilize 6,621.9 ft Stabilize 33,109.7 ft 750 ft 5% from EPA 319 grant
Eroding road banks ~100,000 ft
(probably most unpaved) -- -- --
Roads were not a target of the
EPA 319 grant
Pasture condition 600 acres in poor condition;
2,637 acres in fair condition
Improve 120 acres of poor
pasture to good
Improve the 600 acres of
poor pasture to good 111 acres 10% from EPA 319 grant
Animal access points At least 16 Decrease by 1+ Decrease by 6 ~3 5% from EPA 319 grant
Riparian corridor 93% classified as
inadequate condition -- -- 9,455 ftd
Riparian corridors were not a
target of the EPA 319 grant
Rush Fork Creek (no target sediment reduction goal established in the WAP)
Eroding stream banks ~ 1+% classified as eroding -- -- -- Not included as goal in the WAP
Eroding road banks Information not available -- -- -- Not included as goal in the WAP
Pasture condition
Majority of 1091.3 acres in
fair condition, 60 acres in
poor condition
Improve 12 acres of poor
pasture and 8% of fair
pasture
Improve all poor pasture
and 40% of fair pasture None Funding has not been received
Animal access points ~ 10 Decrease by 1 Decrease by 5 None Funding has not been received
Riparian corridor Information not available -- -- -- Not included as goal in the WAP a Improvements include projects completed, in the construction phase or in the design and engineering phase.
b Questions that need addressed: Is landowner interest high? Because it is a new initiative, are funds obtainable? Have any state approved BMPs for
stabilizing existing road networks in the mountains been established? One goal is to obtain funding for one or two demonstration projects. c Many properties with eroding stream banks also have pasture condition and animal access concerns. To make the most efficient use of resources, landowners
participating in stabilizing eroding stream banks will also have an opportunity to obtain assistance in improving pasture and animal access situations. d Although improving riparian corridors were not a target of the EPA 319 grant, riparian conditions were improved with improvements to pasture condition and
stream banks and reducing animal access points.

10. Strategy: Identify and support effective state and federal water quality improvement programs,
and local organization dedicated to improving water quality in the watershed. There are a variety of federal and state funded programs focused on reducing nonpoint source pollution.
A few of these could be particularly effective in the Pigeon River Watershed, such as the US
Environmental Protection Agency, Tennessee Valley Authority, Wildlife Resources Commission, DENR
Division of Water Quality, Pigeon River Fund, Clean Water Management Trust Fund, and the Pigeon River Recovery Project. One example is the Environmental Quality Incentives Program (EQIP). The
program provides assistance with BMPs to landowners that have approved conservation plans. However,
this program depends on federal appropriations. Increased awareness and support of such programs could result in increased appropriations for Haywood County.
Action Plan: A number of federal and state programs focus on conservation and reducing nonpoint source pollution.
However, funds are limited, with stiff competition for the available appropriations. The TAC is an
excellent coordination and networking resource that can function to improve the chances for funding
important conservation needs in Haywood County. The following actions are planned with HWA’s Project Manager acting as coordinator:
1. Maintain a current database of existing programs. The database will include primary program
objectives, responsible agencies and local contacts, federal or state oversight and appropriation committees, Haywood County funding history, and an estimate of qualifying projects in the Pigeon
River Watershed.
2. Annually identify and focus efforts on those programs that have the greatest potential to substantially contribute to nonpoint pollution source reduction in the Pigeon River Watershed.
3. Compile briefing papers in support of these selected programs.
4. Increase public awareness of the potential benefits of obtaining state and federal appropriations
through the targeted programs. 5. Annually contact our elected officials to inform them of the opportunities to assist Haywood County
in addressing nonpoint pollution issues.
6. Support the Bethel Rural Community Association in their farmland preservation efforts.
11. Strategy: Seek additional skills as needed to meet ongoing and project needs.
While the skills exist for the current level of BMP implementation, these strategies should substantially increase the rate at which BMPs will be designed and installed. In order to keep up with the needs,
additional technical assistance skills will be needed. There are a number of approaches that could be
used, depending on the amount of funding, length of the funded programs, and nature of the skills needed. These options include increased staffing for the Haywood Soil and Water Conservation District Office,
detailing personnel from other locations, or contracting with private specialists. A combination of all
three may be appropriate.
Action Plan:
As funds are obtained to install BMPs and to address increasingly complex nonpoint pollution issues,
conservation agencies in Haywood County may need additional staff and/or a different mix of skills. Much of the effectiveness of nonpoint source pollution abatement efforts will depend on the skills
available to the County. The TAC provides a valuable coordinating structure among conservation
organizations in the Pigeon River Watershed to assess skill needs. The following actions are proposed to address this issue:
1. At least once a year, devote a portion of a regular TAC meeting to an assessment of existing
watershed protection skills and identification of any shortages. 2. When substantial shortages are identified, the TAC will consider a range of options on how best to
obtain those skills.

63
3. In cases where it appears most effective to add permanent positions, the TAC will develop a strategy
to decide where the position should be located and how to obtain the necessary funding and support for the increased staffing.
4. Implement the agreed-upon strategy.
12. Strategy: Provide incentives for watershed protection.
In order to maintain and improve the water quality of the Pigeon River Watershed, we will have to change
our practices. Change is difficult. Incentives can provide recognition to conservation leaders, help defray costs, and reward new initiatives. They can take many forms. Examples include certification programs,
County and State recognition, fee offsets for important training, and providing materials to implement
practices (such as grass seed and trees). Designing incentives in support of the most needed changes will provide additional publicity and provide affirmation to the individuals and corporations willing to be first.
Action Plan:
Achieving the North Carolina goal of keeping the sediment on the site will require changed behavior on the part of many segments of our society. Incentives provide a means of making the change easier by
focusing on a goal rather than a regulation. They may also help homeowners, developers, and farmers
increase profits. Any incentive should include signage and/or articles. These will require support from HS&WCD and NC Cooperative Extension to do certifications. A certification program may also help
gather support for future 319 funded projects. The following measures will be adopted to encourage the
development of incentives to encourage improved practices: 1. The TAC will develop a range of watershed protection incentives, such as “Certified Green Farmer”,
“River Friendly Farmer”, “River Friendly Homeowner”, and “River Friendly Subdivision”.
2. The TAC will contact development and agricultural interests to determine the most effective form of
incentives, and contact other jurisdictions to learn from their experience. 3. The TAC will adopt three of the most promising incentives to put in place by January 1, 2007.
4. HWA/HS&WCD will request funding to support implementation of these incentives.
5. The TAC will develop and implement a public information campaign to develop understanding and support for these incentives.
13. Strategy: Support our public officials as they consider changes in watershed protection and
enforcement of watershed protection ordinances.
It is important for HWA to be proactive and get on the front end of ordinance changes. We need to
increase our presence in the county, which will increase our ability to help our public officials. Several good ordinances exist for protecting water quality (e.g., the erosion control ordinance). The tough part is
enforcement. One of the key positions in the effort to control nonpoint pollution is the County Erosion
and Sedimentation Control Officer. Haywood County is fortunate to have an experienced person on the job who is committed to seeing that the ordinance is enforced. However, there is more work than one
person can accomplish.
There are potential benefits in exploring the opportunities to have the three municipalities adopt the Haywood County ordinance. This would provide a consistent ordinance for all activities on the Pigeon
River Watershed. This unified approach would have the potential of generating enough support to hire a
second erosion control officer for the area. For example, there are state cost-share funds available for helping start or expand erosion and sedimentation control programs. A broader, county-wide effort may
make Haywood County eligible for such funding. Haywood County is also developing ordinances for
rural subdivision development and other activities that affect water quality. As with erosion control, it is important that effective enforcement of these regulations be supported.

64
The members of the TAC have to understand the basis for current ordinances, the barriers to change, and
incentives that would encourage change. This strategy includes sharing information, participating in the development of ordinances, publicly supporting key issues, lobbying for new ordinances, and lobbying
for increased funding and staff. The TAC has a variety of technical resources that can help implement this
strategy. Many committee members bring years of experience to the task of protecting water quality in the
Appalachian Mountain areas. The addition of a variety of GIS resources permits a level of analysis that was only dreamed of a few years ago. The members are pooling their hardware, software, GIS and GPS
data, databases, and other information to provide a useful watershed analysis tool. The technical
assistance provided by Haywood Community College greatly increases the effectiveness of the committee members in completing such analyses.
Action Plan: This is one of the most important and challenging action items. It includes issues that range from visible
public support for actions taken to protect water quality to support for appropriate funding and staffing
levels. The identified actions are:
1. Understand and stay up to date with the Haywood County watershed protection ordinances (such as the erosion and sediment control ordinances, proposed subdivision ordinances, etc.)
2. Participate in the development of effective ordinances to protect water quality.
3. Become familiar enough with the County processes to determine if there are barriers to effective enforcement. Identify any such limitations, and implement strategies to help remove those barriers.
4. Encourage a consistent set of watershed protection ordinances for the county and municipalities of the
Pigeon River Watershed. 5. Identify sources of funding that may be available to assist in improving enforcement of existing
ordinances. Work with the County and municipalities to obtain such funds when needed.
6. Increase public understanding of the ordinances through presentations, conservation columns, and
other media. Support public training sessions for contractors and others in the application of practices called for in the County ordinances.
7. Assist the County Commissioners gather all local, state and federal ordinances relating to land
development for creation of a public information brochure and a master document for use by the public officials.
8. The TAC will identify existing infrastructure and construction practices that adversely affect water
quality.
9. The TAC will select those identified practices that have the most potential for improving water quality. The TAC will develop a strategy for implementing the needed changes.
10. In cases where implementation of the changes can be facilitated with financial assistance, HWA will
apply for the needed funds. 11. Evaluate what state-wide ordinances don’t work in the mountains and what holes exist in the current
local, state and federal ordinances.
12. Track ongoing local and state legislation, rule making, and planning processes that have significant implications for water quality. Submit appropriate comments and recommendations at the
appropriate time.
13. Participate in committees, task forces, forums, and other collaborative planning processes focused on
reducing nonpoint pollution. 14. Develop an ongoing relationship with local, state, and federal officials whose decisions affect the
quality of water in the Pigeon River Watershed. Keep them aware of the need to maintain the quality
of water in the Pigeon River Watershed. 15. Assist local governments obtain funds and skills to address nonpoint source pollution abatement
opportunities.
16. Recognize and support initiatives by all levels of government that help keep our waters clean.

65
14. Strategy: Participate in the planning, design, and monitoring of publicly funded surface-
disturbing projects in the Pigeon River Watershed. The members of the TAC have years of experience and special knowledge that may be of help to federal,
state, and local agencies when planning and designing publicly funded projects. Participating with those
agencies from the beginning of any proposed project could reduce watershed impacts and
planning/implementation costs. Participation will also help insure that design and contract specifications address watershed concerns for the specific project. Once the contracts are let, periodic monitoring of the
work will help insure that the design and contract provisions are fully implemented.
Action Plan:
Action items include:
1. Maintain a current list of all planned and active publicly funded construction projects in the Pigeon River Watershed.
2. Maintain a current record of the watershed protection requirements incorporated in federal, state, and
local government contracts.
3. Request placement on the appropriate mailing lists to obtain advance notices of public planning processes, contract schedules, and other activities leading to surface-disturbing activities in the
Pigeon River Watershed.
4. Participate in public forums in advance of contract development to insure that the water quality concerns of the Pigeon River Watershed are fully addressed in subsequent plans and contract
specifications.
5. Consider establishing monitoring sites in advance of major construction projects to monitor changes in water quality directly attributable to the project. Look for opportunities to have this monitoring
incorporated as a contract requirement.
6. Periodically visit ongoing projects. Document obvious contract violations. Share the documentation
with the appropriate agency contact and request appropriate corrective action.
66
Literature Cited
Anderson, Brian, Riparian Zones. Illinois Steward.
Board of Conservation and Development, Water Resources of NC. Raleigh, NC, Jan. 1955.
Carter, Mark W., et al., A Geologic Adventure Along the Blue Ridge Parkway in North Carolina. Bulletin
98. Raleigh: North Carolina Geological Survey Section; Division of Land Resources, 1999. 60pp.
DeMers, Michael N., Fundamentals of Geographic Information Systems (Second Edition). New York:
John Wiley & Sons, Inc. 2000. 498pp.
Eaker, William M., Stormwater Management in North Carolina: A Guide for Local Officials. Land of
Sky Regional Council, February 1994. 60pp.
Environmental Quality Institute, Water Quality Trends of Haywood County: Year-Four Report. Technical Report #00-076, UNCA, October 2000. 24pp.
Frome, Michael, Strangers in High Places. Knoxville: University of Tennessee Press 1994. 392pp.
Haywood County Economic Development Commission, Community Profile, Haywood County, NC.
Waynesville, NC.
Iowa State Agroforestry Research Team, Your Guide on How to Make a Riparian Buffer Strip. Iowa State
University, 1995.
Medford, W. Clark, Mountain People, Mountain Times. Asheville, NC: Miller Printing Company, 1963.
Nebel, Bernard, Environmental Science. Englewood Cliffs, NJ: Prentice-Hall, 1981. 715pp.
N.C. Department of Environment and Natural Resources, Division of Water Quality, A Guide for North
Carolina Landowners: Financial Incentives and Technical Assistance Programs Which Apply to
Wetlands, Streams and Streamside (Riparian) Areas. Raleigh: September, 1999. 53pp.
North Carolina Department of Environment and Natural Resources, Division of Water Quality, French
Broad River Basinwide Water Quality Plan. Raleigh, NC. May 2000. 137pp.
Porter, Douglas R., State Framework Laws for Guiding Urban Growth and Conservation in the United
States. Mr. Porter first delivered this paper at a seminar held in White Plains at a conference sponsored by the Land Use Law Center of the Pace University School of Law in 1993.
http://www.kapa.org/statepla.htm
Reeves, Thomas H., A History of Haywood County. Graduate School of Arts and Sciences of Duke University, 1937. 121pp.
Rivers Alliance of Connecticut, The Importance of Streamside Buffers. Collinsville, CT: 1977.
Smith, Wendy, et al., “A Landowner’s Guide to Streambank Protection and Stabilization,” The Tennessee
Conservationist (September/October 1999)

67
Swank, W. T., et al., Long-term hydrologic and water quality responses following commercial
clearcutting of mixed hardwoods on a southern Appalachian catchment. Otto, North Carolina: USDA Forest Service, Southern Research Station, Coweeta Hydrologic Laboratory, 2000. 16pp.
Stuckey, Jasper Leonidas, North Carolina: Its Geology and Mineral Resources. Raleigh: Department of
Conservation and Development, North Carolina State University Print Shop,1965. 550pp.
Swanson, Robert E., A Field Guide to the Trees and Shrubs of the Southern Appalachians. Baltimore:
Johns Hopkins University Press, 1994. 399pp.
Tagliapietra, Ron, The Southern Sixers. Taylors, SC: Faith Printing, 1997. 134pp.
The Nature Conservancy and Southern Appalachian Forest Coalition. Southern Blue Ridge Ecoregional
Conservation Plan: Summary and Implementation Document. The Nature Conservancy: Durham,
NC, 2000.
Trails and Greenways. www.trailsandgreenways.org/TAG_active_pages/TechnicalAssistance/FactSheets/
United States Department of Agriculture, Forest Service Healthy Riparian Areas (FS-445); January 1990.
United States Department of Agriculture, Forest Service, North Carolina’s Timber Industry: An
Assessment of Timber Product Output and Use, 1997 (Resource Bulletin SRS-39). Asheville, NC: Southern Research Station, June 1999. 34pp.
United States Department of Agriculture, Natural Resources Conservation Service, Soil Survey of
Haywood County Area, North Carolina. Washington: Government Printing Office, October 1997. 276pp.
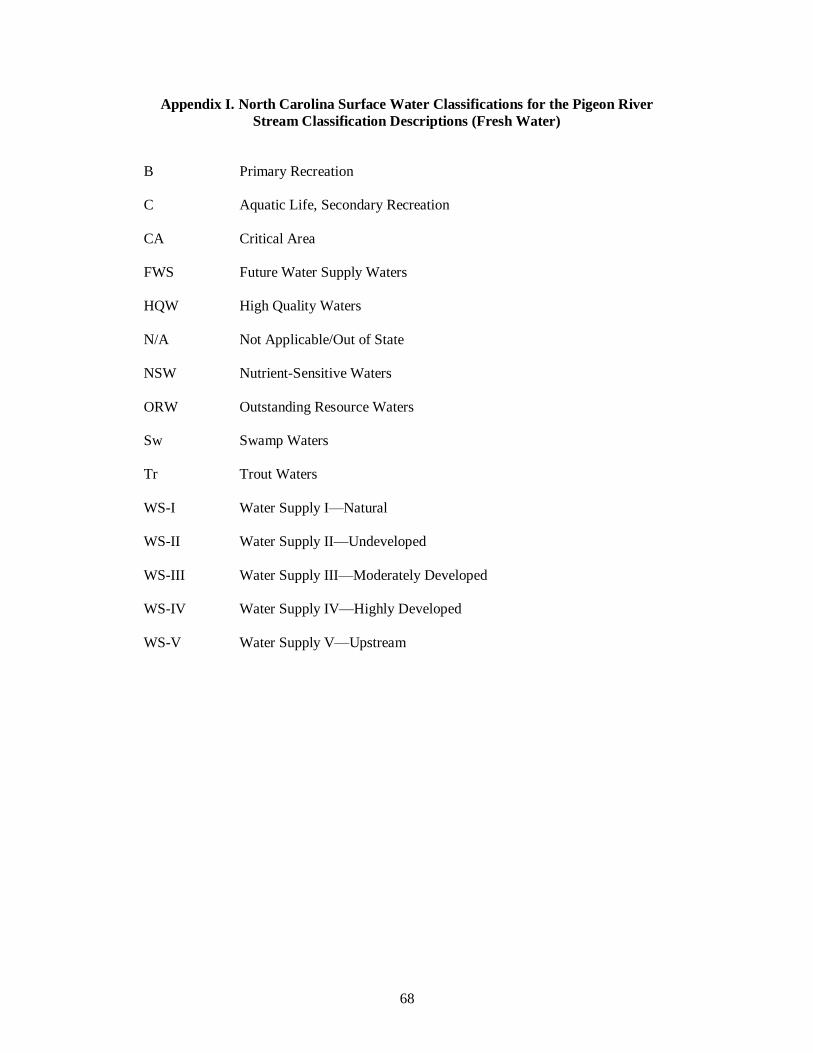
68
Appendix I. North Carolina Surface Water Classifications for the Pigeon River
Stream Classification Descriptions (Fresh Water)
B Primary Recreation
C Aquatic Life, Secondary Recreation
CA Critical Area
FWS Future Water Supply Waters
HQW High Quality Waters
N/A Not Applicable/Out of State
NSW Nutrient-Sensitive Waters
ORW Outstanding Resource Waters
Sw Swamp Waters
Tr Trout Waters
WS-I Water Supply I—Natural
WS-II Water Supply II—Undeveloped
WS-III Water Supply III—Moderately Developed
WS-IV Water Supply IV—Highly Developed
WS-V Water Supply V—Upstream

69
Appendix II. Summary of Technical and Financial Assistance Programs
in Haywood County, North Carolina
Haywood County Environmental Health Office, 1233 N. Main St. Box 8, Waynesville, NC 28786, 828-452-6682,
http://www.haywoodnc.net/health.html
Haywood County Planning Office, Haywood County Annex II, 1233 North Main Street Waynesville, NC 28786,
828-452-6632, http://www.haywoodnc.net /planning.html
Haywood County Erosion Control Program, Haywood County Annex II, 1233 North Main Street, Waynesville, NC 28786, 828-452-6706. http://www.haywoodnc.net/erosion.html
Haywood Soil and Water Conservation District, 589 Raccoon Road Suite 203, Waynesville, NC 28786, 828 452-
2741 x 3. http://www.haywoodnc.net/soil.html
Haywood Waterways Association, PO Box 389, Waynesville, NC 28786, [email protected],
www.haywoodwaterways.org
NC Cooperative Extension Service, Haywood County Center, P.O. Box 308, Waynesville, NC 28786, 828-456-
3575, www.ces.ncsu.edu/haywood/
NC Department of Environment and Natural Resources, Division of Forest Resources, Haywood County Headquarters, 88 Ed Greene Road, Clyde, NC 28721, 828-627-6551. http://www.dfr.state.nc.us/
NC Department of Environment and Natural Resources, Division of Water Quality, 2090 US Highway 70,
Swannanoa, NC 28778, 828-296-4500. http://h2o.enr.state.nc.us/
NC Department of Environment and Natural Resources, Wetlands/401 Water Quality Certification Unit, 1621 Mail
Service Center, Raleigh, NC 27699-1621, 919-733-1786, http://h2o.enr.state.nc.us/wetlands.html
NC Department of Environment and Natural Resources, Aquifer Protection Section, 2090 US Highway 70,
Swannanoa, NC 28778, 828-296-4500. http://h2o.enr.state.nc.us/agw.html
NC Department of Environment and Natural Resources, Land Quality Section, 2090 US Highway 70, Swannanoa,
NC 28778, 828-296-4500. http://www.dlr.enr.state.nc.us/pages/landqualitysection.html
NC Department of Transportation, 1500 Mail Service Center, Raleigh NC, 27699, 1-877-DOT-4YOU.
http://www.ncdot.org/
NC State Historic Preservation Office, Department Of Cultural Resources, 4617 Mail Service Center, Raleigh, NC
27699-4617, 919-733-4763. http://www.hpo.dcr.state.nc.us/
NC Wildlife Resources Commission, Mountain Region Coordinator, 20830 Great Smoky Mountain Expressway,
Waynesville, NC 28786, 828-452-2546. http://www.ncwildlife.org/
Southwestern NC Resource Conservation and Development Council, PO Box 1230, Waynesville, NC 28786, 828-
452-2519, www.rcdnet.org/directories/northcarolina
US Army Corps of Engineers, Asheville Regulatory Field Office, 151 Patton Avenue, Room 208, Asheville, NC,
28801-5006, 828-271-7980. http://www.saw.usace.army.mil/wetlands/where/ashville.htm
USDA, Natural Resources Conservation Service, PO Box 425, Waynesville, NC 28786, 828-456-5132
www.nc.nrcs.usda.gov
US Fish and Wildlife Service, Asheville Field Office, 160 Zillicoa Street, Asheville, North Carolina 28801, 828-
258-3939. http://nc-es.fws.gov/

70
Appendix III. Glossary
Biological Monitoring: Assessing water quality by analyzing the health, diversity, and habitat of living
organisms in a given stream segment. The sample data is compared against benchmark measurements to
describe the water quality conditions in the stream. Two commonly used forms of biological monitoring
evaluate ish populations and macroinvertebrate communities. The principle behind biological monitoring is that the ecological health of a body of water is reflected by its ability to support communities of aquatic
animals and plants that characterize the expected environmental conditions.
BMPs: Best Management Practices. A conservation practice or combination of practices designed to
maintain the productivity of the land while reducing point and nonpoint source water pollution. State
water quality agencies (or their designees) recommend BMPs based on local conditions and the most efficient use of natural resources and purchased inputs.
Conservation Easement: A legally enforceable, two-party agreement between a landowner and a
conservation group or government body. Conservation easements typically separate from ownership of land the rights that could adversely impact important conservation resources. The rights separated from
the land are generally called development rights, and often include subdivision and development, road
building, mining, and other activities whose exercise would damage important natural resources. The easement is based on the principle of the separability of land ownership rights. Easements are placed on
lands devoted to specified long-term conservation uses.
EPT Monitoring: A form of biological monitoring in streams or other bodies of water which focuses on
certain sensitive species within the aquatic macroinvertebrate communities. The acronym EPT comes
from the first letters of the orders of the mayflies, stoneflies, and caddisflies (Ephemeroptera, Plecoptera,
and Trichoptera). The structure of the complex macroinvertebrate community reflects the physical and chemical condition of the water.
EQI: Environmental Quality Institute, which conducts research on water contamination issues through the University of North Carolina at Asheville (UNC-A). Under the supervision of the chairman of the
Environmental Studies Department at UNC-A and the Institute’s director, the EQI serves citizen groups,
governmental agencies, and the private sector by providing information on water quality and other
environmental concerns. The objective of the EQI is to conduct technically rigorous and unbiased research to help interested parties gain accurate technical understanding of complex environmental issues.
(http://bulldog.unca.edu/eqi/)
GIS: Geographic Information Systems. Geographic information systems are tools for processing spatial
data into information to make decisions about some portion of the earth. As spatially oriented relational
databases, they deal with space-time data and often employ computer hardware and software. They include data input, storage and retrieval, manipulation and analysis, and reporting subsystems.
Greenways: Greenways are corridors of protected open space managed for conservation and recreation
purposes. Greenways often follow natural land or water features and link nature reserves, parks, cultural features, and historic sites with each other and with populated areas. Greenways can be publicly or
privately owned, and some are the result of public/private partnerships. Some greenways include trails—
paths used for walking, bicycling, horseback riding, or other forms of recreation or transportation—while others do not. Some greenways appeal to people, while others attract wildlife. From the hills of inland
America to the beaches and barrier islands of the coast, greenways provide a vast network linking
America's special places. http://www.trailsandgreenways.org/TAG_active_pages/TechnicalAssistance/ FactSheets/view_text.asp?SheetID=3)
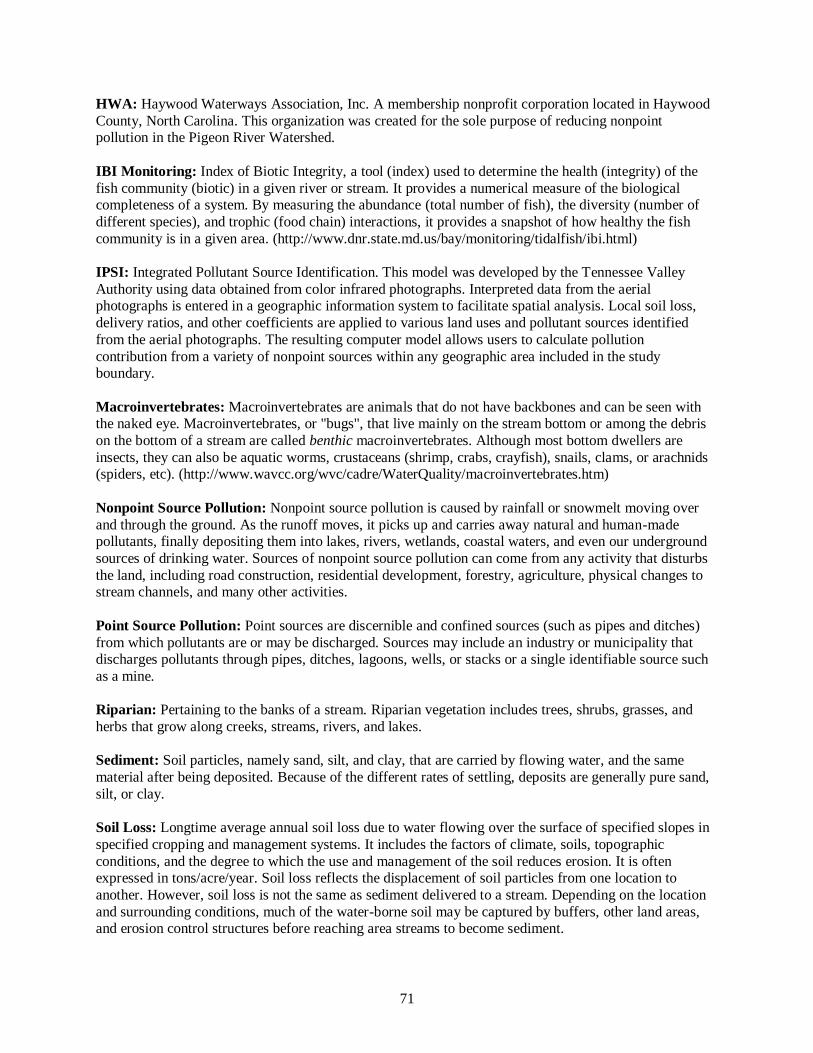
71
HWA: Haywood Waterways Association, Inc. A membership nonprofit corporation located in Haywood
County, North Carolina. This organization was created for the sole purpose of reducing nonpoint pollution in the Pigeon River Watershed.
IBI Monitoring: Index of Biotic Integrity, a tool (index) used to determine the health (integrity) of the
fish community (biotic) in a given river or stream. It provides a numerical measure of the biological completeness of a system. By measuring the abundance (total number of fish), the diversity (number of
different species), and trophic (food chain) interactions, it provides a snapshot of how healthy the fish
community is in a given area. (http://www.dnr.state.md.us/bay/monitoring/tidalfish/ibi.html)
IPSI: Integrated Pollutant Source Identification. This model was developed by the Tennessee Valley
Authority using data obtained from color infrared photographs. Interpreted data from the aerial photographs is entered in a geographic information system to facilitate spatial analysis. Local soil loss,
delivery ratios, and other coefficients are applied to various land uses and pollutant sources identified
from the aerial photographs. The resulting computer model allows users to calculate pollution
contribution from a variety of nonpoint sources within any geographic area included in the study boundary.
Macroinvertebrates: Macroinvertebrates are animals that do not have backbones and can be seen with the naked eye. Macroinvertebrates, or "bugs", that live mainly on the stream bottom or among the debris
on the bottom of a stream are called benthic macroinvertebrates. Although most bottom dwellers are
insects, they can also be aquatic worms, crustaceans (shrimp, crabs, crayfish), snails, clams, or arachnids (spiders, etc). (http://www.wavcc.org/wvc/cadre/WaterQuality/macroinvertebrates.htm)
Nonpoint Source Pollution: Nonpoint source pollution is caused by rainfall or snowmelt moving over
and through the ground. As the runoff moves, it picks up and carries away natural and human-made pollutants, finally depositing them into lakes, rivers, wetlands, coastal waters, and even our underground
sources of drinking water. Sources of nonpoint source pollution can come from any activity that disturbs
the land, including road construction, residential development, forestry, agriculture, physical changes to stream channels, and many other activities.
Point Source Pollution: Point sources are discernible and confined sources (such as pipes and ditches)
from which pollutants are or may be discharged. Sources may include an industry or municipality that discharges pollutants through pipes, ditches, lagoons, wells, or stacks or a single identifiable source such
as a mine.
Riparian: Pertaining to the banks of a stream. Riparian vegetation includes trees, shrubs, grasses, and
herbs that grow along creeks, streams, rivers, and lakes.
Sediment: Soil particles, namely sand, silt, and clay, that are carried by flowing water, and the same
material after being deposited. Because of the different rates of settling, deposits are generally pure sand,
silt, or clay.
Soil Loss: Longtime average annual soil loss due to water flowing over the surface of specified slopes in
specified cropping and management systems. It includes the factors of climate, soils, topographic
conditions, and the degree to which the use and management of the soil reduces erosion. It is often expressed in tons/acre/year. Soil loss reflects the displacement of soil particles from one location to
another. However, soil loss is not the same as sediment delivered to a stream. Depending on the location
and surrounding conditions, much of the water-borne soil may be captured by buffers, other land areas, and erosion control structures before reaching area streams to become sediment.

72
TAC: Technical Advisory Committee. A professional coordinating committee of Haywood Waterways
Association. The membership consists of individuals with hundreds of years of professional conservation expertise in a wide variety of fields and disciplines. The members represent a variety of agencies,
educational institutions, nonprofit corporations, and individual skills and interests. A current list of the
membership can be obtained by visiting the Haywood Waterways Association website
(www.haywoodwaterways.org).
VWIN: Volunteer Water Information Network, a partnership of groups and individuals dedicated to
preserving water quality in western North Carolina. Volunteers collect water samples once a month from designated sites along streams and rivers in the region.
Watershed: An area of land that catches rain and snow and drains or seeps into a marsh, stream, river, lake, or groundwater. The divide separating one drainage basin or catchment area from another.

73
Appendix IV. Technical Advisory Committee, Haywood Waterways Association, May 2014
Agency Representative
Attorney Sexton Tony
Bethel Rural Community Organization, Haywood County citizen Ivey George
DENR DWR Hydrogeologist Campbell Ted
DENR Natural Heritage, Western Region Freshwater Ecologist Leslie Andrea
Ecosystem Enhancement Program, Western Project Manager Daniel Deborah
Evergreen Packaging, Director of Sustainability Brown Derric
Haywood Community College, Natural Resources Instructor Bishop Blair
Haywood Community College, Natural Resources Instructor Rabby Shannon
Haywood Community College, Natural Resources Instructor Stoneking Kesi
Haywood Community College, Natural Resources Instructor, Dept Head Sherman John
Haywood County citizen, retired USFS Small Gordon Haywood County citizen, retired National Fish & Wildlife Assoc. Clay Alric
Haywood County Cooperative Extension Skelton Bill
Haywood County Erosion Control Officer Pruett Marc
Haywood County Planning Director Boyd Kris
Haywood Soil and Water Conservation District, Soil Conservationist Smathers Leslie
Haywood Soil and Water Conservation District, Soil Conservationist Vanhook Duane
Haywood Waterways Association, Inc., Executive Director Romaniszyn Eric
Haywood Waterways Association, Project Assistant O’Brien Christine
Dept of Agricultural and Consumer Services Yarborough Bill
HWA, Lake Junaluska Assembly, Director of Property Management Ebaugh Don
HWA, Land of Sky Regional Council, Director of Environmental Programs Eaker Bill Manager, Maggie Valley Sanitary District Carpenter Neil
Michael Baker Engineering, Inc, Principal Clemmons Micky
NC Cooperative Extension Service, Area Specialized Agent, Aquaculture Thompson Skip
NC Department of Transportation, Biologist McHenry David
NC Division of Water Quality, Watershed Project Coordinator Williams Ed
NC Geological Survey, Senior Geologist Wooten Rick
NC Wildlife Resources Commission, Fisheries Biologist, District 9 Fraley Steve
NC Wildlife Resources Commission, Watershed Enhancement Coordinator Loftis Scott
NCDWQ, Aquifer Protection Section, Regional APS Supervisor Davidson Landon
NCDWQ, Surface Water Protection, Supervisor Cranford Chuck
North Carolina Forest Service Vigil Dwayne
Duke Energy DeBrew Craig Southern Appalachian Highlands Conservancy, Farmland Protection Director Hamilton William
Southern Appalachian Highlands Conservancy, Land Protection Director Pugliese Michelle
Southern Blue Ridge Program Coordinator Nature Conservancy Sutton Megan
Southwestern Community College, Civil Engineering Technology Instructor White Jeannette
Southwestern Resource Conservation & Development Council Dudek Dave
Southwestern Resource Conservation & Development Council, Coordinator Sprague Lynn
Tennessee Valley Authority, Watershed Representative Podren Martha
The University of Tennessee, Research Specialist II Coombs Joyce
U. S. Fish & Wildlife Service, Public Affairs Peeples Gary
USDA, NRCS, District Conservationist Ottinger John
USEPA, Watershed Representative Fausselt Veronica Western Carolina University, Whitemire Professor of Environmental Science Miller Jerry
Western Programs Coordinator, Office of Land and Water Stewardship Francis Judy
The TAC is the strength of Haywood Waterways. The membership represents Haywood County, State of
North Carolina, federal government, private corporations, nonprofit organizations, and interested individuals. The professional skill mix is as varied. The common goal of permanently reducing nonpoint
pollution in the Pigeon River Watershed continues to be the vision that guides this effective team.