a web-based intelligent report e-learning system...
TRANSCRIPT

Computers and Electrical Engineering 39 (2013) 465–474
Contents lists available at SciVerse ScienceDirect
Computers and Electrical Engineering
journal homepage: www.elsevier .com/ locate/compeleceng
A web-based intelligent report e-learning system using datamining techniques q
Marija Blagojevic ⇑, Zivadin MicicDepartment of Information Technology, Technical Faculty Cacak, University of Kragujevac, Serbia
a r t i c l e i n f o a b s t r a c t
Article history:Received 26 February 2012Received in revised form 18 September2012Accepted 20 September 2012Available online 18 October 2012
0045-7906/$ - see front matter � 2012 Elsevier Ltdhttp://dx.doi.org/10.1016/j.compeleceng.2012.09.01
q Reviews processed and approved for publication⇑ Corresponding author. Tel.: +381 66005197; fax
E-mail address: [email protected] (M. Blagoje
Downloaded from http://www.ele
This paper presents a PDCA (Plan, Do, Check, Act) method of improving web-based intelli-gent reports of an e-learning system as intelligent system, which was created and imple-mented at the Technical Faculty in Cacak, University of Kragujevac. The focus is onimproving LMSs (Learning Management Systems) or e-learning systems by predictingbehavior patterns of students and adjusting the structure of these electronic courses. Anexisting learning management system is improved by using data mining techniques andincreasing the efficiency of the courses using custom modules. This study presents thedesign, implementation, and evaluation of the system. Future work should relate to thecontinued improvement of the PDCA-created system, as well as the introduction of addi-tional modules and a comparative analysis of the presented and future results.
� 2012 Elsevier Ltd. All rights reserved.
1. Introduction
The expansion of e-learning has led to the increased use of systemic and continuous improvement of e-learning systems.This is also evident on the examples of Electrical Engineering teaching courses. The use of these systems has resulted in aneed for monitoring and enhancing behavior patterns of all participants, with the aim of continuous improvement of theteaching process and ultimate results – education services. The paper presents the creation of a web-based intelligent reporte-learning system using data mining techniques with PDCA (Plan, Do, Check, Act).
Learning Management Systems (LMSs), with numerous opportunities in the PDCA, have the ability to track and analyzeuser activity. Here, administrators can get reports on the activities of participants and statistical approaches at the level ofeach course (i.e. responsible teacher), as well as at the level of the entire system.
Each LMS has a database that contains records on the activities of each user. This characteristic of the system is very sig-nificant, with ‘‘plenty of information readily available, just a click away’’ [1, p. 2]. However, many of these records require aspecial tool for processing and extracting useful information. Such tools have limited capabilities and their use is mostly lim-ited by the administrator’s choice, depending on the type of information. A universal solution for this problem lies in the useof data mining techniques, with the possibility of improving LMS [2,3]. Data mining or knowledge discovery in databases(KDDs) is the automatic extraction of implicit and interesting patterns from large data collections [4].
Part of the LMS report also requires improvement in terms of including web intelligence to detect significant patterns ofbehavior [5]. The need for such a solution includes intelligent and web-based aspects to meet the following requirements (inincrements – the PDCA spiral):
. All rights reserved.1
by Editor-in-Chief Dr. Manu Malek.: +381 32342101.vic).
arnica.ir

466 M. Blagojevic, Z. Micic / Computers and Electrical Engineering 39 (2013) 465–474
� The prediction of behavior patterns.� More interactivity.� Visualization of the results obtained.� More real time data analysis.
The remainder of this paper has the following structure. Related work is given in Section 2. Section 3 highlights the pro-posed framework and model, and Section 4 gives the purpose, tasks, and goals of the study. In Section 5, the methodology ofcreating the system, as well as the creation of dimensions, the OLAP (OnLine Analytical Processing) cube, data mining mod-els, and the architecture of the system is presented. The implementation and evaluation of the system is given in Section 6.Finally, Section 7 highlights the improvement of the system characteristics, as well as its use on the examples of ElectricalEngineering course. Concluding remarks are found in Section 8.
2. Related work
In recent years, many studies have used a standardized methodology for PDCA. In this paper, we aim to improve the LMSthrough the enhancement of courses by using data mining techniques. Data mining involves the automatic extraction of im-plicit and interesting patterns from large data collections [4]. Below, we present background on the PDCA spiral.
There are many papers that deal with the promotion of virtual learning environments, where the focus is on improvingthe PDCA spiral, and therefore the grouping of numerous works through PDCA. Frequently, innovations in the field of com-puter science are not readily available in the classroom [6]. In addition to introducing new systems into teaching, it is nec-essary to make the interaction with these systems secure and effective, but also fun [7].
Prakasam and Suresh [8] presented the architecture of an intelligent e-learning system that simplifies and automates theprocess of teaching in e-learning environments. One aspect that this system can offer is to monitor student progress. Themain difference between the system in Prakasam and Suresh [8] and the system presented in this paper is that the data min-ing techniques applied in the former uses data on the web, while in our system, data mining techniques are applied only todata from the Moodle server. Gomah et al. [9] created an intelligent system to give students recommendations on the basis ofthe student model, whereas the system in this paper aims to make the recommendations regarding the use of the e-learningsystem available to the teacher. In addition to the aforementioned modules, the way students make recommendations in [9]describes the Tutor module, which determines what aspects of the domain knowledge should be presented to the learner.
Virtual learning environments in the form of LMS are becoming more prevalent in universities, providing various oppor-tunities for the organization of blended learning, but also for the implementation of the entire online teaching processthrough the facilitation of lifelong learning [10]. These systems have been recognized as good pedagogical support for mostactivities, using less effort, time, and money, and not limiting the place from which the students can connect [8,11]. Thesesystems provide numerous opportunities to work with the students, various activities with the possibility of collaboration,and knowledge gained through verification tests. Numerous commercial LMS have been developed, such as BlackBoard(BlackBoard, 2007) and WebCT (WebCT, 2007), as well as free systems such as Moodle (Moodle, 2007) and Claroline(Claroline, 2007). One of the most popular free systems is in fact Moodle [12–14].
The approach used in this study, which involves a combination of business intelligence and educational data mining, pro-vides a successful solution in Aziz et al. [15]. In the study [15], an intelligent system identifies groups of students with great-er and lesser capabilities based on behavioral pattern analysis. In addition, the system also optimizes the time it takes toperform current and historical data analyses. There are a number of works in which the PDCA approach assures quality ine-learning. In Walasek et al. [16], the PDCA approach was used to plan, describe, create, implement, and evaluate a numberof online courses. Here, all documents were created in accordance with the Deming cycle, thereby providing high qualityelectronic courses [16]. The work of Santos et al. [17] shows the use of the PDCA process approach in the evaluation of elec-tronic tests. Through the four Deming phases, the study [17] describes the procedure of evaluation, as follows:
� In phase P (Plan), four tasks are defined: establishment of participants, design of questionnaires, locating passive partic-ipants, and pilot tests.� Phase D (Do) provides information on completing the questionnaire, forwarded schools, and specificity.� In phase C (Check), analysis gives concrete results in regards to the percentage of completed questionnaires.� Finally, phase A (Act) gives identified measures to improve the obtained results.
Similarly, Tanigawa et al. [18] used the PDCA approach for the improvement of teaching materials, which presented thedesign, implementation, and evaluation of electronic courses.
The PDCA model represents a foundation from which more complex models can be created, as suggested in Valkanos [19].In Valkanos [19] a new model (ADDURI) is created based on the PDCA model. This model (ADDURI) consists of six phases,namely: Analyze, Design, Develop, Use, Improve, and Review.
The analysis of papers that deal with the application of the PDCA model to improve a component of or the entire LMS inrelation to our study highlights some similarities and differences, as follows:
Similarities:

M. Blagojevic, Z. Micic / Computers and Electrical Engineering 39 (2013) 465–474 467
� Our study achieves the improvement of existing systems through the phases of the PDCA model, as it is done in [16–18].� The PDCA model was used to improve the field of e-learning.
Differences:
� Our study focuses on a LMS in order to improve reporting, in contrast with the other studies [16–18].
3. Framework and proposed model
The Moodle LMS has the option of reporting, giving administrators and the creators of the course some insight into thefunctioning of the course and the whole system. The report that the teacher or the course administrator receives gives thepossibility to adapt groups, participants, dates, and activities. A Moodle LMS administrator has more power using the fieldreport. In this sense, the system administrator may receive a report for the complete system, except for certain courses.Based on a given SQL (Structured Query Language) query on the Moodle database, a report is created and can be downloadedin three different formats: text, ODS (Open Document Spreadsheet), and Excel.
The current system allows administrators of courses (i.e., teachers) to receive reports based on existing recordsin the database. However, there is a need for a reporting system that predicts user behavior based on existing patterns ofbehavior. This technique would require data mining. Fig. 1 presents the design of reporting systems and provides the pos-sibility for prediction. Our study presents the Deming PDCA cycle [20], in creating web based intelligent report e-learningsystem.
Fig. 1 shows the reporting activity in a model system through our four activities (Plan, Do, Check, and Act).
4. Purpose, tasks, and goals (Step 1: P-Plan)
Details of the user’s activities cannot be predicted by the LMS. However, the LMS makes it possible to predict patterns ofbehavior. Therefore, there is a need for an intelligent, web-based system that can provide an interactive approach to predictuser behavior patterns.
Fig. 1. Model design of the report system.

468 M. Blagojevic, Z. Micic / Computers and Electrical Engineering 39 (2013) 465–474
Our research goals in this study include the following:
� To identify features of data mining techniques to obtain predictions of user behavior patterns.� To allow teachers to have access to future patterns of behavior for their students; based on this information, adjustments
can be made in Moodle courses.� To improve the existing system of reporting, such that the Moodle LMS will have web intelligence using data mining
techniques.
Our research tasks include the following:
1. Defining the first formal structure of the environment and relationships within the e-learning system.2. Creating appropriate data mining models.3. Writing Data Mining Extensions (DMXs) to obtain predictive patterns.4. Creating a web-based application that has the ability to interact with the user.5. OLAP analysis: the designing of a multidimensional structure in which the main factors under analysis (i.e., year,
month, day, time, minutes, course, activity, and module) will be taken as dimensions and will be used later to buildan OLAP cube in order to analyze the recorded data.
6. Data pre-processing to clean and prepare the web server log file.7. Describing the process and object models.8. Selecting key resources for the Moodle LMS.9. Creating links between applications and a DMX-over-Adomdnet.
10. Defining educational elements.11. Visualizing the results.
5. Methodology of designing the system (Step 2: D-DO)
The system in this study was created based on logs from the Moodle database. The Moodle LMS has been used at theTechnical Faculty in Cacak (www.tfc.kg.ac.rs) since 2007 in order to support blended learning. More than 100 courses havebeen developed within this system. Specifically, electronic courses have been created in the areas of Electrical Engineeringand Information Technology. The number of active users, according to the system logs, amounted to 1935. The process ofmaking an intelligent, web-based reporting system includes several stages, as outlined in the following subsections. The fol-lowing subsections present chronologically ordered sub steps within D (Do) step.
5.1. Preprocessing
Preprocessing is a phase that involves removing entries that contain errors. Here, anything that is not relevant to this spe-cific research is considered an error. In addition, time is presented in columns that include the year, month, day, hour, andminutes; this kind of presentation differs from the format originally obtained from the Moodle server log file. Columns thatrelate to additional information and to URLs are irrelevant in this research, and are therefore excluded from the log files.
5.2. Creating dimensions and the OLAP cube
After the pre-processing, the OLAP cube and dimensions (i.e., module, activity, course, year, month, day, hour, and min-utes) are created.
Microsoft Visual Studio 2008 [21] is used for creating the OLAP cube. The data source and the data source view must becreated before the cube itself is generated. The data here does not originate from an OLAP database; another database, a rela-tional database, is the source. Fig. 2 shows the OLAP cube. After creating the initial data source, the data source view is gen-erated. The data source view has two aims:
� It identifies the tables and views from the data source that will be used in the concrete Analysis Service Project, and� It retrieves and stores the metadata about these objects, allowing for the building of cubes without having to maintain an
active open connection to the data source.
After creating the data source and the data source view, the dimensions and cube are generated. The production of dimen-sions and cubes leads to the final phase of work in Microsoft Visual Studio 2008. This phase involves deployment solutions.Deployment solutions pass several phases, and the result is a successfully completed deployment in which the work is con-tinued within the SQL Server Management Studio [23].
5.3. Creating data mining models
Data mining models were then created within the Visual Studio 2008 as follows.

Fig. 2. OLAP cube [22,30].
M. Blagojevic, Z. Micic / Computers and Electrical Engineering 39 (2013) 465–474 469
5.3.1. Decision treeMany studies from previous literature use the model decision tree improve processes within the LMS e.g. [24,25]. In our
study, a decision tree is used to predict the percentage of occurrence modules with selected input parameters. This is donethrough the DMX queries. The input parameters are hour, day, month, and activity. The DMX query is given in Section 5.4.1,and a query result is shown in Fig. 3.
5.3.2. Neural networkA number of studies deal with the use of artificial neural networks in the field of e-learning [26,27]. In our study, the
information on the impact of all attribute values that relate to the predictable state is given. The Microsoft Neural Networkalgorithm uses a gradient method to optimize the parameters in multilayer networks in order to predict multiple attributes.
Input data are randomly split into two sets, a training set and a testing set, based on the percentage of data for testing andthe maximum number of testing cases provided. The training set is used to create the mining model, and the testing set isused to check model accuracy. In this study, the percent of the testing cases is 30%.
The neural network model is illustrated with a visualization of prediction results in Fig. 4.
5.4. Writing the corresponding DMX query and test models
The SQL Server Management Studio accesses and checks the writing of DMX queries that are needed to obtain an ade-quate prediction of behavioral patterns. DMX query language is largely used for model creation, model training, prediction,and content access [28]. Fig. 4 shows the results of the executed queries. The request was written using the decision treemodel, while the other two models were tested in Visual Studio, also presented in this chapter.
Fig. 3. Results of the performed query.

Fig. 4. Visualization of predictable states.
470 M. Blagojevic, Z. Micic / Computers and Electrical Engineering 39 (2013) 465–474
5.4.1. Example of DMX query for decision tree model
select t.�, Predict ([Module]) as [Module],vba!format (Predictprobability ([Module]), ‘Percent’) as [Probability]from[dectree]prediction joinopenquery([Moodle baza],‘select Hour, Day, Month, Activity from log’) as ton [dectree].[Hour]=t.Hour and[dectree].Day=t.Day and[dectree].Month = t.Month and[dectree].Activity = t.Activity
This DMX-in predictable variable is a module whose probability is shown as a percentage. The Moodle database is a databasein which records of the activities of the LMS are stored. There are approximately 1 million records. The input variables in thiscase are hour, day, month, and activity.
5.4.2. Neural networkA neural network is used to determine the values of attributes that favor and disfavor the predictable states. The viewer
provides information on the impact of all attribute values that relate to the predictable state. The neural network model(Fig. 4) shows the most important attribute value that favors action, for instance, ‘‘forum’’ is an action with a value of‘‘report’’.
The results obtained from the neural network technique give a clear visualization of the predictable conditions, whichmay be important when teachers determine the concrete actions to be employed on an electronic exchange.
5.5. Architecture of the system
Intelligent reporting systems take records of user activities within the Moodle server. The data is processed and subject toexecution in the corresponding DMX, depending on whether or not the user wants to see the predictive analysis. The resultsare displayed to the user within a web page and can then be executed during a new analysis. The system architecture is givenin Fig. 5.
Generally, the architecture of this system can be viewed through its three main parts and the connections between them.The first part involves the SQL server and the relational database, which is preceded by preprocessing. The second part refersto the Analysis Server OLAP cube, including the processes that take place over it, and the third part deals with the web appli-cation. The link between the analysis and the web server applications is accomplished through ADOMD (ActiveX Data Ob-jects Multi-dimensional) [29].
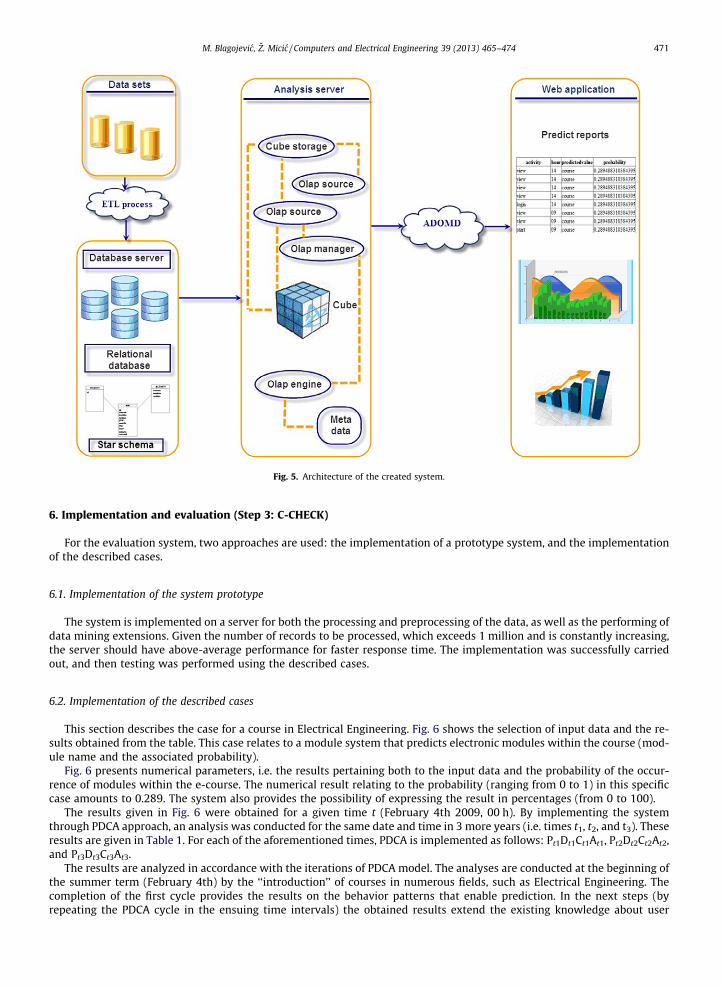
Fig. 5. Architecture of the created system.
M. Blagojevic, Z. Micic / Computers and Electrical Engineering 39 (2013) 465–474 471
6. Implementation and evaluation (Step 3: C-CHECK)
For the evaluation system, two approaches are used: the implementation of a prototype system, and the implementationof the described cases.
6.1. Implementation of the system prototype
The system is implemented on a server for both the processing and preprocessing of the data, as well as the performing ofdata mining extensions. Given the number of records to be processed, which exceeds 1 million and is constantly increasing,the server should have above-average performance for faster response time. The implementation was successfully carriedout, and then testing was performed using the described cases.
6.2. Implementation of the described cases
This section describes the case for a course in Electrical Engineering. Fig. 6 shows the selection of input data and the re-sults obtained from the table. This case relates to a module system that predicts electronic modules within the course (mod-ule name and the associated probability).
Fig. 6 presents numerical parameters, i.e. the results pertaining both to the input data and the probability of the occur-rence of modules within the e-course. The numerical result relating to the probability (ranging from 0 to 1) in this specificcase amounts to 0.289. The system also provides the possibility of expressing the result in percentages (from 0 to 100).
The results given in Fig. 6 were obtained for a given time t (February 4th 2009, 00 h). By implementing the systemthrough PDCA approach, an analysis was conducted for the same date and time in 3 more years (i.e. times t1, t2, and t3). Theseresults are given in Table 1. For each of the aforementioned times, PDCA is implemented as follows: Pt1Dt1Ct1At1, Pt2Dt2Ct2At2,and Pt3Dt3Ct3At3.
The results are analyzed in accordance with the iterations of PDCA model. The analyses are conducted at the beginning ofthe summer term (February 4th) by the ‘‘introduction’’ of courses in numerous fields, such as Electrical Engineering. Thecompletion of the first cycle provides the results on the behavior patterns that enable prediction. In the next steps (byrepeating the PDCA cycle in the ensuing time intervals) the obtained results extend the existing knowledge about user

Fig. 6. Use case – the choice of input parameters and results.
Table 1Display of the results in t1, t2, t3.
Time Expression(h)
Expression 1(day)
Expression 2(month)
Expression 3(year)
Expression 4(action)
Expression 5(course)
Predictedvalue
Probability
t1 00 04 02 2010 Add 0 Forum 0.347t2 00 04 02 2011 Add 0 Forum 0.384t3 00 04 02 2012 Add 0 Forum 0.399
472 M. Blagojevic, Z. Micic / Computers and Electrical Engineering 39 (2013) 465–474
behavior patterns and are more precise than the previous ones because they include a greater number of records in the logfile.
PDCA is implemented in spirals of increasing knowledge of the system that converge on the goal, each cycle closer thanthe previous.
The steps of PDCA cycle which recur in given time intervals are further explained in detail in the following sections (Step P(Plan) – Section 4, Step D (Do) – Section 5, Step C (Check) – Section 6 and Step A (Act) – Section 7).
7. Improving the characteristics of the created system (Step 4: A-ACT)
7.1. The main characteristics of the system created
The main characteristics of the created system are as follows:
� Simplicity: The architecture and use of the system are in general simple. The interface is user-friendly and requires no spe-cial preparation to use it.� Enabling more real time data analysis: Given the fact that the database is constantly updated with new records of user
activity, the application automatically performs the same process, based on real time analysis.� Cost effective: This system is cost effective. The only required costs are related to the server for data storage and process-
ing. Considering the number of users on the Moodle system, as well as teachers who use the intelligent system, this cost ismanageable.� Web intelligence support feature: The system includes a web intelligence related to prediction, which is the main purpose
of the system (i.e., obtaining predictive behavior patterns).
The proposed system, unlike the existing one, has additional possibilities for improving e-courses, as well as the teachingprocess, through the prediction of user behavior patterns. Table 2 gives a comparative review of the properties of the current– ‘‘existing system’’ and the newly created ‘‘proposed system’’ intelligent web-based report e-learning system.
7.2. A possible scenario of use (courses in Electrical Engineering)
Moodle electronic courses give teachers insight into the basic activities of its users and students. However, materialinnovation and new activities are typically required each school year. Given the present and predicted patterns of student

Table 2The possibilities of the existing and proposed (new) system.
Possibilities Existingsystem
Proposedsystem
User’s activity report + +Visualization of results + +Real time data analysis + +Interactivity + +Existence of web intelligence in
the system� +
Prediction of user behaviorpatterns
� +
Numerical results for theapproach probability
� +
M. Blagojevic, Z. Micic / Computers and Electrical Engineering 39 (2013) 465–474 473
behavior (in terms of time and amount of access), the teacher can create a course accordingly and increase the efficiency ofthe course.
For example, for courses in Electrical Engineering, the teacher can choose his/her own courses and an analysis techniqueaccording to the teacher’s interest. If a teacher creates a new course or updates an existing one, he/she should consider theform of teaching materials and the activities within the course.
The teacher enters the input parameters that are relevant to the analysis (e.g. ID of the course, module name, name ofactivity, and time). Based on the input data, the intelligent reporting system provides a table and a graphical representationof the results. The teacher receives display modules and activities associated with the percentage probabilities. The teachercan decide on the selection of modules and the organization of activities for students in the course depending on the per-centage results. If the highest percentage is allocated to collaborative modules (i.e., forum, chat, wiki) this can then be ar-ranged through the activity.
Using intelligent web-based reporting systems facilitates the process of policy-making and increases the opportunity formore efficient use. After the course is adjusted, a new PDCA spiral of quality begins.
8. Conclusion
A web-based intelligent report e-learning system created with data mining techniques leads to a modern and intelligentway of reporting user activity. Compared with the current reporting system in Moodle LMS, the proposed system presents animprovement since it predicts behavior patterns thus leading to the increased efficiency of the participants.
Advantages of the proposed system relate primarily to the opportunities provided by the intelligent features, while a dis-advantage is the need for above-average performance of the server. The advantages are reflected in the existing web intel-ligence and the possibility of predicting user behavior patterns. Furthermore, these advantages have a direct effect on qualityassurance in e-learning and on the improvement of the teaching process through the adaptation of content by predictingbehavior patterns.
Through the Deming PDCA cycle of activities, the following can be concluded (in time t, PtDtCtAt):
� Pt: This includes the review of existing reports, and the need for identified reports that provide predictions of user behav-ior in an LMS. The conclusion at this stage involves moving towards recommendations for planning in terms of the needfor inclusion of all relevant factors.� Dt: This includes the design and implementation of the new system and it is consistent with the planned outcomes,
adjustment for all activities, and successful functioning of an intelligent, web-based reporting system.� Ct: This is the compulsory phase control, carried out through the testing activities, installation and evaluation systems, the
execution of change, and the improvement system. This stage also fulfilled its purpose, and the changes are related to thevisualization of results in order to improve them.� At: This includes the possible improvement through the re-use of system analysis tasks. Here, future work should be
related to the creation and implementation of new modules in the given time tn, PtnDtnCtnAtn.
The approach presented is similar to some previous. However, this study gives improvement in terms of the report systemin the field of e-learning. Moreover, development and implementation of new modules, as well as user authentication, willbe the subject of future research.
Acknowledgment
This study was supported by the Serbian Ministry of Education and Science (Project III 44006, http://www.mi.sanu.ac.rs/projects/projects.htm#interdisciplinary).

474 M. Blagojevic, Z. Micic / Computers and Electrical Engineering 39 (2013) 465–474
References
[1] Castro F, Vellido A, Nebot A, Mugica F. Applying data mining techniques to e-learning problems. <http://wwww.sci2s.ugr.es/keel/pdf/specific/capitulo/ApplyingDataMiningTechniques.pdf> [accessed 10.01.12].
[2] Zaïane O, Luo J. Web usage mining for a better web-based learning environment. In: Proceedings of conference on advanced technology for education.Banff, Alberta; 2001. p. 60–4.
[3] Romero C, Ventura S. Data mining in e-learning. Southampton, UK: Wit Press; 2006.[4] Klosgen W, Zitkow J. Handbook of data mining and knowledge discovery. New York: Oxford University Press; 2002.[5] Zorrilla ME, Marín D, Álvarez E. Towards virtual course evaluation using web intelligence. <http://www.personales.unican.es/ZORRILLM/PDFs/
ME%20Zorrilla%20-%20Towards%20Virtual%20Course.pdf> [accessed 15.01.12].[6] Pollard H, Jordán R, Abdallah C, Levine A, Blevins M. A new computer system for education. Comput Electr Eng 1991;17:261–6.[7] Agah A. Human interactions with intelligent systems: research taxonomy. Comput Electr Eng 2000;27:71–107.[8] Prakasam S, Suresh RM. An agent-based intelligent system to enhance e-learning through mining techniques. Int J Comput Sci Eng 2010;2:759–63.[9] Gomah A, Abdel S, Badr RA, Farag I. An auto-recommender based intelligent e-learning system. Int J Comput Sci Netw Secur 2011;11.
[10] Zorilla M, Garcia D, Alvarez EA. Decision support system to improve e-learning environments. <http://www.edbt.org/Proceedings/2010-Lausanne/workshops/beweb/papers/edbt_2010_submission_558.pdf> [accessed 04.02.12].
[11] Lee Y, Choi J. A review of online course dropout research: implications for practice and future research. Educ Tech Res Dev 2011;59:593–618.[12] Sancho P, Torrente J, Marchiori EJ, Fernández-Manjón B. Enhancing moodle to support problem based learning, the nucleo experience. <http://www.e-
ucm.es/drafts/e-UCM_draft_175.pdf> [accessed 01.02.12].[13] Boeykens S, Neuckermans H. Content management systems versus learning environments, towards architectural content and learning management
systems. <https://lirias.kuleuven.be/bitstream/123456789/221858/1/cms±versus±learning±environments±-±full±paper.pdf> [accessed 01.02.12].[14] Callaghan MJ, McCusker K, Losada JL, Harkin JG, Wilson S. Engineering Education Island: teaching engineering in virtual worlds, serious games and
virtual worlds research team. <http://www.ics.heacademy.ac.uk/italics/vol8iss3/pdf/ItalicsVol8Iss3Nov2009Paper01.pdf> [accessed 01.01.12].[15] Aziz AA, Wan Idris WMR, Hassan H, Jusoh JA. Intelligent system for personalizing students’ academic behaviors – a conceptual framework. Int J New
Comput Archit App 2012;2.[16] Walasek TA, Kucharczyk Z, Morawska-Walasek D. Assuring quality of an e-learning project through the PDCA approach. Arch Mater Sci Eng
2011;48:56–61.[17] Santos RA, Sanz-Santamaría S, Pérez-Fernández TA. Quality techniques applied in the improvement of item-based LMS, recent research developments
in learning technologies; 2005. <http://www.sc.ehu.es/jiwarsar/Research-Papers/ICTE-05-QualityTechniquesInItemBasedLMS-Arruabarrena.pdf>[accessed 08.02.12].
[18] Tanigawa T, Yamakita T, Fujii T, Maeda M, Fuji T. Construction of driving model with faculty perspectives of ePortfolio for Improving UniversityEducation in Japan. <http://www.editlib.org/p/35651> [accessed 08..02.12].
[19] Valkanos N. A collaborative approach for the development of networked learning environments using the ADDURI framework. <http://www.networkedlearningconference.org.uk/past/nlc2008/abstracts/PDFs/Valkanos_384-391.pdf> [accessed 09.02.12].
[20] Deming WE. Out of the crisis. Cambridge, MA: Massachusetts Institute of Technology Center for Advanced Engineering Study; 1982.[21] Microsoft Visual Studio Software. ID subscraber: 70050889; 2008. <http://www.msdn.microsoft.com/en-us/academic>.[22] Blagojevic M, Baric S. The appliance of OLAP and Microsoft SQL server analysis services in the analysis of user behavior patterns, ICEST; 2011.[23] Microsoft SQL Server Management Studio Software. ID subscraber: 70050889; 2008. <http://www.msdn.microsoft.com/en-us/academic>.[24] Kaneez B, Victor R. E-learning: an effective pedagogical tool for learning. Int J Innov Tech Creative Eng (ISSN:2045-8711) 1; 2011. <http://
www.ijitce.co.uk/download/April/IJITCE_Apr6.pdf> [accessed 14.11.11].[25] Baradwaj BK, Pal S. Mining educational data to analyze students’ performance. Int J Adv Comput Sci Appl 2011;2.[26] Minaei-Bidgoli B, Punch WF. Using genetic algorithms for data mining optimization in an educational web-based system. In: Cantu PE, editors. Genetic
and evolutionary computation conference, GECCO; 2003. p. 2252–63.[27] Mizue K, Toshio O. Neural network navigation support-knowledge-navigation in hyperspace: the sub-symbolic approach. J Educ Multimedia
Hypermedia 2001;10:85–103.[28] Palaniappan S, Awang R. Intelligent heart disease prediction system using data mining techniques. Int J Comput Sci Netw Secur 2008;8.[29] ADOMD. <http://www.msdn.microsoft.com/en-us/library/ms123483.aspx> [accessed 23.01.12].[30] Pantaleon MEZ. New trends in database systems: Methods, Tools, Applications, Chapter: Data warehouse and Olap technology. <http://
personales.unican.es/zorrillm/BDAvanzadas/Teoria/Zorrilla07-DW-OLAP.pdf> [accessed 22.01.12].
Marija Blagojevic was born in 1984 in Cacak, Serbia. She graduated from Technical Faculty Cacak, University of Kragujevac (B.Sc. 2007) where she iscurrently a Teaching Assistant (Department of Information Technologies). At the moment she is a Ph.D. student and her areas of interest are e-learning anddata mining. She wrote several articles about web mining application in e-learning and detecting behavior patterns in online environment. Recently, she hasstudied on improving learning management system with addition of web intelligence.
Zivadin Micic was born in 1955. He received B.Sc., M.Sc., and Ph.D. degrees in Mechanical Engineering in 1979, 1982, and 1997, respectively. His field ofspecialization is Information Technology and Systems. Since 1999 he has been a Full Professor at Technical Faculty Cacak, University of Kragujevac, acting asHead of the Department of Information Technology as of 2001. He is the author of over 220 papers, ‘‘Information Technology’’ monograph, ‘‘IT in integratedsystems’’, etc., especially teaching publications for online usage.