a white paper on the relationship of the u.s. shelf-stable...
TRANSCRIPT

A White Paper on the relationship of the U.S.
Shelf-Stable Juice Category to:
Sugar Consumption
Diabetes trends
Artificial sweeteners
Calories
Current U.S. obesity trends
Vegetable and Fruit Consumption
New innovations in the category
November 20, 2012

Page 2 of 14
BACKGROUND: SUGAR CONSUMPTION
Sources: USDA, CDC, American Medical Association
USA per capita sugar consumption from
all sources now exceeds 158 pounds per
capita annually, which is about 50
teaspoons per person, per day!
The USA diabetic rate has increased
exponentially, from under 2 million
people in 1958 to over 25 million people
in 2010.

Page 3 of 14
BACKGROUND: SUGAR CONSUMPTION (CONTINUED)
Beverages are the leading single source of sugar in our diets.
According to the American Heart Association, these are the food groups that contribute the
largest portions of added sugars to the American diet, as a percentage of total added sugars
consumed. These are defined as sugars and syrups added to foods during processing or
preparation, or at the table.
According to CBC-Canada for children age 1 – 8:
Fruit Juices 14.6% of sugars consumed
Fruit Drinks 6.2% of sugars consumed
Total Fruit Juices + Fruit Drinks 20.8% of all sugars consumed by children age 1 – 8.
33.0%
16.1% 12.9%
9.7%
8.6%
5.8% 13.9%
Portions of added sugar to the American diet
Regular soft drinks
Sugars and candy
Cakes, cookies, pies
Fruit drinks (fruitades and fruit punch)
Dairy desserts and milk products
Other grains
All other
Page 4 of 14
BACKGROUND: ADDED SWEETENERS
Many U.S. Consumers have strongly negative opinions regarding added sweeteners.
HFCS (High Fructose Corn Syrup): also called glucose-fructose syrup, this sweetener is the most
commonly-used sweetener in the U.S. food supply. Critics of HFCS suggest that the highly-
processed substance may contribute to weight gain by affecting normal appetite functions.
However, the American Medical Association suggests this is unlikely, and HFCS has been
classified as generally recognized as safe by the U.S. Food and Drug Administration since 1976.
Sugar substitutes: six major high-intensity sugar substitutes are approved for use in the USA:
• Stevia
• Aspartame (also sold under the brand name NutraSweet)
• Sucralose
• Neotame
• Acesulfane Potassium (“Ace-K”)
• Saccharin
All of the above are considered artificial sweeteners except for Stevia.
There is some ongoing controversy over whether artificial sweetener usage poses health risks.
However, to date the U.S. FDA has not been presented with evidence that would support a
change in conclusion about the safety of these high-intensity sweeteners, which means they
continue to be generally recognized as safe.
A significant number of consumers choose to avoid products containing added sweeteners,
sugar substitutes or artificial ingredients. In many cases these consumers seek products labeled
“all-natural” or “USDA organic” as a way to provide them with some assurance that they are
avoiding artificial ingredients.

Page 5 of 14
BACKGROUND: CALORIES AND OBESITY
Epidemic increase in obesity among all Americans*:
• Adult obesity rates increased in 28 states in the past year, and declined only in D.C. • 38 states now have adult obesity rates above 25 percent.
• In 1991, no state had an obesity rate above 20 percent.
More than 60% of U.S. adults, and nearly one in three children, are now overweight or obese.
Obese children are more likely to become obese adults, with the associated health risks.
Obesity among younger Americans is at epidemic levels:
• “20% of children ages 6-11 are obese” – U.S. Centers For Disease Control and Prevention, 2010
• “25% of all male applicants are unfit for Military Service” – U.S. recruiting statistic, 2010
CBS NEWS stated: “The evidence of an epidemic is everywhere. Two-thirds (over 190 million) of
Americans are overweight or obese. Childhood obesity has tripled in the last 30 years.”
USA TODAY stated: “People in this country must slash their calories … the obesity epidemic is
the single greatest threat to public health in this century”.
*Source: F as in Fat: How Obesity Threatens America's Future 2010, a report from the Trust for America's Health and the Robert Wood Johnson
Foundation.

Page 6 of 14
BACKGROUND: VEGETABLES AND FRUITS
Research done to support the USDA MyPlate / MyPyramid* shows that nine or ten servings of
fruits and vegetables a day is the optimal level to support good health. Most U.S. populations
are consistently not reaching even half this goal.
* The longstanding USDA MyPyramid evolved into the Healthy MyPlate icon on June 2, 2011, to support dietary recommendations from the Dietary Guidelines for Americans 2010. These called for Americans to “fill half your plate with fruits and vegetables”. The new healthy MyPlate icon is sectioned off to show fruits and vegetables as half of the plate, making the recommendation easy to understand. The Dietary Guidelines for Americans 2010 provides strategies to consume fewer calories, make informed food choices and be physically active to help Americans maintain their weight, reduce their risk for chronic diseases and promote overall health. These recommendations support fruits and vegetables as foods that should be eaten most often. For most Americans, this means more than doubling the amount of fruits and vegetables they eat daily.
According to the U.S. Centers for Disease Control and Prevention (CDC), Fruits and Vegetables
are critical to promoting good health. Most people need to increase the amount of fruits and
vegetables they currently eat every day.
Focus groups repeatedly show that U.S. consumers are aware of this significant dietary
shortfall. When asked, a sample response is “I know we don’t eat enough vegetables, but I
can’t get my kids to eat them – they don’t like the taste”. Another common response is “We are
very busy and we eat on the run, and we just don’t make time for vegetables”.
9.5
4.5
0
1
2
3
4
5
6
7
8
9
10
USDA Recommendation USA Actual Average
Daily Servings of Vegetables and Fruits

Page 7 of 14
BACKGROUND: VEGETABLES AND FRUITS (CONTINUED)
We have a rapidly aging U.S population base.
This aging population is living longer than ever, and they are more health-focused than ever.
The AARP (American Association of Retired People) is among the largest membership
organizations in the USA, with over 40 million members. In the February-March 2012 issue of
AARP Magazine, they featured an article titled “Age-Proof Your Brain”.
In this article it states the following: "A study from Vanderbilt University found that people who
downed three or more servings of fruit or vegetable juice a week had a 76% lower risk for
developing Alzheimer's disease than those who drank less than a serving weekly".
Source: http://www.aarp.org/health/brain-health/info-01-2012/boost-brain-health.html
The U.S. population is getting the message on multiple fronts and for all ages: we must
increase our consumption of vegetables and fruits!

Page 8 of 14
C U R R E N T S I T U A T I O N
CONSUMER WANTS
U.S. Focus Groups held in 2010 through 2012 asked consumers to describe their “ideal juice
beverage”. This research found the following:
“My perfect juice / juice drink”:
1. Contains 100% Juice
2. Contains full daily servings of vegetables and/or
fruit
o “Vegetables are much more important – I can get
the fruit elsewhere”
3. Has low calories per serving
4. Is All Natural
o “No added sweeteners”
o “No Splenda*, Stevia*, NutraSweet*, Ace-K, etc.”
o “No preservatives”
5. Great tasting
o “My kids won’t drink it unless it tastes good”
*Registered trademarks of their respective owners.

Page 9 of 14
CURRENT SITUATION: ARE WE DELIVERING WHAT THE CONSUMER WANTS?
Getting 100% Juice (#1 consumer priority) requires high calories.
Registered trademarks used are the property of their respective owners.
Less than 15%
Juice
18-24% Juice
25%-35% Juice
50%-70% Juice
100% Juice
(15% of items)
(8% of items)
(12% of items)
(2% of items)
(61% of items)
Typical U.S. supermarket 28-foot shelf-stable juice department
ALL 100% juice items have 100 calories or
more (per 8-oz serving).
Only exceptions:
• Original V8™
• 100% Tomato Juice
• 100% Pineapple Juice

Page 10 of 14
CURRENT SITUATION: ARE WE DELIVERING WHAT THE CONSUMER WANTS? (CONT’D)
Getting vegetable and fruit servings (#2 priority) from juice is
challenging – especially vegetable servings.
Snapshot of leading national shelf-stable juice brands:
Only two national shelf-stable juices offer a total of two vegetable
servings: Original V8 and 100% tomato juice. A very small number of juices offer “two combined servings” of fruit and
vegetables. These include: o Regular V-Fusion (100 to 140 calories) o Mott’s Medleys (110 calories)
NO juices today offer more than two vegetable servings.
Registered Trademarks used are the property of their respective owners. Please visit the manufacturer’s websites for the most-current information.
0
0.5
1
1.5
2
2.5
3
3.5
4
Servings of Vegetables
Servings of Fruits
Combined Servings

Page 11 of 14
CURRENT SITUATION: ARE WE DELIVERING WHAT THE CONSUMER WANTS? (CONT’D)
Getting lower calories (#3 priority) has required reducing juice content
and adding other sweeteners!
*Trademarks shown are the property of their respective owners.
Consumers have had to accept a tradeoff:
Get more vegetable and fruit servings and 100% Juice;
- OR -
Get lower calories with artificial sweeteners.

Page 12 of 14
T H E I N N O V A T I O N
WHAT IS NEW AND DIFFERENT ABOUT Fave?
In each 8-ounce (250 mL) glass:
1. 100% Fruit and Vegetable Juice
2. Three full servings of vegetables
• More than any other beverage, patented technology
3. 60 calories
• Most competitive brands have 110 to 170 calories
4. All Natural
• No artificial ingredients, no added sweeteners of any kind
5. Three delicious, refreshing fruit flavors
• Strawberry-Banana-Kiwi
• Blueberry-Pomegranate-Goji
• Orange-Tangerine-Pineapple
Bottled in the USA in 46-ounce recyclable PET bottles.
Fave is the first and ONLY juice blend to deliver against all of the U.S. consumer
ideal criteria for “my perfect juice”.
Page 13 of 14
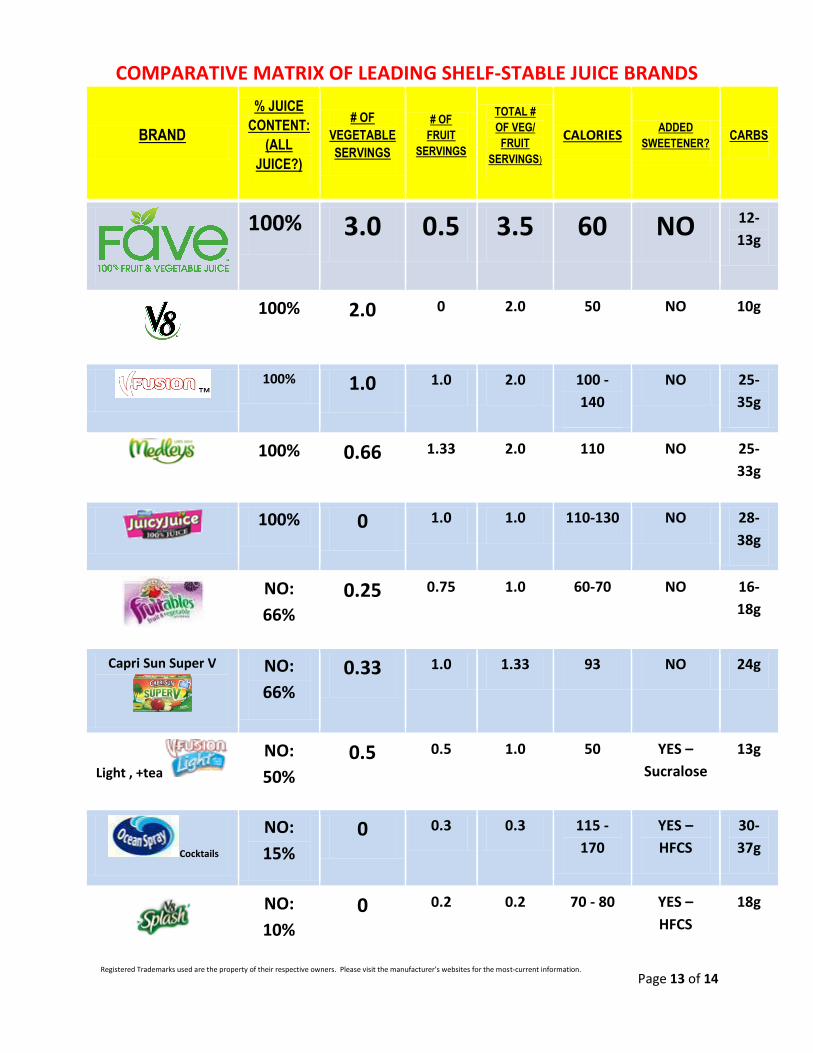
COMPARATIVE MATRIX OF LEADING SHELF-STABLE JUICE BRANDS
BRAND
% JUICE
CONTENT:
(ALL
JUICE?)
# OF
VEGETABLE
SERVINGS
# OF
FRUIT
SERVINGS
TOTAL #
OF VEG/
FRUIT
SERVINGS)
CALORIES ADDED
SWEETENER? CARBS
100% 3.0 0.5 3.5 60 NO 12-
13g
100% 2.0 0 2.0 50 NO 10g
100% 1.0 1.0 2.0 100 -
140
NO 25-
35g
100% 0.66 1.33 2.0 110 NO 25-
33g
100% 0 1.0 1.0 110-130 NO 28-
38g
NO:
66%
0.25 0.75 1.0 60-70 NO 16-
18g
Capri Sun Super V
NO:
66%
0.33 1.0 1.33 93 NO 24g
Light , +tea
NO:
50%
0.5 0.5 1.0 50 YES –
Sucralose
13g
Cocktails
NO:
15%
0 0.3 0.3 115 -
170
YES –
HFCS
30-
37g
NO:
10%
0 0.2 0.2 70 - 80 YES –
HFCS
18g
Registered Trademarks used are the property of their respective owners. Please visit the manufacturer’s websites for the most-current information.

Page 14 of 14
Fave™ is a new all-natural blend of 100% fruit and vegetable juices bottled in 46-ounce recyclable PET.
The Strawberry-Banana-Kiwi, Pomegranate-Blueberry-Goji, and Orange-Tangerine-Pineapple flavors are
all lightly sweet, smooth and refreshing. Each provides three full servings of vegetables in one 8-ounce
glass (more than any other brand), and 60 calories (most others are 110-170 calories), with no added
sweeteners or preservatives. www.favejuice.com.
For more information, please visit www.favejuice.com and view the FAQ’s, or contact:
David Kirkpatrick, CMO
[email protected] +248.808.2585