a woman’s place disentangling the drivers of labour force
TRANSCRIPT

Disentangling the drivers of labour force participation by sex – a cross country study
January 2021
A Woman’s PlaceBoosting female labour force participation to lift long-term economic growth
January 2021
A Woman’s Place series Executive Summary

2 A woman’s place: boosting female labour force participation to lift long-term economic growth
“ We believe companies that embed diversity and inclusion standards are better placed to attract talent, get the most from their workforce and meet the needs of their customers.”
ContentsExecutive Summary 03
Background: diversity and inclusion are among the keys to unlocking long-term growth potential 05
Diversity alone is not enough to optimise resource allocation in companies and the economy 06
Understanding the drivers of female labour force participation in the 21st century 07
What drives labour force participation? 08
Conclusions 13

03A woman’s place: boosting female labour force participation to lift long-term economic growth
Executive SummaryThere is a clear ethical argument for greater equality in the workforce. But there’s a powerful efficiency argument too. Increasing the diversity and inclusivity of the workforce can lift per-capita incomes and growth. As well as boosting utilisation rates, it can increase workforce productivity by making better use of human capital. In a world of ageing populations and sluggish labour productivity growth, stronger diversity and inclusion policies from companies and governments could provide a much needed shot in the arm for the global economy.
This research examines diversity and inclusion through the lens of male and female labour force participation. In most developed countries, women tend to be at least as well-educated as their male counterparts. Yet, they are also much more likely than men to face a trade-off between accepting paid work and undertaking unpaid work, including caring responsibilities. Consequently, women are less attached to the workforce. And, when they do work, they do fewer average hours. This has knock-on implications for gender gaps in pay, progress and opportunities.
By understanding the policy and other constraints that limit women’s full participation in the workforce, governments will be in a stronger position to devise solutions that address long-term growth challenges. We analyse data from 31 countries from 2002 to 2016 (see Working Paper for details). Our findings point to five clear actions for policymakers and companies wanting to lift female participation and optimise their use of human capital.
1. Ensure men have access to paternity leave and incentivise men to take that leave so the burden of child-related career breaks is more evenly shared.
2. Reduce tax for second earners and sole parents given the clear negative impact it has on female participation. Tax distortions reinforce the unfair work/care trade-off that women face.
3. Consider both the quantity and quality of female work. Given the reality of the work/care trade-off, part-time work and flexible short-term employment provide vital opportunities for women to remain connected to the workforce.
4. Strengthen the performance and resilience of the overall economy. Increasing economic growth potential and reducing the cyclicality of growth can strengthen labour markets and facilitate greater overall participation. The two largest drivers of female workforce participation were education, which is linked to economic development, and male participation.
5. Report more and higher-quality data, so we can monitor what companies are doing. This will help us understand what policies improve diversity and inclusion, and how that affects corporate performance. Investors can play their part by encouraging firms to release this information.
Our research focused mostly on what governments can do to improve gender diversity and inclusion in the workforce. But there are important implications for investors too. We provide indicators to help investors identify those countries best-positioned to boost female participation, enhance economic efficiency and tackle long-term growth challenges. Our research also deepens the rationale for incorporating the ‘S’ in ESG (environmental, social, governance) risk and opportunity assessments, particularly for investors with long-term strategic investment horizons.
It is important to note that at the outset of this research, we hoped to explore diversity and inclusion more broadly across gender, race, socioeconomic background and sexual orientation at both the macro (across countries) and micro (across firms) level. We realised early on, however, that a key takeaway from this work is just how limited the data is regarding inequalities at a company and country level.
Chart 1: Key Results for Policy Makers and Investors alike% Change in Female LFPR Moving from 25th to 75th Percentile in Variable
-10
-5
0
5
10
15
Tax Burden for Single Parents
Tax Burden for Second Earner
Temporary Employment Protections
Female Education
Share of Women Working Part-time
GDP per Capita
Paternity LeaveMale LFPR
Positive drivers of female LFPR
Negative drivers of female LFPR
Source: Barro&Lee, Maddison Project, OECD, Prospered Project, World Bank, ASIRI (as of 2016).

04 A woman’s place: boosting female labour force participation to lift long-term economic growth
05A woman’s place: boosting female labour force participation to lift long-term economic growth
Background: diversity and inclusion are among the keys to unlocking long-term growth potential
The diversity and inclusion debate usually centres on the importance of social justice and fairness in the labour market and society. The morality of empowering and creating opportunities for all individuals regardless of background, race or gender is well-trodden and founded on strong philosophical grounds.
However, increasing the diversity and inclusivity of the workforce also makes economic sense as it improves the efficiency of the labour market and the wider economy. By boosting overall labour force utilisation rates and the productivity of that large labour force, we can tap much more of the world’s human capital while also increasing the incentives for further investment over time. That in turn can help address the downward pressure on potential growth stemming from population ageing and the productivity slowdown of the past two decades.
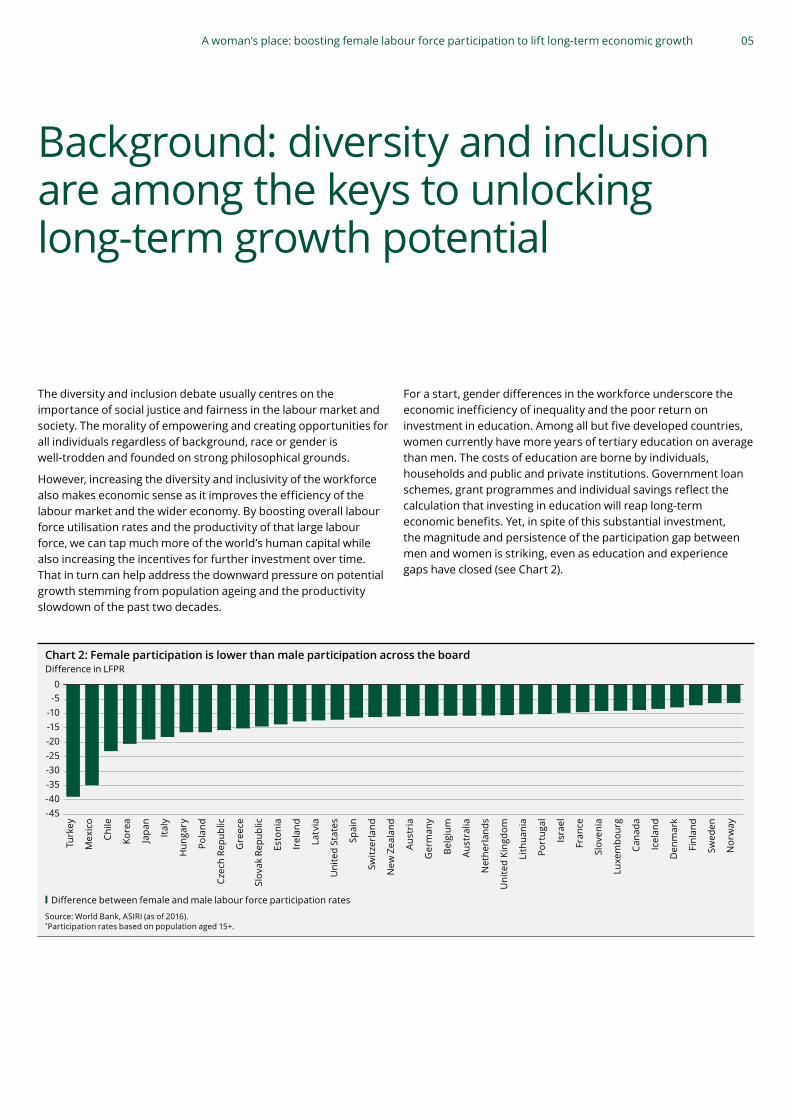
For a start, gender differences in the workforce underscore the economic inefficiency of inequality and the poor return on investment in education. Among all but five developed countries, women currently have more years of tertiary education on average than men. The costs of education are borne by individuals, households and public and private institutions. Government loan schemes, grant programmes and individual savings reflect the calculation that investing in education will reap long-term economic benefits. Yet, in spite of this substantial investment, the magnitude and persistence of the participation gap between men and women is striking, even as education and experience gaps have closed (see Chart 2).
Chart 2: Female participation is lower than male participation across the boardDifference in LFPR
-45-40-35-30-25-20-15-10-50
Nor
way
Swed
en
Finl
and
Den
mar
k
Icel
and
Cana
da
Luxe
mbo
urg
Slov
enia
Fran
ce
Isra
el
Port
ugal
Lith
uani
a
Uni
ted
King
dom
Net
herl
ands
Aust
ralia
Bel
gium
Ger
man
y
Aust
ria
New
Zea
land
Switz
erla
nd
Spai
n
Uni
ted
Stat
es
Latv
ia
Irel
and
Esto
nia
Slov
ak R
epub
lic
Gre
ece
Czec
h Re
publ
ic
Pola
nd
Hun
gary
Ital
y
Japa
n
Kore
a
Chile
Mex
ico
Turk
ey
Difference between female and male labour force participation rates
Source: World Bank, ASIRI (as of 2016).*Participation rates based on population aged 15+.

06 A woman’s place: boosting female labour force participation to lift long-term economic growth
Diversity and inclusion are frequently cited as desirable qualities for the workplace and the labour market more broadly. However, while they are often conflated, there is a clear conceptual distinction between the two terms. ‘Inclusion’ is about a person’s ability to contribute fully and effectively to an organisation. This is distinct from ‘diversity’, where an organisation is looking to employ people from varied backgrounds (race, gender, cultural, cognitive, socioeconomic). Both are important in the conversation about gender inequality. For example, World Bank research suggests that women are more likely to work in lower paid, ‘buffer’ roles in many sectors. And they are much less likely than their male counterparts to have leadership positions (see Chart 3).
Chart 3: Women are more likely to work in support roles and much less likely to lead%
0
20
40
60
80
100
OverallExecutiveSeniorManger
ManagerProfessionalSupportStaff
Women Men
Employment roles by sex
44
56
60
40
64
36
74
26
81
19
59
41
Source: MERCER, ASIRI (as of 2014).
Women have been especially exposed to the deep recessions caused by the Covid 19 pandemic. Lockdowns had their largest impact on low-paid service-sector jobs that tend to be filled by women. And women’s greater unpaid caring responsibilities have left them with a higher burden of home-working and home-schooling. Given women’s above-average education level in most developed countries, the scale of inequality in terms of quality of work and work/care trade-offs represents a sub-optimal allocation of resources and a drag on potential output.
The implications of women’s current labour force predicament becomes greater when we look ahead. The demographic challenge of an ageing population will become more acute in developed markets in the coming decades. The fertility replacement rate to maintain current population levels is 2.1 (assuming no net immigration). But in developed countries, the average replacement rate is only 1.7. In Spain and Italy, it is even lower at 1.3. Korea has the lowest rate, at 1.1. And, while replacement rates in developed countries are low, life expectancy rates have risen to just over 80 years old. So, more people will exit the workforce with many years of life still ahead, while fewer young people join the workforce to replace them.
This will put further downward pressure on potential growth unless offsetting steps are taken to bolster labour utilisation and productivity. It’s also likely to squeeze government finances. Greater spending will be needed for health, social care and pensions, with fewer taxpayers in the labour force to fund it. To address this challenge, policymakers must consider a multitude of options. These could include extending the number of years people work, importing labour or maximising the domestic labour force.
For companies, the ageing population could create labour shortages, even as technology helps boost productivity. Almost 37% of adult women in the developed world are not participating in the labour force, despite their substantial levels of tertiary education. This highlights a huge untapped potential source of labour today and in the face of rising demographic challenges.
Diversity alone is not enough to optimise resource allocation in companies and the economy
“ Almost 37% of adult women in the developed world are not participating in the labour force, despite their substantial levels of tertiary education.”

Understanding the drivers of female labour force participation in the 21st centuryThe ‘A Woman’s Place’ research series seeks to better understand the relationship between labour force participation rates for women and men, and the macroeconomic cycle; demographics; labour markets; and policies that aim to reduce barriers to participation among women (such as legislated leave, subsidy programmes and taxation).
In this work, we focus in particular on policy. Our first edition of the series explores the role of leave policies in driving labour force participation. The relationship between labour force participation and leave, as well as other diversity and inclusion policies, is very poorly understood. Indeed, only a few major cross-country studies have been carried out since the early 2000s. It’s essential we understand these relationships to identify possible policy options for improving outcomes.
Too often, the diversity and inclusion debate focuses purely on women and women’s policies, rather than considering the interplay between men and women. For example, there is scant cross-country evidence about how paternity leave affects female labour force participation. Likewise, little is known about how other policies aimed at lifting female participation affect male participation, if at all. This information is vital for building a complete picture of the long-term labour force.
At the outset of this research, we hoped to explore diversity and inclusion more broadly across gender, race, socioeconomic background and sexual orientation, at both country and company level. However, we realised early on that data on inequalities is extremely limited. Traditional gender splits between men and women at country level were the only area we found the data comprehensive enough for analysis.
As a result, the focus and conclusions from this study are, by necessity, focused on differences in male and female labour force participation. Nonetheless, we acknowledge the strict delineation of male and female does not capture the full spectrum of gender identity, being just a small part of the diversity and inclusion conversation. We need more high-quality data on the labour force barriers facing people from many different backgrounds.

What drives labour force participation?
In order to measure the drivers of female and male labour force participation, we built a model covering 31 countries from 2002 to 2016. This is a much more recent time period than most of the existing literature. Full details of the data in our model can be found in the appendix. Details of the modelling choices we made and the challenges we faced can be found in the working paper.
In reviewing the results, we are mainly interested in whether the relationships are statistically ‘significant’. In other words, is the evidence strong enough that we cannot argue there is no effect at all). If the relationship is significant and there is indeed an effect, we establish whether that relationship has a positive or negative sign, and the size of the effect.
The rest of this paper is structured around the five most important findings from our research for policymakers, companies and investors, as follows.
1. Ensure that men have access to paternity leaveThe most striking result is that higher legislated paternity leave entitlements are significantly and positively associated with higher rates of female labour force participation. This highlights how policies targeting greater gender diversity and inclusion must focus on male behaviour and labour supply decisions, not just thoseof women.
The fact that we find a significant relationship between paid paternity leave and female participation rates is remarkable - especially given the ongoing challenge in getting men to take paternity leave. Although our research cannot identify the precise channel through which legislated paternity leave matters, there are two main possibilities. One is causal, with higher paternity leave entitlements themselves altering labour supply decisions. Another possibility is that countries implementing greater paternity leave are undergoing the type of social and cultural change associated with higher female participation.
We cannot capture how the culture of leave-taking changes over time. However, other evidence suggests culture is an important constraint. Interestingly, while Japan and South Korea have the most generous paternity leave entitlements, we know that take-up is particularly low in these countries. So much so that, because they are such outliers in terms of legislated leave and uptake, they actually lead to an underestimation of the positive impact of paternity leave policies. When we remove Japan and South Korea,

09A woman’s place: boosting female labour force participation to lift long-term economic growth
not only is the benefit of paternity leave estimated to be higher across leave lengths, the length at which this impact becomes negative is much later: 54 weeks versus a prior 45 (see Chart 4).
This might suggest that policy can only achieve so much, and our model estimates may be at the lower end of the range for the positive effect paternity leave can have. However, this raised the question of why the peak positive effect appears to be low, at around seven weeks. After then, the effect remains positive but falls as time goes on. We expected the marginal benefits of paternity leave to diminish, as it does with maternity leave. However, we’re cautious about anchoring too much on the seven-week mark, given our inability to formally control for take-up. In addition, there’s a variety of channels through which leave entitlement might be affecting participation.
Nevertheless, the benefit of both parents taking leave makes sense, both on the supply side and demand side of the labour equation. If women expect to take career breaks while their partners don’t, this naturally creates less attachment to the labour force. That means an employer considering two candidates of different genders may have conscious or unconscious bias towards hiring the person least likely to leave. If all parents are equally likely to take leave, these barriers to women entering and staying in the workforce should logically decline.
The relevance of our paternity leave finding comes into even sharper relief considering that maternity leave (which includes both maternity leave and parental leave) is not significant for female participation in our model. We investigated whether this is a recent change, by extending earlier work by the OECD. This work revealed that it reflects just how much progress was made in expanding maternity leave rights in previous decades – notably the 1980s. So much so that, any changes since the 2000s have not had a statistically significant impact on female participation rates (see Chart 5). For countries that still have low maternity leave entitlements (mainly English speaking), it may be that company
policies are on average more generous. Again, however, we cannot measure that directly, underscoring the challenge of trying to understand these complex relationships with limited data.
2. Reform taxation systems to reduce tax wedges forsecond earnersRelevant policies to alter incentives to work stretch beyond leave policies. Tax systems play a vital role in determining the relative cost-benefit of taking up formal paid employment (the extensive margin) and the number of hours one works when in paid employment (the intensive margin). Tax serves a vital purpose in the economy, particularly for government balance sheets. However, poor policy can distort labour supply decisions and lead to sub-optimal resource allocation. The fact that tax wedges can be larger for second earners and for single parents is particularly relevant to the issue of female participation rates. So, we were keen to test these relationships.
We find that systems that put a higher tax burden on second earners and sole earners having children are associated with lower female labour force participation rates. This makes sense given women tend to be the second earners in dual-income households, and are more likely to be single parents than men. We found the opposite relationship held for men, suggesting traditional gender norms make men more likely to be the primary earner in a household.
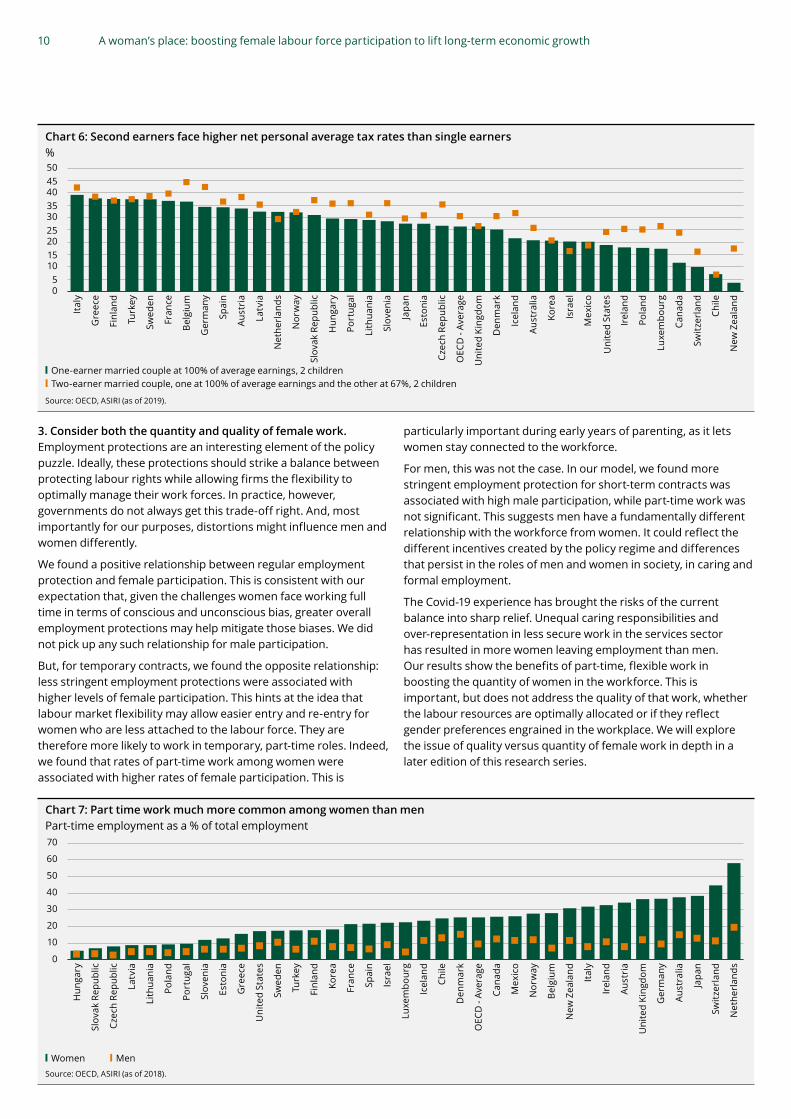
Taking the results together, we find evidence that tax wedges can reinforce systemic inequality. They do so by creating further barriers to female participation, which affects intensive labour supply margins. This is an important and actionable result for policymakers given second earners continue to be taxed more than single earners in many developed countries (see Chart 6). The advantage of tax reform is that it is applied by the government, and so doesn’t face the same take-up issues as leave policies. We will explore the role of tax policy in a future edition of this series.
Chart 4: Impact of paternity leave is striking but excluding outliers highlights potential role of culture Implied impact on log female LFPR
-0.01
0.00
0.01
0.02
0.03
0.04
0.05
51464136312621161161
All 31 Countries Without Japan & South Korea
Number of weeks of Paternity Leave
Negative = 54 Weeks
Negative = 45 Weeks
Peak = 7 WeeksPeak = 7 Weeks
0.06
Source: Prospered Project, World Bank, ASIRI (as of 2016).
Chart 5: Maternity leave policies made the greatest gains in the 80s and 90sLog female LFPR
0 20 40 60 80 100 120 140 160 1803.0
3.2
3.4
3.6
3.8
4.0
4.2
4.4
4.6
1980-89 1990-99 2000-2009 2010-2019Linear (1980-89) Linear (1990-99) Linear (2000-09) Linear (2010-19)
Maternity leave
Source: OECD, World Bank, ASIRI (as of 2016).
10 A woman’s place: boosting female labour force participation to lift long-term economic growth
Chart 6: Second earners face higher net personal average tax rates than single earners%
05
101520253035404550
New
Zea
land
Chile
Switz
erla
nd
Cana
da
Luxe
mbo
urg
Pola
nd
Irel
and
Uni
ted
Stat
es
Mex
ico
Isra
el
Kore
a
Aust
ralia
Icel
and
Den
mar
k
Uni
ted
King
dom
OEC
D -
Aver
age
Czec
h Re
publ
ic
Esto
nia
Japa
n
Slov
enia
Lith
uani
a
Port
ugal
Hun
gary
Slov
ak R
epub
lic
Nor
way
Net
herl
ands
Latv
ia
Aust
ria
Spai
n
Ger
man
y
Bel
gium
Fran
ce
Swed
en
Turk
ey
Finl
and
Gre
ece
Ital
y
One-earner married couple at 100% of average earnings, 2 childrenTwo-earner married couple, one at 100% of average earnings and the other at 67%, 2 children
Source: OECD, ASIRI (as of 2019).
3. Consider both the quantity and quality of female work. Employment protections are an interesting element of the policy puzzle. Ideally, these protections should strike a balance between protecting labour rights while allowing firms the flexibility to optimally manage their work forces. In practice, however, governments do not always get this trade-off right. And, most importantly for our purposes, distortions might influence men and women differently.
We found a positive relationship between regular employment protection and female participation. This is consistent with our expectation that, given the challenges women face working full time in terms of conscious and unconscious bias, greater overall employment protections may help mitigate those biases. We did not pick up any such relationship for male participation.
But, for temporary contracts, we found the opposite relationship: less stringent employment protections were associated with higher levels of female participation. This hints at the idea that labour market flexibility may allow easier entry and re-entry for women who are less attached to the labour force. They are therefore more likely to work in temporary, part-time roles. Indeed, we found that rates of part-time work among women were associated with higher rates of female participation. This is
particularly important during early years of parenting, as it lets women stay connected to the workforce.
For men, this was not the case. In our model, we found more stringent employment protection for short-term contracts was associated with high male participation, while part-time work was not significant. This suggests men have a fundamentally different relationship with the workforce from women. It could reflect the different incentives created by the policy regime and differences that persist in the roles of men and women in society, in caring and formal employment.
The Covid-19 experience has brought the risks of the current balance into sharp relief. Unequal caring responsibilities and over-representation in less secure work in the services sector has resulted in more women leaving employment than men. Our results show the benefits of part-time, flexible work in boosting the quantity of women in the workforce. This is important, but does not address the quality of that work, whether the labour resources are optimally allocated or if they reflect gender preferences engrained in the workplace. We will explore the issue of quality versus quantity of female work in depth in a later edition of this research series.
Chart 7: Part time work much more common among women than men Part-time employment as a % of total employment
0
10
20
30
40
50
60
70
Net
herl
ands
Switz
erla
nd
Japa
n
Aust
ralia
Ger
man
y
Uni
ted
King
dom
Aust
ria
Irel
and
Ital
y
New
Zea
land
Bel
gium
Nor
way
Mex
ico
Cana
da
OEC
D -
Aver
age
Den
mar
k
Chile
Icel
and
Luxe
mbo
urg
Isra
el
Spai
n
Fran
ce
Kore
a
Finl
and
Turk
ey
Swed
en
Uni
ted
Stat
es
Gre
ece
Esto
nia
Slov
enia
Port
ugal
Pola
nd
Lith
uani
a
Latv
ia
Czec
h Re
publ
ic
Slov
ak R
epub
lic
Hun
gary
Women MenSource: OECD, ASIRI (as of 2018).

11A woman’s place: boosting female labour force participation to lift long-term economic growth
4. Strengthen the performance and resilience of the overall economy Our model included a number of macroeconomic variables but three showed a strong positive relationships with female participation. These were: countries’ levels of GDP (gross domestic product) per capita, male labour force participation rates and education levels.
The economic literature suggests that the impact of economic development has a U-shaped effect on female participation rates. Low-income countries feature high female workforce participation (in part because of their high participation in agriculture). This then declines as incomes begin to rise. It then rises again at high incomes owing to increased education rates and other economic, social and cultural characteristics.
In our dataset, the relatively developed economies are of similar levels of development and thus likely sit to the right-hand-side of the U-shape. The positive relationship we found between female participation and GDP per capita appears to corroborate this.
It’s no great surprise that greater female education is associated with higher female participation, reflecting the well-known importance of education in driving female participation. Meanwhile the finding that higher male participation is associated with higher female participation, and vice versa, likely reflects overall labour market health.
That said, further analysis highlights the differences that emerge in this relationship across countries (see Chart 8). Turkey and Mexico, where cultural norms tend to reinforce the prominence of unpaid work for women, stand out for their skew towards male participation. Iceland, where gender equality is considered high, is a clear outlier for the strength of its positive relationship between male and female participation.
Chart 8: Outliers suggest more equal environments lead to mutual benefits to male & female LFPR
4.00 4.05 4.10 4.15 4.20 4.25 4.30 4.35 4.40 4.453.1
3.3
3.5
3.7
3.9
4.1
4.3
4.5Log LFPR Female
Log LFPR MemaleLines represent the linear trend between male LFPR and female LFPR
Iceland
Turkey
Mexico
Source: WDI, World Bank, as of 2016.
Other cyclical macroeconomic factors may also be important but are likely being captured by the way we control for time trends in the data. We will explore this complex interplay in a future edition of the series. Nonetheless, these results reinforce the importance of sound economic policy that boosts and protects the strength of the economy. This will lift all boats and create a virtuous cycle of overall labour demand, supply and growth. This includes avoiding recessions and then putting in place policies aimed at generating robust recoveries afterwards. Evidence suggests business cycle downturns can lead to major setbacks in labour force attachment for both men and women.
5. Report more and higher-quality data This research gives us a grounding to assess our own policies within Aberdeen Standard Investments. It also helps inform our engagement with companies on issues that matter, so we can build our understanding of the importance for companies of diversity and inclusion. But one of the most striking challenges we encountered is the lack of information at a company level regarding policies to boost diversity and inclusion in the future. There is data available on some high-level indicators, such as the number of women on boards. However, this tells us little about true diversity and inclusion within a firm today. It also gives no indication of the long-term trajectory for a firm’s workforce.
Understanding which policies work can help us ask the right questions of companies and put together a more complete picture of diversity and inclusion. As a result of this research, we are planning to survey firms directly. Our aim is to gather the data ourselves to find out what’s happening on the ground in terms of company parental leave allowance and take-up. This will allow us to do further investigations into the relationship between policy, equality and profitability.
Rose Thomson, Chief HR Officer at Standard Life Aberdeen:This research, undertaken by the Aberdeen Standard Investments Research Institute, lays out unequivocally the impact that parental leave has on gender-balanced economic participation in the workforce. It’s a fundamental lever for companies to play their part in levelling opportunities for all parents, and for addressing long-standing societal gender inequalities.
Current arrangements to support working families - whether statutory or enhanced – can mean that parents have to make difficult decisions about who can afford to take leave, and whether one parent’s time with the child takes away from the other’s. We think that needs to change. Aberdeen Standard Investments is a family-friendly employer. We have policies that represent a potentially life-changing opportunity for new parents – whatever their family circumstances. We know that our people need to balance their working lives with their personal lives. Our parental leave is one example of the actions we’re taking as a company to help maintain that balance, and ensure that all parents have an equal opportunity to participate in the workforce.

12 A woman’s place: boosting female labour force participation to lift long-term economic growth

13A woman’s place: boosting female labour force participation to lift long-term economic growth
ConclusionsOur research suggests that labour market strength, education and economic development can act to boost female participation (see Chart 9). This underscores the overall importance of sound economic policy aimed at stimulating long-term growth.
In terms of policy action, legislating father-specific parental leave stands out as the clear next frontier in tackling gender inequality and boosting female participation. The added benefit is that these policies do not appear to damage male participation (see Chart 9). However, it’s vital that companies encourage fathers to take their allocated leave.
Addressing distortions in tax on second earners and single parents is also an important policy lever. So, too, are employment protections for permanent contracts, with more flexibility for short-term work. Such policies can reduce the work/care trade-off facing women, and boost female workforce participation (see Chart 9).
All countries – but particularly those with low female participation – should review these policies if they want to lift aggregate participation and potential output. The benefits include greater social equality for women, as well as economic benefits from efficiency gains and a larger workforce.
For investors, this study highlights the importance of social factors in influencing long-term economic and, hence, market outcomes. This is particularly relevant as ESG (environmental, social and governance) considerations become increasingly central to investment approaches. The evidence in this research provides further rationale for considering the often-underestimated ‘S’ in ESG risks and opportunities, particularly for investors with long-term strategic investment horizons.
Finally, one of the most striking takeaways of this research has been the lack of high-quality company-level data on diversity and inclusion policies, both in terms of gender and wider minority empowerment. We could not test individual company policies. Our work highlights how data gaps inhibit our understanding of the relationship between a firm’s diversity and inclusion policies and its business performance. As a result, we plan to engage with companies directly to gather this information. This will allow us to build a clearer picture of the relationship between diversity and inclusion policies, gender equality and profitability.
More generally, this work provides important evidence on where we can engage with governments to show how these policies can help them achieve economic and public-finance goals. It also opens up important dialogue about difficult-to-measure but important cultural drivers and the role that companies and investors have in creating more equal opportunities.
Chart 1: Key Results for Policy Makers and Investors alike% Change in Female LFPR Moving from 25th to 75th Percentile in Variable
-10
-5
0
5
10
15
Tax Burden for Single Parents
Tax Burden for Second Earner
Temporary Employment Protections
Female Education
Share of Women Working Part-time
GDP per Capita
Paternity LeaveMale LFPR
Positive drivers of female LFPR
Negative drivers of female LFPR
Source: Barro&Lee, Maddison Project, OECD, Prospered Project, World Bank, ASIRI (as of 2016).

Important InformationImportant: This document is not an advertisement and does not constitute or form part of any offer or solicitation to issue, sell, subscribe or purchase any investment nor shall it or the fact of its distribution form the basis of or be relied on in connection with, any contract for the same. The contents in this document are for information, illustration or discussion purposes only and should not be construed as a recommendation to buy or sell any investment product and do not purport to represent or warrant the outcome of any investment product, strategy program or product. Reference to individual companies or any securities or funds is purely for the purpose of illustration only and is not and should not be construed as a recommendation to buy or sell, or advice in relation to investment, l egal or tax matters. Any research or analysis used to derive, or in relation to, the above information has been procured by Aberdeen Standard Investments (‘ASI’) for its own use, without taking into account the investment objectives, financial situation or particular needs of any specific investor, and may have been acted on for ASI own purpose. ASI does not warrant the accuracy, adequacy or completeness of the information herein and expressly disclaims liability for any errors or omissions. The information is given on a general basis without obligation and on the understanding that any person acting upon or in reliance on it, does so entirely at his or her own risk. Past performance is not necessarily indicative of future performance. Any projections or other forward-looking statements regarding future events or performance of countries, markets or companies are not necessarily indicative of, and may differ from, actual events or results. ASI reserves the right to make changes and corrections to the information, including any opinions or forecasts expressed herein at any time, without notice. No reliance may be placed for any purpose on the information and opinions contained in this document or their accuracy or completeness. This document may not be reproduced in any form without the express permission of ASI Asia and to the extent it is passed on, care must be taken to ensure that this reproduction is in a form that accurately reflects the information presented here.
This content is available in the following countries/regions and issued by the respective entities detailed below:**(entities as at 1 January 2021)
Europe, Middle East and AfricaUnited Kingdom (UK): Aberdeen Asset Managers Limited, registered in Scotland (SC108419) at 10 Queen’s Terrace, Aberdeen, AB10 1XL. Standard Life Investments Limited registered in Scotland (SC123321) at 1 George Street, Edinburgh EH2 2LL. Both companies are authorised and regulated in the UK by the Financial Conduct Authority. Austria, Belgium, Cyprus, Denmark, Finland, France, Germany, Gibraltar, Greece, Iceland, Ireland, Italy, Luxembourg, Netherlands, Norway, Portugal, and Sweden: Aberdeen Asset Managers Limited, registered in Scotland (SC108419) at 10 Queen’s Terrace, Aberdeen, AB10 1XL. Standard Life Investments Limited registered in Scotland (SC123321) at 1 George Street, Edinburgh EH2 2LL. Both companies are authorised and regulated in the UK by the Financial Conduct Authority. Switzerland: Aberdeen Standard Investments (Switzerland) AG. Registered in Switzerland (CHE-114.943.983) at Schweizergasse 14, 8001 Zürich. Abu Dhabi Global Market (“ADGM”): Aberdeen Asset Middle East Limited, 6th floor, Al Khatem Tower, Abu Dhabi Global Market Square, Al Maryah Island, P.O. Box 764605, Abu Dhabi, United Arab Emirates. Regulated by the ADGM Financial Services Regulatory Authority. For Professional Clients and Market Counterparties only. South Africa: Aberdeen Asset Managers Limited (“AAML”). Registered in Scotland (SC108419) at 10 Queen’s Terrace, Aberdeen, AB10 1XL. AAML holds a Category I financial services provider (FSP) licence in terms of the Financial Advisory and Intermediary Services Act, 2002, (FAIS) under licence 43675.
Asia-PacificAustralia and New Zealand: Aberdeen Standard Investments Australia Limited ABN 59 002 123 364, AFSL No. 240263. In New Zealand to wholesale investors only as defined in the Financial Markets Conduct Act 2013 (New Zealand). Hong Kong: Aberdeen Standard Investments (Hong Kong) Limited. This document has not been reviewed by the Securities and Futures Commission. Indonesia: PT Aberdeen Standard Investments Indonesia, an investment manager license holder registered and supervised by the Indonesia Financial Services Authority (OJK). Malaysia: Aberdeen Standard Investments (Malaysia) Sdn Bhd, Company Number: 200501013266 (690313-D). This document has not been reviewed by the Securities Commission of Malaysia. Taiwan: Aberdeen Standard Investments Taiwan Limited, which is operated independently, 8F, No.101, Songren Rd., Taipei City, Taiwan Tel: +886 2 87224500. Thailand: Aberdeen Standard Asset Management (Thailand) Limited. Singapore: Aberdeen Standard Investments (Asia) Limited, Registration Number 199105448E.
AmericasBrazil: Aberdeen Standard Investments is the marketing name in Brazil for Aberdeen do Brasil Gestão de Recursos Ltda. Aberdeen do Brasil Gestão de Recursos Ltda. is an entity duly registered with the Comissão de Valores Mobiliários (CVM) as an investment manager. Canada: Aberdeen Standard Investments (“ASI”) is the marketing name in Canada for Aberdeen Standard Investments (Canada) Limited, Aberdeen Standard Investments Luxembourg S.A., Standard Life Investments Private Capital Ltd, SL Capital Partners LLP, Standard Life Investments Limited, Aberdeen Standard Alternative Funds Limited, and Aberdeen Capital Management LLC. Aberdeen Standard Investments (Canada) Limited, is registered as a Portfolio Manager and Exempt Market Dealer in all provinces and territories of Canada as well as an Investment Fund Manager in the provinces of Ontario, Quebec, and Newfoundland and Labrador. United States: Aberdeen Standard Investments is the marketing name for the following affiliated, registered investment advisers: Aberdeen Standard Investments Inc., Aberdeen Asset Managers Ltd., Aberdeen Standard Investments Australia Ltd., Aberdeen Standard Investments (Asia) Ltd., Aberdeen Capital Management LLC, Aberdeen Standard Investments ETFs Advisors LLC and Aberdeen Standard Alternative Funds Limited.


Visit us online aberdeenstandard.comSTA0121884008-002