a134.433 aerial port capability planning volume
TRANSCRIPT

A134.433 AERIAL PORT OF EMBARKATION CAPABILITY PLANNING VOLUME I(U AIR FORCE INST OF TECH WRIGHT-PATTERSON AFB OHSCHOOL OF SYSTEMS AND LOGISTICS T W CHRISTENSEN ET AL.JNLSIFIED SEP 83 AFIT-LSSR-62-83 F/G 15/5 NL
mhmmmhhmhhhlEhhhhhomhhhmmlEEmhohhhhEEmhIEEEmhmhhEEEshI

- PJIL~15 N

J1 _02 I
DEPARTMENT OF THE AIR FORCE jV0418
-- ~ ~~~AIR UNIVERSITYTEH O0 Y iAIR FORCE INSTITUTE OF -EH OLf
Wright-Patterson Air Force Base, Ohio
o~iP
Thii docu nit has bee iiiIr aI
dbapu~crisvUUJits 83 11 04 032

AERIAL PORT OF EMBARKATIONCAPABILITY PLANNING
VOLUME I
THOMAS W. CHRISTENSEN, MAJOR, USAFGERALD L. WHITE, CAPTAIN, USAF
LSSR 62-83

The contents of the document are technically accurate, andno sensitive items, detrimental ideas, or deleteriousinformation are contained therein. Furthermore, the viewsexpressed in the document are those of the author(s) and donot necessarily reflect the views of the School of Systemsand Logistics, the Air University, the Air Training Com~mand,the United States Air Force, or the Department of Defense.
11 Olt

UNCLASSI FlEDSECURITY CLASSIFICATION OF THIS PAGE (Whien Does Enterect)
REPORT DOCUMENTATION PAGE {READ INSTRUCTIONSBEFORE COMPLETING FORM
I. REPORT NUMBER 2. GOVT ACCESSION NO. 3. RECIPIENT'S CATALOG NUMBER
LSSR 62-83 .- -4. TITLE (and Subtitle) S. TYPE OF REPORT & PERIOD COVERED
AERIAL PORT OF EMBARKATION Master's ThesisCAPABILITY PLANNTINGVOLUME I G. PERFORMING ORG. REPORT NuMBER
7. AUTHOR(.) 8. CONTRACT OR GRANT NUMBER(s)
Thomas We Christensen, Major, USAFGerald L. White, Captain, USAF
9. PERPORMING ORGANIZATION NAMIE AND ADDRESS 10. PROGRAM ELEMENT. PROJECT. TASKAREA & *ORK UNIT NUMBERS
School of Systems and LogisticsAir Force Institute of Technology,WPAFB
|. CONTROLLING OFFICE NAME AND ADDRESS 12. REPORT DATE
Department of Communication September 1983I3. NUMBER OF PAGESAFIT/LSH, ;PAFB OH 45433 225____ ___ ___ ____ ___ ___ ___ ____ ___ ___ ___225
14. MONITORING AGENCY NAME & ADORESS(if different from Controlling Office) 15. SECURITY CLASS. (of this report)
UNCLASSIFIED
IS1. DECLASSIFICATION, DOWNGRADINGSCHEDULE
16. DISTRIBUTION STATEMENT (of ahis Report)
A-pproved for public release; distribution unlimited
7. DISTRIBUTION STATEMENT (of rhe abstract entered in Block 20, If different from Report)
IS. SUPPLEMENTARY NOTES *qR ovod I- p0 ulf(#ea LAW AF 2Lg .'
09. Hllo eltlIcd ProfisslongIe-f-, -eIqp8Alt FOitr IR-- utle, o T ockA e.lgy EATC) o.WtiPUWono AF3 CH 454W '
19. it Ev WORDS (Continue on reverse side if necessury and Identify by block number)
Computer Applications PlanningComDuterized Simulation ReceptionMobilizationMobilityModels
20. ABSTRACT (Continue on reveree side It neceeeary and identify by block number)
Thesis Chairman: Larry W. Emmelhainz, Captain, USAF
DO I JAN 13 1473 EDITION OF I NOV6 IS OBSOLETE UNCLASSIFIEDSECURITY CLASSIFICATION OF THIS PAGE '"'en Data Entered)
.. . .. . . . . . ,-, , . . ,. , . -. . . . . . . .. ' ' . . . . " . . . . . . . , ,,

7 TTJCT.A!,q T ;T)SECURITY CLASSIFICATION OF THIS PAGE(Wheu Date Entered)
The complex nature of the base reception process, combined withthe variability of processing requirements, arrival times, anddeparture times, make planning for the mobilization and deploymentof U.S. forces difficult to accurately accomplish. This thesisdeveloped a management tool applicable to all APOE bases to createand evaluate reception plans. The computerized model was fullyvalidated and then used to determine adequate resource levels toachieve on-time preparation of deploying assets. The simulationresults were analyzed statistically to ensure resource optimizationActual warplan data were used in Volume IH to generate resourcelevels required to support the OPLAN.
UNCLASSI FIED

LSSR 62-83
AERIAL PORT OF EMBARKATION
CAPABILITY PLANNING
VOLUME I
A Thesis
Presented to the Faculty of the School of Systems and Logistics
of the Air Force Institute of Technology
Air University
In Partial Fulfillment of the Requirements for the
Degree of Master of Science in Logistics Management
By
Thomas W. Christensen, BS Gerald L. White, ABMajor, USAF Captain, USAF
September 1963
Approved for public release;distribution unlimited

This thesis, written by
Major Thomas W. Christensen
and
Captain Gerald L. White
has been accepted by the undersigned on behalf of the fac-ulty of the School of Systems and Logistics in partial ful-fillment of the requirements for the degree of
MASTER OF SCIENCE IN LOGISTICS MANAGMENT
DATE: 28 September 1983
COMAITTEE CHAIRMAN
-- ---

ACKNOWLEDGEMENTS
We wish to thank Major Sam McGowan for his advice and
assistance in the construction of this reception model.
We also thank Mr. Jim Poffenberger and Mr. Don Huggins for
their assistance with determining the values of the
numerous variables used in the model. Most of all, we
thank our advisor Captain Larry Emmelhainz for his help
with this thesis.
iii
-- , _ ...... . . .. . . .. .. . . . . . . .. . . . .. .. . . . .. . .. . . . . ..

TABLE OF CONTENTS
Page
ACKNOWLEDGEMENTS.....................ii
LIST OF TABLES....................viii
LIST OF FIGURES......................ix
CHAPTER
1. BACKGROUND......................
BASE RECEPTION.................3
PROBLEM STATEMENT................7
JUSTIFICATION...................
OBJECTIVE...................9
RESEARCH QUESTIONS ............... 10
SCOPE.....................11
CHAPTER SUMMARY................12
2. METHODOLOGY...................13
SYSTEM ANALYSIS................13
COMPUTER SIMULATION..............15
PROBLEM SOLVING PARADIGM. ........... 16
SYSTEM DEFINITION...............17
MODEL FORMULATION...............19
DATA PREPARATION................21
MODEL TRANSLATION................23
VALIDATION...................25
STRATEGIC PLANNING ............... 27
TACTICAL PLANNING...............30
EXPERIMENTATION................31
iLv

CHAPTER Page
INTERPRETATION.................32
IMPLEMENTATION.................33
CHAPTER SUMMARY................33
3. MODEL APPLICATION................34
SYSTEM DEFINITION................34
MODEL FORMULATION...............36
PERSONNEL RECEPTION.............37
CARGO RECEPTION...............39
DATA PREPARATION................42
EXOGENOUS VARIABLES.............43
ENDOGENOUS VARIABLES............47
STATUS VARIABLES..............48
CRITERION VARIABLE.............48
ASSUMPTIONS.................48
MODEL TRANSLATION................49
VALIDATION...................51
STRATEGIC PLANNING...............53
TACTICAL PLANNING................55
CHAPTER SUMMARY................57
4. EXPERIMENTATION AND INTERPRETATION. ....... 58
EXPERIMENTATION................59
INTERPRETATION................61
LIMITATIONS...................67
CHAPTER SUMMARY................69

CHAPTER Page
5. IMPLEMENTATION AND RECOMMENDATIONS. ....... 70
RESEARCH QUESTIONS................70What are the critical factors
representing the receptionprocess?.................70
What are the duration distributionsassociated with receptionactivities?...............71
What technique will best validatethe reception model? ........... 71
Does the simulation identifycritical shortages?...........72
CONCLUSION.................72
IMPLEMENTATION.................73
RECOMMENDATIONS................74
MODEL USE...................74
MODEL IMPROVEMENT..............74
MODEL INCORPORATION.............76
CHAPTER SUMMARY................77
APPENDICES
A. ACRONYMS......................79
B. WARPLAN DEVELOPMENT................82
C. GRAPHIC MODEL....................8
D. SLAM NETWORK FLOWCHART..............97
E. COMPUTER CODE..................124
F. SIMULATED TPFDD INPUT.............157
G. SLAM SUMMARY REPORTS...............171
H. STATISTICAL ANALYSIS...............184
Vi

APPENDICES Page
I. USER'S MANUAL.................193I
SELECTED B IBL IOGRAPHY
A. REFERENCES CITED................208
B. RELATED SOURCES................211
VOLUME II
(S) ANNEX A: OPERATION PLAN RECEPTION ANALYSIS 1
vii

LIST OF TABLES
TABLE Page
4-1 CRITERION VARIABLE AVERAGES ......... 60
viii

LIST OF FIGURES
FIGURE Page
C-1 APOE RECEPTION PROCESSING ... .......... 89
C-2 PERSONNEL RECEPTION .... ............. 90
C-3 PERSONNEL PROCESSING .... ............. 91
C-4 CARGO RECEPTION ...... ............... 92
C-5 UNIT RELATED CARGO PROCESSING .. ....... 93
C-6 VEHICLE PROCESSING ..... .............. 94
C-7 NON-UNIT RELATED CARGO PROCESSING ...... . 95
C-8 EXPLOSIVE CARGO PROCESSING ... .......... 96
D-1 FRN ARRIVALS ....... ................. 98
D-2 PERSONNEL RECEPTION .... ............. 99
D-3 BILLETING ALLOCATION .... ............. . 100
D-4 BUS TRANSPORTATION FROM PASSENGER RECEPTIONTO STAGING ....... ................. 101
D-5 TRANSIENT BILLETING .... ............. 102
D-6 BUS TRANSPORTATION FROM PASSENGER RECEPTIONTO BILLETING ...... ................ 103
D-7 DEPARTING BILLETING .... ............. 104
D-8 BUS TRANSPORTATION FROM BILLETING-TO STAGING. 105
D-9 NON-UNIT PERSONNEL BUS TRANSPORTATION TOSTAGING ....... .................. 106
D-10 PASSENGER STAGING ..... .............. 107
D-11 TRANSPORTATION FROM PASSENGER STAGING TOTERMINAL ....... .................. 108
D-12 PASSENGER TERMINAL ..... .............. 109
D-13 BUS TRANSPORTATION TO AIRCRAFT ......... .. 110
D-14 PASSENGER DEPARTURE ..... ............ 111
ix

FIGURE Page
D-15 CARGO ARRIVAL ...... ................ 112
D-16 VEHICLE WASHING AND PROCESSING .......... 113
D-17 VEHICLE INSPECTION AND DEPARTURE ......... . 114
D-18 FRUSTRATED VEHICLE REWASHING ........... .. 115
D-19 UNIT RELATED PALLET UNLOADING .. ........ 116
D-20 UNIT RELATED PALLET INSPECTION .......... 117
D-21 UNIT RELATED PALLET DEPARTURE .. ........ 118
D-22 FRUSTRATED UNIT RELATED PALLETS ........ . 119
D-23 NON-UNIT RELATED CARGO UNLOADING ......... . 120
D-24 NON-UNIT RELATED CARGO PALLETIZATION ANDDEPARTURE ....... ................. 121
D-25 EXPLOSIVES UNLOADING .... ........... . 122
D-26 EXPLOSIVES PALLETIZATION AND DEPARTURE. . . . 123
'C

CHAPTER I
BACKGROUND
World crisis is a common occurance in the political
arena of today. Recent Conflicts in Lebanon, El Salvador,
Poland, and Afghanistan have all upset the stability of
international relations. In the environment of flaring
national tempers, world economic strife, and territorial
greed, the United States military must maintain a constant
readiness to preserve U.S. national interests anywhere in
the world. U.S. Military response to an international
situation may vary from the deterrence provided by our
force capability to full mobilization and deployment of
those forces. When called upon to mobilize, the Air Force
will be one of the primary agencies charged not only with
deploying its own combat forces but also with moving the
other services' personnel and equipment to the crisis
area. Extensive planning goes into our ability to move
huge amounts of resources to any loLation in the world.
Despite the detalled nature of those plans, changing
conditions always threaten their effectiveness.
The military services have developed warplans as a
preliminary estimate of force requirements for various
world contingencies. These plans identify required cargo

and personnel along with projected movement tables. In
the event of warplan execution an installation serving as
an Aerial Port of Embarkation (APOE) must receive and
process these resources and accomplish many divergent time
phased activities.
The APOE will deploy units permanently assigned to
the base as well as receive and deploy units of all
services mobilized elsewhere in their geographic area.
Certain APOEs located at Air Logistic Centers (ALCs)
serving as aerial ports of resupply will also handle a
large volume of unit related and non-unit related cargo
moving in relation to the deployment. AFR 28-4, USAF
Mobility Planning, specifies how base reception plans
will be developed (18:A-1); however, planners interpret
this to apply only to overseas locations (10). As the
result of an Air Force audit which criticized the lack of
guidance for CONUS base reception (21), Headquarters
USAF/XOORB is revising AFR 28-4 and requiring CONUS APOE
bases as well as overseas locations to develop reception
plans (6).
The preparation of a realistic APOE reception plan
requires familiarity with warplan development and APOE
mobility procedures. Development of a warplan is an
encompassing process supported at all levels of the DoD
structure and results in an extensive data base. Mobility
preparation of cargo and personnel for deployment, a labor
2

intensive process, requires close coordination among many
diverse and separate activities to ensure on-schedule
departures. The base reception plan which coordinates
these activities must integrate the warplan data base with
mobility activities to ensure adequate base support for
any specific warplan.
Warplan development (Appendix B) describes the forces
and material that will be required to meet a particular
contingency. The planning process further defines speci-
fic units to be deployed, amounts of cargo required, the
routing to be used, and the timing for each group to be
moved to the crisis area. This information is summarized
in the Time Phased Force Deployment Data (TPFDD) report
and is crucial to APOE planners in determining workloads
for the base reception system. The TPFDD data are the
inputs to the APOE base reception system. These inputs
will be processed through the reception system enroute to
the crisis destination to meet the contingency require-
ments of the plan being executed. Effective reception
planning is mandatory to ensure the rapid, on-time proces-
sing of personnel and cargo being deployed as a result of
a national emergency.
BASE RECEPTION
Despite the critical nature of APOE base reception,
this process has not been defined or standardized by
3
Headquarters USAF. One definition of the reception pro-
cess limits activites to providing food, shelter, and
other necessities to units and individuals arriving from
off-base; and receiving, sorting, and preparing off-base
unit related cargo for loading. Mobility processing of
on-base unit related and non-unit related cargo or per-
sonnel, and all Air Cargo Terminal activities are expli-
citly excluded (10).
For this thesis, however, the reception process will
include all support activities, including base mobility,
associated with deploying cargo and personnel identified
in the operation plan (OPLAN) movement tables. This more
inclusive definition represents the total work load
created by the OPLAN, and allows planners to identify work
centers which may be simultaneously tasked by different
sources.
The APOE will process many categories of personnel
and cargo arriving from a multitude of sources and requir-
ing specialized services. Deploying cargo and personnel,
for example, will originate from both on and off-base
locations and will be either unit related or non-unit re-
lated. In addition, retrograde cargo and personnel, which
includes damaged equipment returning to depots for repair
and evacuated non-combatants, must all be processed by
the APOE. The base reception process can be best under-
stood by viewing the categories of inputs that require
4

processing by the reception operation.
On-base unit related cargo and personnel will receive
mobility processing by their unit. Once this is done,
cargo will proceed directly to the marshalling area and
personnel will return to their quarters until departure.
The majority of non-unit related cargo originates from the
ALC warehousing system or the ALC maintenance facilities.
The Combat Logistics Support Squadron at the ALC prepares
these items for shipment and delivers them directly to the
APOE Air Cargo Terminal (3:4) where they are palletized
for air shipment.
Off-base unit related and non-unit related cargo and
personnel generally undergo mobility processing at their
home station, and do not report to the APOE until shortly
before their departure time. Off-base cargo and passen-
gers may arrive by commercial surface transport or by
LOGAIR. The cargo may or may not have been prepared for
airlift. Upon arrival the APOE must validate mobility
processing and cargo preparation to detect errors or omis-
sions and direct the cargo or personnel to the appropriate
processing area. Additionally, the APOE must supply food
and shelter for these personnel as they await departure
transportation (11).
Retrograde cargo and personnel will be returning to
the APDE from the theater. Repairable spares must be
sorted and routed to the appropriate repair facilities.
5

Wounded personnel will require special attention, such as
medical care at the APOE or transfer to an air evacuation
aircraft. Aircraft returning to the APUE directly from
the theater will also contain full loads of non-combatant
military dependents and U.S. citizens fleeing the hostili-
ties. The APUE must coordinate transportation to commer-
cial terminals and provide food and shelter as required
for these people (10). For some APOEs this could create
excessive workloads simultaneously with maximum deployment
demands.
Mobility processing is accomplished by parent units
for unit assets or by the APOE for non-unit assets; both
must be checked during the APOE reception. The APOE units
must mobility process all on-base cargo and personnel as
well as ensure all off-base cargo and personnel were pro-
perly processed. Mobility processing is achieved through
a time-phased schedule defined by the Mobility Control
Center (MCC), reflecting the best estimates of the time
required to accomplish mobility tasks. The essential
steps in the mobility process include manifesting, selec-
ting and preparing loads, marshalling cargo, processing,
and assembling personnel and cargo at unit assembly
areas, and loading aircraft (18:p.3-1). Some of these
steps will be accomplished prior to entry into the base
reception system; others will not.
Mobility work centers will accomplish the time-phased
6

actions reflected in the mobility schedule spontaneously
rather than by direction of the MCC. Generally each work
center accomplishes a primary task. For example, load
planners coordinate load build-up with the air cargo ter-
minal and the passenger terminal. A controller monitors
mobility activities and reports problems to the MCC. Qua-
lity control personnel audit cargo and passenger manifests
before the scheduled aircraft load time. The Ramp Coordi-
nator monitors cargo marshalling and aircraft loading
operations. The Air Cargo Terminal function receives and
inspects cargo at the cargo marshalling area and checks
for proper preparation and marking, air transportability,
and proper documentation. Equipment is then marshalled by
load number. The Air Passenger Terminal function provides
complete passenger services to prepare and process person-
nel for deployment. These services include passenger
briefings, troop commander briefings, baggage handling,
passenger manifesting, anti-hijacking procedures, and
passenger loading. The Sub-Motor Pool provides vehicles
and drivers to transport deploying personnel to the mobil-
ity processing area, material to the marshalling area, and
passengers to the aircraft load site (18:p.3-3).
PROBLEM STATEMENT
APUE managers presently have no means to integrate
7

OPLAN movement data with reception processing requirements
to determine time-phased workloads for preparation of APOE
reception plans.
JUSTIFICATION
While APOE managers are tasked with planning for and
managing an extremely large, complex, and dynamic system,
many unit level managers do not have the World Wide Mili-
tary Comand and Control System (WWMCCS) Integrated Network
(WIN) capability to access the Joint Operations Planning
System (JOPS) (Appendix B). They also do not have ready
access to MAC or MTMC deployment movement tables. Even
with these movement tables it is nearly impossible to
manually determine workloads for the numerous tasks.
Also, during mobilization the published movement table may
change suddenly. With current capabilities managers have
no way to quickly evaluate the effects of these changes on
their reception system.
The OPLANs are written to deploy only the minimum
essential assets to sustain combat operations during the
initial phases of conflict (20:36), so the APOE must be
prepared to efficiently process all resources identified
on the movement tables. Some APOEs are tasked to deploy
such a large number of units from different commands
simultaneously, that requirements may exceed the capabil-
ity of the installation to receive supporting aircraft, or
8

process and load personnel and equipment to meet departure
times. In those instances the mobility work centers
should be expanded to accomodate the most demanding OPLAN
tasking for that unit (18:p.3-4). Managers know the
estimated total resources scheduled through their APOE;
however, without the timing of that flow they cannot
determine how work centers must be expanded to accomadate
OPLAN tasking.
OBJECTIVE
The objective of this thesis is to create a model of
the APOE base reception process and validate that model so
that it can be used as an effective management tool. The
model should be flexible enough to be used at any APOE and
capable of evaluating present resource levels as well as
generating optimum resource requirements to accomplish
base reception.
A previous thesis attempted to model base reception
(3). Model development was well documented; however, many
assumptions were proposed, and the model was not suffic-
iently validated. Also, that thesis did not tie the
simulation into an existing data base to provide actual
information.
This thesis uses this existing reception model as a
departure point. Our efforts will concentrate on model
accuracy, and building confidence in the simulation
9

results through substantiating assumptions and model
validation. We will establish a means to transfer data
from the TPFDD to a computer system with simulation lan-
guage software. Finally, we will use actual movement data
to generate workload information to demLinstrate model
useful ness.
RESEARCH QUEST IONS
To model base reception four key questions must be
resolved:
1. What are the critical factors representing the
reception process?
2. What are the duration distributions associated
with reception activities?
In order for simulation results to be accepted and
implemented the model must be thoroughly validated. Yet,
wartime simulations possess inherent validation difficul-
ties in that the simulation cannot be compared with exist-
ing real world peacetime operations.
3. What technique will best validate the reception
model?
The final objective of modeling and computer simula-
tion should assist managers in their decision process. The
computer output should clearly demonstrate this attribute.
4. Does the simulation clearly identify critical
shortfalls?
10

SCOPE
This thesis will provide managers a means to develop
alternative reception plans for APOE mobility/deployment
OPLAN taskings or evaluate present plans using the exist-
ing data base. A computer simulation model of the recep-
tion process will generate two types of information.
First, it will determine expected demands for a specific
OPLAN, allowing for the APOE manager to determine work
center adequacy. This information allows for reception
planning and justification for work center expansion as
required by AFR 28-4 (18:p. 3 - 4 ). Second, upon OPLAN
execution, the simulation can be run with actual work
center facilities and expected inputs to anticipate
shortfalls. Managers can then take corrective action
prior to the actual development of a critical shortfall.
This model should be generic to the extent that it
will apply to any APOE. To narrow the range of assump-
tions and to facilitate validation, modeling data will be
collected at Wright-Patterson AFB. The structure of
Wright-Patterson's reception process is similiar to other
APOEs (10), so this model should apply to any APOE with a
minimal change of parameters within the model.
11

CHAPTER SUMMARY
APOE base reception is a critical, but neglected
factor in the mobilization and deployment of U.S. forces.
The complex nature of the reception process, combined with
the variability of processing requirements, arrival times,
and departure times make planning for this system diffi-
cult to accurately accomplish. Because of its vital
importance to military readiness, APOE managers need an
effective management tool to create and evaluate reception
plans. The goal of this thesis is to develop that tool,
prove its accuracy, and demonstrate its usefulness as a
valuable aid in the planning process.
12
CHAPTER 2
METHODOLOGY
In order to provide a useful tool for managers to
successfully meet the requirements of planning a full scale
mobilization, a system of very complex components and
relationships must be understood and evaluated. The problem
of precisely describing such a complex operation calls for a
systems analysis approach (14:6). This analysis provides a
better understanding of the system's operating characteris-
tics. To evaluate the reception system's capabilities and
operation exactly (eg. actually mobilize our forces) would
be very expensive and impractical given the ramifications of
full mobilization in today's political environment. The
analyst must pursue a more reasonable method for under-
standing this complex system.
SYSTEM ANALYSIS
The Rand Corporation (4:6) classifies a spectrum of
systems analysis methods ranging from the least to most
abstract as follows:
1. Real World2. Observations from the real world3. One to one simulation4. Game simulation
13

5. All computer simulation
6. Mathematical analysis.
The "observation" level depends on real world envi-
ronmental factors to validate the observations. While the
U.S. military services do perform mobility exercises, they
are never executed in the crisis environment when all mil-
itary activity would be focused on the mobilization. In
fact normal operations often supersede mobility exercise
operations, thus limiting exercise realism.
One to one and game simulations were developed
largely for training situations and focus on the trainees
and their decisions rather than on the system. Our inter-
est is in an accurate understanding of the system Is charac-
t eristics and operations. Perhaps after a validated and
verified system model is developed, game simulation could
be accomplished by varying the decision rules. This would
provide sensitivity data on certain decisions, but, is
only possible after a validated system model is
achieved.
Mathematical analysis, the most abstract method, is
more applicable to the physical sciences. In our case the
statistical decision theory or linear programing approach:
1. Oversimplifies the complex goals of a largesystem,2. Requires mathematically precise rules whichhave not been discovered,3. Requires impossible-to-obtain information,considering the degree of abstraction 14:73.
Drawbacks and real world limitations of these anal-
14

ysis techniques of the Rand spectrum point to the all
computer simulation approach as the most suitable method
for our purpose.
COMPUTER SIMULATION
Computer simulation is the most important and useful
tool in analyzing the capability and operation of complex
systems (13:1). This method is highly abstract, but still
provides ample flexibility for our purpose. Several
advantages are present:
1. The component to be optimized need not be
specified. In fact, the simulation will identify critical
f actors.
2. Detail and complexity need not be sacrificed to
arrive at a conclusion.
3. Random behavior and time considerations can
readily be incorporated into the model.
The major drawback to this method is the requirement
to specify all relationships between activities and
resources, that is, to provide a decision rule for any
situation Cie. represent the human decision maker). While
expert advice and experience are excellent guides in this
area, it is still recognized as a limitation and sensitiv-
ity analysis must be performed on decision variables to
account for the human factor where such considerations are
required.

While the use of simulation appeals to managers
because of its apparent simplicity and face validity,
several inherent shortcomings must be considered. The
expense in dollars and man-hours to develop and compu-
terize a simulation model must be weighed against the
perceived benefits. Verification, validation, and sensi-
tivity analysis of the model are always required, because
models are prone to inaccuracy, high sensitivity, and
unrealistic representation of the real system (13:13).
Assumptions should be scrutinized and questioned, as well
as techniques for verification, validation, and sensitiv-
ity analysis. Sometimes these shortcomings must be
accepted, because simulation can provide answers to
questions not attainable by other means (eg. war scenar-
ios) (13:12). This study deals with a situation not
readily verifiable in the real world, and some of these
shortcomings are present. More detailed analysis of these
limitations is presented in later chapters.
PROBLEM SOLVING PARADIGM
Robert E. Shannon provides an excellent structure or
problem solving paradigm for our computer simulation
systems analysis.
1. System Definition--Determine the boundries,restrictions and measure of effectiveness to be usedin defining the system to be studied.
2. Model Formulation--Reduction or abstraction
16

of the real system to a logic flow diagram.3. Data Preparation--Identification of the data
needed by the model, and their reduction to anappropriate form.
4. Model Translation--Description of the modelin a language acceptable to the computer to be used.
5. Validation--Increasing to an acceptable levelthe confidence that an inference drawn from the model
about the real system will be correct.6. Strategic Planning--Design of an experiment
that will yield the desired information.7. Tactical Planning--Determination of how ,ach
of the test runs specified in the experimental designis to be executed.
8. Experimentation--Execution of the simulationto generate the desired data and to performsensitivity analysis.
9. Interpretation--Drawing inferences from thedata generated by the simulation.
10. Implementation--Putting the model/or resultsto use [13:23].
Complete, accurate execution of each of these steps
will produce a simulation model that is easy to under-
stand, achieves its purpose, provides reasonable answers,
includes all relevant factors, and provides managers with
a reliable tool to use in planning APOE base reception
activities. The following activities are general guide-
lines for the accomplishment of each step. Readers
familiar with this paradigm may procede to Chapter 3
without loss of continuity.
SYSTEM DEFINITION
This initial step establishes boundries, restric-
tions, and measures of effectiveness. Every system is a
subsystem or element of a larger system, so in order to
establish these factors we must establish an analytical
17
approach to define our system. We will use the General
Systems Theory systems analysis approach and definition to
identify our system. This approach defines a system as
a set of objects together witi relationships betweenthe objects and between their attributes connected orrelated to each other and to their environment insuch a manner as to form an entirety or whole[14:12).
To define our system consistent with this definition we
must first identify the system objects along with their
attributes, and relationships. These objects form a goal
seeking entity distinctly separate from their environment,
yet dependent upon interactions with the environment
(13:25; 12:1).
Open systems receive resources from the environment
as inputs and perform transformations to create outputs.
A complete system definition must determine essential
environmental resources, and the desired system outputs.
All systems must be goal oriented in order to integrate
various system elements toward desired outputs. The
degree of goal achievement determines system effectiveness
and efficiency (13:26).
With these concepts the boundary separating the system
from the environment can be determined. Elements and
relationships within the boundary are considered control-
lable by the system while elements outside the boundary
represent environmental factors and may influence the
system but are not directly controllable by the system.
18

The initial modeling effort should concentrate on the
controllable system elements and relationships (13:27).
MODEL FORMULATION
The simulation effort implies a perceived problem in
system operation. The modeler's first task must center
around an accurate and concise formulation of the per-
ceived problem. An accurate statement of the problem
begins with desired goals. These goals bound the system
by identifying desired outputs, thus defining relevant
elements and inputs. Problem formulation should concen-
trate on examining all these bounded elements to determine
their attributes and relationships. This examination
should identify the critical attributes and relationships.
This represents the most important step in model defini-
tion for it allows the modeler to eliminate insignificant
elements and relationships. Often simply identifying the
critical components will identify the causes of the prob-
lem. If further anialysis is required, it can concentrate
on critical components for model formulation
(13:27,12:11).
Once the modeler has defined and limited the system
to critical components he must acquire a thorough under-
standing of how the system is supposed to operate, as well
as how it actually operates. In this stage he must ob-
serve, participate, interview, and examine documentation,
19

always questioning the validity of the facts (13:45). The
progressive development of a graphical representation of
the system may facilitate this process and begins the
actual model development (13:46).
With increased understanding of the system and the
formulation of a structural model, the modeler must incor-
porate all relevant variables. Variables can be divided
into four groups. Endogenous variables represent factors
within the system and which are under system control.
Exogenous variables are necessary inputs from the environ-
ment. They have direct influence on the system but cannot
be directly controlled. Status variables change with
system operation; therefore, they represent the current
state of the system. Finally, the criterion variable
represents the system objective or goal. It is the final
measure to determine system effectiveness (13:15-16).
The structural model along with all variables repre-
sents the working model for development of the simula-
tion. A model flowchart should be prepared at this
stage. The flowchart has the advantage of a graphical
representation of component relationships along with
relevant variables. The flowchart also prepares the model
for the computerization step (13:151).
The modeler must be aware that the structural model
is never complete and final. As he continues his system
investigation and data collection new relationships and
20

variables will become apparent (12:11-12). The intial
working model should be simplified to include only the
relevant critical components and modified as system defi-
nition dictates (13:26).
DATA PREPARATION
The model formulation identified four types of
variables important in the model. Endogenous and cri-
terion variables are internal to the system and can be
specified for the simulation. Status variables result
from system operation. Exogenous variables represent a
problem in that their values must be estimated or gener-
ated, and then input into the simulation. This process is
a critical step in the system' s analysis as it lays the
Foundation for further model evaluation (13:28).
There are several methods to generate exogenous
variables. These values may be hypothesized based on the
initial system analysis and model formulation and then
reviewed by individuals familiar with system operations to
substantiate variable value validity. A second method
involves reviewing system records for required data. This
method is dependent on availability of accurate records
containing the required information. A final technique
requires actual field collection of the data. This tech-
nique is most expensive and time consuming but results in
the most accurate estimation of the exogenous variables
21

(13:28; 12:43-44).
Once the exogenous variable data are collected they
can be applied two ways. First, the actual historical
data can be input into the simulation and various endo-
genous variable combinations tested against thes data.
This will indicate the best solution under historical
conditions. A second approach requires analysis of the
historical data to determine representative distribu-
tions. rhese representative distributions can then
produce new exogenous values representative of the histo-
rical data. This technique allows various endogenous
variables to be tested against possible future events
(13:27-28).
The second technique allows more flexibility;
however, it requires more effort and caution to validate
the inputs. The first step in this process requires
analysis of the historical data. The data should be
plotted on a histogram, fitted to a curve, and statis-
tically analyzed to identify characteristic paramenters. A
representative distribution can then be hypothesized and a
Chi-square Uoodness of Fit statistical analysis per-
formed to confirm the hypothesized distribution (12:48).
Once the distribution is confirmed a computer program can
be written which will generate samples conforming to this
distribution. Monte-Carlo sampling will randomly extract
variates from this distribution for input into the simu-
22

lation (13:65). Before running the Monte-Carlo simulation
the distribution should be tested by drawing a variate
sample and performing a Chi-square Goodness of Fit or
Kolmogorov-Smirnov statistical analysis to confirm the
sample represents the original historical distribution
(12:48). Depending on the importance of the variable in
the simulation other statistical tests for autocorrelation
and variate randomness should be performed before accept-
ing the Monte-Carlo variates (13:355-356).
MODEL TRANSLATION
In this step the working model must be translated to
a computer language. Many different simulation oriented
computer languages have been developed to aid the simu-
lator in computerization. The appropriate language depends
on the nature of the model, the purpose of the simulation,
and the type of computer (13:28,98,12:12).
Common model orientations include network, event, or
structure. Q-Gert and SLAM languages are network orien-
tated (12:445). In these languages the modeler formulates
the system as an interconnected network of activities and
decision points. Entities or transactions then flow
through the network activities and decision points.
SIMSCRIPT is primarily an event oriented language
(12:451). In this language the model is defined by enti-
23

ties, attributes and logical groupings of entities. The
language monitors the system's changing structure at spe-
cific event times. DYNAMO is an example of a structural
language. It was developed by Forrester to analyze complex
problems relating to system dynamics. This language
monitors non- linear system state or structure variables
represented by levels (12:461).
The purpose of the simulation dictates a discrete or
continuous computer model. Discrete or continuous refers to
the incrementation on the independent variable, "time"
within the simulation. Discrete simulation advances time
discretely at specified points (12:65). The time advance
can be either continuous fixed interval advances, or dis-
crete variable event oriented advances. The dependent
variables change only when the time advances. A discrete
simulation applies to event oriented problems. GASP,
Q-Gert, and SIMSCRIPT are discrete languages. In contin-
uous simulations fhe dependent variable changes contin-
uously over time. Continuous simulations use partial
derivitives to specify system states and originally applied
to analog computers for population analysin and for process
state analysis. Modern high sperd digital -omputers and
newer languages such as SLAM have developed integration
algorithms which allow digital computers to approximate
continuous simulations (12:71).
The selection of a language for a simulation is
24

dependent on the model, simulation purpose, type of
computer, and software availability. Commonly available
languages in DoD include SIMSCRIPT II, Q-Gert, and SLAM II
(9).
VALIDATION
The validation step increases confidence in the
simulation output. It shows that the simulation
satisfactorily represents the real world, thereby giving
management more confidence to implement the results.
The validation process consists of two steps, veri-
fication and validation. Verification confirms that the
computer model is performing as the original working model
intended. All models can and must be verified. Valida-
tion reviews the concepts, assumptions, and restrictions
of the original working model to affirm they represent the
original system. Validation reflects an inherent weakness
of simulation. Simulation is most directly applicable to
systems which cannot be measured directly. Therefore,
direct measurement of, or experimentation with the actual
system for comparison is impossible (13:30;12:12).
Three commonly accepted techniques for verification
are hand duplication of a computer run, trace statements,
and canned data. Hand duplication is a time consuming
procedure, but it allows the values of each variable to be
calculated to confirm that the logic in the computeriza-
25

tion follows the working model logic. This technique is
applicable only to simple simulations. A second technique
places trace statements throughout the computer program to
print out critical variables. This allows the computer to
do the time consuming calculations, and then the variables
can be analyzed to confirm the logic is valid. Finally,
canned inputs with predetermined results can be run to
verify that the computer output agrees with the antici-
pated results. This technique must input data which exer-
cises all subroutines in the program. To do so usually
requires several runs with data representing mean values and
values to each extreme (13:30,12:12-13).
Simulation models cannot be measured directly for
validity so several philosophies have evolved for accept-
able techniques. Rationalists, closely associated with
mathematics and logic, theorize that one must accept
fundamental basic unproven premises from which the rest of
the model can be logically developed. The problem with this
approach is the unquestioned acceptance of the basic
premises (13:212). Empiricists represent the opposite
extreme and will not accept any premise without experi-
mental evidence (13:214). Simulation techniques can be
proven empirically; however, system model formulation or
simulation application cannot be validated experimently.
Pragmatists are not concerned with the actual validity of
the model. Instead, they concentrate on model usefulness
26

in a predictive nature. Do inputs accurately predict out-
puts? The problem with this approach is that the model
cannot be evaluated until after implementation to deter-
mine prediction accuracy (13-:214).
The final philosophy, the utilitarian approach.
combines the three previous philosophies (13:215). Utili-
tarian validation is a realistic progressive means to
evaluate the working model. First the model is ex-
pressed in mathematically logical terms using fundam~eotal
system knowledge for basic premises. Next the simulation
is experimentally tested within the range of available
limits. Finally, the predictive nature of the model is
demonstrated by comparing the model to the real world
wherever possible. The simulator should combine the three
techniques of model logic, experimentation, and real world
comparisons to convince management that the model repre-
sents the real world4 (13:215-217). Once managemnt accepts
the model's validity, they should accept the simulation
results and support subsequent implementation.
STRATEGIC PLANNING
Strategic planning pertains to developing the exper-
imental design which will best identify relationships
between the independent variables and the dependent
variable. Experimential design for a simulation is
subject to the same constraints and statistical analysis
27

as a true physical scientific experiment. However,
simulation allows the experimenter increased control over
independent variables and experimental conditions. In
simulation the experimenter can reduce spurious experi-
mental variance by testing different treatments under
identical conditions to determine the best solution
(13:30).
Shannon (13:151) proposes a three step process to
experimental design. First, develop the structural model,
then identify the functional model, and finally, design
the experimental model.
The structural model consists of the desired inde-
pendent variables and the number of treatment levels for
each variable. The objectives of the experiment, measur-
ability of the factors, and nonlinear effects should
determine the required factors and levels. The number of
different experimental treaitments required is exponen-
tially related to the number of factors and levels. In
the structural model the experimenter should not limit
factors or levels to conform to resource constraints
(13:155). The structural model reflects the ideal
experiment.
The functional model determines how many of the
treatments will actually be measured. A complete
functional model measures each treatment thus duplicating
the desired structural model, while an incomplete func-
28

tional model measures only a portion of the treatments.
Usually labor, money, or computer time limits the simula-
tion effort, so an incomplete functional model must be
adopted. To derive the best incomplete functional model
the experimenter should analyze the system and working
model to eliminate logically infeasible treatments. The
functional model reflects the actual practical experiment
(13: 155).
The experimental model determines how the experi-
mental results will be statistically analyzed. The exper-
imental design may be concerned with determining the means
and variances of different alternatives, effects of dif-
ferent variables, or optimal values for the variables.
Each purpose of the simulation requires a different type
of statistical analysis and a different experimental ap-
proach. The experimental model will determine the number
of simulation repetitions for each treatment (sample size)
required for significant statistical analysis (12:498).
The strategic planning process determines which
endogenous variables and associated values should be
examined in the simulation. Additionally, the required
statistical tests are identified and appropriate sample
size calculated to obtain statistically significant
results (13:30-31).
29

TACTICAL PLANNING
Tactical planning investigates the proper experi-
mental data collection procedure to reduce simulation
induced variance. Reduction of this variance strengthens
the experimental design developed during strategic plan-
ning and increases the statistical significance of the
independent/dependent variable relationship (13:31).
The majority of simulation induced variance results
from start up transients (13:181). Generally the simu-
lated system is an ongoing steady state process with
inputs at various stages of processing. The simulation
cannot start in a steady state, so the initial data will
be erroneous when compared to the real world. Running the
simulation for a long enough period to cause the intial
data to be insignificant compared to the steady state data
reduces start up variance; however, this solution is often
prohibitive due to excessive requirements for computer
time (13:181). A second solution discards the initial
data and analyzes only the steady state data. This solu-
tion must determine when the simulation reaches steady
state in order to begin data collection (13:181). One
common technique calculates a moving average of the
simulation data. When the third order moving average
changes less than 2%. equilibrium can be assumed (2).
Most statistical testing of simulation results
assumes independent and uncorrelated samples (13:187).
30

This may be a faulty assumption because simulation often
produces autocorrelated data. Autocorrelated data implies
the previous results influence the present or future re-
sults. If the simulation data is collected through time
the output should be analyzed for autocorrelation. If
autocorrelation exists the experimenter has several op-
tions. He can determine the factor causing the autocor-
relation and include it in the functional model as a
factor; or, he can take a larger sample size to reduce the
significance of the autocorrelation. Finally, he can
randomly introduce dead spaces in the simulatior where no
data is collected to reduce autocorrelation. The larger
sample or simulation dead space will increase computer
time and must be considered when designing the functional
model (2;13:187).
EXPERIMENTATION
In this step the simulation is run and the output
data are collected. The data should then be statistically
analyzed to determine the factors producing the optimum
criterion variable. This optimum answer reflects the
assumed and measured distributions introduced as exogenous
variable inputs. These experimental inputs may vary from
the real world, so before the optimum solution can be
positively selected, its sensitivity to exogenous variable
inputs must be determined (13:32;12:13).
31

Sensitivity analysis increases confidence in the
simulation results. For this process the exogenous vari-
able distributions and original data collection techniques
must be reviewed. If the validity of a distribution is
questionable the distribution parameters should be
increased or decreased one at a time to determine the
effects on the criterion variable. If the optimal
solution does not change as the exogenous variables are
adjusted, the experimentor can be more confident with the
simulation solution (13:32).
INTERPRETATION
By this step the simulation is complete. For
nonsensitive optimal solutions, interpretation is simple;
management can accept the simulation solution with a
relative high degree of confidence.
If the optimal solution changes when the initial
experimental data are modified, then the results are
sensitive to inputs, eliminating a clearcut optimum solu-
tion. For a sensitive solution management must select
from the 1-*3st solutions or revalidate the sensitive input
variables to reconfirm the simulation's original optimum
solution. For sensitive solutions the difference in cost
between the optimal solutions will indicate to management
the value of better information to revalidate the exoge-
nous variables (13:31;12:13).
32
I MPLEMEN TAT ION
In this stage the simulator's responsibility centers
around proper documentation and briefings so that manage-
mnent has a thorough understanding of the simulation pro-
cess. A thorough accomplishment of the previous nine
steps should provide a good projection of the real world,
allowing management to accept and implement the findings
with confidence (13:32- 33; 12: 13).
CHAPTER SUMMARY
Computer simulation is the best method to accomplish
the systems analysis of the APOE reception process and
provide a tool for evaluation and planning. This approach
ensures accurate and flexible representation of the system
and can be accomplished using Shannon's ten step problem
solving paradigm (12:23). Detailed application of the
paradigm to APUJE reception follows in Chapter 3.
33

CHAPTER 3
MODEL APPLICATION
The general aspects of base reception covered in
Chapter I were fitted to the problem solving paradigm
described in Chapter 2. The system description was ex-
panded, resulting in a model of APOE base reception. This
model was then further processed through the steps on the
paradigm and resulted in a useful planning and evaluation
tool for APOE reception managers.
Because APOE reception is comprised of similar tasks
at all reception bases, a specific model for the Wright-
Patterson AFB (WPAFB) reception function can be used as a
basis for models of other APOEs (10). The first and most
critical step in developing the WPAFB model and using it
as a planning tool was system definition (13:90).
SYSTEM DEFINITION
During mobilization, reception will be only one of
the many functions being performed at WPAFB. The recep-
tion activities, however, will have priority (7).
Research, experimentation, procurement, and other usual
base functions will have minimal direct impact on the
mobility effort and are not included in this model. Some
34

of the reception activities described in Chapter I do not
directly affect the APOE's ability to mobilize cargo and
personnel, so they too are not considered in this model.
Other factors, such as retrograde cargo or specific
aircraft load planning, have not been estimated by the
planning community, so are not included in this model.
The goal of the reception effort is to receive and
process cargo and personnel for shipment on-time to the
crisis area. Our system is confined to those factors
directly relevant to personnel and cargo being received
and processed for on-time departures. The initial system
boundary is the arrival point where cargo and personnel
are received and directed to their next stop within the
system. At WPAFB this boundary is the reception gate.
The outbound limit of the reception system is either the
marshalling area boundary where cargo is loaded onto
K-loaders to be put on aircraft, or the passenger terminal
where personnel depart the system to be loaded on air-
craft. K-loader and passenger loading operations, while
potentially of interest to the total war effort, are not
considered part of base reception cargo preparation (10).
This system incorporates the reception personnel and
resources anticipated to be available. Available resources
include resources on hand as well as resources planned to
move to WPAFB to assist in reception (eg. augmentation
personnel). The system inputs are the personnel and cargo
35
requiring processing. The outputs are passengers ready to
be loaded on aircraft, and cargo properly palletized for
air shipment and ready to load on aircraft.
The restrictions on our system are imposed by TPFDD
requirements, operating pol icy/regulations, and safety
regulations. The local politics concerning where to
locate certain functions (passenger terminal, marshalling
area, explosive cargo area, etc. ) can also impose
restrictions (7).
A successful reception system prepares an acceptable
percentage of cargo and personnel for timely transport
(1;7;10). This percentage can be used as a measure of
system effectiveness, and its desired value must be set by
system managers. This model will aid managers by allowing
them to adjust individual controllable variables to eval-
uate their effect on the entire system.
MODEL FORMULATION
Within these boundaries and restrictions a more de-
tailed description of the reception process at WPAFB was
pursued. A graphic model (Appendix C) was created to
identify system elements, attributes, and relationships.
Only the critical elements were retained in the model.
For WPAFB, exogenous variables (outside system control)
include the amounts of cargo and personnel arriving, their
36

arrival times, processing and transportation times, and
the weather. Endogenous variables (within system control)
are the number of people available to process the arri-
vals, the amount of space provided for processing and
storing the arrivals, and the equipment needed to process
the arrivals (forklifts, buses,etc.). Status variables
are the number of people billeted, people waiting for/or
in processing, pallets in the marshalling area, and the
amount of cargo awaiting various processing steps. The
criterion variable (system evaluation) is the percentage
of inputs processed for departure on-time. The relation-
ships of these variables can best be described by consi-
dering the two types of arrivals (personnel or cargo)
separately.
PERSONNEL RECEPTION
Arriving personnel will fall into three categories:
non-deploying augmentees, unit related personnel, and
non-unit related personnel. Arriving personnel are trans-
ported, processed, billeted, and fed in terms of a Force
Requirement Number (FRN). A FRN may be one person or 500
people. Part of a FRN may be transported within the sys-
tem, but, only complete FRN's are processed (briefed,
etc.), and the entire FRN must be processed before it will
depart the sytem.
All personnel will be directed to arrive at gate 26C
for reception (11). At the reception point mobility
37

personnel will direct the arrivals to their next stop.
Augmentee personnel will be directed to non-temporary
quarters and from there exit the reception sytem.
FRNs departing within 18 hours will proceed directly
to the passenger staging or holding area (11). Many FRNs
will have their own vehicles which they can use for trans-
portation to the staging area. After the personnel are in
the staging area the vehicles will be driven to the vehi-
cle processing area and be prepared for air shipment (7).
If the deploying FRN does not have its own vehicles, the
personnel must await bus transportation and then move in
groups of up to 40 to the passenger staging area.
FRNs departing in more than 18 hours will proceed to
billeting either by their own transportation or via base
bus as described above. Billeting may be assigned in VOQ
facilities (Area A), the Kittyhawk Area, or downtown
(within 10 miles of the base) (11). If the FRN requires
feeding, personnel will eat in the billeting area. Rather
than move people to messing facitlites, hot lunches or box
lunches will be prepared in central messing facilities and
then distributed to billeting areas as required. Approx-
imately eight hours prior to departu, the FRN will leave
billeting and proceed to the passenger staging area. This
allows ample time to transport personnel using unit vehi-
cles and still begin processing those vehicles six hours
before departure . All deploying vehicles should begin
38

processing at least six hours prior to departure (7;11).
Once a FRN departs the reception point, the mobility
person directing the FRN (the inchecker) is free to assist
another FRN. One inchecker is required for each FRN.
Unit related personnel deploying from on-base units will
not require an inchecker and will enter the reception
system directly at passenger staging.
Distribution of one box lunch per person and final
troop commander briefings are accomplished at passenger
staging. From there, FRNs will move either by foot or bus
to the passenger terminal. One passenger agent per FRN
will deliver final passenger briefings and distribute
another box lunch for the flight. After final passenger
processing 60% of the FRNs will walk to the aircraft while
40% will require buses (7). The passenger agent will be
free to assist another FRN once his FRN departs to be
loaded on the aircraft. Upon arriving at the aircraft the
FRN departs the reception system.
First-in-first-out (FIFO) priority is used for all
personnel processing and transportation through passenger
staging. Beyond this point the FRN with the earliest
departure time receives priority over other FRNs (11).
CARGO RECEPTION
Arriving cargo is separated into the categories of
unit related (vehicular and non-vehicular), non-unit
related, and explosive. Unit related vehicles must be
39

delivered to processing at least six hours before depar-
ture (7;11). Unit cargo and vehicles will arrive at Gate
26C and be directed for processing by a cargo agent at the
reception point. Vehicles will need washing and/or pro-
cessing. Those requiring both washing and processing will
first be washed then proceed to the processing area.
After processing the vehicles will be parked awaiting
joint inspection by the shipper, APOE personnel, and the
aircrew. Vehicles that pass this inspection are parked in
the marshalling area awaiting loading onto an aircraft.
Vehicles that fail this inspection can fail because of
improper washing or processing, and will be rerouted to
correct the deficiency.
Unit related cargo will arrive palletized for air
shipment (10). Pallets with discrepancies discovered
during incheck will be sent to the frustrated cargo area
for rework. Acceptable cargo will be routed to the
marshalling area, unloaded by forklift and inspected by
the joint inspection team. Cargo that passes inspection
will await loading onto an aircraft. Cargo that fails
inspection will be routed to the frustrated cargo area for
correction of deviations. This cargo will then be rein-
spected and if satisfactory be marshallled to await
loading (11).
Non-unit related cargo will be input into the system
from either on-base or off-base sources. Off-base non-
40

unit cargo will arrive on wooden pallets and will need
preparation for airlift (10). It will be received by a
cargo agent who examines the paperwork for completeness
and determines its destination and time of departure. The
cargo is then routed to the unloading/palletizing area.
At WPAFB this cargo (as well as explosive cargo) will
arrive on flatbed trucks (7). The TPFDD measures this
cargo in tons. For modeling purposes all cargo is divided
by 1.7 tons (average weight of a pallet) (22) and proces-
sed as individual pallet loads. On-base non-unit cargo
will not be received through the freight channels.
Rather, this cargo will be sent directly to the unloading
area for palletization.
After unloading, non-unit cargo is palletized by Air
Force crews with continuous inspection by both quality
control personnel and one supervisor for every three crews
(2-2). Pallets are then moved by forklift to the marshal-
ling area to await loading onto an aircraft.
Explosive cargo is the most restrictive input to the
reception process. Special routing for trucks carrying
this cargo is required. Explosive cargo will arrive at
gate 26C by prior arrangement with the shippers (7). The
mobility representative at that gate will direct the
drivers to the explosive area near Taxiway 12 via an
approved route, separate from other APOE activity and
other base functions. At the explosives area the cargo
41

will be unloaded and palletized by Air Force crews as
above. Pallets will then await loading onto aircraft.
All cargo will be processed with a priority deter-
mined by earliest departure time first. A cargo item that
has begun a phase of processing (ie. palletizing, washing,
etc.) will not be interrupted for new arrivals with ear-
lier departure times. These arrivals, however, will be
ordered in the queue with the earliest departing first.
Most APOE activity will be conducted on the west side
of WPAFB. Passenger processing and staging; unit and
non-unit cargo processing, inspection, and marshalling;
and vehicle processing, inspection, and marshalling will
be conducted in the area adjacent to or in buildings 4022,
4024, 4026, and 40283 (7). The location of these functions
determines the transit times between the various activi-
ties described above.
DATA PREPARATION
The values for the variables listed below have been
collected from interviews of mobility experts, actual
field measurements, and other sources as indicated.
Variables common to all APOE locations are expressed as
Uniform distributions (minimum value, maximum value) or
Triangular distributions (minimum value, most likely
value, maximum value). The type of distribution with the
parameters indicated in parenthesies determine the vani-
42

able value. Expressing these common variables (eg.pro-
cessing times) this way provides greater realism (13:68)
and a basis for comparison amoung various APOE bases.
Base specific variables like transportation times were
determined by actually driving the routes described or by
expert estimates of their true value (1;7;8;10;11). These
variables are represented by average times. Using distri-
butions rather than average values for base-specific vari-
ables would make the model much more difficult to apply to
different APOEs. In the interest of simplifying the model
application base-specific distributions are not used.
The following four categories of variables and their
values are required to use this model. The source of the
value is indicated in parenthesies, where (FS) indicates
field study values and (EST) indicates values estimated by
the authors in consultation with others. All triangular
distribtuion parameters are in minutes.
EXOGENOUS VARIABLES
The weather
Flight time to destination plus clock time change.
Amount of cargo arriving--Extracted fromrepresentative TPFDD data created for modelvalidation and experimentation (Appendix F).
Number of people arriving--Extracted fromrepresentative TPFDD data created for modelvalidation and experimentation (Appendix F).
Arrival time of personnel and cargo--Drawn from auniform (earliest allowable, latest allowable)
43

distribution. The earliest and latest times are
based on the available to load date (ALD). The timeof arrival is randomly selected from this 24 hourwindow.
Departure time of personnel and cargo--Drawn from auniform (earliest possible, latest allowable)distribution. The earliest possible departure iseither the earliest time to allow arrival at 0000hours on the TPFDD earliest arrival date (EAD) or theactual arrival time plus a minimum processing time.For personnel the minimum processing time is sixhours (7; 11). For cargo the minimum processing timeis either six hours or two minutes per ton, whicheveris greater (7; 11). The latest allowable time isthe latest that the resource can depart the reception
system and still arrive at the destination by 2400hours on the latest arrival date (LAD).
Minimum possible time to prepare an FRN--6 hours (7;11).
Percentage of units with own transportation--50% (7).
Transit time from reception point to:Passenger staging--3 minutes (FS)Billeting at VOQ--I0 minutes tFS)Billeting at Kittyhawk--12 minutes (FS)Billeting at Commercial Hotels--20 minutes (EST).
Earliest time an FRN may report to passengerstaging--8 hours (7).
Waiting time after dispatching for bus transportationto reach the pick up point--Drawn from a triangular(0,10,15) (EST) distribution.. The three parametersrepresent the shortest, most likely, and longesttimes. A bus may be atthe pickup point so therewould be no waiting. Fifteen minutes is the longestit could take to arrive and ten minutes is the mostlikely.
Reception point inchecker processing time--Drawn from
a triangular (15,30,60) distribution (7).
Transit time to passenger staging from:VOQ--13 minutes (FS)Kittyhawk--15 minutes (FS)Commercial Hotels--20 minutes (EST).
Processing time at passenger staging--Drawn from a
triangular (30,45,60) distribution (7).
44

Transit time from passenger staging to the passengerterminal--2 minutes (FS).
Transit time from the mobility line to passengerstaging--30 minutes (EST)
Processing time at the passenger terminal--30 secondsper passenger plus 10 minutes per FRN (7).
Percentage of aircraft parking spaces within walkingdistance of the passenger terminal--60% (7).
Transit time from the passenger terminal to theaircraft by walking--15 minutes (EST).
Transit time from the passenger terminal to theaircraft by bus--20 minutes (EST).
Cargo agent processing time per pallet--Drawn from a
triangular (6,10,20) distribution (7).
Average weight of a vehicle--2.0 tons (EST)
Transit time to washrack from:Reception point-3 minutes (FS)Passenger staging--2 minutes (FS).
Percentage of vehicles that need washing--75% (1;7;11)
Processing time at washrack--Drawn from a triangular(10,15,30) distribution (7).
Transit time to vehicle processing from:Reception point--2 minutes (FS)Passenger staging--2 minutes (FS)Washrack--2 minutes (FS).
Processing time at vehicle processing--Drawn from atriangular (10,15,20) distribution (7).
Transit time from processing to vehicle parking--3
minutes (FS).
Vehicle joint inspection time--Drawn from atriangular (10,15,20) distribution (7).
Percentage of vehicles that fail joint inspection--4%(7), 20% (1;11).
Percentage of failed vehicles failing jointinspection due to processing--25% (1;7;11).
45

Transit time from vehicle inspection to washrack--2
minutes (FS).
Transit time from vehicle inspection to processing--3
minutes (EST).
Transit time to palletizing area from receptionpoint--3 minutes (FS).
Percentage of unit pallets that fail incheckinspection--50% (1; 11).
Percentage of unit pallets that fail jointinspection--4% (1; 7; 11).
Transit time to marshalling area from receptionpoint--2 minutes (FS).
Time to inprocess non-unit cargo--Drawn from atriangular (5,7,15) distribution (7).
Time to unload a pallet from a truck--8 minutes (22).
Time to build/inspect a pallet--Drawn from atriangular (30,45,60) distribution (7; 11).
Transit time from palletizing area to marshalling--3
minutes (FS).
Time to load a pallet on a K-loader--Drawn from atriangular distribution (.6,1,3.) (7).
Average weight of a pallet--1.7 tons (22).
Transit time from marshalling area to frustratedcargo area--3 minutes (FS).
Processing time at frustrated cargo area--Drawn from
a triangular (15,60,120) distribution (7).
Transit time from reception point to explosive cargoarea--6O minutes (FS).
Time to unload a pallet of explosives cargo from atruck--Drawn from a triangular (10,12,15)distribution (7).
Time to palletize explosives--Drawn from a triangular(45,60,90) distribution (7).
Average weight of an explosive cargo pallet--4 tons (7).
46

ENDOGENOUS VARIABLES
Number of reception point incheckers--3 (7).
Number of reception point cargo agents--3 (7).
Number of non-unit cargo agents--4 (EST)
Number of passenger agents--9 (22).
Number of unloading crews--b, divided between cargo
and explosives (22).
Time before departure that unit vehicles must beturned in for processing--b hours (7).
Number of palletizing crews--26, divided betweencargo and explosives (22).
Number of washracks--2 (11)
Number of forklifts--Unlimited, divided betweenmarshalling area, explosive area, cargo terminalarea, and palletizing crews (8;11).
Number of buses--23 (11).
Minimum time before departure to justifybilleting--18 hours (1;11).
Number of beds available at:VOQ--490 (11)Kittyhawk--227 (11)Commercial motels--705 (11).
Feeding capacity--4950 meals/shift (11).
Space at reception point--Unlimited (11).
Space at passenger terminal--2000 people (11).
Space at palletizing area--Unlimited (11).
Space at marshalling area--Unlimited (11).
Space at explosive processing/marshallingarea--Unlimited (7).
Time before reception system departure to loadpallets on a K-loader or move vehicles to theaircraft--1.0 hours (7)
47

STATUS VARIABLES
Status variables change as the system operates; their
values are determined by the system. Such variables as
numbers of people awaiting transportation, or cargo
awaiting processing resources are indicators of system
bottlenecks. These variables can be evaluated to improve
effectiveness as measured by the criterion variable.
CRITERION VARIABLE
The criterion variable is the percentage of people,
or the percentage of cargo, prepared on time for shipment.
The minimum acceptable target value of this variable is
determined by the system managers and compared to the
simulation value to determine system effectiveness. For
this thesis 95% of the cargo and 100% uaf the personnel
prepared on-time were selected as minimum acceptable cri-
terion values. These high values reflect the critical
nature of force deployments during a crisis.
ASSUMPTIONS
Mobility/OPLAN operations and requirements takepriority over all other base activity (1; 11).
All work centers will operate 24 hours per day, 7days per week (22).
Cargo and personnel will arrive primarily by truck orbus (22).
Operations will occur in all types of weather (22).
All non-unit cargo will require palletization for air
48

transport (10).
Load planning will be accomplished simultaneouslywith other reception activity and will be completedprior to departure from the reception system (7).
Sufficient K-loaders will be available to handleaircraft loading without inducing reception systemdelays.
MODEL TRANSLATION
Simulation Language for Alternative Modeling (SLAM)
was selected for computerization of the reception model.
Because the arrivals and departures during OPLAN execution
must fall within not-earlier-than and not-later-than li-
mits, these events must be scheduled. Once assets arrive,
they must flow through a process of varying activity best
represented by a network. SLAM's capability to combine
network modeling with discrete event scheduling allows the
required flexibility for this model (12:402-403). The
subroutine options available with SLAM also provide addi-
tional programing flexibility and thus additional model
realism (12:231).
For this study, the SLAM model consisted of a main
program, event subroutines, user function subroutines,
allocation subroutines, and the network. The main program
allows the SLAM internal pointer arrays (NSET and QSET) to
be dimensioned to entity attributes and anticipated net-
work activity. Entity monitoring in this model requires
nine attributes (eg. arrival time, departure time, amount
49

of cargo, number of people, etc:, associated with the FRN)
for each entity traveling through the network. Each en-
tity represents a FRN of people, or one pallet of cargo,
or one piece of rolling stock. The SLAM program adds four
internal attributes to each entity, so each modeled act-
ivity requires 13 memory locations in NSET and QSET. The
ASD Cyber will accept AFIT batch jobs requiring up to
350,000 fields of core memory. The SLAM language and the
model code required approximately 200,000 fields of mem-
ory. An analysis of TPFDD data indicated that during some
periods the system may be processing between 4000 and 4500
simultaneous entities. NSET and OSET were dimensioned to
70,000 each, which allows up to 5000 simultaneous enti-
ties. With this dimensioning total core requirements are
approximatly 335,000 fields.
The event subroutine initially reads the input data,
establishes entity attributes, and builds the event file.
During the simulation this subroutine monitors the sche-
duled events and sends them to the network at the appro-
priate time.
The network portion models the various reception
activities calling on user functions to determine certain
variable values (eg. drawing random samples from distri-
butions). Allocation and event subroutines are also
called to assign and free resources (eg. buses).
The original graphic model (Appendix C) evolved into
50

a SLAM flowchart (Appendix D). From the SLAM flowchart,
the simulation model was coded into the SLAM language
(Appendix E). A list of variables and resources used in
the model is included in the computer code (Appendix E)
and explained in the User's Manual (Appendix I).
VALIDATION
A utilitarian model validation was accomplished in a
three step (validate, verify, validate) process. Initial
validation of the working model consisted of detailed
briefings and discussions with mobility experts from
transportation, mobility planning, and AFLC War Plans
Divisions. After constructing the Integrated Computer-
Aided Manufacturing Definition Method (IDEF) and SLAM
flowchart models, as well as collecting values for the
resources and variables mentioned above, step by step
progress through the network was brief ied to each of the
above agencies. Each briefing included thorough discus-
sions about the model assumptions, resource and variable
values, and the network chain of events. Where initial
errors were made, the model was adjusted to incorporate
the correct value. General agreement was reached by all
agencies that the model was an accurate representation of
the present WPAFB mobility plan and the resources and
variables noted were accurate estimates of available
assets (1;7;10).
51

Model verification was achieved through the use of
user generated input data, SLAM nodal tracing, and user
written "debug" statements. User generated data were
designed to exercise each path of the network and the
output was analyzed to ensure the program's accuracy.
SLAM nodal tracing provided information showing the
time of arrival and releases at each node along with
selected entity attributes. Analysis of each node arrival
and release assured that entities were flowing through the
network properly.
The user written "debug" statements were employed to
verify the Fortran code used in user functions, event,
allocation, and output subroutines. The "debug" state-
ments returned all the user function distribution values
as well as other critical activity traces. All routines
were verified to be working as intended. The user func-
tions used SLAM routines to generate random numbers and
Monte Carlo deviates. Since the Cyber random number gen-
erator and SLAM distribution subroutines have been previ-
ously evaluated for Goodness of Fit (2), the generated
variables were not retested for distribution conformity.
From these analyses we concluded the computer code was
operating exactly as the model was designed.
Final validation was accomplished through a process
very similar to inital validation. Base and MAJCOM level
briefings and discussions were again conducted; however,
52

the emphasis of these briefings was on model output rather
than model mechanics. Various output from runs of the
model were analyzed and questioned for accuracy in rela-
tion to "real world" mobility reception. The results of
this analysis are more thoroughly covered in Chapter 4 and
Volume II. All managers agreed that the model and its
results were accurate representations of the WPAFB system
and its expected capability (1;7;10).
STRATEGIC PLANNING
Shannon's 3-step development of the experimental
design was used to accomplish the simulation experiment
(13:151). The structural model (the ideal experiment)
consists of 26 quantitative factors (essential resources)
that could be examined at many different levels. The
interaction of these factors determined the information
desired from the model: the percentage of people prepared
for deployment on-time, and the percentage of cargo pre-
pared for deployment on time. Ideally the most accurate
information about the reception system would be provided
by varying each factor individually at many levels.
However, computer time constraints limited the number of
factors and levels actually examined. For example, if the
reception model was run at only 2 levels for each factor,
2zor 266,435,000 separate cells or experiments would
be required (13:155). Each cell requires a number of
53

simulation repetitions for statistical confidence. For
this model with hypothetical data, each simulation repeti-
tion required approximately 66 seconds of Cyber CPU execu-
tion time. This extremely large amount of computer time
required greatly limited full factorial experimentation.
To overcome the large number of computer runs
indicated by the structural model, the number of levels
considered for each factor was reduced in the functional
model. To develop the functional model the experiment
began at one level for each factor. To fix the proper
level for each factor expert estimates of resource avail-
ablity presented in the data section were used. The
levels represent actual resources available, so they
represent management's greatest concern.
An initial simulation of ten runs at the estimated
levels for all resources was accomplished. The results of
this simulation were then analyzed and bottlenecks (areas
of insdfficient resources) and excesses were discovered.
The factors representing bottlenecks were then adjusted
one factor at a time (with ten runs each) to allow for a
One-way Analysis of Variance (ANOVA) grouping analysis to
determine if changing a particular resource level signi-
ficantly changed the criterion variable. The experimental
model consisted of a randomized block design using the
same arrivals and departure times for each block. All
activitiy distributions were reseeded for each repetition.
54

The criterion variable for the simulation is the ratio of
personnel or cargo prepared on-time over total personnel
or cargo. Since the desired cargo criterion variable is
95% the associated distribution is highly skewed. With
this degree of skewness, a normal distribution should not
be assumed. For statistical analysis of the blocks, the
Kruskal-Wallis nonparametric One-Way ANOVA with multiple
comparisons for grouping was selected (5:175-192).
This single factor analysis approach allowed use of
the model to evaluate current capability and identify
areas of reception processing requiring additonal plan-
ning. The model also provided planners with expected
changes in the percentages of personnel and cargo prepared
on time as individual resources were varied.
TACTICAL PLANNING
Tactical planning considers data collection
procedures to minimize variance and determination of repe-
titions required for statistical analysis and inret-ence.
The reduction of simulation induced variance focuses on
eliminating start up transients. The criterion variable
data for these simulations represent thirty days of ac-
tivity so initial transient variance is insignificant.
Also, for this model start up transients are part of the
system and should not be eliminated since base reception
will begin on day zero with no entities in the system.
55

The increased variablility in the early portion of the
system operation actually adds realism to the model and
can be considered the normal confusion associated with the
system start up.
Determination of the proper number of runs for each
simulation for statistical inference depends on the
variance between runs, the nature of the distribution
associated with the criterion variable, variable inde-
pendence, and autocorrelation (13:187,194). The lack of
correlation between runs and independence of the results
are built into the experimental randomized block design
and pose no obstacle for this analysis. The criterion
variable is highly skewed so, a unimodal non-normal dis-
tribution is assumed. Since the distribution is assumed
unimodal the Camp Meidal extension of Tchebycheff's
theorem was invoked to determine the number of runs
required to assure a given level of precision (13:189).
To conserve computer resources with this simulation
the run repetitions were limited to ten. A sample sim-
ulation of ten runs with anticipated resources yielded a
variance of 0.000228. The Camp Meidal k value for 95%
confidence is 2.98. With these parameters, future simu-
lations of ten repetitions are within .014 of the actual
population mean with 95% confidence (13:189).
56

CHAPTER SUMMARY
Shannon's problem solving paradigm was applied to the
APOE reception process at UPAFB. The system was defined,
a model formulated and computerized, and data collected
and validated. Furthermore, the model was verified and
validated and planning for experimentation with the model
was accomplished. The following chapter will describe the
execution of the experiment, and the results.
57

CHAPTER 4
EXPERIMENTATION AND INTERPRETATION
This chapter details the experimentation and inter-
pretation steps in the problem solving parai~dgm. After
carefully developing the model of APE, ition, col-
lecting accurate resource data, and plannin, 'he experi-
mental design, computer execution of the simulation model
was accomplished. The results of that experiment are
discussed here. Statistical analysis of the results as
well as sensitivity analysis of certain model parameters
enabled accurate interpretation of those results and
pointed out certain strengths and weaknesses of the recep-
tion system plan.
Since actual OPLAN input data (cargo type, quantity,
personnel, timing, etc.) are classified, a data set
resembling actual TPFDD information was created for model
analysis (Appendix F). This data set is used for model
demonstration and is not classified. Actual TPFDD data
were also applied to the model and the results of that
experiment are included in Volume II, which is classified
SECRET.
58
EXPERIMENTATION
Initial experimentation began by applying the input
hypothetical TPFDD data (Appendix F) to the reception
model with estimated WPAFB resources. The purpose of this
step was to evaluate estimated base capability and iden-
tify excesses and bottlenecks (Appendix 6). Ten computer
runs of the model generated average criterion values of
100%. for passengers and 83.4% for cargo. Only the
passenger portion of the system produced at acceptable
levels. These runs revealed that a maximum of six buses
were used out of 23 buses available. Furthermore, two
activities, joint inspection teams and palletizing crews
built up significant queues during the simulation
(Appendix 6, page 175).
From a planning viewpoint, reception managers could
conserve resources by diverting excesses into more criti-
cal areas. For example, passenger resources may be used
to expedite cargo handling. This action could increase
cargo flow through the system and improve the on-time
cargo percentage without reducing passenger on-time sta-
tistics. To facilitate planning, buses, joint inspection
teams, and palletizing crews were further analyzed.
Buses were evaluated at four levels: five, four,
three, and two buses. Passenger on-time percentages for
five, four, and three buses remained at 100%. With two
59

buses, the passenger on-time percentage +ell to approx-
imately 99.
For the cargo network analysis, joint inspection
teams and palletizing crews were individually evaluated.
Joint inspection team levels included five, four, three,
and two teams. Palletizing crew levels of 26, 22, 18, 14,
and 10 crews were also evaluated. A full factor interac-
tive evaluation for two factors at these levels would
require 4-- + 4 or 20 separate simulations of ten repeti-
tions each. Again to conserve computer resources, an
incomplete exponential factor analysis consisting of eight
simulations was performed and is summarized in Table 4-1.
Group Joint Inspection Palletizing 10 Run AverageTeams Crews Ratio On Time
1 4 26 .95802 5 26 .98423 3 26 .83424 2 26 .19595 4 22 .96446 4 18 .96027 4 14 .94828 4 10 .9095
Table 4-1: CRITERION VARIABLE AVERAGES
In addition to the tests above, the reception model
was evaluated for its sensitivity to errors in the esti-
mates for: (1) the vehicular joint inspection failure
rates for cargo reception and (2) the percentage of units
that will arrive with and continue to use their own
60

vehicles for transportation during passenger reception.
Vehicular joint inspection failure rate was selected for
this analysis because of varying expert estimates for its
value. Transportation cxperts (7;S) estimated a 4%. failure
rate, while mobility planners (1;1I) estimated failure
rates up to 20%. Organic transporation was considered for
sensitivity because during adverse weather units may need
to turn vehicles into washing early which would increase
demand for base transportaion. For the sensitivity anal-
ysis the vehicle failure rate was adjusted from 4% to 15%
and the percentage of units with organic transportation
was adjusted from 50% to 40%. This system was evaluated
with the resource levels of 3 buses, 4 joint inspection
teams, and 18 palletizing teams. The criterion variable
f or these ten runs dropped from 96.02% to 50.82% for cargo
and from 100% to 99.89% for personnel.
Model experimentation showed that with this hypothet-
ical input data, WPAFB APOE managers can be confident that
100% of the personnel transiting their system will be
prepared on-time. For a 95%. cargo on-time rate, however,
cargo resources must be adjusted.
INTERPRETATION
Statistical and comparative interpretation of the
simulation results was accomplished to determine
acceptable joint inspection team and palletizing crew
61

levels. Kruskal-Wallis nonparametric procedures for
grouping (Appendix H) were employed to determine if the
evaluated resource groupings resulted in significantly
different criterion values. Since nonparametric tests
measure only sample relationships rather than the magni-
tude of the distance between samples, the average criter-
ion values were also compared with the desired system
performance. This analysis approach considered both sta-
tistical grouping and the objective percentage of cargo
prepared on-time.
The Kruskal-Wallis test and group composition are
recorded in Appendix H. This test showed a significant
difference between Group 1 and Group 3 which contain four
and three joint inspection teams respectively, but not
between Group 1 and Group 2 which contain four and five
teams each. With 26 palletizing crews, the criterion
variable average for three joint inspection teams was below
95%, while four and five teams produced values above 95%.
The nonparametric grouping and criterion variable value
eliminate the three palletizing team group as an acceptable
solution. Since with 26 palletizing crews there is no
statistically significant difference between four or five
teams, economically, the better selection is four teams.
The selection of the proper number of palletizing crews
was not as clear cut. Statistically, with 4 joint
inspection teams there was no significant difference
62

between using 26, 22, 18, 14, or 10 palletizing crews
(Appendix H). Considering only this nonparametric group-
ing analysis 10 palletizing crews would be an acceptable
solution.
The average on-time ratios differ from .9095 with 10
crews to .9644 with 22 crews. These values indicated that
18 palletizing crews with a .9602 average value were the
minimum number of crews that could produce an acceptable 95%.
criterion variable. Without an analysis of tht- simulation
criterion variable variance and associated statistical
confidence level, 18 palletizng crews with 4 joint inspec-
tion teams represents an acceptable choice to satisfy the
desired on-time criterion with minimum resources.
The simulation criterion value variance was calculated
in the tactical planning section. This calculation showed
that with 95%. confidence the 10 run average could vary up to
.014 from the true population mean. If the manager requires
95%. confidence of a .95 on-time ratio, the simulation
resource levels must produce at least a .9500 + .0140 or
.9640 criterion value. Four joint inspection teams with 22
palletizing crews are the minimum resource levels to produce
an average crierion value over .9640. From this experiment,
planners can determine with 957. confidence that 4 joint
inspection teams combined with 22 palletizing crews will
provide satisfactory system performance.
To obtain the optimum solution the full factorial
63

analysis should be completed to determine all acceptable
solutions. For example, 5 joint inspection teams with 18
palletizing crews may also provide satisfactory perfor-
mance. From the set of acceptable solutions management can
evaluate the cost of each resource and choose the optimum
combination.
The cargo results of the sensitivity analysis were
included in the ANOVA grouping analysis which confirmed that
the sensitivity group (Group 9) differed significantly from
the comparison group (Group 6). The model is sensitive to
variablility in the percentage of vehicles that fail joint
inspection. When the failure rate was increased from 4%. to
15%. the on-time percentage dropped over 45%.. The true value
of this failure rate requires more study and evaluation to
reduce the disagreement between transportation and mobility
experts. rhe inspection failure rate should be monitored
during an actual joint mobilization, especially if the
percentage of cargo prepared on-time drops below an
acceptable level. Adjustments in inspection techniques or
criteria could reduce the failure rate and significantly
improve the percentage of cargo departing on-time.
The sensitivity analysis of the passenger network in-
dicated a criterion variable drop from 1007. to 99.89%.. This
slight drop indicates passenger preparation is not sensitive
to changing levels of organic tranportation.
After determining optimum resource levels, additional
64

sizing information can be extracted from the SLAM summary
report (Appendix G). For example, at optimum resource
levels, the maximum number of pallets in the marshalling
area at any one time was 835. Using the recommended
pallet storing layout for open storage (19:p2-43,44) these
pallets require approximately 125-square feet of space
each, or 104,375-square feet total. With 266,700-square
feet of pallet storage space available at WPAFB, adequate
storage was provided (7). Similarly, the maximum vehicle
storage space, explosive cargo marshalling space,
unloading, and processing area space requirements can be
determined.
Space requirements can be further evaluated by con-
sidering the amount of paved space available. Unpaved
space for marshalling and processing will probably result
in a requirement for more vehilcle washing and more
inspection failures of vehicles. As shown before, vehicle
inspection failures can severely lower the percentage of
cargo prepared on-time. Furthermore, rain or snow will
soften unpaved storage surfaces and may render forklifts
useless due to mud or ice. The effects of these condi-
tions could be estimated using this model, and plans for
such contingencies can be developed. For example, PSP can
be laid along forklift aisles and loaded pallets could be
set on wooden warehouse pallets. If APOE managers know
that unpaved marshalling will be used (by using the
65

reception simulation) they can ensure adequate materials
are on hand and additional washracks are provided in case
of rain or snow.
Billeting requirements can also be determined. For
these data, base facilities and contract quarters within
ten miles of WPAFB were sufficient to billet all transient
personnel. However, if these resource levels had been
exceeded, the simulation would indicate the averages, so
that planners could take steps to minimize the impact.
The use of tents and related equipment such as cots,
latrines, and communications networks could be thoroughly
planned in advance. Another option would be for reception
managers to schedule the arrival of FRNs with large num-
bers of personnel to ensure that billeting was not re-
quired; or spread the arrival times out so that other FRNs
vacate quarters before large FRNs arrive.
At the request of WPAFB base mobility planners, the
ability to determine box lunch requirements was added to
the model. Planners estimated that each departing person
would require a box lunch while in passenger staging as
well as one lunch upon departure from the passenger termi-
nal to eat during the flight (11). Feeding requirements
prior to passenger staging are met in the billeting por-
tion of the model. The box lunch per hour requirements
generated with simulated data showed that base capability
was adequate.
6

Workloads for other base agencies can also be esti-
mated from the model. The days with large amounts of
cargo and/or personnel arriving can be determined and
adequate security police service can be arranged. Simi-
larly, the quantity of cargo departing each day can indi-
cate the number of aircraft arrivals and departures at
WPAFB. This information could be used by both air traffic
control personnel and base aircraft maintenance personnel
in planning parking, fuel, spare parts, and manpower
requirements. Proper maintenance planning would include
analysis of malfunctions on incoming aircraft and pre-
stocking of anticipated parts requiements, as well as
ensuring that the proper types of ground servicing equip-
ment is available.
LIMITATIONS
Certain model limitations were observed during the
evaluation of the results. The major area that limits the
model is the lack of an effective method to plan actual
aircraft loads of people and cargo. While movement tables
estimate this factor, varying aircraft configurations ad-
versely affect current planning (7;11). For example Civil
Reserve Air Fleet (CRAF) aircraft which will accomplish
much of the personnel strategic airlift, possess different
capacities depending on the type of aircraft as well as
the airline from which the aircraft came (17). Further-
67

more, it is probable that some airplanes will arrive
improperly configured (eg. passenger seats in an airplane
designated to carry cargo). In this situation, the air-
craft may be loaded with passengers rather than cargo to
save the time required for reconfiguration. Passengers
departing early and cargo departing later than expected
could affect the flow of assets through the reception
system by causing back-ups in the passenger terminal or
the marshalling area. Additionally, without specific load
planning, the equipment required to load the aircraft may
be limited which would cause additional backups. Without
accurate estimates of the plane loads of cargo, modeling
K-loader operations, a potentially critical resource, is
impossible.
The solution to this problem lies in the accurate
estimation of which pallets, or groups of passengers will
travel on which airplanes. Until these estimates are
available, the limitation of evaluating the system in
terms of individual FRNs or pallets instead of plane loads
of cargo or personnel will exist.
Another major limitation of current planning is the
omission of retrograde cargo and returning personnel
(10). Storage and handling requirements of cargo return-
ing from the conclict area will require space, facilities,
personnel, and equipment resources. Returning non-comba-
tants and wounded personnel will also use resources in
68

competition with the deployment operation. Without esti-
mates of this additional workload (10) the impact on the
reception system is unknown. Depending on the number of
U.S. non-combatants in the crisis area. this additional
workload could also severely hinder the deployment effort.
CHAPTER SUMMARY
Experimentation with the computerized base reception
model was accomplished using simulated TPFDD data. The
results of this experiment were analyzed statistically to
determine the optimum resource levels. The model was also
tested for system sensitivity to changing parameters. The
combination of estimated base resources did not meet the
requirments of the cargo criterion variable. Acceptable
performance in the modeled system was achieved by reducing
the buses required to 3, in=reasing joint inspection teams
to 4, and decreasing the palletizing crews to 22. Addi-
tional information about maximum workloads for box lunch
preparation, billeting, and space requirements was
extracted from the model and its planning value discussed.
The limitations to the model were also identified and
their impact on the model results was explained.
A similar experiment and interpertation was accom-
plished using actual TPFDD warplan data. Description and
analysis of that experiment is presented in Volume II
which is classified, SECRET.
69

CHAPTER 5
IMPLEMENTATION AND RECOMMENDATIONS
Answering the research questions and meeting the
objective described in Chapter 1 is only the first phase
of model implementation. Management must be informed of
the simulation results so that they can incorporate this
information into the decison process. Finally, the users
should constantly attempt to improve the model to obtain
the most meaningful results. This chapter reviews the
research questions and objective, summarizes user and
management level briefings, and proposes recommendations
to further improve the model.
RESEARCH QUESTIONS
The research questions from Chapter 1 provide a
framework for the conclusions drawn from this effort.
What are the critical factors representing the reception
process?
The critical resources were fully ascertained through
detailed interviews with MAJCOM and base level planners
and evaluators. These experts verified that all the major
factors of the reception system were considered and in-
70
cluded in the model. With the hypothetical TPFDD, joint
inspection teams and palletizing crews were the most
critical factors.
What are the duration distributions associated with
reception activities?
Activity durations were determined through a process
that integrated field study results with expert estimates
and documented values. To aid model application to dif-
ferent APOEs, durations which were base specific were
expressed by average values. Those factors that were not
base specific (eg. palletizing and other general proces-
sing times) were expressed as distributions. These dis-
tributions account for the variability inherent in these
processes and added realism to the model. The parameters
of these distributions were again gained from expert esti-
mates and documented planning factors.
What technique will best validate the reception model?
Real world validation of this type of model is
impossible, so the authors employed a utilitarian vali-
dation technique used by the simulation experts at Head-
quarters Military Airlift Command (15). This technique
involved developing model logic, and experimentation with
the model paramenters. The model structure, and simu-
lation resailts were evaluated by MAJCOM and base level
reception technicians and managers to ensure an accurate
71

appraisal. All evaluators accepted this model as an
accurate representation of the actual reception system.
Acceptance by the most knowledgable managers in the
mobility/reception field is strong evidence that the model
is valid. Furthermore, WPAFB managers are using the
simulation results to aid their planning process (1;7).
Does the simulation identify critical shortages?
The reception model output, through queuing and
resource utilization summaries, clearly indentified
critical shortages in existing plans and produced
resolution of those deficiencies through simulation
experimentation. These shortages are best observed in
Volume II where the synergistic effects of insufficient
resources are most dramatically demonstrated.
CONCLUSION
In answering these research questions the research
objective was fully met. The model provides managers with
an effective planning tool that integrates OPLAN movement
data with reception processing requirements. The computer
simulation provides validated estimates of time-phased
workloads that can be used in planning APOE reception
systems as well as allowing experimentation to determine
optimum resource levels. Peak workload information may
also be applied to related base service functions (eg.
security police and transient maintenance personnel) to
72

ensure adequate resources in those areas.
A User's Manual provides model application and modi-
fication instructions. With these instructions, planners
can easily adapt the model to different APOEs or varying
system conditions.
I MPLEMEN TAT ION
The model was developed in conjunction with base
level mobility planners (1;7). They have accepted the
final simulation results (Volume ID) as accurate and are
using these results for sizing estimates. The WPAFB
senior management (Wing Commander and Crisis Action Team
Members) were briefed on the simulation findings to pro-
mote base level interagency implementation coordination.
The model and Volume II results were presented to the
Headquarters AFLC mobility planning staff to demonstrate
model applicability of other AFLC APOEs. Headquarters
USAF/LE was briefed for model application to APOEs
throughout the U.S. Air Force. Finally, the model and
Volume II results were presented to the Forecasting and
Planning working group at the 1983 Military Operations
Research Society symposium to promote incorporation of
this model into other simulation research efforts.
73

RECOMMENDAT IONS
Recommendations for the application of this research
fall into three categories: model use, model improvement,
and model incorporation.
MODEL USE
The model should be used at base level and by
MAJCOMs to evaluate current reception plans and base capa-
bility. Shortage areas identified by the model should be
fully evaluated and plans should be altered to eliminate
those deficiencies. In order to fully exploit the many
facets of this model, a qualified individual holding an
advanced degree in Logistics Management from WFIT should
be assigned to each APOE. This would ensure adequate
consideration of the many logistics issues involved in the
reception process. APOE bases that do not have the abil-
ity to run this computer model should procure that ability
or coordinate with other commands that can process SLAM
programs.
MODEL IMPROVEMENT
The model should be improved by constant review of
model parameters, by obtaining accurate estimates of plane
loads of cargo and personnel, and by developing accurate
estimates of retrograde cargo and returning personnel. As
palletizing techniques or other processes are improved or
changed, parameters must be adjusted to reflect the actual
74

values. The dynamic nature of base reception and its many
aspects requires continuing model update.
More detailed planning should be accomplished to
provide APOE managers accurate estimates of outbound plane
load capacities and schedules so that cargo and personnel
processing can be evaluated in terms of plane loads. This
would allow a more accurate computation of cargo and per-
sonnel departing the base on time. It would also allow
f or modeling of the aircraft loading function. Actual
aircraft scheduling and loading will affect the amount of
cargo and personnel actually departing the APOE on time.
These improvements to the reception model would make it a
more realistic and effective planning tool.
Returning cargo and personnel, which idll place
demands on the reception system should also be studied.
The effect of retrograde cargo and personnel would be
minimal for OPLANs concerned with such areas as Southwest
Asia. However, a conflict in Europe would create a flood
of non-combatants to the U.S. that could cripple the
mobility effort. Evacuation plans for non-combatants and
casualty estimates for various areas could be used as a
basis for this evaluation. Once the amount of returning
cargo and personnel is estimated, destinations could be
predicted and APOE managers could plan for this additional
workload. Once the estimates are made, these factors
could be added to the computer model to test their effect.
75

on the system
MODEL INCORPORATION
The reception model should be incorporated into
other computer planning models, (specifically MAC's M1-14)
to a~dd realism and accuracy to larger scale planning
toc'~s. The MAC M-14 model simulates the worldwide
strategic airlift system and includes aircraft scheduling,
maintenance, loading, turn-around times and flight times.
MAC presently uses average times for the reception process
in the M-14 and assumes that 100% of the cargo will be
prepared on time (15). The addition of this model to the
M-14 would enable evaluation of the MAC system's response
to cargo and personnel not prepared on-time. These delays
will affect the flow of personnel and equipment to meet
OPLAN requirements. Incorporation of the reception model
into the M-14 would add the realism of varying cargo and
persownnel processing and thus enhance the accuracy of the
M-14 strategic model. The SLAM reception model will be
compatable with the M-14 which is being translated from
the GASP IV computer language to SLAM (9), and its
incorporation into the M-14 should be relatively easy.
76

CHAPTER SUMMARY
The original research questions were reviewed and
briefly answered. The researchers concluded that all the
questions were answered and the original research objec-
tive was fully satisfied. Base level, MAJCOM and service
level managers were briefed to encourage implementation of
the experimental findings. Recommendations for model use,
improvement, and incorporation were suggested.
77

APPENDICES
7B

APPENDIX A
ACRONYMS
79

ADP Automatic Data Processing
ALC Air Logistics Center
ANOVA Analysis of Variance
APOE Aerial Port of Embarkation
CONUS Continental United States
CRAF Civil Reserve Air Fleet
EAD Earliest Arrival Day
FRN Force Requirement Number
JCS Joint Chiefs of Staff
JDA Joint Deployment Agency
JOPS Joint Operations Planning System
JSPS Joint Strategic Planning System
LAD Latest Arrival Day
MAC Military Airlift Command
MAJCOM Major Command
MCC Mobility Control Center
MTMC Military Traffic Management Command
OPLAN Operation. Plan
POD Port of Debarkation
POE Port of Embarkation
SLAM Simulation Language for Alternative Modeling
TPFDL Time-Phased Force Deployment List
TPTRL Time-Phased Transportation Requirements List
TTFDD Time-Phased Force Deployment Data
TUCHA Time Unit Characterisitcs
80

WIN WWMCCS Integrated Network
WMP USAF War and Mobilization Plan
WPAFB Wright-Patterson Air Force Base
WWMCCS Worldwide Military Command and Control System
UTC Unit Type Code

NO A134.433 AERIAL PORT 0F EMBARKATION CAPABIIT PLANNINO HOLUME .23(U AI F ORCE INS 0F TECH WRIGHT-PATTERSON AFB OHSCHOOL OF SYSTEMS AND LOGISTICS T W CHRISTENSEN ET AL.JNCLASSIFIED SEP 83 AFIT LSSR-62-8 F/G 15/5 NLmIIIIamIIumEIhIEEIhIEEEEEIIIIIIIIIIIIuIIIIIIIIIIIIIlEEIhhIhhEIhhIIIEEIIEIIIIIhlEEEEEEEIIIIIIEE

1_.25 jjjj__L4 .6___
APPENDIX B
WARPLAN DEVELOPMENT
82

DoD warplans reflect national command authority
guidance as indicated by the Joint Strategic Planning
System (JSPS). The JSPS contains a series of long range
strategic plans (fifteen year or longer projections)
developed at the Joint Chiefs of Staff (JCS) level. These
strategic plans assess current and projected world con-
ditions and task the theater unified commanders to develop
specific plans to support the interests of the United
States.
The theater unified commander analyzes specific con-
tingencies and prepares necessary estimates, develops a
concept of operations, and tasks the Service component
commanders to develop supporting plans. When the JCS
approves the basic plan, all tasked agencies prepare sup-
porting operation plans (OPLANs). Supporting Air Force
major commands (MAJCOMs) will submit their OPLANs to the
theater Air Force component command having primary plan-
ning responsibility (20:31).
The JCS recognized the overwhelming difficulty in
coordinating Service plans in support of joint military
operations; so, in 1970 they approved the Joint Operations
Planning System (JOPS). JOPS guidance consists of four
volumes which consolidate policies and procedures for the
development, review, and approval of joint plans. The
JOPS provides an automatic data processing (ADP) support
system which serves as a consolidated planning data
83
source. The objective of JOPS is the timely development
of adequate, suitable, and feasible operation plans
(20: 15).-
USAF MAJCOMs must use the USAF War and Mobilization
Plan (WMP) for current Air Force policies and planning
factors for the conduct and support of wartime opera-
tions. The WMP also establishes requirements for develop-
ing mobilization and production plans to support sustained
contingency operations, as well as specific planning func-
tions necessary to match facilities, manpower, and mater-
ial with planned wartime activities (20:19).
Detailed Air Force planning begins with a projected
inventory position with respect to units, aircraft, mis-
siles, personnel and installations. The projectd inven-
tory positon estimates Air Force assets by unit type code
(UTC). A unit type code package represents a certain
capability, such as an airlift squadron. Each UTC has a
specific defined mission capability. Planners identify
force requirements and available assets by UTC rather than
by specific military organizations.
JOPS III provides the standard data~ files, format,
and application programs for force planning (20:34). The
JOPS InI application programs analyze the force projec-
tions to determine unit related resources, and non-unit
related cargo and personnel requirements as well as an
initial transportation feasibility estimate. Unit related
84

resources include equipment or accompanying supplies and
personnel identified with a specific UTC. Equipment and
personnel not identified with a specific UTC, primarily
replacement resources and spares, deploy as non-unit
related resources (16:x). The product of the JOPS III
effort is the Time-Phased Force Deployment Data (TPFDD).
The TPFDD consists of two data files, the Time-Phased
Force Deployment List (TPFDL) and the Time-Phased Trans-
portation Requirements List (TPTRL). The TPFDL lists the
type of units to support an OPLAN, and data concerning
their routing from origin to destination. The TPTRL lists
force movement characteristics, non-unit related cargo
characteristics and routing, and non-unit related person-
nel data (20:36). The specific TPFDD information includes
types of forces required, Type Unit Characteristics
(TUCHA) movement data, proposed routing information,
proposed origin, proposed ready to load date at origin,
earliest and latest arrival at the Port of Debarkation
(POD), desired POD, required delivery date at destination,
non-unit records, non-unit routing data, and providing
organization (16:p.4-2). The Joint Deployment Agency (JDA)
is responisble for maintaing the TPFDD. Planners have
access to the TPFDD through the Worldwide Military Command
and Control System (WWMCCS).
MAJCOMs must evaluate their capability to support the
TPDFL force requirements and report deficiencies to the JCS
85

(20:41). The Military Airlift Command (MAC) and the Mili-
tary Traffic Management Command (MTMC) must assess lift
support capabilities and align lift resources with TPFDD
requirements (20:41). They prepare lift restricted move-
ment tables which provide information concerning the
scheduled movement to the POE, intermediate locations,
POD, and destination. Additional information includes
transportaion mode and source, tons of cargo, number of
personnel, and arrival dates and location for each
required movement (20:256). The JDA monitors CONUS
movements and intertheater deployments involving common-
user lift, and maintains the MAC and MTMC movement tables
(16:p.2-2).
Transportation planning is a significant factor in
the development of the final plan for any operation.
Transportation planning should indicate the concepts for
movement and reception of all forces, identify facilities
to be used in the reception of forces, and identify
limiting factors which could adversely affect mobility
operations. Total movement requirements to include combat
and support unit strategic deployment, deployment of
replacement and filler personnel, filler shortages of
prepositioned war reserve stock, items of equipment
required by theater in-place units to make them combat
effective, resupply, and movement of retrograde cargo must
be considered (20:186). The transportation plan as
86
_.......-

reflected in the movement tables should consider all the
forces and supplies needed by the OPLAN, and show how
these resources will be routed through the various ports
of embarkation to reach the destination.
87

APPENDIX C
GRAPHIC MODEL
86

1 0 Z
000
07 w0 0 00a
C La
C o3
wha a o
ol u
U a
0 -
J . a~w a L
La u~s
ea 0

a r
x20
0 0
a''
9-
2w
9 090

zz
too
IT :
L Z
z~ U)
16
91

00
00
0 '1z0
C
7;
04 uJ
4 44S CLa Sw 6.
7' c~3La CUSw uuCU 0
U
us
U-
o La
8. -
0100
C4
92

0.~
cz
I -
C.- j
(C
l.fl
-~ - 1.1.24K -0. 0. c
C 1.2.1
C-'
40
K CC)
01.1.2
- U C
o Cl. z-*,; Cfl- CC *~US- z C.l~JwC .,o* l.a
IC
C-K CC.0.- - OZ1.20 CCII
a 1.11.. CCCo U.
1.10
2.4
93
______ -- -.- -

o~ ~
o o
-- ( .
w - -
C , / l
'4g.
C. (
6)044.

C.:
ozc
v- L-

U.j u
a
LA A
aa
w 2 LS
cU
k.
-oz
96

APPENDIX D
SLAM NETWORK FLOWCHART
97

-~ -0
4 04.
0
4 b0 4
N 0 0. *
- 444
C
404
p.0.
f/-S04 -
'-0
'4 0
hi -
- C.
04
2
0
98
-~- ----- -

-oCC
NW
Cot-o Ce
-- CL.
iF tC
* C
C
a-I
4 - Ct- 6~ -a - -
0C C 1 - -C ~ C N No - - - 0C C CO 3
U C- N 04
fig CC
C0
1.o~?.
'4
at.,
Co.C
99
- -~-~- - -~-- - -

Vt...
00

0
10
011,
z Q0-
C 101

II I
" .V..' ,.
C' 0 - - - --,
- - a, ~ C" , l-- ?- - - N t
0 S C 0 * a
- . -0 t
... . . . . . . . .. . . . |1 . . . l -- . . . . .. . II I . . . . . . . .

3:-* L~
A
4 0
4 CD
0C
-
4 -
0~
4 4 0
S. - C
C C
U)
4
0
.5
~i 00404W4 4
.~ CCCC00-0£4-
1)3

010
AA

IIIIIn
,-".0
r~ 20
105
10

0.z
~~CL.
C.L-
106.

-r-x
ri N
Lw twCt W
- tO- C- w -C
107

0~~
*0,
0.. -
11
-
- 0 to0~ S - -
CC U - -C c C C
C. '~ -* 'C
'C
0
'Ccc
0
C
C
*~-
0 -c.CU
106
-

1;~~(C
0..
0
La
C.-
U-,
2 -,C C.
o C N LL.
Lw- Lw-
201 CCV
CI'
109
_______ - - ~----- -..

I
LW3 A
* -z
- cc
a -- 0 p. -.a a N
a C - a a cc4
C,.
C
a4
-U-40,4
Ca00C,.
110

- C
C
*
'C
C.-S 844
0~
LAs
k.8.fl
CCI
C.a.
r NLA C- - AlC ~ CC -8. C
p
Cal..a.CrA
Ca.
111

.5:, 1
-3 -C. -oU- C,.
0*
0C
- zC. Cl
.5 CC~ 3.5 .5
- z
x -C
C.SC
o .50,~ C:-,
C - --
0 0
9. .2. 4 1- 4 C- .5
o g~
.50z
C2w
CC,0-0
112

0 * 0
ro
0-a
113

la
a -
- N
- -o
0
4
c-a
114
-- -

oI.Q
,C 0
- crJ
01
I I I l -- - fl lllI~ il~ l ....... ...

116
ire. -'1'~1:,.
-Q 4',0.. -o
C.-
t* I
00
3w~.
0-.0 So,0-0C."
117

C 18

1~.4'
0~
.J 4
0 2 4
C-J C
4 -
4 .. cnC C -
0 - 0- C - *0 LAO
C - 0- 4 -4
C
C
'4C
0 4 A-'
= ~ N c-A- N4
4 LAO
44 VA
- 3 44 4
F 0
- A,C 4
C C.
0 C
40~ N - Ar C
.A0 =A2A4= 0-0C.- CA.
119
- - -~--- -

I -
- C
6. 0 0- - ft U -
I 6.
U, 2 - C
a
0 eI -,
(.1C C
C
ft. I
C
0
'4
ftftV(
120

L4
CIC C.,,
C
Co .
121

~.4r.
C -
C ?
.4 u~J
* U'
C -
4
04W
CCO~0C'-
122

- 2- a I.
C 1.-i
a 0
Co
C
a, -o
a. a'
~1. 6
t a U-:,
C
w U,
I
- C
C U: 4
.. I- C
a, a.C a,a--
na.Ccc-a
123

APPENDIX E
COMPUTER CODE
124

SLAM NETWORK
100:6EN.G. L. WHITE,RECEPTION MODEL,1/7/83;IlIO:L I MITS, 40, 9, 4500;120:-SEEDS, 066371131 (21);130:PRIORITY/1,LVF ( ) /9,LYF (2) /1O,LVF(2)/II,LVF (2)/12, LVF(2) /13,LJF (2);140:PRIORITY/14,LVF(2)/15,LVF(2L)/16,LVF(2)/17,LVF(2)18,LVF() /19,LVF)2);15OAPRIORITY/20,LYF(2)/21,LVF(2)/22,LVF(2)/23,LYF(2)/4,LVF(2)25,LVF(2);16O:PRIORITY/26,LVF(2)/27,LVF(2)/28,LYF(2)/29,LVF(2)/30,LVF(2)/31,LVF(2);170:PRIORITY/32L,LVF(2)/33,LVF(2)/34,LVF(2)/35,LVF(2) /36,LVF(2)/37,LYF(2);180:PRIORITY/38,LF()39,LYH(240,LVF2;190=NETWORK;200= RESOURCE/NODEPBILCI376) ,2; RESOURCE #1210--; ESSENTIAL2202 RESOURCE/RECPOINT(2000),3; RESOURCE #22302; ESSENTI AL240z RESOURCE/INCHECCR(3),4; RESOURCE #3250t; ESSENTIAL260z RESOURCEIBUS(3),13,10,8,6,15,14; RESOURCE #4270z; ESSENTIAL280= RESOURCEIPAISTGc500),9; RESOURCE 35290m; ESSENTIAL3002 RESOURCE/BOXLUN(500) ,40; RESOURCE 36310m; ESSENTIAL3202 RESOURCE/BILFEEDI (1000),7; RESOURCE 37330:-; NONESSENTIAL340m RESOURCE/BILFEED2 1000) ,7; RESOURCE #8350:; NONESSENTIAL360z RESOURCEIDILFEED3(Io00),7; RESOURCE 39370z; NONESSENTIAL380: RESOURCE/TRABILI (491) ,5; RESOURCE #10390=; ESSENTIAL400: RESOURCE/TRADIL42I227);'5; - RESOURCE #11410:; ESSENTIAL420: RESOURCE/TRABIL3(7O5) ,S; RESOURCE 312430m; ESSENTIAL440= RESOURCE/PAXTERMi(500) ,11; RESOURCE #13450:; ESSENTIAL460= RESOURCE/PAXAGENT(3) ,12; RESOURCE 514470=; ESSENTIAL480- RESOURCE/CAR6AGNT(3),16; RESOURCE #15490=; ESSENTIAL500: RESOURCE/WASHRACK(2) ,21, 17; RESOURCE #16510=; ESSENTIAL520: RESOURCE/VEHPROCS (5) ,18; RESOURCE 317530:; ESSENTIAL540:- RESOURCE/VEHPARK(2000) ,19; RESOURCE #18550z; ESSENTIAL560: RESOURCE/JITEAM(4),20,24; RESOURCE #19570z; ESSENTIAL580. RESOURCE/MARSAREA(2000),23,31, 39; RESOURCE 320
125

590:;NONESSENTIAL600= RESOURCE/PALTEAM(14) ,36, 33; RESOURCE 121610=; ESSENT IAL620= RESOURCE/EXFORK(6),37,38; RESOURCE 122630=; ESSENTIAL640: RESOURCE/EXMARS('000),35; RESOURCE 123650:; ESSENTIAL660= RESOURCE/FRUSTCAR(2000),27; RESOURCE 124670=; ESSENTIAL680: RESOURCEIMARSFORK(6I 26,28,2.5,22; RESOURCE 125690:; ESSENTIAL700: RESOURCE/NRCRECPT(2000) ,29; RESOURCE 326710=; ESSENT IAL720= RESOURCE/NRCASENT(6),30; RESOURCE 327730=; ESSENTIAL740= RESOURCE/TERMFORK(6) ,34,31; RESOURCE #28
750 ;ESSENTIAL760=;770:CROI CREAT;780:EVOI EVENT,l;790:EV02 EVENT,2;800: ACT,,NNQ(1).6E.1,EV03;810: ACT,ATRIB(1),,GN01;820:EVO3 EVENT,3;830: ACT,ATRIB(1),,EY02;e40=60OI GOON;850= ACT,,ATRIB(3).GT.0,AS2O;860: ACT,,ATRIB(4).6T.0.OR.ATRIB(5).GT.0,8N05;870= ACT,XX(31),ATRIB(6).GT.0,AN37;880=;890=; PASSENSER SUBNETWORK900=AS2O 4SSI6N,ATR1B(4):0,ATRIB(5):0,ATRIB(6?:0;910: ACT,,ATRIB(7).Eg.1,AWOI;920: ACT,,ATRI(7).Eg.2.OR.ATRIB(7.E.3,ANO2;930: ACT,,ATRIB(7).EQ.4.OR.ATRIB(7).Eg.5,6N03;940=;950:; NONDEPLOYlNG PERSONNEL960=AWOI AWAIT(II),NDDEPBIL/ATRIB(3);970=TROI TERM;980=;990:-; OFFBASE DEPLOYING PERSONNELI00:AWO2 AWAIT(3),RECPOINT/ATRIB(3);101O:AWO3 AWAIT(4),INCHECKR/1;102,0Z ACT,USERF(1);1030=FRO1 FREE, INCHECKR/l;1040=ASOI ASS1GN,ATRIB(1)zUSERF(2) ,ATRID(7)=USERF(i1) ,ATRI8(91:USERF( 20);10502 ACT,USERFIB),ATRIB(I).LE.1X18).AND.ATRIB(9).ED.0,FR23;10602 ACT,USERF(8),ATRIB(i).LE.XXB).AND.ATR1(9.E.I,AW13;1070: ACT,,ATRID(1).GT.XX(8),AW04;1080:-;1090:; BRANCH IF THEY HAVE OWN TRANSPORT1100=FR23 FREE,RECPOINT/ATRIB(3);
126

1110= ACT,XX(42),,ASA2S;1120:;1130=; BRANCH IF RIDING BUS TO PAX STAGING1140:AW13 AWAITII4),ALLOC(2);1150: ACT,USERF(28),,GN08;1160: ACT,,ATRIB(7).GT.0,AW13;1170:51408 GOON;1180= ACT,XX(42),ATRID(7).GT.0,FR24;1190= ACT,,ATRIB(7).EQ.O,FR25;1200:FR24 FREE,BUS/ATRIB(B);1210=TR02 TERM;1220=FR25 FREE,RECPOINT/ATRIB(3);1230: ACT,]X(42);1240:FR26 FREEBUS/ATRIB(8);1250= ACT... AS25;1260=;1270:; BRANCH INTO TRANSIENT BILLETING1280=AW04 AWAIT(51,ALLOC(11;1290= ACT,,ATRIB(1).LE.XX(8),ASOl;1300: ACT,,ATRIB(1).GT.XX(8),1404;1310=6N404 SOON;1320: ACT,,ATRIB(4).GT.0.AND.ATRIB(9).EO.0,FRO2;1330: ACT,,ATRIB(51.GT.0.AND.ATRIB(9).EQ.0,FRO3;1340: ACT,,ATRIB(6).GT.O.AND.ATRIB(9).EQ.o,FRo4;1350: ACT,,ATRlB(4).GT.O.AND.ATRIB(9).EO.1,AS03;1360: ACT,,ATRIB(5).6T.0.AND.ATRIB(9).Eg.1,AS05;1370= ACT,,ATRIB(6).GT.O.AND.ATRIB(9).Ea.1,AS07;1380z;1390:; MOVE TO BILLETING AREA(S) BY OWN TRANSPORTATION.1400=; AREA I1410-FR02 FREE,RECPDINT/ATRIB(4);1420=AS02 ASSIGN,ATRIB(5)=0,ATRIB(6)=O;1430= ACT,XX(26),,ANO6;1440:; AREA 21450=FRO3 FREE,RECPOINT/ATRIB(S);I460=AS04 ASSIGN,ATRIB(4)zOATRIB(6)zO;1470: ACT,XX(27),,AW06;1480:; AREA 31490=FRO4 FREE,RECPOINT/ATRIB16);1500=ASO& ASSIGN,ATRIB(4)=0,ATRIB(5;:o;1510: ACT,XX(28),,A406;1520:; AREA I1530-ASO3 ASSIGN,ATRIB(5:0O,ATRIB(6;:O,1540= ATRIB(7)=USERFi3);1550= ACT,...AW05;1560:; AREA 21570=AS05 ASSIGN,ATRIB(4)x0,ATRIB(6)=0,1580: ATRIB(7)=USERF(41;15902 ACT,...AMOS;1600a; AREA 31610=AS07 ASSIGN,ATRIB(4)=:0.ATRIB(5;:0,1620- ATRID(7)=USERF(5);
127

1630= A CT ...AW05;1640=;1650=AWOS ANAIT(6),ALLOC(2);1660= ACT,USERF(28),,GN09;1670= ACT,,ATRIB(7).GT.O,AWO5;1680=GN09 GOON;1690= ACT,USERF(13),ATRIB(7).6T.0,FRO7;1700= ACT,,ATRIB(7l.EQ.O,EVO4;1710=FRO7 FREE,BUS/ATRIB(8);1720=TRO3 TERM;1730=;1740=EVO4 EVENT, 4;1750= ACT,USERF(13);17b0:FROB FREE,BUSIATRIB(B);1770=;1780=; NOW IN THE BILLETING AREA(S), ALLOCATE FEEDING1790:AW06 AWAIT(7),ALLOC(3);1800-- ACT,USERFiB);IBIO:EV05 EVENT,5,1;1820=;1850=; READY TO LEAVE BILLETING AREA(S) BY OWN TRANSPORT1840= ACT,,ATRIB(4).GT.0.AND.ATRIB(9).EQ.0,FR09;1850= ACT,,ATRJB(5).GT.O.AND.ATRIB(9).EQ.0,FR1O;1860= ACT,,ATRlB16).T.O.AND.ATRIB(9)Eg.0,FRII;1870=; THEN IF BY BUS1880: ACT,...AWO7;1890:;1900:; OWN TRANSPORTATION TiRDUSH THESE NODES1910=FRO9 FREE,TRABILI/ATRIB(4);19210= ACT,%X(36),,AS25;1930=FRIO FREE,TRABIL2/ATRIBS5);1940: ACT,XX137),,AS25;1950=FRII FREE,TRABIL3/ATRIB(6);1960= ACT,11138),,AS25;1970=;1980:; RIDERS MUST AWAIT BUSES1990=AWO7 AWAIT(B) ,ALLOC(2);2000: ACT, USERF (28),,S6Mb;2010: ACT,,ATRIB(7).GT.0,AW07;2020=SN1O GOON;2030= ACT,USERF(14),ATRIB(7).GT.0,FRI4;2040: ACT,,ATRIB(7) .EQ.0,EV0b;2050=FR14 FREE,BUS/ATRIB(8);2060=TR04 TERM;2070=;2080=EV06 EVENT, 6;2090: ACT,USERF(14);2100=FRI5 FREE,BUS/ATRIDB);2110-;2120:; PASSENGER STAGING AREA2130-AS25 ASSIGN!ATRIB(3)=USERF(40);21404A09 ANAIT(9),PAISTG/ATRIB(3);
1 28
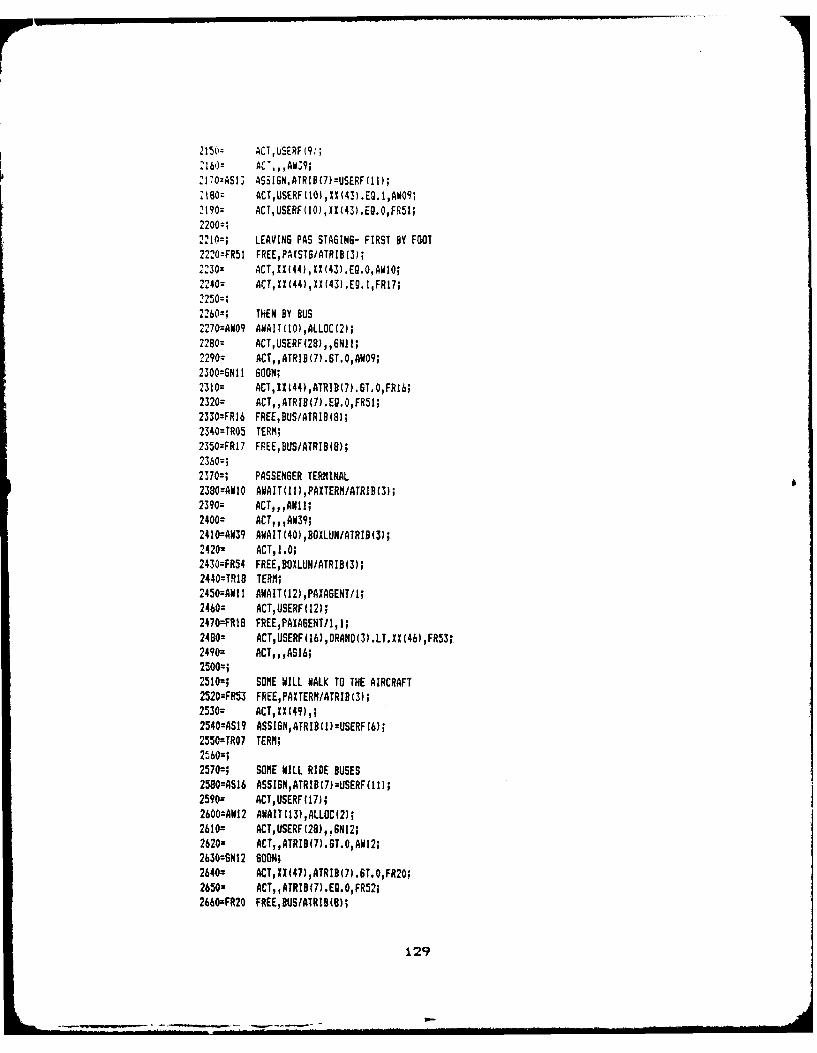
216)0 AC7. 1AW;9;2170=AS13 ASS16N.ATRIB(7)=USERF(II);2180= ACT,USERF(I01,XX(43).EQ.I,AW09;2190: ACT,USERF(H0),XI(43).E9.0,FR5I;21200z;2210:; LEAVING PAS STAGING- FIRST BY FOOT2220=FR51 FREE,PAXSTS/ATRIB(3);2230= ACT,X44),Xl43.E.0,AWIO;2240= ACT,Xl(44),XX(43).E9.1,FR17;2250=,21260z; THEN BY BUS4,70=AW09 AWAIT(IO),ALLOC(2);2280= ACT,USERF(28),,6N11;2290z ACT,,ATRIB(7).ST.0,AW09;2300=6N11 SOON;24310:- AC7,1X144),A7RIBLJ).61.0,FRI6;2320= ACT,,ATRIB(7.Eg.0,FR51;2330=FRI6 FREE,BUSIATRIB18);2340:TR0S TERM;2350=FR17 FREE,BUSIATRIB(8);2360:;21370:; PASSENGER TERMINAL2380=AW1O AWAIT(I1),PAXTERM/ATRIB(3);2390= ACT ...ANII;2400: ACT,...AW39;2410:-AN39 AWAIT(40),BOXLUN/ATRIB(3);2420: ACT,1.0;2430:FR54 FREE,BOXLUN/ATRIB3);2440=TRI8 TERM;2450=AWII AWAIT(I2) ,PAXA6ENT/L;2460= ACT,USERF(12);2470=-FRIO FREE,PAXAGENTII, ;2480: ACT,USERF(16),DRAND(3).LT.XX(46),FR53t2490= ACT,...AS16;2500x;2510:; SOME WILL WALK TO THE AIRCRAFT2520=FR53 FREE,PAXTERNIATRIB(3);2530= ACT,IX(49),;2540:4519 ASSIGN,ATRIB(1)=USERF(6);2550:1R07 TERM;2560=;2570:-; SOME WILL RIDE BUSES2580:4516 ASSIGN,ATRIB(7)=USERF(11);2590z ACT, USERF (17];2600=AN12 AWAIT(13),ALLOC(2);2610: ACT,USERF(28),46N12-;2620: ACT,,ATRIB(7).GT.0,AW12;2630=GN12 SOON;2640: ACT,XX(47),ATRID(7).GT.0,FR2O;2650: ACT,,ATRIB(7).Eg.0,FR52;2660:-FR2O FREE,BUSlATRIB(g);
129
.......... =.........

2670=TROS TERM;2680=;2690=FR52 FREE,PAXTERfl/ATRIB(3);2700:- ACT,XX(47);2710=FR2I FREE,BUS/ATRIB(B);2720=;2730:-; STATISTICS ARE COLLECTED2740= ACT,,.AS19;2750=;2760:-; ON BASE DEPLOYING PERSONNEL2770=6N03 GOON;2780= ACT,USERFIB),XX(50).EQ.0,AS25;2790=;2800:-; IF NEED BUS TRANSPORT TO PAX STAGING2810= ACT,USERF8,XX(5OLED. 1,AS17;2820=ASI7 ASSIGN,ATRIB(7)=USERF(11);2830=AWI4 AWAIT(15),ALLOC(2);2840: ACT, USERF (28),, 5N07;2850m ACT, ,ATRJB(7).ST.0,AW14;"860=GN07 BOON;2870= ACT,XX(51),ATR!B(7).GT.0,FR22;280: ACT,XX(51),ATRIB(7).Eg.0,FR49;2890=FR22' FREE, BUS/ATRIB (8?;2900=1ROB TERM;2910:FR49 FREE,BUSIATRIB(8);2920: ACT,...AS25;2q30:;2940=; CARGO SUBNETWORK2950=;2960=GN05 GOON;2970-- ACT,,ATRIB(7)E.2.OR.ATRIB(7).Eg.4,AW15;2980= ACT, ,ATRIB(7) .EL.3,AW28;2990= ACT,,ATRIB(7).Eg.5,GNO6;3000:;3010z; URC BRANCH3020:AN15 AWAIT(16),CARGAGNT/1;3030: ACT,USERF(19);3040=FR46 FREE, CARGA6NT/ 1;3050: ACT,IX(56),ATRIB(4).GT.0,AS18;3060= ACT,,ATRIB(5J.GT.0,AW2I;3070-;3080:-; VEHICLE PROCESSING BRANCH3090:AS18 ASSION,ATRIB(7):USERF(15),ATRIB(B)=USERF(26);3100: ACT,XX(56),ATRIB(7).GT.0,AN16;3110: ACT,ATRIB(9),ATRIB(8).GT.0,AWI7;3120--;3130:; WASHRACK3140=AHI6 AWAIT(17),ALLOC(6);3130: ACT,,ATRIB(7).GT.0,AW16;3160: ACT,USERF(33);3170zFR47 FREE,WASHRACKII;3180:- ACT,IX(57);
1 :so

3190=;3200--; OTHER VEHICLE PROCESSING3210=AW17 4RAITtI8),ALLOC(7);3220:- ACT,,ATRIB(8).6T.0,AN17;3230z ACT,USERF(34);3240=FR48 FREE, VEHPROCS/ 1;3250z ACT,XX(65);3260=;3270:; PARKING LOT3280=AWI8 AWAIT(19),VEHPARK/l;3290=;3300:; JOINT INSPECTION3310:AW19 AVAIT(20),JITEAN/1;3320: ACT, USERF (22);3330=FR27 FREE, JITEANII;3340=AS22 ASSIGN,ATRIB(7)=USERF(231;3350=;3360:; VEHICLES PASSING INSPECTION3370= ACT,USERF(24),ATRIB(7).ED.O,FR28;338W-;3390:; FRUSTRATED VEHICLES3400: ACT,11(63),ATRIB(7).E9.I,AW2O;3410= AC7,%X65),AlRIB(7).EQ.2,AWI7;3420=AW2O AWAIT (21) ,NASHRACK/ 1;3430a ACT,USERF(33);3440=FR29 FREE,NASHRACK/ 1;3450= ACT,XX(63),,AW19;3460=FR2S FREE, VEHPARK/ 1;3470: ACT,USERF(7);3480=TRIS TERM;3490=;3500z; NON-VEHICULAR CARGO BRANCH3510=AW2I ANAIT122) ,NARSFORK/1;3520: ACT, USERF (35);3530=AW22 ANAIT(23),ALLOC(I0I;3540= ACT,,ATRIB(5 .GT.0,AW21;3550: ACT,...FR3O;3560=FR30 FREE,MARSFORK/1, I;3570c ACT,,DRAND(3).LE.XXC32),AN23;3580: ACT1,,25;3590z;3600:; AWAIT JOINT INSPECTION3610=AV23 ANAIT(24) ,JITEARII;3620=AS24 ASSIGN,ATRIB(3):USERF(25),ATRIB(5)zl;3630:- ACT, USERF (29);3640=FR3I FREE,JITEAM/I;3650:;36602; AFTER INSPECTION COMPLETE3670:; SORT PASSES FROM FAILS36802- ACT, ,ATRIB3) .EQ.I,AN25;3690. ACT,USERF(32) ,ATRIB(3).E.0,AW24;3700c;

j70; FRUSTRATED CARGO FRANCH
7730= ACT,XX(72);3740=FR34 FREE,MARSFORK/1;3750=FR55 FREEMARSAREA/ATRIB(S);
3770: ACT,USERF(30);3780:FR35 FREE,FRUSTCARII;3790=AW27 AWAIT(28) ,MARSFORK/1;3800= ACT,XX(72);3810=FR36 FREE,flARSFORK/1;3820=AW38 AWAIT(39),ALLOC(10);3830: 4CT,,,AW23;3840=;
380; NON-FAILED PALLETS3860zAW24 AWAIT(25) 1NARSFORK/1;3870z ACT, USERF (35);3880=FR32 FREE, MARSFORK/ 1;38q0=FR33 FREEMARSAREA/ATRIB(B);3900= ACr,USERF(38),,TRIS;3910=;3920:; OFFBASE NRC BRANCH3930=6N06 G0ON;3940= ACT,,XX(76) .Eg.1,AW28;3950= ACT,,XX(76).Eg.0,AW30;3960=AW28 AWAIT(29),ALLOC(8);3970= ACT,,ATRIB(5).GT.0,AW28;3980= ACT.,.'AW29;3990:-AW29 AWAIT(30) ,NRCAGENT/1;.4000: ACT, USERF (36);4010:FR37 FREE,NRCAGENT/l;4020=AS28 ASSIGN,ATRIB(5)=:14030=FR38 FREE,NRCRECPT/ArRIO(8);4040r:AW3O AWAIT(31) ,TERMFORK/W;4050: ACT,USERF(-35);4060:AW31 AWAIT(32),ALLOC(10);4070: ACT, ,ATRIB(5).6T.0,AW30;4080- ACT... FR39;4090=FR3j9 FREE, TERMFDRK/1;4100:A032 AWAIT(33) ,PALTEAM/1;4110: ACT,USERF(18);4120=FR4O FREE, PALTEAM/1;4130: ACT,USERF(32);4140=AW33 AWAIT(34) ,TERMFORK/1;4150s ACT,USERF(35);4160=FR41 FREEJ ERMFORK/1;4170=FR42 FREE MARSAREA/ATRIDB8);4180s ACT,uSERF(38);4190sTR16 TERM;4200:;42.10:; EXPLOSIVES4220=4#37 AWAIT(38) ,EXFORK/1;
132

4230= ACT,USERF(37);4240=AW34 AWAIT(35),ALLOC()1);42j0= ACT,,ATRIB(6).6T.0,AW37;4260= ACT...FR43;4270=FR43 FREE, EXFORKI 1;4280=AW35 AWAIT(736) ,PALTEAflhI;4290= ACT,USERF(31);4300:FR44 FREE,PALTEAMII;4310= ACT,USERF(27);43240=AW36 AWA1H(37),EXFORK/1;4330= ACT,USERF (37);4340=FR45 FREE,EXFORK/1;4350=FR50 FREE,EXMARSIATRID(B);4360 ACT,USERF(39);4370=TRI7 TERM;4360= END NETWORK4390:INIT, 0,720;4400=FIN;44 10=*EOR

FORTRAN SUBROUTINES
100= PROGRAM MAIN UINPUT,OUTPUT,TAPES=INPUT.TAPE6=OUTPUT,TAPE7)110=C
I O=C
140=C MAIN PROGRAM IS USED TO INCREASE DIMENSION OF
150=C NSET/ OSET TO 30000160=C170=C180= DIMENSION NSET70000)190= COMMON/SCODI/ ATRIB(100),DD(100),DDL(100),DTNOW,[I,MFA,NSTOPNCLNR200= tNCRDR,NPRNT,NNRUN,NNSETNTAPE,SS(100),SSL(100),TNEXT,TNOW,XX(I(0)210= COMMON QSET(70000)220= EQUIVALENCE (NSET(1),QSET(1))230= NNSET=70000240= NCRDR=5250= NPRNT=6260= NTAPE=7270= CALL SLAM280= STOP290= END300=C
320=C330=C340= SUBROUTINE EVENT(I)350= DIMENSION NSET(70000)760= COMMON ISCOMI/ ATRIB(100),DD(100),DDL(100I,DTNOW,II,MFA,370= +MSTOP,NCLNR,NCRDR,NPRNT,NNRUN,NNSET,NTAPE,380= +SS(100),SSL(100),TNEXT,TNOW,XX(I00)390= COMMON QSET(70000)400= EQUIVALENCE (NSET(1),QSET(1))410= INTEGER NPAX,ALD,EAD,LAD,TYPENA20= INTEGER VEHSTON,BULSTON,OVRSTON,OUTSTON,EXPSTON
430= REAL A(9)440=C450=460= 60 TO (1,2,3,4,5,6),I470=C*,********n!h***.,I.**I*II*II*4*H lIII*H *I****I,.It iilltt ~~l4*##4480=1 CONTINUE490=C *fEVENT I TAKES THE INPUT FROM TPFDD DATA CARDS AND AFTER THE500=C NEEDED MANIPULATIONS ARE DONE INSERTS THE ENTITIES INTO510=C SLAM FILE #1 FOR SORTING. FILE #I IS THEN EMPTIED ONTO520=C DISC STORAGE AS FILE 'TAPEBO' AND READ IN PERIODICALLY BY530=C EVENT(2).540=C
550=C *#THE PROCESS WILL CONTINUE UNTIL ALL RECORDS HAVE BEEN READ.560=C570=0580=C N IS INITIALIZED HERE, IS USED AS A COUNTER IN EVENT(2)
134
---- v--

,9(1= N z-060,)C610=100 READ(60,50,END=200) BULSTON,0VRSTON,OUTSTON,NP HX,EIPSTON,
o2 )= + ALD,EAD,LAD,TfPE630= IF(I1(99) .EQ.1)PRINT50,BULSTON,GVRSTGNCUTSTO0N,NPAX,EXPSTON,640= ALD,EAD,LAD.TYPE
670=C i'ATRIB(t) IS THE ARRIVAL TIMlE AT THE APOE.680= XXlli = ALD f 24690= XX(21) = X(1) +24700= Ati) = UNFRM(XX(I),XX(2),i)710=C720=C ffATRIB(2) IS THE EXPECTED DEPARTURE TIME.730= 11(1) =A))) + 11(10)740= XX(4) =(BULSTONi+OVRSTON+OUTSTON+EXPSTON) *.03750= XX(5) = (EAD * 24) - XX(10)
760: XX(1) = MAX(XX(1),XX(4),XX(5))770: XX(2) = (LAD # 24)+24 - XX(3)
780= A(2) = UNFRe,(XX(1),XX(2),1)790=C800=C #*ATRIB(3) IS THE NUMBER OF PASSENGERS810= A(3) = NPAXB20:C830=C 41ATRIB(71 IS THE TYPE OF UNIT
840= A(7) = TYPE850=C860=C *111(23) IS NON-EXPLOSIVE CARGO TONS.870= XX(23) = BULSTON + OVRSTON + OUTSTON880=C890--C '*11(21) IS THE VEHICULAR STON ESTIMATE900=C THE USER DETERMINES BY XX(52) WHICH ESTIMATION METHOD TO USE.910: IF (XX(52).EQ.0) THEN920= IF(A(7).EQ.2.OR.A(7).E9.4) X1(21) = .75 f X1(23)930m IF(A(7).EQ.3.OR.A(7).EQ.5) XX(21) = .1 f XX(23)940: IF(A(7).EQ.I) XX(21) = 0.0950= ELSE IF (XX(52).Eg.1) THEN960= XX(21) = DYRSTON + OUTSTON970= ELSE980= END IF990=C1000=C #*X1(22) IS THE NON-VEHICULAR, NON-EXPLOSIVE STUN ESTIMATE1010= XX(22) = XX(23) - XX(21)
1020=C1030=C 44ATRIB(4) IS THE NUMBER OF VEHICLES1040= A(4) = NINT(XX(21)/1XX(53))1050--C1060=C f*ATRIB(S) IS THE NUMBER OF PALLETS1070= A(S) = NItIT(XX(22)/X(54))1080=C1090=C *#ATRIB(6) IS THE NUMBER OF EXPLOSIVE PALLETS1100: A(6) = NINT(EXPSTON/XX(80))
1 35

ll0=C i#THE TRACE, 75 ACTIVATED BY %X(?9) =1, WILL PRINT THE ARRAylifO: IF(IX(99).E .I)FRINT 1 0 A I , ( ) A , ( ) A 5 , i ) A 7
I14C=170 F2RMAT'lX,7(IXF7.2))
11 69=C1 ! 60)C
1170=C t#WITH ALL ATRIBUTES DEFINED, THE ENTITY IS FILED AWAf1120= CALL FILE~tI,A)
1200=C "RETURN TO DO THE NEXT ENTITY1210= 60 TO 1001220=C1230=C "4END OF FILE TRIGGERS 2001240z200 CALL RMOVEt1,I,A)1250= DO 77 1=1,7
1260= WRITE 180,) AT1)1270=77 CONTINUE120= IF (NNQ(1).GE.I) 60 TO 2001290= REWIND 801300= RETURN1310=C1320=CI 770=C
1340:C4*l*#~l**Ill+1#f***1**lflln l41tIn ll*l **f**llH*tlIll*lIl
1350=C **EVENT 2 PULLS THE ENTITIES OUT OF FILE I AS THEIR ARRIVAL TIMES
1360=C APPROACH. FILE I IS RANKED LVF ON ATRIBP(), THE ARRIVAL TIME,1370:C AND IS REPLENISHED WITH FRNS PULLED FROM THE INCOMING13MO=C FRN LIST PREVIOUSLY WRITTEN TO TAPESO BY EVENT(I). THE
1790=C IDEA IS TO KEEP AT LEAST FIVE BUT NO MORE THAN 50 FRNS1400=C IN FILE I AT ALL TIMES, UNTIL THERE ARE NO MORE COMING.1410=C1420=2 IF (NhQ 1).LE.5.AND.XX(95).EQ.0) THEN1430= DO 78 K1,501440= DO 79 1=1,71450= XX(95) = 11460= READ (80,',END=210) A(I)1470= XX(95) z 01480=79 CONTINUE
1490= CALL FILEM(I,A)1500= N = N + 11510=78 CONTINUE1520=210 IF(XX(95).ED.1) THEN1530= PRINT*,N,' FRNS LOADED INTO FILE I AT',TNOW
1540= END IF1550= END IF1560= IF(NNG(I).EQ.0) RETURN1570= CALL RMOVE(I,1.ATRIB)1580=C1590=C "THE TIME REMAINING TO ARRIVAL IS COMPUTED AND PLACED INTO1600=C ATRIB(I), AND USED AS THE DURATION OF THE LEAD IN ACTIVIT Y1610= ATRIB(I) = ATRIB(1) - TNOW
1620= RETURN
136

1o40:Ct9f4t9h9**9t*******99*********99*9**949999*9*9**9***9*s~e9*.**9**s94
Io5:=C **THE NEW FIRST ENTITY'S ATRIBUTES ARE COPIED INTO ATRIBlb0-C SO WE CAN DETERMINE WHEN IT WILL ARRIVE1670=3 IF(NNQ(I).EQ.O) RETURN1690= CALL COP4(I.1,ATRIB)1690= ATFIB(1) = ATRIB(lh - TNOW17C,0= RETURN
1710CI720=C,*9 * 9 9 999499.9 949999 *99$99494494 949 9999 9999944 949 99 999*9
1730=C EVENT 4 FREES THE RECEPTION POINT1740=4 II=MA(AXTRIB(4),ATRIB(5),ATRIB(b))1750= CALL FREE(2,11)1760= RETURN1770=C
1790:C EVENT 5 FREES THE APPROPRIATE BILLET AREA FEEDING RESOURCE, AND1800=C CALCULATES THE NUMBER OF BUSES THIS GROUP NEEDS (ATRIB(7)).1810=5 II=ATRIB(8)1820= IF(ATRIB(4).GT.0) CALL FREE(7,11)1B30= IF(ATRIB(5).GT.O0 CALL FREE(8,II)1840= iF(ATRIB(6).6T.0) CALL FREE(9,11)
1850= ATRIBi7) = USERF(11)1860= ATRIB(G) = 01870= RETURN1880=C
1900=C EVENT 6 FREES THE BILLETING AREAS, USING THE SAME LOOPING1910=C EMPLOYED TO ALLOCATE IT IN ALLOC(1)
1920=6 II=MAX(ATRIB(4),ATRIB(5),ATRIB(6))1930= DO 15 J=4,61940= IF(ATRIB(J).6T.0) CALL FREE(J+6,11)1950=15 CONTINUE1960= RETURN1970=C1980= END1990C
201042020=C2030C SUBROUTINE INTLC INITIALIZES THE XX(.) ARRAY2040=C TO 0.0, THEN SETS CERTAIN VARIABLES TO USER-2050=C DEFINED VALUES2060=C ALL TIMES ARE IN HOURS.2070=C2080= SUBROUTINE INTLC2090= DIMENSION NSET(70000)2100= COMMON ISCOMII ATRIB(100),DD(100,DDL(IOO),DTNOW,II,MFA,
2110= +MSTOP,NCLNR,NCRDR,NPRNT,NNRUN,NNSET,NTAPE,2120= +SS(I100),SSL(I00),TNEXT,TNOW,XX(10)2130= COMMON QSET(70000)2140= EQUIVALENCE (NSET(1),gSET(l))
137

ZI1 61=C
2170=C **THE ENTIRE IX(.) ARRAY IS FIRST SET TO 0.0*.1,B0 Do Ij 1=1.100
290= 11(1) = 0.02200=C2210=C *#THEN CERTAIN VARIABLES ARE SET TO USER- DEFINED VALUES#*2220=C2230=C X X(t) THRU XX(2) INTERNAL USE2240=C2250=C ii XX(3) = FLIGHT TIME TO THE COMBAT THEATER
2260: 1X(3) = 12.02270=C2280=C *# XX(4) THRU XX(5) INTERNAL USE2290=C2300K0 ii XX(6) : THE EARLIEST TIME PRIOR TO DEPARTURE THAT2310=C BILLETED FRNS MAY REPORT TO PAX STAGING2320= XX(6) = 8.02330=C2340=C ** XX(7) NOT USED2350=C2360=C * XX(8) 15 THE MINIMUM TIME BEFORE DEPARTURE TO2370=C JUSTIFY ALLOCATION OF BILLETING2380= xx(8) z 18.0239=C2400=C 4 1X(9) NOT USED2410=C2420=C * XX(10) = MINIMUM TIME TO PREPARE AN FRN
2430= XX(10) = 8.02440=C2450=C f XX(II) : PERCENTAGE OF VEHCILES NEEDING WASHING UPON ARRIVAL
2460= XX(II) = .752470=C2480= ** X(12) z TIME BEFORE DEPARTURE TO TURN VEHICLES INTO PROCESSING2490: XX(12) : 8.02500=C2510C f# XX(13) = TRANSIT TIME FROM RECEPTION TO VEHICLE PROCESSING
2520= IX(131 = .325"0=C2540=C 411XX(14) INTERNAL USE2550:C2560=C ** XX(15) = PERCENTAGE OF VEHICLES PASSING JOINT INSPECTION.2570: XX(15) : .952580C2590=C ## XX(16) z PERCENTAGE OF FAILED VEHICLES FAILING FOR WASHING2600= XX(16) : .752610:C2620:C 44 1(17) = PERCENTAGE OF PALLETS PASSING JOINT INSPECTION2630= X1(17) : .962640=C2650=C **XX(18) = TIME BEFORE DEPARTURE TO LOAD EXPLOSIVES ON K-LOADER2660: 1X(18) : 1.0
138
L3-- - - " iii . . . . . - 'ii'~i1 . . . . .. . . . . . . l .. . .

2670=C2630=C 4' X1119) TIME BEFORE AIRCRAFT LOADING TO PUT CARGO ON K-LOADER
2690= XX(19) = 1.02700=C
2710=C ti XX(20) = PERCENTAGE OF FRNS WHICH HAVE THEIR OWN TRANSPORTATION
2720= XX(20) = .5
2740=C ii XX(21) THRU XX(23) INTERNAL USE
2750C2760=C ii XX(24) THRU XX1(25) NOT USED2770=C2780=C ii XX(26) = DURATION RECPOINT TO TRABILI2790= XX(26) = .172800=C2810C ** XX(27) = DURATION RECPOINT TO TRABIL22820= %X(27) = .278304C2840=C i* XX(28) = DURATION RECPOINT TO TRABIL32850= XX(28) = .332860=C2870=C ti 1X(29) THRU 1X(30) NOT USED2880=C2890C 4* XX(31) = TRANSPORTATION TIME TO EXPLOSIVE AREA2900= XX(31) = 1.02910= C
2920=C ** XX(32) z PERCENTAGE OF UNIT PALLETS PASSING INITIAL INSPECTION.2930= 1X(32) : .52940=C2950:C * XX(33) THRU XX(35) NOT USED2960=C2970=C *4 XX(36) = DURATION TRADILI TO PAY STAGING2980= XX(36) z .222990=C3000=C * X1(37) = DURATION TRABIL2 TO PAX STAGING3010= XX(37) = .253020=C3030C i XX(38) = DURATION TRABIL3 TO PAX STAGING3040: XX(38) : .333050:C3060:C **(39) THRU XX(41) NOT USED3070=C3080C i XX(42) = DURATION RECPOINT TO PAX STAGING
3090: XX(42) = .253100C3110=C * XX(43) = TYPE TRANSPORT PAX STAGING TO TERMINAL3120= XX(43) = 03130C3140=C 9 XX(44) = DURATION PAX STAGING TO TERMINAL
3150= XX(44) = .033160=C3170=C ti XX(45) = EARLIEST TIME BEFORE DEPARTURE FRNS WILL
139

3180=C MOVE TO TERMINAL3190= XX(45) = 4.03200=C3210=C XX(46) = PERCENT OF AIRCRAFT PARKING SPOTS WITHIN WALKING3220=C DISTANCE OF THE TERMINAL
3230= XX(46) = .603240=C3250=C 4. XX(47) = ROUND TRIP TRANSPORT TIME TO AIRCRAFT VIA BUS3260: %1(47) = .333270C3280=C *4 XX(48) NOT USED3290=C3300=C #4 XX(49) = DURATION TERMINAL TO AIRCRAFT BY FOOT3310= XX(49) = .253320=C3330=C ti XX(50) = TYPE TRANSPORT MOBILITY LINE TO PAX STAGING3340C (FOR ONBASE DEPLOYING PERSONNEL)3350= XX(50) = I3360=C3370=C * XX(51) = DURATION MOBILITY LINE TO PAX STAGING3380= XX(51) = .53390=C3400C XX(52) IS A SWITCH. IF SET TO 0, THE MAC I ARE USED IN ESTIMATING3410=C THE VEHICULAR CARGO (80% OF URC, 10% OF NRC). IF SET TO I, THE3420=C TOTAL OF OVERSIZE AND OUTSIZE CARGO IS CONSIDERED TO BE VEHICULAR.3430: X1(52) = 03440=C3450=C 44 XX(53) = AVERAGE VEHICLE WEIGHT IN SHORT TONS3460= XX(53) = 3.253470=C3480=C .4 XX(54) = AVERAGE PALLET WEIGHT IN SHORT TONS
3490= 11(54) = 1.73500=C3510=C *4 XX(55) NOT USED3520=C3530=C 44 XX(56) = VEHICLE TRANSIT TIME FROM THE RECEPTION POINT3540=C TO THE WASHRACK3550= XX(56, = .05350=C
3570C 44 XX(57) = VEHICLE TRANSIT TIME FROM WASHRACK TO VEHICLE3580C PROCESSING AREA35902 fX(57) = .053600=C3610=C 44 XX(58) THRU XX(62) NOT USED3620=C
3630=C *4 XX(63) = TRANSIT TIME FROM JOINT INSPECTION 01) TO WASHRACK3640= X(63) = .033650C
3660=C X* XI(64) NOT USED3670C3680= IX(65) x .053690=C 4* XX(65) x TRANSIT TIME FROM VEHPROC TO VEHPARK
140
_ _ - _--ll

3700=C3710=C ** 1166) THRU XX(71) NOT USED3720=C3730=C ## XX(72) = TRANSIT TIME JI TO FRUSTRATED PALLET PROCESSING3740: XX(72) v .053750403760=C Ii 1(73) THRU XX(74) NOT USED37704C3780=C *# 1(75) = TRANSIT TIME NRC RECEPTION' PT TO NRC TERMINAL3790: X1(75) = .2538004C3810=0 *t 1(76) IS A SWITCH- I= ONBASE NRC IS PROCESSED BY SURFAC E3820=C FREIGHT SECTION, 0= NOT3830= XX(76) =3840=C385040 i 1(77) THRU X1(79) NOT USED3860=C387040 ## 11(80) IS THE AVERAGE EXPLOSIVE PALLET WEIGHT3880: 11(80' = 4.0')890=C3900=0 1' 1(81) THRU 11(86) STATISTICS COLLECTION3910=C392040 ft (87) THRU XX(94) NOT USED3930=C3940:0C I 11(95) IS USED IN EVENT(2), MUST BE LEFT EQUAL TO ZERO.3950403960--L .1 1(96) THRU 11(97) NOT USED3970403980 W ft XX(98) INTERNAL USE3990404000=0 f 11199) IS THE TRACE SWITCH: O=OFF, 1=ON4010= 11(99) : 04020:- RETURN4030= END4040404050'-C4060:0
4080= FUNCTION USERF(I)40902c410040 USER FUNCTIONS DETERMINE VARIOUS PROCESSING4110=0 TINES AND FRN CHARACTERISTICS, BASED ON412040 TRANSIT TINES, RANDOM SELECTIONS, AND USER4130:0 PROVIDED PROBABILITY ESTIMATES. ALL TINES4140=C ARE EXPRESSED IN HOURS AND DISTRIBUTIONS4150=0 USED FOR RANDOM SELECTIONS ARE INDICATED416020 IN THE CODE.4170404 180204190= DIMENSION NSET(70000)4200: COMMON 1500M1/ ATRIB(I00),DD(100),DDL(100),DTNOW,II,MFA,4210: *NSTOP, NCLNR, NCRDR,NPRNT, NNRUN,NNSET,NTAPE,
14 1

4220= +SS(I00),SSL(IOO),TNEXT,TNOW,XX(I00)4230= COMMON QSET(70000)4240= EQUIVALENCE (NSET(P ,QSET(I))4250=C4260= GO TO (1,2,3,4,5,6,7,8,9,10,11,12,13,14,15,16,17,I8,19,20,21,4270= +22,23,24,25,26,27,28,29,30,31,32,33,34,35,36,37,38,39,40),I4280=C4290=C THESE ALGORITHMS, PREPARED FOR DEMONSTRATION OF THE MODEL, CAN BE4300C ALTERED TO REFLECT THE USER'S SYSTEM OPERATION. THE VARIOUS4310=C USERFS SHOWN HERE DEMONSTRATE SEVERAL APPROACHES APPLICABLE TO4320C A TYPICAL RECEPTION SYSTEM.4330=C
4350=C USERF(I) IS THE INPROCESSING TIME FOR OFFBASE DEPLOYING4360=C PERSONNEL.4370=C4380=1 USERF = TRIAG(.25,.5,1.0,2)4390= iF (XX(99).EQ.I) PRINT*,'USERF(I) = ',USERF,' AT TNOW = ',TNOW4400= RETURN4410=C
4430=C4440=C USERF(2) CALCULATES THE TIME REMAINING BEFORE THE FRN IS4450=C SCHEDULED TO ENTER THE PAX STAGING AREA. THIS IS DRIVEN BY THE4460=C SCHEDULED DEPARTURE TIME, THE EARLIEST TIME BILLETED FRNS MAY4470=C REPORT TO THE PAX STAGING AREA, THE TRANSIT TIME FROM THE4420=C RECEPTION POINT TO THE PAX STAGING AREA, AND THE CURRENT TIME.4490=C4500:C4510=2 USERF = ATRIB(2) - TNOW - XX(6) - XX(42)4520= IF (USERF.LT.0) THEN4530= USERF = 04540= END IF4550= IF (%X(99).Eg.%) PRINT*,'USERF(2) = ',USERF,' AT TNOW ',TNOW4560= RETURN4570=C
4590=C4600=C USERF(3) THRU (5) CALCULATE THE NUMBER OF BUSES NEEDED. THESE4610C CALCULATIONS ARE DRIVEN BY THE NUMBER OF PERSONS BEING SENT TO4620=C EACH OF THE BILLETIN6 AREAS, AS REFLECTED BY ATRIBUTES 4-6.4630=C THE ALGORITHM ASSUMES THAT EACH UNIT OF 'BUS' RESOURCE IS A4640=C 40 PAX BUS. ANY FRACTION OF A SINGLE BUSLOAD WILL BE GIVEN A BUS.4650=C4660=C THE ALGORITHM USES INTEGER DIVISION, KEYING ON THE APPROPRIATE4670=C ATRIBUTE VALUE AND THE ASSUMPTION THAT EACH BUS HAS A NORMAL46802C CAPACITY OF 40. AFTER DIVIDING THE ATRIBUTE BY 40, IT ADDS I4690:C TO PUSH THE FIGURE OVER THE NEXT INTEGER IF THERE IS LESS THAN4700-C A FULL BUSLOAD. IT THEN TRUNCATES THE DECIMAL PART,4710xC RETURNING THE INTEGER VALUE.4720-C4730=C
142

4740=3 USERF :INT(ATRIB(4)/40 + 1)4750= IF IIX(99).EQ.I) PRINT#,'ATRIB(4) ',ATRIB(4),' USERF =',USERF4760= RETURN4770=C4780=C4790=4 USERF = INT(ATRIB(5l/40 + 1)4800= IF (IX(99).Eg.1) PRINT*,'ATRIB(5) :',ATRIB(S),' USERF =',USERF4810= RETURN4820=C4830=C4840=5 USERF = INT(ATRIB(6)/40 + 1)4850= IF (XX(99).EG.I) PRINT*,'ATRIB(&) :',ATR1B(6),' USERF :',USERF4860: RETURN4870=C
4890=C USERF(6) COLLECTS PASSENGER STATISTIC4900=6 IF(ATRID(2).LT.TNON)XlfBI) = 11(8I) + ATRIB(3)4910= IF(ATRIB(2).6E.TNOW)IXCG2) = XX(82) + ATRIB(3)4920: USERF = 04930= RETURN4940=C4950=C4960=C USERF(7) COLLECTS VEHICLE ON TIME PERCENTAGE4970=C4980=7 IF(ATRIB(2).LT.TNOW)XX(84) = XX(84) + XX(53)4990= IF(ATRIB(2).GE.TNON)XX(B5) = X1(85) + XX(53)5000= USERE 050102C5020: RETURN5030--C
50502C5060=C USERF(8) CALCULATES THE TIME THAT THE FRN HAS REMAINING IN THE5070mC TRANSIENT BILLETING AREA. THIS FIGURE iS DRIVEN BY THE SCHEDULED5080--c DEPARTURE TIME, THE CURRENT TIME, THE EARLIEST TIME TO5090--c ENTER PAX STAGING, AND THE TRANSIT TIME FROM EACH5100=C BILLETING AREA TO THE PAX STAGING AREA.5110=C NOTE THAT WHEN AN FRN IS SPLIT AMONG SEVERAL AREAS BY ALLOCCI),5120--C IT IN EFFECT BECOMES SEVERAL FRNS. EACH HAS THE SAME5130=C CHARACTERISTICS (DEPARTURE TIME,ETC), BUT FROM THIS POINT5140--C ON THE TOTAL PAX FIGURE (ATRIB(3)) IS MEANINGLESS UNLESS5150mC THE FRN DID NOT GO THROUGH BILLETING.5160=C5170--B IF (ATRIB(4).GT.0) THEN5190= USERF = ATRIB(2) - TNOW - XX(6) - 11(36)5190: ELSE IF (ATRIB(S).GT.0) THEN5200= USERF = ATRIB(2) - TNOW - 11(6) - XX(37)5210z ELSE IF (ATRIB(6).GT.0) THEN5220= USERF =ATRIDC?) - TNOW - 11(6) - X1(38)5230: ELSE5240: USERF =ATRIB(2) - TNOW - XX(6)5250m END IF
143

5260= IF (USERF.LT.0) THEN5270= USERF = 0.05280= END IF5290= IF (XX(99)EQ.1) PRINT*,'TIME LEFT IN BILLETING = ',USERF5300= RETURN53102C
5330=C5340=C USERF(9) CALCULATES THE PROCESSING TIME NEEDED IN PASSENGER5350C STAGING.5360=C5370=9 USERF = ATRIB(3) * .008 + .155380= IF(XX(99).EQ.I)PRINT#,'USERF(9) = ',USERF,' AT ',TNOW5390= RETURN5400=C54 IOZC**illll~itI*I**f*f***#*4***I****I*tI**t4f**I**fIf***H**iti~tlilt.**
5420C5430C USERF(I0) CALCULATES THE TIME REMAINING IN PAX STAGING UPON5440=C COMPLETION OF PROCESSING. THIS IS DRIVEN BY THE SCHEDULED5450=C DEPARTURE TIME, THE EARLIEST TIME FRNS MAY REPORT TO THE PAX5460=C TERMINAL, AND THE TRANSIT TIME FROM PAX STAGING TO THE TERMINAL.5470C5480C NOTE THAT THIS IS A FUNCTION OF THE PARAMETER ESTABLISHED BY THE5490=C USER IN XX(45), THE EARLIEST TIME AN FRN MAY GO TO THE TERMINAL.5500=C THEREFORE, IF XX(45) IS SET VERY LARGE, THE FRNS WILL BE MOVED TO5510=C TERMINAL SOONER THAN IF IT IS SMALL. AS A CONSEQUENCE, MORE OF5520=C THEM WILL BE UNABLE TO MAKE THIS MOVE ON SCHEDULE, DOE TO EARLIER5530=C DELAYS. HOWEVER, BY SETTING XX(45) TO A LARGE VALUE, THERE IS A5540=C GREATER AMOUNT OF SLACK IN THE TERMINAL AREA, AND IT IS VERY5550=C LIKELY THAT AN FRN COULD SHOW UP AS 'LATE' GETTING TO THE5560=C TERMINAL, BUT STILL MAKE ITS SCHEDULED DEPARTURE.5570=C5580=10 USERF = ATRIB(2) - TNOW - XX(45) - XX(44)5590= IF (USERF.LT.0) THEN
5600: USERF = 05610: END IF5620= IF(XX(99).EQ.1) PRINT*,'USERF(IO) ',USERF5630: RETURN5640C
5660=C5670-C USERF(II) CALCULATES THE NUMBER OF BUSES NEEDED BY THIS GROUP.5680=C5690:11 II = MAX(ATRIB(4),ATRIB(5),ATRIB(6)I5700: IF(II.EQ.0) II = ATRIB(3)5710= USERF : INT(II/40.O + 1)5720= IF (XX(99).EQ.1) PRINT#,'II = ',II,', USERF(II) = ',USERF5730= RETURN5740C
57604C
5770C USERF(12) CALCULATES THE PROCESSING TIME NEEDED IN THE PASSENGER
144
-~r-- ~ - -

5780=C TERMINAL.5790=C5800=12 1X(7) = ATRIB(3) * .008 + .155810= USERF = MIN(2.0,Xl(7))5820= IF(IX(99).EQ.1) PRINT*,'USERF(12) = ',USERF,' AT ',TNOW5830= RETURN5840=C
5860=C5870=C USERF(13) CHECKS TO SEE WHERE AN FRN IS 60IN6 AND5880=C ASSIGNS THE APPROPRIATE TRANSIT TIME FROM THOSE PREVIOUSLY5890=C ESTABLISHED BY THE USER IN THE XX(.) ARRAY.5900=C5910=13 IF (ATRIB(4).GT.0) USERF = XX(26)5920= IF (ATRIB(5).GT.0) USERF = 1X(27)5930= IF (ATRIB(6).GT.0) USERF = XX(28)5940= IF (XX(99),EQ.I) PRINT*,'USERF(13) = ',USERF5950= RETURN5960=C
59B0:C5990=C USERF(14) CHECKS TO SEE FROM WHICH AREA AN FRN IS COMING, AND6000=C ASSIGNS THE APPROPRIATE TRANSIT TIME ESTABLISHED BY THE6010=C USER IN THE IX(.) ARRAY.6020:C6030=14 IF (ATRIB(4).GT.0) USERF = XX(36)6040= IF (ATRIB(5).GT.C. USERF = 14(3716050= IF (ATRIB(b).GT.0) USERF = XX(38)6060= IF (%1(99).EQ.1) PRINT*,'USERF(14) = ',USERF6070= RETURN6080=C
6100=C6110C USERF(15) DETERMINES THE NUMBER OF VEHICLES IN AN FRN6120=C WHICH WILL NEED WASHING UPON ARRIVAL.6130=C6140=15 USERF = NINT(ATRIB(4) * XX(1l))6t50: IF(XX(99).EQ.I)PRINTI,'USERF(15) = ',USERF,' AT ',TNOW6160= RETURN6170:C61 80:CHI*ee*ee*e~e*e*~~~,***i*I**I.*,u..,..,.,.H..,.,,4.,,,I,.,,,,,,,n,.,,,
6190=C62002C USERF(16) AND (17) CALCULATE THE TIME REMAINING IN THE TERMINAL6210=C FOLLOWING THE COMPLETION OF FINAL PROCESSING. THE FIRST IS USED6220=C FOR THOSE FRNS WHO WILL BE WALKING TO THEIR AIRCRAFT, AND THE6230=C SECOND FOR THOSE WHO WILL REQUIRE BUS TRANSPORT. NOTE THAT THESE6240=-C FACTORS ARE SET BY THE USER AS PERCENTAGES IN XX146).6250=C THIS IS INCLUDED TO ALLOW FOR DIFFERENT AIRFIELD LAYOUTS, IN6260=C WHICH SOME PARKING SPOTS MAY BE CLOSE TO THE TERMINAL AND OTHERS6270=C ARE FAR AWAY. ALSO, POLICY CHANGES MAY BE MODELED. FOR INSTANCE,6280=C BASE I MAY DECIDE THAT IN GOOD WEATHER ALL AIRCRAFT WILL BE6290:C WITHIN WALKING DISTANCE, WHILE IN BAD WEATHER (SUCH AS WINTER)
145
6m

6300=C ONLY 2 OUT OF 10 (201) AIRCRAFT WILL BE PARKED WITHIN WALKINS6310=0 DISTANCE. EACH OF THESE POLICIES COULD BE EXAMINED FOR THE IMPACT6320=C ON THE BUS RESOURCE, AND WHETHER THE RESOURCES AVAILABLE WILL BE6330=C ENOUGH.6340=C6350=C IT IS POSSIBLE THAT ALL FRNS COULD BE ON SCHEDULE UP6360=C TO THIS POINT, AND STILL BE LATE REACHING THEIR AIRCRAFT DUE TO6370=C THE STRUCTURE OF THE MODEL. AN FRN WHICH IS TO BE BUSED TO THE6380=C AIRCRAFT WILL NOT PRESENT ITSELF FOR BUS ALLOCATION UNTIL XX(47)6390=C HOURS PRIOR TO ITS SCHEDULED DEPARTURE FROM THE SYSTEM, WHERE6400=C 1X(47) IS SET BY THE USER TO BE THE AVERAGE TRANSIT TIME BY BUS6410=C TO THE AIRCRAFT. THEREFORE, IF THE FRN NEEDS MORE BUSES THAN ARE6420C AVAILABLE AT THAT MOMENT, IT WILL BE SOMEWHAT LATE IN GETTING TO6430=4 THE AIRCRAFT. SINCE THE 'SCHEDULED DEPARTURE TINE' USED THROUGH-6440=C OUT THIS MODEL REFERS TO DEPARTURE FROM THE RECEPTION SYSTEM,6450=C (WHICH IS ACTUALLY THE FRN'S ARRIVAL AT THE AIRCRAFT), SOME DELAY6460=4 IS ACCEPTABLE SINCE THEY SHOULD BE LOADING SOME 1-2 HOURS PRIOR6470=C TO TAKE-OFF.6480=C6490=16 USERF = ATRIB(2) - XY(49) - TNOW6500= IF (USERF.LT.0) THEN6510= USERF=O6520= END IF6530= IF (XX(99).EQ.I) PRINT*,'USERF(16) = ',USERF,', TNOW ',TNOW6540= RETURN6550=C6560406570=17 USERF = ATRIB(2) - XX(47) - TNOW - (.4*ATRIB(7))6580= IF (USERF.LT.0) THEN6590= USERF = 06600= END IF6610= IF (XX(99).EQ.1) PRINTI,'USERF(17) = ',USERF,', TNOW = ',TNOW6620= RETURN66304"
6650=-C6660=C USERF(18) IS THE TIME TO BUILD AND INSPECT ONE PALLET.6670=18 USERF = TRIAG(.5,.75,1.0,2)6680= IF(XX(99).EQ.I)PRINT*,'USERF(I8) = ',LSERF,' AT ',TNOW6690= RETURN67004C
6720=C6730=-C USERF(19) CALCULATES THE CARGO INPROCESSING TIME, BASED ON THE6740=C TOTAL AMOUNT OF CARGO (ATRIB14)). THE TIME IS EIPRESSED IN HOURS.6750=C6760=19 USERF z TRIAG(.I,.6,1.25,2)6770= IF (Xl(99).EQ.I) PRINT#,'USERF(19) = ',USERF,' TIME = ',TNOW6780= RETURN6790=C
6810=C
146

6820=C USERF(20) DETERMINES IF UNIT RELATED PAX WILL HAVE THEIR OWN TRANSPORT6830=C6840=20 XX(98) : DRAND(4)6850= IF(1X(98).LE.XX(20)) USERF : 06860= IF(XX(98).6T.XX(20)) USERF = I6870= ZF(XX(99).EQ.I)PRINT,'USERF(20) = ',USERF,' AT ',TNOW6880= RETURN6890=C
6910=C6920=C USERF(21) DETERMINES HOW LONG UNITS MAY KEEP6930=C THEIR OWN VEHICLES BEFORE TURNING THEM OVER TO VEHICLE PROCESSING.6940:C6950=21 USERF : ATRIB(2) - TNOW - XX(12)6960= IF(USERF.LT.O)THEN6970= USERF = 06980= ENDIF6990z IF(XX(99).EQ.I)PRINT*,'USERF(21) x ',USERF,' AT ',TNOW7000= RETURN7010-C
7030=C7040=C USERF(22) IS THE VEHICLE INSPECTION TIME.7050=C7060=22 USERF = TRIAG(.06,.25,.33,2)7070= IF (XX(99).EU.1) PRINT*,'USERF(22) = ',USERF,' TIME = ',TNOW7080= RETURN7090=C
7110=C71204C USERF(23) DETERMINES IF VEHICLES PASS JOINT INSPECTION AND THE7130=C REASON FOR FAILURE.7140=C
7150=23 XI(98)=DRAND(4)7160= IF(XX(98).LE.XX(15))THEN7170= USERF = 07180= ELSE7190= XX(98) : DRAND(4)7200= IF(XX(98).LE.XX(16)) USERF z 17210= IF(XX(98).GT.XX(16)) USERF = 27220= ENDIF7230= IF(XX(99).Eg.I)PRINT*,'USERF(23) = ',USERF,' AT ',TNOW7240z RETURN7250=C
7270=C7280-C USERF(24) CALCULATES THE TIME LEFT IN THE PARKING AREA AFTER7290C JI IS FINISHED. IF THIS TIME IS NEGATIVE THE TIME IS SET TO
ZERO.7300=C7310=24 USERF = ATRIB(2) - TNOW7320c IF (USERF.LT.0) THEN
147

733): USEF=O
7340= END IF7350= IF (XX(99).EQ.1) PRINTI,'USERF(24) = ',USERF,' TIME ',TNOW7360= RETURN7370=C
7390=C7400=C USERF(25) DETERMINES IF A PALLET PASSES JOINT INSPECTION.7410=C7420=25 XX(99) = DRAND(4)7430= IF(XX(98).LE.XX(17))USERF = 07440= IF(XX(96).GT.XX(17))USERF = 17450= IF(XX(99).EQ.I)PRINT*,'USERF(25) = ',USERF,' AT ',TNOW7460= RETURN7470=C
7490=C750040 USERF(26) DETERMINES THE NUMBER OF VEHICLES IN AN FRN WHICH WILL7510=C NOT NEED NASHING.7520C7530=26 USERF = NINT(ATRIB(4) * (I-XX(Il)))7540= IF(XX(99).EQ.I)PRINT*,'USERF(26) = ',USERF,' AT ',TNOW7550= RETURN7560=C
7580=C7590=C USERF(27) DETERMINES THE TIME VhTIL PALETIZED EXPLOSIVES WILL BE7600=C LOADED ON A K-LOADER. THE DRAND(4) FACTOR STAGGERS THE PALLET7610=C LOADING SCHEDULE FOR LARGE FRNS.7620=C7630=27 USERF = AFRIB(2) - TNOW - XX(18) - DRAND(4)7640= IF(USERF.LT.0) THEN7650= USERF = 07660= END IF7670= IF (XX(99).E9.1)PRINT*,'USERF(27) = ',USERF,' AT 'qTNOW
7680= RETURN7690=C
7710=C7720=0 USERF(28) DETERMINES THE BUS DISPATCH TIME TO PICK UP PASSENGERS.7730C7740=28 USERF = TRIA6(0.0,.17,.33,2)7750= IF(XX(99).Eg.1) PRINT*,'USERF(28) = ',USERF,' AT ',TNOW7760= RETURN7770=
7790=C7800=4 USERF(29) IS THE PALLET INSPECTION TIME.7910C7820=29 USERF=TRIAfi(.08,.I65,.25,2)7830= IF (XX(99).Eg.I) PRINT*,'USERF(29) = ',USERF,' TIME = ',TNOW7840= RETURN
148

7850=C
7870=C788U=C USERF(30) IS THE TIME NEEDED TO REWORK FRUSTRATED PALLETS.7890=C7900=10 USERF=TRIAG(.25,1.0,2.0,2)7910= IF (XX(99).EQ.1) PRINT*.'USERF(30) = ',USERF,' TIME = ',TNOW7920= RETURN7930=C
7950=C7960=C USERF(31) DETERMINES THE TIME TO BUILD AN EXPLOSIVE PALLET.7970=C7980=31 USERF = TRIAG(.750I.0,1.J,.27990= IF (XX(99).EQ.1) PRINT*,'USERF(31) =',USERF,' AT ',TNOW8000= RETURN8010=C
8030=C8040=C USERF(32) CALCULATES THE TIME REMAINING IN MARSHALLING.8050=C8060=32 USERF = ATRIB(2) - TNOW - XX(19) - DRAND(4)8070= IF (USERF.LT.0) THEN8080= USERF = 0.08090= END IF8100= IF (XX(99).Eg.1) PRINT*,'USERF(32) = ',USERF,' TIME = ',TNOW8110= RETURN8120C
8140C8150=C USERF(33) IS THE VEHICLE WASH TIME.8160=33 USERF = TRIAG(.06,.25,.5,2)8170= IF(XX(99).EQ.I)PRINT*,'USERF(33) = ',USERF,' AT ',TNOW8180= RETURN8190=C
8210=C8220C USERF(34) IS THE VEHICLE PROCESSING TIME.8230=34 USERF = TRIA6(.06,.211.33,2)8240= IF(XX(99).EO.I)PRINTI,'USERF(34) : ',USERF,' AT ',TNOW8250= RETURN8260=C
8280=C8290=C USERF(35) IS THE TIME TO LOAD/UNLOAD ONE PALLET OF GENERAL CARGO.8300=35 USERF = TRIAG(.01,.0165,.06,2)8310= IF(XX(99).EQ.I)PRINT*,'USERF(35) = ',USERF,' AT ',TNOW8320= RETURN8330=C
8350:C8360=C USERF(36) IS THE TIME TO RECEIVE ONE PALLET OF CARGO IN THE
149

98370:C FREIGHT SEZTION.
8390=36 USERF =TRIAG(.01,02,03,2)8400= IF(XI(99).EQ.I)PRINI','USERF(3'6) : ,USERF,' AT ', TNOW8410= RETURN8420=C
8440=C84504c USERF(37) IS THE TIME TO LOAD/UNLOAD ONE PALLET OF EXPLOSIVES.8460=C8470=37 USERF = TRIAG(.l5,..2,.25,2)8480= IF(XX(9?).EQ.I)PRINT*,'USERF(37) =',US"ERF,' AT ',TNOWWO=Q RETURN8500=C
8520=C8530=C USERF(38) COLLECTS GENERAL CARGO PALLET ON-TIME PERCENTAGE.8540=C8550=38 IF(ATRIB(2).LT.TNOW)XX(84) = X(84) + XX(54)8560= IF(ATRIB(2).GE.TNOW)XX(85) = XX(85) + XX(54)8570= USERF = 08580= RETURN8590=C
9610=C8620=C USERF(39) COLLECTS EXPLOSIVE PALLET ON-TIME PERCENTAGE.86340=8640=39 IF(ATRIB(2).LT.TNOW)XX(84):XX(84) +11(90)8650= IF(ATRIB(2).GE.TNOW)XX(B5) = X(85) + 11(80)8660: USERF = 08670= RETURN8680=C
8700=C8710-- USERF(40) DETERMINES THE NUMBER OF PEOPLE IN A GROUP COMING8720=C FROM VARIOUS AREAS.87304C8740=40 II = MAX(ATRIB(4),ATRIB(5),ATRIB(6))8750: IF(II.GT.0)USERF = 118760= IF(II.EQ.)USERF = ATRIB(3)Kt70= RETURN8780: END
8800: SUBROUTINE ALLDC(IACIFLAG)8810: DIMENSION NSET(70000)8820= COWMN ISCOMI/ ATRIB(100),DD(100),DDL(100) -DTNOW,II,MFA,8830= +flSTD', ,NCLNR,NCRDR,NPRNT,NNRUN,NNSET,NTAPE,8840= *SS(100),SSL(100),TNEXT,TNOW,XZ(100)8850: COMMON QSET(70000)8860= EQUIVALENCE (NSET (1), OSET (1))88704C8880= GO TO (1,2,3,4,5,6,7,8,9,10,11),IAC
150

8990C
8910=C8920=C ALLOC(lI) ALLOCATES TRANSIENT BILLETING. BILLETING IS IN 38930=C AREAS, LABELLED TRABILl- TRABIL3. THE LABELS CORRESPOND TO THE6940=c PREFERENCE THAT THE MANAGERS WILL GIVE TO THE AREAS. IN OTHER8950=C WORDS, AREA I WOULD NORMALLY BE USED BEFORE AREA 2, AND SO ON. IT8960=C IS NOT NECESSARY THAT ALL THREE AREAS BE USED. IF A PARTICULAR BASEB970=C ONLY ESTABLISHES TWO AREAS, THEN THE USER NEED ONLY SET THE8980=C AVAILABILITY OF AREA 3 TO ZERO ON THE 'RESOURCE' CARD IN8990=C THE NETWORK PORTION OF THE INPUT. THIS WILL PREVENT THE MODEL FROM9000=C EVER ASSIGNING ANY FRN TO THAT AREA.9010=C9020=C IN DEFINING THE AVAILABILITY OF BILLETING, THE 'UNIT OF ISSUE' IS9030=C ONE SLEEPING SPACE. THIS ASSUMES THAT THE ASSOCIATED SERVICES ARE9040=C PROVIDED AS WELL (SANITARY FACILITIES, TRASH REMOVAL, ETC.).9050049060=C THE FIRST STEP IN THE ALLOCATION IS A RE-EXAMINATION OF THE TIME9070=C REMAINING BEFORE DEPARTURE. IF THE FRN HAS BEEN WAITING TOO LONG,9080=C THERE IS NO LONGER ANY POINT IN SENDING THEM TO BILLETING. THEY9090=C ARE INSTEAD ROUTED BACK TO THE NETWORK, WHICH SENDS THEM TO PAX910040 STAGING,9110=1 ATRIB(l) = ATRIB(2) - TNOW9120= IF (ATRIB(1).LT.XX(8)) THEN9130= IFLAG = 1
9140= RETURN9150= END IF9160=C917040 IF THERE IS STILL ENOUGH TIME TO BILLET THEM, WE FIRST TRY TO PUT9180=C THE ENTIRE FRN IN ONE AREA.9190=C9200= II=ATRIB(3
9210= DO 25 J=4,69220- IF (NNRSC(J+6).GE.II) THEN9230= CALL SEIZE(J+6,II)9240= ATRIB(J) = II9250= IFLAG = 19260= RETURN9270= END IF9280=25 CONTINUE9290=C9300=C FAILING TO PUT THEM INTO ONE AREA, WE NEXT CHECK TO SEE IF THERE9310:0 ARE ENOUGH SPACES IN ALL AREAS COMBINED.9320=C IF THERE ARE NOT, THE FRN IS TOLD TO WAIT IN THE QUEUE. IF THERE9330=C ARE ENOUGH SLOTS SCATTERED AROUND, WE START BY ALLOCATING THE9340=C LARGEST CHUNK FIRST. THIS CONTINUES UNTIL THE ENTIRE FRN HAS BEEN9350=C BILLETED.9360=C9370= II=NNRSC(IO) + NNRSCII) + NNRSC(12)9380= IF (II.LT.ATRIB(3)) THEN
9390= IFLAS = 09400= RETURN
151

9410= ELSE
NNEED = ATRIB(3)
9430=100 II=MmX(NNRSC(IO),NNRSC(II),NNRSC(I2))
9440= DO 20 K=4,69450: IF(II.EQ.NNRSC(K+6)) THEN
9460- IF (II.LE.NNEED) THEN9470= CALL SEIZE(K+6,I1)9480= ATRIB(K) = IT9490= NNEED=NNEED-II
9500= ELSE9510= CALL SEIZE(K+6.NNEED)9520= ATRIB(K)=NNEED9530= NNEED=O9540= IFLAG=I9550= RETURN
9560= END IF9570= END IF
9580=20 CONTINUE9590= GO TO 1009600= END IF9610=C9620=C9630=C..44t#4#.nIf**I I **f*H**#*4IIII iff*I*III*IIIIIfH4I*HIII#I***I*I*II
9640=C9650=C ALLOC(2) IS THE BUS ALLOCATION ROUTINE, AND IS USED IN SEVERAL9660=C LOCATIONS. IN EVERY CASE, WHEN AN FRN ARRIVES AT A NODE TO RECEIVE9670=C BUSES, IT CARRIES WITH IT ATRIBUTE 7, WHICH IS THE NUMBER OF9680=C BUSES IT NEEDS, AND ATRIBUTE 8, WHICH IS THE NUMBER OF BUSE SIT9690=C HAS AT THE MOMENT (0 TO START WITH). THE ROUTINE FIRST ATTEMPTS TO9700=C GIVE THE FRN ALL THE BUSES IT NEEDS AT ONE TIME. FAILING THIS, IT9710=C GIVES ALL THE BUSES THAT ARE AVAILABLE. IF NONE ARE AVAILABLE, THE9720=C FRN IS TOLD TO WAIT.9730=C9740=C AS BUSES ARE ALLOCATED, ATRIBUTE 7 IS DECREMENTED BY THAT NUMBER9750=C AND REPRESENTS THE NUMBER OF BUSLOADS OF PEOPLE STILL WAITINS FORq760=C TRANSPORTATION. AS SHOWN BY THE NETWORK DIAGRAM IN CHAPTER FOUR,9770=C AS LONG AS ATRIBUTE 7 IS GREATER THAN 0, THE FRN WILL CL., INUE TO9780=C LOOP BACK TO THE AWAIT NODE TO RECEIVE THE BUSES IT STILL NEEDS.9790=C9800=C THESE BUSES MAY COME FROM EITHER THE ONES IN USE BY THIS FRN,98IO=C COMING BACK FOR A SECOND LOAD, OR FROM BUSES BEING RELEASED FROM9B20=C OTHER PARTS OF THE NETWORK. WHICHEVER THE CASE, THEY ARE AL LOCATED
9830=C AND ATRIB(B) SHOWS HOW MANY THE FRN CURRENTLY HAS. THIS IS THE9840=C NUMBER WHICH WILL BE RELEASED AFTER THE DURATION OF THE TRIP HAS9850:C ELAPSED.9860=C9870=C9880=2 II=ATRIB(7)
9890= IF (NNRSC(4).GE.II) THEN5900= CALL SEIZE(4,11)9910= ATRIB(7) = 09920= ATRIB(B) : II
152

9930= IFLAG = 19940= ELSE IF (NNRSC(4).GT.0) THEN9950= ATRIB(7) = ATRIB(7) - NNRSC(4)9960= ATRIB(8) = NNRSC(4)9970= CALL SEIZE(4,NNRSC(4))9980= IFLAS = I9990= ELSE
10000= IFLAG = 010010= END IF10020C10030= RETURN
I 0050=C10060=C ALLOC(3) ALLOCATES BILLET AREA FEEDING CAPABILITY. IN DEFINING10070=C THIS RESOURCE, THE MANAGERS MUST TAKE INTO ACCOUNT THE CAPABILITY10080=C OF SOME TRANSIENT FRNS TO FEED THEMSELVES. AS THIS THESIS IS BEING10090= PREPARED, THIS CAPABILITY IS LARGELY A MYSTERY. WHEN IT BECOMES10100= KNOWN THAT A GIVEN UNIT WILL ARRIVE ON A CERTAIN DAY AND WILL SET10110=C UP A FIELD KITCHEN FOR 15 DAYS, THE MODEL CAN BE MODIFIED TO TAKE10120= INTO ACCOUNT THE INCREASED LEVEL OF FEEDING RESOURCE THAT SUCH A10130=C KITCHEN WOULD PROVIDE FOR THOSE 15 DAYS. AT THIS TIRE, HOWEVER,10140= THAT LEVEL OF DETAIL IS NOT ATTEMPTED. THE MANAGERS SHOULD MERELY10150=C ATTEMPT TO DEFINE THE NUMBER OF MEALS THEY COULD SERVE AT EACH10160= AREA. FOR THIS RESOURCE, EACH AREA IS CONSIDERED SEPERATE, EVEN10170=C THOUGH A SINGLE SOURCE MIGHT PROVIDE MEALS FOR ALL BILLETING10180=C AREAS. IN SUCH A CASE, THE AVAILABILITY SHOULD BE DIVIDED AMONG10190=0 THE SEVERAL AREAS. FURTHERMORE, THE AVAILABILITY OF MEALS IS10200=C MEASURED IN SERVINGS PER SIX HOURS, ON THE ASSUMPTION THAT A 24-10210=0 HOUR SCHEDULE IS IN EFFECT. THIS MEANS THAT IF A KITCHEN CAN SERVE10220=C 600 MEALS PER HOUR, 24 HOURS PER DAY, THEY HAVE AN AVAILABILITY OF10230= 600 X 6 = 3600 UNITS PER CYCLE.10240=1025040 ON THIS BASIS, AN FRN OF 200 PERSONS WILL BE ALLOCATED 200 UNITS1026040 OF THAT 3600, AND WILL KEEP THEM UNTIL THEY DEPART THE BILLETING10270=C AREA. SHOULD THE MANAGERS WISH TO PROVIDE ONE MEAL EVERY 1210280=C HOURS, THEY SIMPLY MULTIPLY THE HOURLY CAPABILITY BY 12 INSTEAD OF10290= BY 6.10300=010310= THE ALGORITHM USED CONSIDERS EACH OF THE ATRIBUTES (4-6) IN TURN10320=0 TO SEE IF THE FRN HAS PEOPLE IN THAT AREA. IF SO, IT ATTEMPTS TO10330=0 ALLOCATE THE FEEDING RESOURCE. IF THERE IS INSUFFICIENT RESOURCE10340=C AVAILABLE, THIS WILL NOT PREVENT THE FRN FROM LEAVING ON TIME.1035040 THEREFORE, THE ROUTINE MERELY PRINTS AN ADVISORY NOTICE AND ALLOWS10360=0 THE FRN TO MOVE ON. TO KEEP THE MODEL SIMPLE, NO ATTEMPT IS MADE10370=0 AT ANY LATER DATE TO ALLOCATE FEEDING WHICH BECOMES AVAILABLE TO10380=C THOSE FRNS WHICH DID NOT RECEIVE IT AT THIS POINT.I0390=C10400=3 CONTINUE10410= IF(ATRIB(41.6T.0) THEN10420= IF(NNRSC,7).6E.ATRIB(4))THEN10430= IIzATRIB(4)10440= ATRIB(8)=II
153

10450z CALL SEIZE17,11)10460= ELSE IF (NNRSCC7?.GT.0) THEN10470= 1ATRIP(4-NNRSCM710480= ATRIB(B):NNRSC(7)10490= CALL SEIZE(7,NNRSC(7))10500= ELSE10510= I1:ATRIB(4)10520= ATR!B1B = 010530= END IF10540= END IF10550=C10560: IF(ATRIB(5).GT.0) THEN10570= IF(NNRSC(B).GE.ATRIB(5)lTHEN10580: I1:ATRIB(5)10590= ATRIB(81:II10600= CALL SEIZE(8.11)10610= ELSE IF (NNRSCCBL.GT.0) THEN1062.0= II:ATRIB(5)-NNRSCI8)10630: ATRIB(81:NNRSC(8)10640- CALL SEIZE(B,NNRSC(1))10650= ELSE10660: II:ATRIB(S)10670: ATRIBM8 = 010680= END IF10690: END IF10700=C10710: IF(ATRIB(6).GT.0) THEN10720= IF(NNRSC(9).GE.ATRIB(b))THEN10730= !1:ATRIB(6)10740= ATRIB(8)=II10750= CALL SEIZE(9,I1)10760= ELSE IF (NNRSC(9).GT.0) THEN10770= II:ATRIB(6)-NHRSC(9)10780= ATRIB(B)=NNRSCC9)10790= CALL SEIZE(9,NNRSC(9))10800: ELSE10810: lI:ATRIB(6)10820: ATRI8(8 = 010830: END IF10840: END IF10850= IFLAG:110860: RETURN10870=C10880:Cfffff~if4fff**.fff41f4f14114**#IEfffffE4*fff414**ffif*#4I4f10890=C EVENT 4 AND 5 NOT USED10900:4 RETURN10910:5 RETURN10920=C
10940=C109504C ALLOC16) ALLOCATES WASHRACKS TO THE VEHICLES, ONE AT A TIME.10960xC
154

10970=6 IF (NNRSC(16).GT.0) THEN10980= ATRIB(7) = ATRIB(7) -
10990= ATRIB(8) = I11000= CALL SEIZE(16,1)11010= IFLAG = 111020= ELSE110302 IFLAG = 011040= END IF11050= RETURN11060=CI 1070:CItlf****tI*If*******,***.*uI*II..*,t*..tt*,I*.*t*uIuI..*,i.,t**.tI
I1080=C11090C ALLOC(7) ALLOCATES VEHICLE PROCESSING SPACE. EACH SLOT11100C REPRESENTS SPACE FOR ONE VEHICLE TO BE DEFUELED, WEIGHED, ANDI11I0=C OTHERWISE PREPARED FOR SHIPMENT. THE LOGIC USED HERE IS IDENTICAL11120C TO THAT USED FOR THE WASHRACKS.11130C11140=C11150=7 IF (NNRSC(17).6T.0) THEN11160= ATRIB(8) = ATRIB(8) - 111170= CALL SEIZE(17,1)11180= IFLAB = I11190= ELSE11200= IFLA6 = 011210= END IF11220= RETURN11230-CI 1240=C*****HH#4e***I*****~I*HII**n,*i*n...**,**.*I*n.,*,,*
11250=C11260=C ALLOC(8) ALLOCATES NON-UNIT RECEPTION AREA. ATRIB(8) IS THE NUMBER11270=C OF PALLETS IN THIS FRN. RESOURCE 30 IS DEFINED AS PALLET CAPACITY.11280=C AN OVERFLOW WILL NOT STOP THE FRN.11290=C11300=8 IF(NNRSC(26).ED.0)THEN11310= ATRIB(8) = 011320z ELSE11330= ATRID(B) = I11340= CALL SEIZE(26,I)11350= END IF11360= ATRIB(5) = ATRIB(5) -
11370= IFLAG = 111380=- RETURN113902CI 1400=C#4,I,*414,44**I*****4*tfet#*.***...,,,,*,.,,,.,,.,,,*,,,.,
11410=C EVENT 9 NOT USED114209 RETURNlI 430C*t*.t*** ltflII tII*HtI,**4*n~n.*.n.*Iu.,**.,,.n,..*,,,! ll#.
11440=C11450=C ALLOC10) ALLOCATES PALLET SPACE IN THE MARSHALLING AREA.11460=C ATTRID(B) WAS REDEFINED AS THE NUMBER OF PALLETS IN THIS11470zC GROUP. RESOURCE 24 IS THE PALLET CAPACITY. IT IS ASSUMED11480=C THAT AN OVERFLOW OF THE ALLOCATED AREA WILL NOT PREVENT
155

11490=C TIMELY DEPARTURES.I1500C11510=10 IF (KNRSC(20).EQ.O) THEN11520= ATRIB(B) = 01,530= ELSE
11540= CALL SEIZE(20,1)
11550= ATRIB(8) = I11560= END IF11570= ATRIB(5) = ATRIB(5) - 111580= IFLAG = 111590= RETURNI11600:CI**t*.4..*.I#*4**t,ttttti,.**,It,,!.t.**.ttI*i*,.,.tllI..*tt,.*t**
11610=C ALLOC(II) ALLOCATES EXPLOSIVE MARSHALLING AREA.11620=C AN OVERFLOW WILL NOT STOP THE FRN FROM BEING PROCESSED.11630=C11640=11 IF(NNRSCl23).EQ.O)THEN11650: ATRIB(8) = 011660= ELSE11670= ATRIB(B) = 111680= CALL SEIZE(23,I)11690= END IF11700= ]FLAG = 111710= ATRIB(6) = ATRIB(6) - 111720= RETURN11730= END11740C
11760=C11770= SUBROUTINE OTPUT11780= DIMENSION NSET(70000)11790= COMMON/SCOMI/ ATRIB(100),DD(100),DDL(00),DTNOW,II,MFA,MSTO P.NCLNR11800= +,NCRDR,NPRNT,NNRUN,NNSET,NTAPE,SS(100),SSL(100),TNEXT,TNOW, IX(100)11810= COMMON QSET(70000)11820: EQUIVALENCE (NSET(1),QSET(1))I1830=C11840= XX(83) = XX(82)I(XX(81)+XX(82))11850= XX(86) = XX(85)/(XX(84)+XX(85))11860= PRINT*,'PASSENGER PERCENTAGE = ',XX(83)11870= PRINT*,'CARGO PERCENTAGE = ',XX(86)11880= RETURN
118902 END119O0=EOR
156

APPENDIX F
SIMULATED TPFDD INPUT
157

FORTRAN FPROGRAM TO GENERATE SIMULATED TF'FDD
100= PROGRAMl FILE110= INTEGER BULSTON,OUTSTON,aVRSTON,NPAX,EXPSTON,ALD,EAD,LAD,TY PE120- DO 50 J=1,700130= R=RANF(0140= ALD:NINT(R*30)150: EAD=NINT(ALD+R*2)
170z LAD=NINT(EAD+R*10)180= IF(LAD.LT.EAD)ADEAD190: IF(R.LE..4)TYPE:2200= IFlR.GT. .4.AND.R.LE..6)TYPE=3210= IFlR.GT. .6.AND.R.LE. .9)TYPE=4220: IF(R.GT. .9)TYPE=5230= IF(TYPE.ED.2)THEN240m EXPSTUN=0250= Z=RANF()260= IF(Z.LT..5)7HEN270= BULSTON=O20= ELSE290: R=RANFI)300: BULSTON=R*120310: ENDIF320= Z=RANF()330= IF(Z.LT. .6)THEN340: OVRSTON=0350: ELSE360: R=RANF()370= BLLSTDN:R*33380: ENDIF390: ZzRANF()400: IF(l.LT. .7)THEN410-2 OUTSTON=0420= ELSE430-c R=RANF(0440: UUTSTUN=R#35450= ENDIF460: Z=RAMF()470= IF(Z.LT..2)THEN480z NPAX=0490c ELSE500: RzRANF()510: NPA12R#50520-m ENDIF530: ELSEIF (TYPE.Eg.3) THEN540-- NPAW~550: ZzRANF()5602 IF(Z.LT.5)THEN570= BULSTON=0
158
580= ELSE590: R:RANF(600= OULSTON=R*66610m ENDIF620= Z=RANF()630= IF(Z.LT. .6)THEN640= OVRSTDN:3650= OUTSTUN:660= ELSE670: RzRANF()680: OYRSTON=R#42690: R:RANF()700z OUTSTUN=R#42710= ENDIF720= l:RANF()730: IF(Z.LT..7)THEN740= EXPSTON=O750: ELSE760= R=RANF()770= EXPSTON=R,223780z END IF790= ELSEIFITYPE.EQ.4)THEN903: EXPSTON=0810= OYRSTON:O820= OUTSTON:3930= Z:RANF()840= IFfZ,LT..B)THEN850= NPAX=0860= ELSE870-- R=RANF()990= NPAX=R#250890= ENDIF9002 Z:RANF 0910: IF(Z.T..D1THEN920c OULSTCN:3930-- ELSE940: RzRANF 0953: BULSTON=R,17960= END IF9703- ELSEIF(TYPE.EQ.S)THEN980= EXPSTON=O990-- Z=RANFO
1333: IF(Z.LT..3)THEN1010= NPAX=01020= ELSEj033 R=RANF()1040= NPAI=R;5010502 ENDIF1060: l:RANF()1070: IF(Z.LT..4)THEN1080: DULSTON:01090: OYRSTGN:0
159

1100= OUTSTON=01110= ELSE1110: R=RANF()1130= BULSTGN=R#301140= OVRSTONRf201150= OUTSTON:R* 101160= ENDIF1170= ENDIF1180= IF(J.LT.5JPRINTS,BULSTON,OVRSTOH,OUTSTON,NPAX,EXPSTON,ALD,E AD,1190: +LAD,TYPE1200: S=BULSTDNiOVRSTDN+OIJTSTON+NPAX1210= IF(S.6T.0)NRITE(80,5)BULSTON,OVRSTON,OUTST0N,NPAX,EXPSTON,1 220- +ALD, EADLAD, TYPE1230=5 FORAT(IX,A4,5(X,14),3C1X,12,1X,I1)1240=50 CONTINUE1250= STOP1260= END1270=*EOR
160

SIMULATED TPFDD
100= 0 12 19 0 0 17 18 24 3110= 12 12 0 29 0 8 9 12 2120= 2 12 34 46 0 3 4 52130= 27 12 0 0 0 6 7 9 2140= 112 0 0 44 0 9 10 132150= 0 39 25 0 0 15 16 21 3160: 7 0 0 0 0 27 29 38 4170= 0 24 18 0 0 14 15 20 3180= 4 3 1 0 028 30 39 5190- 6 0 0 0 025 27 354200= 0 0 0 33 0 8 9 12 2210= 6 0 0 0 0 20 21 28 4220= 21 0 0 0 0 3 4 5 2230= 26 17 8 19 0 29 31 41 5240= 108 0 0 29 0 2 3 4 2250= 0 0 0 6 0 8 9 12 2260= 0 29 21 0 126 15 16 213270= 26 29 0 42 0 9 10 13 2280= 3 0 0 0 0 26 28 37 4290: 4 0 0 47 0 6 7 9 2300z 0 15 27 0 0 16 17 22 3310= 14 0 0 0 02729 384320= 30 0 17 47 0 4 5 6 2330= 0 0 0 37 0 2931 41 5340= 13 0 0 209 024 26 34 4350= 0 14 12 0 10 14 15 20 3360a 0 0 18 5 0 6 7 92370= 0 0 24 47 0 11 12 162380: 0 0 0 26 0 2931 41 5390= 75 0 0 9 0 7 8 10 2400: ! 0 0 0 0 18 19 25 4410= 5 0 0 0 026 28 37 4420-- 0 .0 10 0 0 11 12 16 2430= 0 1 2 0 0 16 17 223440= 0 16 31 0 0 12 13 17 3
450: 15 0 0 0 0 20 21 28 4460= 9 0 0 9 0 10 11 14 2470m 114 0 0 0 0 5 6 82480: 9 0 0 0 0 20 21 28 4490: 11 0 0 0 0 5 6 8 2500: 0 0 8 12 0 2 3 4 2
510: 27 0 0 26 0 2 3 4 2520= 17 11 5 15 0 27 29 38 5530m 0 39 25 0 203 16 17 22 3540a 14 0 0 0 0 19 20 26 4550= 0 0 0 16 0 12 13 17 2
560= 43 0 18 18 0 9 10 13 2
570= 0 0 0 3 0 10 11 14 2
161

580= 10 0 0 15 0 4 5 6 2590= 5 0 0 227 0 23 2533 4600= 0 12 30 0 0 15 1621 3610= 8 5 2 0 0 303242 5620 26 17 8 0 0 29 3141 5630= 0 40 1 0 163 1516 21 3640= 10 40 0 0 0 1 2 2 2650= 3 0 0 49 0 9 1013 2660z 0 14 25 0 0 17 1824 3670= 17 14 0 47 0 11 1216 2680= 0 31 40 0 0 13 1418 3690= 15 0 0 0 0 242634 4700= 0 0 0 47 0 27 29 385710: 7 0 0 3 0 8 9 12 2720= 16 0 0 12 0 4 5 6 2730= 0 0 0 46 0 1 2 2 2740: 0 13 31 0 0 151621 3750= 11 13 0 24 0 91013 2760= 8 0 0 0 0 212229 4770= 6 4 2 49 0 29 3141 5780: 3 4 0 26 0 89 12 2790= 0 0 0 40 0 3 4 5 2800=:10 0 0 0 0 20 2128 4810= 0 0 0 34 0 30 3242 5820= 0 0 20 10 0 0 1 1 2830: 0 0 0 18 0 4 5 6 2840: 8 0 0 0 0 11 1216 2850: 13 0 0 0 0 192026 4860: 1 0 0 6 0 29 3141 5870= 0 0 43 0 8 912 2880: 10 0 0 0 0 23 2533 4890: 0 0 10 0 0 4 5 6 2900: 0 0 7 14 0 4 5 6 2910: 0 1 F 7 0 0 12 1317 3920: 0 14 26 0 0 17 1824 3930= 25 0 11 10 0 1 2 2 2940= 0 5 23 0 0 15 1621 3950: 15 0 0 0 0 192026 4960: 92 0 27 0 0 1 2 2 2970: 38 0 0 41 0 7 8 10 2980z 8 0 0 0 0 24 2634 4990z 21 0 0 0 0 2 3 4 21000: 105 0 0 16 0 6 7 9 21010 22 0 0 0 0 01 1 21020= 16 0 0 47 0 1 2 2 21030: 8 0 0 0 0 1819 25 41040: 12 0 0 j 0 252735 410502 31 0 0 14 0 4 5 6 21060a 8 0 0 10 0 27 2938 41070: 4 0 0 5 0 23 2533 41080: 30 0 0 24 0 121317 21090: 7 0 0 41 0 9 1013 2
162

1100= 9 0 0 0 0 20 21 28 41110= 25 0 0 7 0 4 5 6 21120= 11 0 0 225 0 21 22 29 41130= 20 13 6 0 0 28 30 39 51140= 2 0 0 0 0 19 20 26 41150= 0 30 20 0 0 13 14 18 31160= 108 0 0 35 0 7 8 10 21170= 3 0 0 0 0 20 21 28 41180= 12 0 0 0 0 23 25 33 41190= 8 0 0 146 0 23 25 33 41200= 12 8 4 9 0 29 31 41 51210= 37 0 0 16 0 1 2 2 21220= 18 12 6 28 0 29 31 41 51230= 8 0 0 0 0 26 28 37 41240= 16 0 0 0 0 27 29 38 41250= 3 0 0 0 022 23 30 41260= 33 0 0 42 0 4 5 6 21270= 8 0 0 0 022 23 30 41280= 8 0 0 0 02021 28 41290= 4 0 0 0 02729 3841300= 27 18 9 0 029 31 41 51310= 26, 17 8 49 0 29 31 41 51320= 16 0 0 0 0 20 21 2841330= 24 0 0 19 0 8 9 12 21340= 6 0 0 38 0 12 13 17 21350= 0 0 0 37 0 30 32 42 51360= 29 0 19 48 0 11 12 16 21370= 0 0 0 12 0 8 9 12 2
1380= 9 0 0 186 027 29 38 41390= 38 0 0 0 0 3 4 5 21400= 31 0 0 0 0 4 5 6 21410= 11 0 0 0 0 21 22 29 41420= 2 0 0 0 0 24 26 34 41430= 9 0 0 0 021 22 29 41440= 32 0 10 37 0 10 11 14 21450: 13 0 0 5 0 8 9 12 21460= 9 0 0 0 021 22 2941470= 4 0 0 0 024 26 34 41480= 10 0 0 7 0 12 13 17 21490= 0 0 0 36 0 9 10 13 2
1500: 1 0 0 0 0 30 32 42 51510= 66 0 0 0 0 5 6 8 2
1520= 0 10 38 0 0 15 16 21 31530= 6 0 0 95 021 22 29 41540= 0 0 0 5 0 30 32 42 51550= 11 0 0 0 026 28 37 41560= 13 0 0 0 025 27 35 41570= 0 3 13 0 0 17 18 24 31580= 0 0 14 0 0 9 10 13 21590= 26 17 8 43 02931 41 51600= 0 0 0 15 0 30 32 42 51610: 3 0 0 0 0 26 28 37 4
163

1620= 11 0 II 23 0 3 4 5 21630= 11 0 0 16 0 2 3 4 21640z 0 20 17 0 0 13 14 18 31650= 7 0 0 0 0 20 21 28 41660= 15 0 0 0 0 21 22 29 41670= 0 0 0 7 0 5 6 8 21680= 10 0 0 0 0 21 22 29 41690= 6 0 14 13 0 4 5 6 21700- 9 0 0 0 0 20 21 28 41710- 3 0 0 0 0 20 21 28 41720= 0 38 33 0 0 15 16 21 31730: 9 0 0 0 0 20 21 28 41740= 0 0 34 0 0 3 4 5 21750= 3 0 0 0 0 23 25 33 41760= 22 0 0 10 0 7 8 10 21770= 20 0 0 35 0 1 2 2 21780= 8 0 0 14 0 6 7 9 21790= 15 0 0 1 0 8 9 12 21800= 74 0 0 37 0 8 9 12 21810= 14 0 0 0 0 23 25 33 41820= 3 0 0 0 0 25 27 35 41830= 0 0 0 42 0 30 32 42 51840= 12 8 4 0 0 28 30 39 51850= 6 0 0 26 0 21 22 29 41860= 0 0 11 10 0 6 7 9 21870= 1 0 0 0 0 22 23 30 41880= 16 0 0 36 0 8 9 12 21890= 0 36 41 0 0 17 18 24 31900= 30 36 0 13 0 6 7 9 21910= 0 12 9 0 0 16 17 22 31920= 0 22 32 0 0 17 18 24 31930= 4 0 0 0 0 25 27 35 4194-: 8 0. 0 3 0. 7 8 10 21950= 11 0 0 0 0 25 27 35 41960= 18 C 0 4 0 6 7 9 21970= 15 0 0 0 0 25 27 35 41980= 2 0 0 0 0 23 25 33 41990 = 19 13 6 0 0 29 31 41 52000= 7 0 0 100 0 25 27 35 4
2010= 15 0 2 0 0 6 7 9 22020= 27 0 0 23 0 6 7 9 22030z 1 0 18 49 0 6 7 9 22040: 0 0 0 2 0 ZO 11 14 22050= 61 0 0 38 0 3 4 5 22060z 0 0 0 1 0 6 7 9 22070= 14 0 0 0 0 18 19 25 42080= 0 0 i4 25 0 9 10 13 22090= 0 20 0 0 49 12 13 17 32100= 0 18 8 0 0 13 14 18 32110= 32 18 0 31 0 8 9 12 22120z 0 0 1 0 0 6 7 9 22130= 0 0 28 23 0 11 12 16 2
164

2140: 0 0 0 45 0 11 12 1622150= 17 11 5 14 0 28 30 39 52160= 25 1 0 1 0 ? 10 13 22170= 2 0 0 21 0 10 II 14 22180= 0 0 0 29 0 12 13 17 22190= 23 0 0 30 0 2 3 4 22200= 0 22 28 0 0 13 14 18 32210= 31 22 15 26 0 11 12 16 22220= 80 0 0 7 0 7 8 10 22230= 0 30 36 0 103 13 14 18 32240= 13 0 0 0 0 21 22 "9 42250= 0 0 0 41 0 2 3 4 22260= 21 0 24 10 0 4 5 6 22270= 26 0 0 25 0 11 12 16 22280= 0 35 39 0 0 17 18 24 32290= 8 35 33 31 0 1 2 2 22300= 19 35 0 43 0 3 4 5 22310= 7 0 0 0 0 22 23 30 42320= 0 5 31 0 0 17 18 24 32330= 0 0 0 15 0 11 12 16 22340= 0 0 21 0 0 12 13 17 2
2350= 13 0 0 25 0 11 12 16 22360= 11 0 0 0 0 19 20 26 42370= 32 0 17 15 0 I 2 2 22380= 0 0 0 32 0 28 30 39 52390= 3 0 0 0 0 19 20 26 42400= 0 0 0 17 0 7 8 10 22410= 3 0 0 0 0 24 26 34 4
2420= 0 0 0 21 02830 39 52430= 0 0 0 41 0 30 32 4252440= 8 0 0 0 0 23 25 33 42450= 2 0 0 0 0 21 22 29 42460= 8 0 0 49 0 9 10 13 22470z 110 0 0 0 0 9 10 13 22480= 0 0 27 0 0 6 7 9 22490= 0 20 0 0 0 18 19 25 32500= 0 0 0 4 0 3 4 5 22510= 1 1 0 22 030 32 42 52520= 13 0 0 22 0 26 28 37 42530= 0 0 0 26 0 28 30 3952540= 16 0 0 22 0 11 12 16 22550= 88 0 5 17 0 6 7 9 22560= 5 0 0 0 0 18 19 25 42570z 8 0 0 0 0 24 26 34 42580= 9 0 0 0 0 22 2330 42590= 8 0 0 0 024 26 34 42600z 0 0 27 12 0 1 2 222610m 0 41 2 0 0 15 16 21 32620= 8 0 16 6 0 8 9 12 22630: 13 0 0 0 026 283742640= 4 0 0 10 026 28 37 42650= 0 0 0 29 0 4 5 6 2
165

2660= 9 0 0 0 0 26 28 37 42670= 10 0 0 238 0 21 22 29 42680= 10 0 0 0 0 27 29 38 42690= 109 0 0 4 0 1 2 2 22700= 31 0 0 0 0 7 8 10 22710= 0 0 4 26 0 5 6 8 22720= 0 10 40 0 0 14 15 20 32730= 12 0 0 0 0 19 20 26 42740= 15 10 5 0 0 27 29 38 52750- 20 0 0 49 0 0 1 122760= 3 0 0 0 0 25 27 35 42770= 0 0 0 3 0 7 8 10 22780= 0 0 34 0 0 11 12 16 22790= 0 0 0 32 0 11 12 16 22800= 6 0 0 0 024 26 42810= 0 19 23 0 0 16 17 22 32820= 16 0 0 64 0 24 26 34 42830= 59 0 0 0 0 10 11 14 22840= 81 0 0 15 0 2 3 4 22850= 11 0 0 168 0 21 22 29 42860= 16 0 0 0 0222330 42870= 88 0 0 0 0 2 3 4 22880= 15 0 0 115 0 21 22 29 42890= 0 0 25 12 0 11 12 16 22900= 5 0 0 110 0 23 25 33 42910= 13 0 0 0 022 23 3042920= 6 0 0 1 0 1 2 222930= 15 10 5 0 027 29 38 52940= 4 0 0 0 0'20 21 28 42950= 8 0 0 0 022 23 30 42960= 3 0 0 0 022 23 30 42970= 0 0 20 41 0 6 7 922980= 3 0 0 0 025 273542990= 9 0; 0 0 0'23 25 33 43000= 5 0 0 14 0 8 9 1223010= 9 0 19 17 0 1 2 2 23020= 1 0 0 11 0 10 I 14 23030= 15 0 14 49 0 10 11 14 23040= 23 15 7 41 027 29 38 53050= 0 0 0 39 0 8 9 12 23060: 0 0 0 5 0 2 3 4 23070= 7 0 0 140 026 28 37 43080= 41 0 25 40 0 5 6 8 23090= 14 0 19 0 0 4 5 6 23100= 101 0 0 43 0 01 1 23110m 0 30 31 0 64 16 17 22 33120: 0 0 0 8 0 3 4 5 23130= 21 0 19 0 0 0 1 123140= 1 0 0 0 0 27 29 38 43150= 6 0 0 104 026 28 37 43160= 9 0 0 0 026 28 37 43170= 9 0 0 0 023 25 33 4
166
- ~ V-

3180= 17 0 0 12 0 10 11 14 23190- 23 15 7 49 0 28 30 39 53200= 6 4 2 19 0 29 31 41 53210: 0 0 0 42 0 4 5 6 23220= 6 0 0 0 0 27 29 38 43230= 20 0 0 24 0 10 11 14 23240= 27 0 17 0 0 3 4 5 23250= 0 0 0 26 0 11 12 16 23260= 1 0 0 0 0 26 28 37 43270= 9 0 0 0 0 22 23 30 43280= 14 0 0 0 0 3 4 523290: 11 0 0 0 0 22 23 30 43300: 7 4 2 7 0 27 29 38 53310= 0 19 37 0 87 14 15 20 33320= 21 14 7 0 0 29 1 41 53330= 116 0 6 42 0 3 4 5 23340= 2 0 0 173 0 27 29 38 43350= 0 0 0 9 0 0 1 1 23360= 30 0 0 0 0 9 10 1323370- 2 0 0 0 0 19 20 2643380= 20 0 31 0 0 1 2 2 23390= 5 0 0 21 0 3 4 5 23400= 6 0 0 0 0 18 19 25 43410= 13 0 0 0 021 22 29 43420= 31 0 0 12 0 2 3 4 23430= 85 0 0 17 0 7 8 1023440= 6 0 0 0 0 19 20 26 43450= 0 0 0 11 0 8 9 12 23460= 8 0 0 0 0 26 28 37 43470: 8 0 0 0 02122 29 43480= 23 15 7 19 0 29 31 41 53490= 7 0 0 0 0 23 25 33 43500= 25 0 34 32 0 2 3 423510= 11 0 0 0 0 21 22 29 43520= 20 0 0 0 0 3 4 523530= 15 0 0 0 0 18 19 2543540: 3 0 0 0 0 23 25 33 43550: 27 0 0 48 0 2 3 423560= 20 0 0 0 0 6 7 9 23570= 0 0 0 234 02527 3543580= 8 0 0 0 0 20 21 28 43590: 67 0 12 29 0 10 11 14 23600= 31 0 19 24 0 5 6 8 23610= 5 0 0 48 0 12 13 17 23620= 92 0 0 0 08 9 1223630= 0 0 0 1 0 11 12 16 23640:3 1 0 0 14 0 7 8 10 23650z 6 0 0 0 026 28 37 43660c 45 0 0 34 0 11 12 16 23670= 5 0 0 39 0 4 5 6 23680c 0 14 23 0 0 17 19 24 33690= 0 16 15 0 0 17 18 24 3
167

3700= 9 0 0 119 0 24 26 34 43710= 0 0 0 27 0 1 2 2 23720= 14 9 4 0 0 30 32 42 53730= 20 0 0 0 0 6 7 9 23740: 14 0 0 0 0 24 26 34 43750= 19 12 6 34 0 29 31 41 53760= 3 0 0 0 0 25 27 35 43770= 77 0 0 41 0 7 8 10 23780= 4 2 1 46 02830 39 53790= 14 2 0 35 0 6 7 9 23800= 22 2 0 0 0 4 5 6 23810= 0 33 37 0 217 17 18 24 33820= 31 33 34 38 0 1 2 2 23830z 95 0 0 8 0 1 2 223840= 3 0 0 0 020 21 28 43850= 6 0 0 0 0 21 22 29 43860= 0 0 6 12 0 7 8 1023870= 0 0 0 35 0 2 3 423880= 57 0 0 25 0 12 13 17 23890= 14 0 0 0 0 22 23 30 43900= 0 0 0 3 025 27 35 43910= 26 0 0 9 0 4 5 6 23920= 0 0 0 36 0 11 12 16 23930= 1 0 0 36 0 12 13 17 23940= 51 0 0 0 0 1 2 223950= 1 0 0 127 0 24 26 34 43960= 6 0 0 6 0 6 7 923970= 0 0 0 15 0 27 29 38 53980= 3 0 0 0 0 2 3 4 23990= 86 0a 22 41 0 10 11 14 24000= 0 0 5 40 0 7 8 1024010= 9 0 0 110 02223 30 44020= 9 0 0 0 0 24 26 34 44030: 20 0; 0 31 0 .8 9 12 24040: 13 0 0 0 0 24 2634 44050: 12 0 0 0 0 18 19 25 44060= 2 0 0 193 0 21 22 2944070= 12 0 0 205 0 19 20 26 44080= 112 0 0 0 0 10 11 14 24090: 20 0 0 5 0 5 6 8 24100= 16 0 0 0 0 25 27 35 44110= 14 0 0 0 0 19 20 26 44120= 0 33 34 0 0 16 17 2234130= 24 33 28 0 0 9 10 13 24140m 12 8 4 0 03032 4254150= 0 0 0 7 0 3 4 5 24160= 27 0 0 26 0 1 2 2 24170= 18 0 0 29 0 3 4 5 24180= 23 0 0 19 0 1 2 224190= 0 0 0 31 0 11 12 16 24200: 0 15 40 0 0 13 14 1834210z 60 0 0 5 0 11 12 16 2
168

4220 3 0 0 0 0 20 21 28 44230= 2 0 0 32 0 4 5 6 24240= 3 0 0 0 0 23 25 33 44250= 6 0 6 14 0 6 7 9 24260= 0 8 5 0 0 13 14 IB34270= 7 0 0 0 0 25 27 35 44280= 6 0 19 21 0 10 11 14 24290= 10 0 0 0 0 26 28 37 44300= 0 34 26 0 176 13 14 18 34310= 113 0 21 25 0 12 13 17 24320= 0 0 0 5 0 28 30 39 5
4330= 83 0 10 8 0 4 5 6 24340= 16 0 0 0 0 20 21 28 44350= 0 0 1 35 0 7 9 31 4 1 54360= 0 0 0 10 0 11 12 16 24370= 7 0 19 42 0 3 4 5 24360= 0 33 3 0 0 16 17 22 34390: 0 28 16 0 0 16 17 22 34400= 10 0 0 0 020 21 28 44410= 14 0 0 0 0 20 21 28 44420= 14 0 0 0 0 26 28 37 44430= 6 0 0 0 0 24 26 34 44440= 20 0 0 40 0 9 10 13 24450= 100 0 0 13 0 2 3 424460: 6 0 0 0 0 1920 26 44470= 0 13 28 0 39 16 17 22 34480= 0 13 19 0 0 7 8 1024490= 0 0 0 42 0 2 3 4 24500z 81 0 28 15 0 12 13 17 24510= 21 0 13 11 0 12 13 17 24520= 9 0 0 0 0 22 23 30 44530= 4 0 0 23 0 7 8 10 24540= 8 0 30 15 0 7 8 10 24550= 1 0 0 92 0 24 26 34 44560 115 0 21 21 0 10 11 14 24570= 8 0 0 0 0 19 20 26 44580= 115 0 0 6 0 910 1324590= 0 0 11 0 0 12 13 17 24600= 13 0 0 52 0 27 29 38 44610= 0 0 0 33 0 2 3 4 24620= 0 0 22 0 0 16 17 2234630: 3 0 34 40 0 5 6 824640= 11 7 3 18 030 32 42 54650m 0 0 25 0 0 2 3 4 24660= 7 0 28 1 0 10 11 14 24670= 12 0 0 156 027 29 38 44680= 0 0 0 40 0 11 12 16 24690= 0 0 0 10 0 12 13 17 24700v 34 0 1I 20 0 8 9 1224710: 25 0 0 30 0 4 5 6 24720s 25 0 0 0 0 6 7 9 24730a 4 0 0 0 020 21 28 4
I69
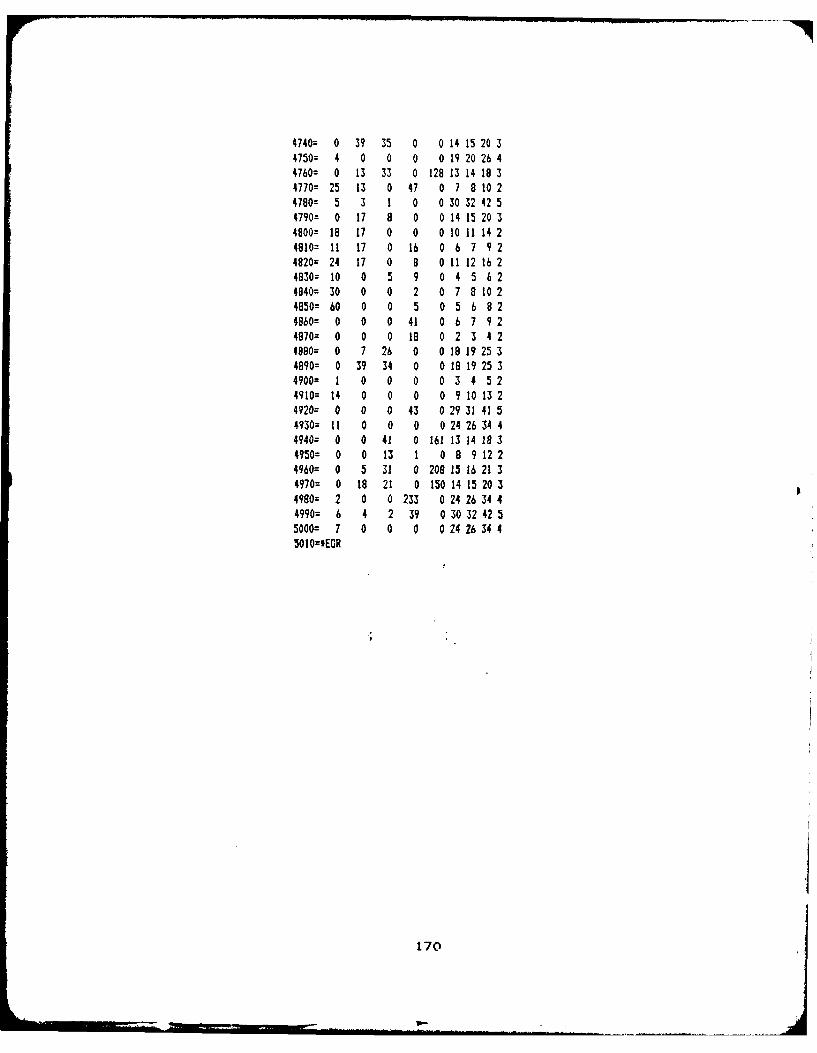
4740= 0 39 35 0 0 14 15 20 34750= 4 0 0 0 0 19 20 26 44760= 0 13 33 0 128 13 14 18 34770= 25 13 0 47 0 7 8 10 24780= 5 3 1 0 0 30 32 42 54790= 0 17 8 0 0 14 15 20 34800= 18 17 0 0 0 10 11 14 24810= 11 17 0 16 0 6 7 9 24820= 24 17 0 8 0 11 12 16 24830= 10 0 5 9 0 4 5 6 24840= 30 0 0 2 0 7 8 10 24850: 60 0 0 5 0 5 6 8 24860= 0 0 0 41 0 6 7 9 24870= 0 0 0 18 0 2 3 4 24880= 0 7 26 0 0 18 1925 34890= 0 39 34 0 0 18 19 25 34900: 1 0 0 0 0 3 4 524910: 14 0 0 0 0 9 10 13 24920= 0 0 0 43 029 31 41 54930= 11 0 0 0 0 24 26 34 4
4940= 0 0 41 0 161 13 14 18 34950= 0 0 13 1 0 8 9 12 24960= 0 5 31 0 208 15 16 21 34970= 0 18 21 0 150 14 15 20 3
4980= 2 0 0 233 0 24 26 34 44990= 6 4 2 39 0 30 32 4255000= 7 0 0 0 0 24 26 34 45010=*ECR
170
APPENDIX 6
SLAM SUMMARY REPORTS
171

FILE ASSOCIATED ASSOCIATEDNUMBER RESOURCE ACTIVITY
1 NONE SLAM event file.
2 NODEPBIL Permanent Billeting fornon-deploying augmentees.
3 RECPOINT Personnel reception location.
4 INCHECKER Initial personnel receptionand direction.
5 TRABIL Temporary billeting fordeploying personn( 1.
6 BUS Transportation to billetingfrom reception.
7 BILFEED Feeding capacity inbilleting.
B BUS Transportation to passenger
staging from billeting.
9 PAXSTG Passenger staging.
10 BUS Bus to passenger terminalfrom staging.
11 PAXTERM Passenger Terminal.
12 PAXAGENT Passenger Agent.
13 BUS Transportation to aircraft
from passenger terminal.
14 BUS Transportation to passengerstaging from reception point.
15 BUS Transportation from mobilityline to passenger staging.
16 CARGAGNT Agent to receive, initially
inspect unit related cargo.
17 WASHRACK Vehicle washing location.
18 VEHPROS Vehicle processingcrew/location.
19 VEHPARK Vehicle marshalling.
172

FILE ASSOCIATED ASSOCIATEDNUMBER RESOURCE ACTIVITY
20 JITEAM Unit related vehicleinspection.
21 WASHRACK Frustrated vehicle washing.
22 MARSFORK Forklift to unload unitrelated cargo from truck.
23 MARSAREA Pallet marshalling area.
24 JITEAM Unit related palletinspection.
25 MARSFORK Forklift to load unit relatedcargo on K-loader.
26 MARSFORK Forklift to move unit relatedcargo to frustrated cargoarea.
27 FRUSTCAR Frustrated cargo rework area.
28 MARSFORK Forklift to move unit relatedcargo from frustrated area tomarshallling area.
29 NRCRECPT Non-unit cargo receptionarea.
30 NRCAGENT Non-unit cargo receivingagent.
31 TERMFORK Forklift to unload non-unit
cargo from truck.
32 MARSAREA Pallet marshalling area.
33 PALTEAM Palletizing crew for non-unit
cargo.
34 TERMFORK Forklift to load non-unit
cargo on K-loader.
35 EXMARS Explosives marshalling area.
36 PALTEAM Palletizing crew for
explosives.
173

FILE ASSOCIATED ASSOCIATEDNUMBER RESOURCE ACTIVITY
37 EXFORK Forklift to load explosives onK-loader.
38 EXFORK Forklift to unload explosivesfrom truck.
39 MARSAREA Pallet marshalling area.
40 BOXLUN Box lunches for staging and
flight.
174

ESTIMATED RESOURCES
100= PASSENGER PERCENTAGE = 1.110= CARGO PERCENTAGE = .8505873201089120=140= SLAM SUMMARY REPORT170= SIMULATION PROJECT RECEPTION MODE L BY G. L. WHITE190= DATE 1/ 7/1983 RUN NUMBER I or 1220= CURRENT TINE .7200E+03"30= STATISTICAL ARRAYS CLEARED AT TIME 0.270= *FILE STATISTICS**280=290= FILE ASSOCIATED AVERAGE STANDARD MAXIMUM CURRENT AVERAGE300= NUMBER NODE TYPE LENGTH DEVIATION LENGTH LENGTH WAITING TIME320= 1 29.6001 14.4642 491 14 21.7027330= 2 AWAIT 0.0000 0.0000 0 0 0.0000340= 3 AWAIT 0.0000 0.0000 I 0 0.0000350= 4 AWAIT .0003 .0171 1 0 .0011360= 5 AWAIT 0.0000 0.0000 1 0 0.0000370= 6 AWAIT 0.0000 0.0000 1 0 0.0000380= 7 AWAIT 0.0000 0.0000 1 0 0.0000390= 8 AWAIT 0.0000 0.0000 1 0 0.0000400= 9 AWAIT 0.0000 0.0000 1 0 0.0000410= 10 AWAIT 0.0000 0.0000 0 0 0.0000420= 11 AWAIT 0.0000 0.0000 1 0 0.0000430= 12 AWAIT 0.0000 0.0000 1 0 0.0000440= 13 AWAIT 0.0000 0.0000 1 0 0,0000450= 14 AWAIT 0.0000 0.0000 1 0 0.0000460= 15 AWAIT 0.0000 0.0000 1 0 0.0000470= 16 AWAIT .0007 .0262 1 0 .0015480: 17 AWAIT 4.4479 5.8474 20 0 1.3071490= 18 AWAIT .0605 .3866 6 0 .0132500= 19 AWAIT 0.0000 0.0000 1 0 0.0000510: 20 AWAIT .7358 2.3717 28 0 .1533520= 21 AWAIT .0171 .1311 2 0 .0779530= 22 AWAIT 0.0000 0.0000 1 0 0.0000540L 23 AWAIT 0.0000 0.0000 1 0 0.0000550= 24 AWAIT 5.9007 16.2826 97 0 3.2959560= 25 AWAIT 0.0000 0.0000 1 0 0.0000570= 26 AWAIT 0.0000 0.0000 1 0 0.0000580= 27 AWAIT 0.0000 0.0000 1 0 0.0000590: 28 AWAIT 0.0000 0.0000 1 0 0.0000600: 29 AWAIT 0.0000 0.0000 1 0 0.0000610a 30 AWAIT .1284 1.4982 37 0 .0535620= 31 AWAIT .0006 .0416 6 0 .0003630: 32 AWAIT 0.0000 0.0000 1 0 0.0000640= 33 AWAIT .8554 6.1092 92 0 .3560650s 34 AWAIT .0001 .0074 2 0 .0000660= 35 AWAIT 0.0000 0.0000 I 0 0.0000670m 36 AWAIT .0192 .2186 7 0 .0292680= 37 AWAIT .1513 1.4856 31 0 .2303690: 38 AWAIT .0045 .0667 1 0 .0068700z 39 AWAIT 0.0000 0.0000 1 0 0.0000710: 40 AWAIT 0.0000 0.0000 1 0 0.0000
175

760= WtRESOURCE STATISTICS**770=780= RESOURCE RESOURCE CURRENT AVERAGE STANDARD MAXIMUM CURRENT790= NUMBER LABEL CAPACITY UTILIZATION DEVIATION UTILIZATION UTILIZATION800=810= 1 NODEPBIL 1376 0.0000 0.0000 0 0820= 2 RECPOINT 2000 24.3571 39.7535 243 0830= 3 INCHECKR 3 .1493 .4215 3 0840= 4 BUS 26 .26B3 .8431 .6 0850= 5 PAXST6 2000 33.5558 52.4915 459 15860= 6 BOXLUN 1000 18.6122 40.9107 459 15870= 7 BILFEEDI 1000 138.8771 169.5237 490 0880= 8 BILFEED2 1000 38.9491 69.6135 22 0890= 9 BILFEED3 3000 18.8704 47.5186 201 0900= 10 TRABILI 490 139.9279 170.5427 490 0910= 11 TRABIL2 227 39.1255 69.8213 222 0920= 12 TRABIL3 3000 19.0028 47.7500 201 0930= 13 PAXTER 2000 30.0309 48.2698 353 0940= 14 PAXAGENT 3 .1166 .3557 3 0950= 15 CARGAGNT 3 .3012 .5761 3 0960= 16 WASHRACK 2 .9714 .9837 2 0970= 17 VEHPROCS 5 .9823 1.3016 5 0980 = 18 VEHPARK 2000 153.2746 82.5240 363 183990= 19 JITEAM 3 1.3258 1.3517 3 01000= 20 KARSAREA 3000 240.3058 218.4783 835 4731010= 21 PALTEAM 26 2.5043 6.6114 26 221020= 22 EXFORK 6 .2621 .9475 6 01030: 23 EXMARS 2000 64.9889 108.5464 342 01040= 24 FRUSTCAR 500 .977 2.0793 16 01050= 25 ARSFORK 8 .18/. .5544 8 01060= 26 NRCRECPT 2000 .1767 1.8560 41 01070z 27 NRCA6ENT 4 .0483 .4299 4 01080= 28 TERNFORK 8 .1211 .6774 8 0
176

I00= WRESOURCE sTATISTICS'41110=
1120= RESOURCE RESOURCE CURRENT AVERAGE MINIMUM MAXIMUM1130= NUMBER LABEL AVAILABLE AVAILABLE AVAILABLE AVAILABL E1140=1150= 1 NODEPBIL 1376 1376.0000 1376 13761160= 2 RECPOINT 2000 1975.6429 1757 200C1170= 3 INCHECKR 3 2.8507 0 31180= 4 BUS 26 25.7317 20 261190= 5 PAXST6 1985 1966.4442 1541 20001200= 6 BOXLUN 985 981.3878 541 10001210= 7 DILFEEDI 1000 861.1229 510 10001220z 8 BILFEED2 1000 961.0509 778 10001230= 9 BILFEED3 3000 2981.1296 2799 30001240= 10 TRABILI 490 350.0721 0 4901250= 11 TRABIL2 227 187.8745 5 2271260= 12 TRABIL3 3000 2980.9972 2799 30001270= 13 PAXTERM 2000 1969.9691 1647 20001280= 14 PAIAGENT 3 2.8834 0 31290= 15 CARGAGNT 3 2.6988 0 31300= 16 WASHRACK 2 1.0286 0 21310= 17 VEHPROCS 5 4.0177 0 51320= 18 VEHPARK 1817 1846.7254 1637 20001330= 19 JITEAM 3 1.6742 0 31340= 20 NARSAREA 2527 2759.6942 2165 30001350= 21 PALTEAM 4 23.4957 0 261360= 22 EXFORK 6 5.7379 0 61370= 23 EIMARS 2000 1935.0111 1658 20001380-= 24 FRUSTCAR 500 499.0262 484 50013902 25 MARSFORK 8 7.8126 0 81400= 26 NRCRECPT 2000 1999.8233 1959 20001410= 27 NRCA6ENT 4 3.9517 0 41420= 28 TERMFORK 8 7.8789 0 81430=*EOR
177

A134.433 AERIAL PORT OF EMBARKATION CAPABILITY PLANNING VOLUME 3 3/3SO(U O A) AIR FORCE INST OF TECH WRIGH -PATTERSON AFB OHSCHOOL OF SYSTEMS AND LOGISTICS T W CHRISTENSEN ETI AL.
JNCLASSIFIED SEP 83 AFIT LSSR-B2-8 F/G 15/5 NL
mhhE~hhl11- 831

1 .0 2~ 5
1.25 __ 1

UNLIMITED RESOURCES
100= PASSENGER PERCENTAGE 1.110z CARGO PERCENTAGE I.120:140: SL AM SUMMARY REPORT170= SIMULATION PROJECT RECEPTION MODEL BY 6. L. WHITE190= DATE 1/ 7/1983 RUN NUMBER I OF I220= CURRENT TIME .7200E+03230= STATISTICAL ARRAYS CLEARED AT TIN E 0.270= **FILE STATISTICSff280=290= FILE ASSOCIATED AVERAGE STANDARD MAXIMUM CURRENT AVERAGE300= NUMBER NODE TYPE LENGTH DEVIATION LENGTH LENGTH WAITING TIME320= 1 29.6001 14.4642 491 14 21.7027330= 2 AWAIT 0.0000 0.0000 0 0 0.0000340= 3 AWAIT 0.0000 0.0000 1 0 0.0000350= 4 AWAIT 0.0000 0.0000 1 0 0.00003bO= 5 AWAIT 0.0000 0.0000 1 0 0.0000370= 6 AWAIT 0.0000 0.0000 1 0 0.0000580= 7 AWAIT 0.0000 0.0000 1 0 0.0000390= 8 AWAIT 0.0000 0.0000 1 0 0.0000400= 9 AWAIT 0.0000 0.0000 1 0 0.0000410 = 10 AWAIT 0.0000 0.0000 0 0 0.0000420= 11 AWAIT 0.0000 0.0000 1 0 0.0000430= 12 AWAIT 0.0000 0.0000 1 0 0.0000440= 13 AWAIT 0.0000 0.0000 1 0 0.0000450= 14 AWAIT 0.0000 0.0000 1 0 0.0000460= 15 AWAIT 0.0000 0.0000 1 0 0.0000470= 16 AWAIT 0.0000 0.0000 1 0 0.0000480= 17 AWAIT 0.0000 0.0000 1 0 0.0000490= IB AWAIT 0.0000 0.0000 1 0 0.0000500= 19 AWAIT 0.0000 0.0000 1 0 0.0000510= 20 AWAIT 0.0000 0.0000 1 0 0.0000520= 21 AWAIT 0.0000 0.0000 1 0 0.0000530= 22 AWAIT 0.0000 0.0000 1 0 0.0000540= 23 AWAIT 0.0000 0.0000 1 0 0.0000550= 24 AWAIT 0.0000 0.0000 1 0 0.0000560= 25 AWAIT 0.0000 0.0000 1 0 0.0000570= 26 AWAIT 0.0000 0.0000 1 0 0.0000580= 27 AWAIT 0.0000 0.0000 1 0 0.0000590= 28 AWAIT 0.0000 0.0000 1 0 0.0000600= 29 AWAIT 0.0000 0.0000 1 0 0.0000610= 30 AWAIT 0.0000 0.0000 1 0 0.0000620= 31 AWAIT 0.0000 0.0000 1 0 0.0000630z 32 AWAIT 0.0000 0.0000 1 0 0.0000640= 33 AWAIT 0.0000 0.0000 1 0 0.0000650= 34 AWAIT 0.0000 0.0000 1 0 0.0000660= 35 AWAIT 0.0000 0.0000 1 0 0.0000670 = 36 AWAIT 0.0000 0.0000 1 0 0.0000680= 37 AWAIT 0.0000 0.0000 1 0 0.0000690= 38 AWAIT 0.0000 0.0000 1 0 0.0000700: 39 AWAIT 0.0000 0.0000 1 0 0.0000710= 40 AWAIT 0.0000 0.0000 1 0 0.0000
178

760= *'RESOURCE STATISTICS'*770=780= RESOURCE RESOURCE CURRENT AVERAGE STANDARD MAXIMUM CURRENT790z NUMBER LABEL CAPACITY UTILIZATION DEVIATION UTILIZATION UTILIZATION800=810= I NODEPBIL 1376 0.0000 0.0000 0 0820= 2 RECPOINT 2000 23.78/4 39.6374 243 0830: 3 INCHECKR 100 .1525 .4201 4 0840= 4 BUS 100 .2607 .8115 6 0850= 5 PAXSTG 2000 33.6367 52.5933 459 15860= 6 BOXLUN 1000 18.6116 40.8823 459 15870= 7 BILFEEDI 1000 138.8099 169.4668 490 0800= B BILFEED2 1000 39.6712 70.3036 222 0890= 9 BILFEED3 3000 18.8157 47.4355 201 0900= 10 TRABILI 490 139.7623 170.3784 490 0910= 11 TRABIL2 227 39.8651 70.5784 222 0920: 12 TRABIL3 3000 18.9676 47.6909 201 0930= 13 PAXTERM 2000 30.2391 48.2487 33 0940= 14 PAXWENT 100 .1166 .3557 3 0950= 15 CARGAGNT 100 .2950 .5804 4 0960= 16 WASHRACK 100 .9823 3.6235 49 0970 = 17 VEHPROCS 100 .9914 2.9047 41 0980= 18 VEfPARK 2000 201.0457 103.0331 479 187990= 19 JITEAM 100 1.3308 3.1045 40 01000= 20 MARSAREA 3000 240.1031 218.9295 835 4731010= 21 PALTEAN 100 2.4948 7.7273 81 221020= 22 EXFORK 100 .2629 1.1654 20 01030= 23 EXMARS 2000 64.8864 108.5441 342 01040= 24 FRUSTCAR 500 .9706 2.0779 18 01050= 25 MARSFORK 100 .1893 .5569 7 01060= 26 NRCRECPT 2000 .0480 1.0392 41 01070= 27 NRCAGENT 100 .0480 1.0392 41 01080= 28 TERMFORK 100 .1219 :1.1529 41 0
179

1lw0= "oRESOURCE STATISTICS##1110:
1120= RESOURCE RESOURCE CURRENT AVERAGE MINIMUM MAXIMUM1130= NUMBER LABEL AVAILABLE AVAILABLE AVAILABLE AVAILABLE1140=1'50= I NODEPBIL 1376 1376.0000 1376 1376160= 2 RECPOINT 2000 1976.2126 1757 20001170= 3 INCHECKR 100 99.8475 96 1001BO= 4 BUS 100 99.7393 94 1001190= 5 PAXSTG 1985 1966.3633 1541 20001200= 6 BOXLUN 985 981.3884 541 10001210= 7 BILFEEDI 1000 861.1901 510 10001220z 8 BILFEED2 1000 960.3288 778 10001230= 9 BILFEED3 3000 2981.1843 2799- 30001240= 10 TRABILI 490 350.2377 0 4901250= It TRABIL2 227 187.1349 5 2271260= 12 TRABIL3 3000 2981.0324 2799 30001270= 13 PAXTERM 2000 1969.7609 1647 20001280: 14 PAIANENT 200 99.8834 97 1001290= 15 CARGAGNT 100 99.7050 96 1001300= 16 WASHRACK 100 99.0177 51 1001310= 17 VEHPROCS 100 99.0086 59 2001320= IB VEHPARK 1813 1798.9543 1521 20001330= 19 JITEAM 100 98.6692 60 1001340= 20 MARSAREA 2527 2759.8969 2165 30001350= 21 PALTEAM 78 97.5052 19 1001360= 22 EXFORK 100 99.7371 8o 1001370= 23 EXMARS 2000 1935.1136 .1658 20001380= 24 FRUSTCAR 500 499.0294 482 5002390= 25 MARSFORK 100 99.8107 93 1002400= 26 NRCRECPT 2000 1999.9520 1959 20001410= 27 NRCAGENT 100 99.9520 59 1001420= 28 TERMFORK 100 ;99.8781 59 1001430=4EOR
180

RECOMMENDED RESOURCES
100= PASSENGER PERCENTAGE z 1.110= CARGO PERCENTAGE =.95578214855271320Z140= S L AM SU MM A RY RE PO0R T170z SIMULATION PROJECT RECEPTION MODEL BY 6. L. WHITE1902 DATE 1/ 7/1983 RUN NUMBER I OF 1220= CURRENT TIME .7200E+03230z STATISTICAL ARRAYS CLEARED AT TIME 0.270: *#FILE STATISTICS**280=290a FILE ASSOCIATED AVERAGE STANDARD MAXIMUM CURRENT AVERAGE300: NUMBER NODE TYPE LENGTH DEVIATION LENGTH LENGTH WAITING TIME320= 1 29.6001 14.4642 491 14 21.7027330= 2 AWAIT 0.0000 0.0000 0 0 0.0000340= 3 AWAIT 0.0000 0.0000 1 0 0.0000350= 4 AWAIT .0003 .0169 1 0 .0011360= 5 AWAIT 0.0000 0.0000 1 0 0.0000370= 6 AWAIT 0.0000 0.0000 1 0 0.0000380= 7 AWAIT 0.0000 0.0000 1 0 0.0000390: 8 AWAIT 0.0000 0.0000 1 0 0.0000400: 9 AWAIT 0.0000 0.0000 1 0 0.0000410= 10 AWAIT 0.0000 0.0000 0 0 0.0000420: 11 AWAIT 0.0000 0.0000 1 0 0.00004310= 12 AWAIT 0.0000 0.0000 1 0 0.0000440= 13 AWAIT 0.0000 0.0000 1 0 0.0000450z 14 AWAIT 0.0000 0.0000 1 0 0.0000460= 15 AWAIT 0.0000 0.0000 1 0 0.0000470z 16 AWAIT .0002 .0145 1 0 .0005480= 17 AWAIT 4.4145 5.8218 20 0 1.2973490= 18 AWAIT .0623 .3977 6 0 .0135500: 19 AWAIT 0.0000 0.0000 1 0 0.0000510: 20 AWAIT .2188 .9767 13 0 .0455520= 21 AWAIT .0143 .1211 2 0 .0703530: 22 AWAIT 0.0000 0.0000 1 0 0.0000540= 23 AWAIT 0. 0000 0.0000 1 0 0. 0000550: 24 AWAIT 1.1375 5.8984 58 0 .6305560: 25 AWAIT 0.0000 0.0000 1 0 0.0000570= 26 AWAIT 0. 0000 0.0000 1 0 0.0000580: 27 AWAIT 0.0000 0.0000 1 0 0.0000590: 28 AWAIT 0.0000 0.0000 1 0 0.0000600= 29 AWAIT 0.0000 0. 0000 1 0 0. 0000610z 30 AWAIT .1288 1.5008 37 0 .0536620= 31 AWAIT .0004 .0250 3 0 .0002630z 32 AWAIT 0.0000 0.0000 1 0 0.00006402 33 AWAIT 2.8602 13.0750 145 4 1.1904650= 34 AWAIT .0000 .0067 1 0 .0000660: 35 AWAIT 0.0000 0.0000 1 0 0.0000670: 36 AWAIT .0377 .2674 5 0 .0574680= 37 AWAIT .1492 1.4226 26 0 .2271690z 39 AWAIT .0045 .0669 1 0 .0068700= 39 AWAIT 0.0000 0.0000 1 0 0.0000710m 40 AWAIT 0.0000 0.0000 1 0 0.0000

I10O: *RESOURCE STATISTICS*#1110=11:0= RESOURCE RESOURCE CURRENT AVERAGE MINIMUM MAJIMUM1130= NUMBER LABEL AVAILABLE AVAILABLE AVAILABLE AVAILABL E1140=1150= I NODEPBIL 1376 1376.0000 1376 13761160= 2 RECPOINT 2000 1976.3246 1757 20001170= 3 INCHECKR 3 2.8486 0 31160= 4 BUS 26 25.7242 20 2611,0= 5 PAXSTG 1985 1966.4389 1647 20001200= 6 B0XLUN 985 981.3889 541 10001210= 7 BILFEEDI 1000 861.1564 510 10001220= 8 BILFEED2 1000 960.3324 778 10001230= 9 BILFEED3 3000 2981.1154 2799 30001240= 10 TRABILI 490 350.1176 0 4901250= 11 TRABIL2 227 187.0985 5 2271260= 12 TRABIL3 3000 2980.9993 2799 30001270= 13 PAXTERN 2000 1970.0601 1647 20001280= 14 PAAGENT 3 2.8834 0 31290= 15 CARGAGNT 3 2.7009 0 3
1300= 16 WASHRACK 2 1.0357 01310= 17 VEHPROCS 5 4.0201 0 51320= 18 VEHPARK 1825 1849.7923 1632 20001330= 19 JITEAM 4 2.6743 0 4
1340= 20 MARSAREA 2527 2760.1609 2165 30001350= 21 PALTEAM 0 15.4997 0 221360= 22 EXFORK 6 5.7367 0 61370= 23 EXMARS 2000 1935.0292 1658 20001380= 24 FRUSTCAR 500 498.9841 482 5001390= 25 MARSFORK 8 7.8091 2 81400= 26 NRCRECPT 2000 1999.8230 1959 20001410= 27 NRCAGENT 4 3.9518 0 41420= 28 TERMFORK 8 .7.8789 0 81430=4EOR
182

*RESOURCE STATISTICS..770:780= ESOURCE RESOURCE CURRENT AVERAGE STANDARD MAXIMUM CURRENT79i: NUMBER LAEL CAPACITY UTILIZATION DEVIATION UTILIZATI N UTILIZATION8("o=810= 1 NODEPBIL 1:76 0,0000 0.0000 0 0820= 2 RECPOINT 2000 23.6754 39.3922 243 0B8O= 3 iNCHECKR 3 .1514 .4233 3 0B:t= 4 BUS 26 .2728 .8383 6 0850= 5 PAXSTG 2000 33.5611 52.3036 53 15860= 6 BOXLUN 1000 18.6111 40.9763 459 15870= 7 BILFEFDI 1000 138.8436 169.5595 490 0880= 8 BILFEED2 1000 39.6676 70,331" 22 0890= 9 BILFEED3 3000 18.8846 47,5921 201 0900= 10 TRABILI 490 139.8824 170.55)2 490 0910= 11 TRABIL2 227 39.9015 70.6245 222 0q20= 12 TRABIL3 3000 19.0007 47.7996 201 0930= 13 PAXTERM 2000 29.q399 48.1793 353 0940= 14 PAXAGENT 3 1166 .3557 3 0
950= 15 CAR6AGNT 3 .2991 .5704 3 0960= 16 WASHRACK 2 .9643 .9832 2 0970= 17 VEHPROCS 5 .9799 1.3065 5 0980= 18 VEMPARK 2000 150.2077 82.1195 368 175990: 19 JITEA 4 1.3257 1.5284 4 01000= 20 MARSAREA 3000 239.8391 218.8314 235 4731010: 21 PALTEAI 22 2.5003 5.8080 2? 221020= 22 EXFORK 6 .2633 .9479 6 01030= 23 EXARS 2000 64.9708 108.4994 342 01040= 24 FRUSTCAR 500 1.0159 2.1335 18 01050= 25 MARSFORK 8 .1909 .5561 7 01060= 26 NRCRECPT 2000 .1770 1.8586 41 01070= 27 NRCAGENT 4 .0482 .4293 4 01080= 26 TERMFORK 8 .1211 -.6781 8 0
183

APPENDIX H
STATISTICAL ANALYSIS
184

RATIOS OF CARCO PREPARED ON TIME
GROUP 1: AVERAGE .9580
JOINT INSPECTION TEAMS: 4
PALLETIZING CREWS: 26
GROUP 1 RUN I = .9744GROUP I RUN 2 = .9718
GROUP I RUN 3 = .9434GROUP I RUN 4 = .9751
Gi OLP 1 RUN 5 = .9452
GROUP i RUN 6 = .9698
GROUP I RUN 7 = .9328
GROUP 1 RUN 8 = .9516
GROUP 1 RUN 9 = .9655
GROUP 1 RUN 10 = .9508
&ROUP 2: AVERAGE .9841JOINT INSPECTION TEAMS: 5PALLETIZINS CREWS: 26
GROUP 2 RUN 1 = .9801GROUP 2 RUN 2 = .9946GROUP 2 RUN 3 = .9899GROUP 2 RUN 4 = .9894
GROUP 2 RUN 5 .984GROUP 2 RUN 6 .9851GROUP 2 RUN 7 = .9786
GROUP 2 RUN a = .9884
GROUP 7 RUN 9 =..9825
GROUP 2 RUN 10 = .9789
SROUP 3: AVERAGE .8342JOINT INSPECTION TEAMS: 3
PALLETIZING CREWS: 26
GROUP 3 RUN 1 = .6841
GROUP 3 RUN 2 = .8658GROUP 3 RUN 3 = .8718
GROUP 3 RUN 4 = .8424GROUP 3 RUN 5 = .9049GROUP 3 RUN 6 = .8326GROUP 3 RUN 7 = .8464GROUP 3 RUN 8 = . 8533GROUP 3 RUN 9 = .8369GROUP 3 RUN 10 = .7839
185

GOUP 4: AVERAGE .1959JOINT INSPECTION TEAMS: 2PALLETIZING CREWS: 26
GROUP 4 RUN 1 = . 2654GROUP 4 RUN = .1854GROUP 4 RUN 3 = .1839GROUP 4 RUN 4 = .1949
GROUP 4 RUN 5 = 224GROUP 4 RUN 6 = .1718GROUP 4 RUN 7 = .1485GROUP 4 RUN 8 = .2093GROUP 4 RUN 9 = . 1665GROUP 4 RUN 10 = -2097
GROUP 5: AVERAGE .9644
JOINT INSPECTION TEAMS: 4
PALLETIZING CREWS: 22
GROUP 5 RUN 1 = .9577GROUP 5 RUN 2 = .9617GROUP 5 RUN 3 = .9698GROUP 5 RUN 4.= .9605GROUP:5 RUN 5 = .9746GROUP 5 RUN 6 = .9792GROUP 5 RUN 7 = .9491GROUP 5 RUN 8 = .9708GROUP,-5 RUN 9 = .9472GROUP 5 RUN 10 = .9547
GROUP 6: AVERAGE .9602JOINT INSPECTION TEAMS: 4PALLETIZING CREWS: 18GROUP 6 RUN 1 = .9517GROUP 6 RUN 2 = .9636GROUP 6 RUN 3 = .9774GROUP 6 RUN 4 = .9561GROUP 6 RUN 5 = .933GROUP 6 RUN 6 = .963
GROUP 6 RUN 7 = .9593GROUP 6 RUN 8 = .9718GROUP 6 RUN 9 = .9716GROUP 6 RUN 10 = .9545
186

GROUP 7: AVERAGE .94B2
JOINT INSPECTION TEAMS; 4
PALLETIZING CREWS: 14
GROUP 7 RUN 1 = .9515GROUP 7 RUN 21 = .9546GROUP 7 RUN 3 = .963-5
GROUP 7 RUN 4 = .9562
GROUP 7 RUN 5 = .9567GROUP 7 RUN 6 = .9664GROUP 7 RUN 7 =.93
GROUP 7 RUN 8 = .9345GROUP 7 RUN 9 = .9437
GROUP 7 RUN 10 = .9216
GROUP 6: AVERAGE .9095
JOINT INSPECTION TEAMS: 4
PALLETIZING CREWS: 10
GROUP 8 RUN 1 =.9271GROUP 8 RUN 2 = .9116GROUP 8 RUN Z% = .9211GROUP 8 RUN 4 = .906GROUP 8 RUN 5 = .9074GROUP B RUN 6 =.8869GROUP 8 RUN 7 =.9135GROUP B RUN 8 = .901GROUP 8 RUN 9 .9214
GROUP 8 RUN 10 .8944
GROUP 9: AVERAGE .5082SENSITIVITY ANALYSISJOINT INSPECTION TEAMS: 4
PALLETIZING CREWS: 18
GROUP 9 RUN 1 = .5375GROUP 9 RUN 2 = .6495GROUP 9 RUN 3 = .3194GROUP 9 RUN 4 = .51GROUP 9 RUN 5 = .5111GROUP 9 RUN 6 = .3374GROUP 9 RUN 7 = .642GROUP 9 RUN 8 = .5947GROUP 9 RUN 9 = .3885GROUP 9 RUN 10 = .5914
1837

NONPARAMETRIC RANKINGS BY GROUP
GROUP IRUN1 =76 GROUP 4RUN1 =10
GROUP 1 RUN 2 = 74.5 GROUP 4 RUN 2 = 5
GROUP IRUN3 =46 GROUP 4RUN3 =4
GROUP 1RUN4 =78 GROUP 4RUN4 =6
GROUP 1 RUN5 =48 GROUP 4RUN 5 =9
GROUP 1 RUN 6 =70.5 GROUP 4 RUN 6 = 3
GROUP IRUN7 =42 CROUP 4RUN 7 =
GROUP 1RUN 8 =3 GROUP 4RUN8 =7
GROUP IRUN 9= 68 GROUP 4RUN9 =2
GROUP 1 RUN 10 =51 6ROUP 4 RUN 10 =8
GROUP 1 MEAN = 60.7 GROUP 4 MEAN = 5.5
GROUP 2RUN1 =83 GROUP 5RUN1=81GROUP 2RUN 2 =86 GROUP 5RUN2 =64
GROUP 2 RUN 3 = 90 GROUP 5 RUN 3 =70.5
GROUP 2RUN4 =89 GROUP 5RUN4 =63
GROUP 2RUN 5=85 GROUP 5RUN 5=77
GROUP 2RUN6 =87 GROUP 5RUN6 =82
GROUP 2RUN7 =80 GROUP 5RUN 7 =50
GROUP 2 RUN 6 = 88 'GROUP 5 RUN 8 = 72
GROUP 2RUN9 =84 GROUP 5RUN9 =49
GROUP 2 RUN 10 =81 GROUP 5 RUN 10 = 57
GROUP 2 MEAN = 85.3 GROUP 5 MEAN = 64.55
GROUP 3 RUN 1 = 21 GROUP 6 RUN 1 = 54
GROUP 3RUN2 =29 GROUP 6RUN2 =67GROUP 3RUN3 =2B GROUP 6RUN3 =79
GROUP 3RUN4 =25 GROUP 6RUN4 = 8
GROUP 3 RUN 5 = 33 GROUP 6 RUN 5 =43.5
GROUP 3RUN6 =23 GROUP 6RUN6 =65
GROUP 3RUN7 =26 GROUP 6RUN7 =62GROUP 3 RUN 8 = 27 GROUP 6 RUN 8 = 74.5
GROUP 3RUN9 =24 GROUP 6RUN9 =73
GROUP 3 RUN 10 =22 GROUP 6 RUN 10 =55
GROUP 3 MEAN = 25.8 GROUP 6 MEAN =63.1
188

GROUP 7 RUN 1 = 52GROUP 7 RUN 2 = 56GROUP 7 RUN 3 = 66GROUP 7 RUN 4 = 59GROUP 7 RUNS5 = 60GROUP 7 RUN 6 =69GROUP 7 RUN 7 = 43.5GROUP 7 RUN 8 = 45GROUP 7 RUN 9 = 47GROUP 7 RUN 10 =40
GROUP 7 MEAN = 53.75
GROUP 8 RUN 1 = 41GROUP B RUN 2 = 36GROUP 8 RUN 3 =38GROUP 8 RUN 4 = 35GROUP 8 RUN 5 = 34GROUP 8 RUN 6 = 30GROUP 8 RUN 7 = 37GROUP 8 RUN 8 = 32GROUP 8 RUN 9 = 39GROUP 8 RUN 10 =31
GROUP 8 MEAN- 35.3
GROUP 9 RUN 1 = 16GROUP 9 RUN 2 = 20GROUP 9 RUN 3 = 11GROUP 9 RUN 4 = 14GROUP 9 RUN 5 = 15GROUP 9 RUN 6 = 12GROUP 9 RUN 7 = 19GROUP 9 RUN 8 = 18GROUP 9 RUN 9 = 13GROUP 9 RUN 10 =17
GROUP 9 MEAN =15.5
189
. . -......

HYPOTHESIS TEST USING KRUSKAL-WALLIS TEST STATISTIC
H,: The means of group A and B are the same.H..: The means of group A and B are different.
Reject H. if T, > H.
= .10
H = 29.66395
T" values between groups
Group 1 2 3 4 5 6 7 8 91 24.6 34.9- 55.2- 3.8 2.4 7.0 25.4 45.2-2 59.5- 79.8- 20.8 22.2 31.6- 50.0- 69.8-3 20.3 38.8- 37.3- 28.0 9.5 10.34 59.0- 57.6- 48.2* 29.8- 10.05 1.4 10.8 29.2 49.1-6 9.4 27.8 47.67 18.4 38.2-8 19.2
* indicates the null hypothesis is rejected and there issignificant difference between the means of groups A and B.
190

COMPUTER CODE TO DETERMINE KRUSKAL-WgLLIS TEST STATISTIC
10 DIM D(10,10):DIM M(lO):DIM F(10):DIM G(10)20 N=930 FOR A=1TON40 FOR B=lT01050 READ D(A,B)60 PRINT#-2, 'GROUP";A; "RUN'B; "=';D(A,B)70 IF B=10 THEN PRINT#-280 NEXT B90 NEXT A100 FOR R=lT090110 X=1120 FOR C=1TON130 FOR E=1T010140 IF D(CqE)=X THEN GOTO 170150 IF D(C,E)<X THEN GOTO 160ELSE18O160 RP=1:X=D(C,E):FRP=c:GRP)=E:GoTO1Bo170 RP=RP+1:F(RP)=C:(RP)=E180 NEXT E190 NEXT C200 FOR Q=ITORP210 Z=Z+1220 ZT=ZT+Z230 NEXT Q240 ZM=ZT/RP250 FOR Q=1TORP260 D(F(Q),G(Q))=ZM270 NEXT 0280 ZT=0290 IF Z=90 THEN GOTO 310300 NEXTR310 FOR A=1TON320 FOR B=1TO1O330 S=D(A,B)+S340 PRINT#-2,"GROUP";A;"RuN";B;"=";D(A,B)350 IF B=10 THEN 360 ELSE 380360 PRINT#-2,'GROUP";A;"MEAN = ";S/10:PRINT#-2370 M(A)=S/10:S=0380 NEXT B
191

390 NEXT A400 H=2.539*(N*(N*10+I)/6)'.5410 PRINT#-2:PRINT#-2°' H = ";H:PRINT#-2420 PRINT#-2,"GOUPING TESTS"430 FOR A=ITON440 FOR B=ITON450 IF B<=A THEN 510460 S=ABS(M(A)-M(B))470 PRINT#-2,"TEST STATISTIC FOR GROUP";A;" .";B" =a;S480 IF S>H THEN PRINT#-2,"GROUP";B;"DIFFERS SIGNIFICANTLYFROM GROUP";A490 IF S<=H THEN PRINT#-2,"GROUP"B;"DOES NOT DIFFER FROMGROUP";A500 PRINT#-2510 NEXTB520 NEXTA530 DATA .9744,.9718,.9434,.9751,.9452,.9698,.9328,.9516,.9655..9508540 DATA .9801,.9846,.9899,.9894,.9840,.9851,.9786,.9884,.9825,.9789550 DATA .6841,.8858,.8718,.8424,.9049,.8326,.8464,.8533,.8369,.7839560 DATA .2654,.1854,.1839,.1949,.2234,.1718,.1485,.2093,.1665,.2097570 DATA .9577,.9617,.9698,.9605,.9746,.9792,.9491,.9708,.9472,.9547530 DATA .9517,.9636,.9774,.9561,.9330,.9630,.9593,.9718,.9716,.9545590 DATA .9515,.9546,.9635,.9562,.9567,.9664,.9330,.9345,.9437,.9216600 DATA .9271,.9118,.9211,.9086,.9074,.8869,.9135,.9010 ,.9214,.8944610 DATA .5375,.6495,.3194,.5100,.5111,.3374,.6420,.5947,.3885,.5914
192

APPENDIX I
USER'S MANUAL
193
. - _'Z'Z'. . . .. .. ... . .. - _ . .. .,---=. "2 .'° . .. . .. .. . -. . . . .. .

USER'-S MANUAL
This manual provides a summary of APOE reception
model concepts and the program development. The following
line by line analysis of the programed system parameters
and resources should help mobility planners who are
unfamiliar with SLAM and FORTRAN languages to experiment
with the model.
MODEL CONCEPTS
The SLAM model inputs entities into the system, which
flow through various activities. Entity attributes iden-
tify particular entities and direct their course through
the system activities. Activities represent various time
delays such as transportation or servicing times. Most
activities require resources, such as buses, forklifts, or
palletization crews. If an entitiy is scheduled for an
activity and the required resource is not available, the
entity enters a queue until the resource becomes avail-
able. Entities within a queue may be prioritized to re-
ceive the next available resource. Additionally, separate
queues drawing upon the same resource may be prioritized.
A planner may desire to experiment with the system by
changing priorities within or between queues.
For this model, a personnel entity represents the
194

total group of people associated with a particular FRN.
The number of people in the group is maintained in Attri-
bute 3. A cargo entity represents one pallet of cargo or
one vehicle. The average weight of a pallet or a vehicle
may be modified by the modeler. Adjusting the average
vehicle or pallet weight will change the number of
entities entering the system and subsuquent demand of
resources since the number of pallets or vehicles is
determined by dividing the total weight by the average
weight.
In addition to server resources, this model considers
space resources such as billeting, marshalling area,
vehicle parking area, and others. For this simulation
area resources were set artificially high to indicate max-
imum entity demand for a particular area. This approach
provides a planner with sizing figures. If the modeler
elects to use space resources which are less than the
demand, personnel or cargo will queue, preventing them
from flowing onto subsequent activities until the required
resource is available.
Activity duration may be determined by two means,
global XX(.) variables or user function distribution
subroutines. A global variable represents a set, prede-
termined or calculated value which can be referenced or
used throughout the system. For example, XX(3) = 12,
(Line 2260) means that every time XX(3) is referenced or
195

called in the simulation, the number 12 is used. A user
function, however, will return different numbers conform-
ing to a defined distribution or arithmetic operation each
time it is referenced or called. For this simulation,
activities which are generally base-specific such as
transportation times between different locations are rep-
resented with global variables. More universal type acti-
vities such as the time to build a pallet or inspect a
vehicle are represented with distribtuions. This allows a
planner to easily modify this model to different APOEs.
Planners can experiment with the system by changing either
global or user function activity times.
Finally, when the entity departs the system, SLAM
collects statistics. The departing personnel and cargo
are totalled and the final average ratio of on-time to
total departing personnel and cargo is returned at the end
of the selected simulation period. Additionally, SLAM
collects resource and queue statistics and summarizes this
information. Appendix 6 contains a 30 day SLAM summary for
the simulated TPFDD. Volume II contains actual classified
30 day summaries. The resource usage graphs in Volume 11
are obtained from 30 daily SLAM summaries. SLAM also
allows the flexibilty in collecting statistics so that the
planner may experiment with the system by collecting data
over various specific periods of time (eg. from day 7 to
day 12).
196

PROGRAM DEVELOPMENT
The simulation program consists of a SLAM network
and user written FORTRAN subroutines. The SLAM network
identifies the time duration for the simulation, desired
SLAM statistic collection, queue prioritization, resource
definition, and the actual activity network. The FORTRAN
subroutines are divided into event ;jutines, initializa-
tion routines, user functions, and allocation routines.
The event routines read the input data, generate entities
with appropriate attributes, and schedule entity arri-
vals. The initialization routine allows the user to set
desired values for the XX(.) global variables. The user
function subroutines define distribtuions or arithmetic
operations and return the resulting values. The alloca-
tion subroutine is used to assign billeting, buses, or
break bulk cargo into single pallet or vehicle entities.
System experimentation should be limited to adjusting
arrival or departure concepts in the event subroutine,
changing global variable initial values, or changing dis-
tribution parameters in the user functions since further
changes require an in depth understanding of SLAM and
FORTRAN.
197

PROGRAM ANALYSIS
DATA PREPARATION
The program requires nine data entries for each FRN.
The data cards must be generated with the data entered as
integers in the following order: bulk tons, over-size
tons, out-size tons, number of passengers, explosive tons,
ALD, EAD, LAD, type. The tons should be indicated in
short tons, and the ALD, EAD, and LAD expressed as C+0
day. The type codes are: 1 for non-deploying, 2 for unit
related off-base, 3 for non-unit related off-base, 4 for
unit related on-base, and 5 for non-unit related on-base.
The Fortran data read statements are formated so the data
must be in the exact format as the data presented in Vol-
ume II. A single space must preceed the bulk tons entry
on each card. The data cards may be generated by hand-
punching information extracted from the TPFDD or by a
WWMCCS generated tape.
SLAM NETWORK
All line number and value references relate to the
SLAM network listed in Appendix E.
Line 100 and 110 should not be changed.
To collect daily summaries rather than a 30 day
summary add lines:
114= MONTRSUMRY,24.0,24.0;
198

118= MONTR.CLEAR,24.0,24.0;
Lines 130 through 180 establish entitiy priority
within the queues. For example. for 18 .LVF(2)/. on Line
140 the 18 represents the await file number, LVF indicates
lowest value first, and the (2) means look at attribute 2
for the lowest value. For the 18SLVF(2)/ example, for all
the queued entities in file 18 (awaiting washrack) the ve-
hicle with the lowest attribute 2 value (scheduled depar-
ture time) would be selected first for the next available
washrack. The file number associated with a queue can be
obtained from the small number in the await node in the
SLAM flowchart (Figure I-1), or from the network resource
w*
Figure I-1
lines (Lines 200 through 750), or from the await node
glossary in Appendix G or Volume II. In this program,
await files 2 through 8 default to a first-in-first-out
priority. All other queues are prioritized to select the
entity with the nearest departure time. The user may
change the priority to last-in-first-out by changing LVF
to LIFO. A highest value priority is designated with the
199

letters HYF rather than LYF. To change the prioritizing
attribute, change the number in the parenthesis to
correspond to the desired attribute number.
Lines 200 through 750 define resource levels. The
number in parenthesis indicates the defined resource
levels initially available. The number following the
parenthesis identifies which await files or queues are
associated with this resource. Where more than one queue
is associated with a resource, the order of the queue
numbers determines the priority between the queues. For
example, line 260 represents the bus resources. Three
buses are initially available. Await queues 13, 10, 8, 6,
15, and 14 all require buses. If only one bus is avail-
able and all the queues have entities needing a bus those
in queue 13 would have priority and the particular entity
with the lowest value in attribute 2 would get the bus.
If await file 13 is empty then await file 10 would have
the next highest priority. The general philosophy in this
model assigns queue priority to the queues associated with
activities closest to departure.
In this model, resources are designated essential or
non-essential. Essential resources will force the entity
to enter a queue and wait for the resource to become
available. For non-essential resources such as feeding in
billeting a shortage will not prevent the entity from
progressing through the system. For billeting shortages
200

entities would queue until receiving billeting, or until
time to proceed to passenger staging. At this time they
would depart the billeting queue and proceed through the
network.
An explanation of the composition of each resource by
line further defines this model.
200= NODEPBIL, represents permanent billeting for
non-deploying personnel. Each number represents a bed for
one person.
220= RECPOINT, is a general area to initially receive
personnel and direct them to the appropriate area.
240= INCHECKER, is a person who initially receives
personnel, checks their unit identification and directs
them to the appropriate area.
260= BUS, is base supplied transportation to billet-
ing, passenger staging, the aircraft etc. All buses in
this model will carry 40 passengers.
280= PAXSTG. is a location where units can assemble
f or briefings before proceeding to the passenger termi-
nal. Each number represents space for one person.
300= BOXLUN, is a box lunch which each passenger will
receive in passenger staging and upon leaving the passen-
ger terminal. The simulation collects the number of lun-
ches required each hour.
320 through 360 represents feeding while in billet-
ing. This could be additional box lunches, or hot meals.
201

Each number represents one meal and each person will re-
quire three meals per day. These requirements do not use
BOXLUN resources from line .00.
380 and 400 represent on base temporary billeting.
Each number represents a bed for one person. TRABIL1 has
priority over and will be filled before using TRABIL2.
420 represents billeting overflow. TRABIL3 will not
be used unless TRABIL1 and TRABIL2 are full. TRABIL3 may
be off-base contract quarters or tents.
440= PAXTERM, represents space for one person in the
passenger terminal.
460= PAXAGENT, is an individual who will perform
final passenger briefings, anti-hijacking and other final
terminal responsibilities. One passenger agent will brief
an entire FRN.
480= CARGAGNT, is a person who initially receives and
examines the cargo paperwork and directs the cargo to the
appropriate unloading area.
500= WASHRACK is a location to wash vehicles. Each
vehicle needs one washrack if washing is required.
520= VEHPROCS, is the area and personnel who inspect,
weigh, stencil, drain and purge vehicles if required.
540= VEHPARK, is parking space for vehicle awaiting
departure. Each number represents space for one vehicle.
560= JITEAM, is a team representing the shipper,
APOE, and the aircrew. For this simultion Phase II load-
202

ing it assumed, so each joint inspection team will include
a qualified loadmaster. This allows cargo inspection as
soon as the team is ready, rather than the shipper and
APOE waiting for the aircrew to arrive before beginning
inspection.
580= MARSAREA is the marshalling area for unit and
non-unit related cargo. Cargo requires marshalling area
as soon as it is unloaded from the truck. Each number
represents space for one pallet.
600= PALTEAM, is a palletizing team. For this sim-
ulation a palletizing team represents qualified loaders
with a forklift and a rotating inspector to correct defi-
ciencies on the spot. After the pallet is built the in-
spector insures it is airworthy and the team then moves it
to final marshalling.
620= EXFORK, are forklifts in the explosive marshal-
ling area to unload trucks and load K-loaders.
640= EXMARS, is the explosive marshalling area. Each
number is space for one pallet.
660= FRUSTCAR, is a location where unit-related pal-
lets can be broken down and reworked. Each number repre-
sents space for one pallet.
680= MARSFORK, is a forklift to unload trucks and
load K-Loaders in the marshalling area.
700= NRCECPT, is an area to receive non-unit related
cargo. All this cargo will require palletization. Each
203

number represents one pallet's worth of cargo.
720= NRCAGENT. is an individual who receives non-unit
cargo, inspects accompanying paperwork, and directs the
cargo to its processing area.
740= TERMFORK, is a forklift in the cargo terminal
area used to unload non-unit related cargo.
Lines 770 through 4370 are the system network.
Without an understanding of SLAM do not change these
lines.
Line 4390 determines the simulation duration. The
first number is the start time and the second number is
the finish time. For this simulation the simulation ran
from hour 0 to hour 720 (30 days).
FORTRAN SUBROUTINES
Do not change any line in the main program, line 100
through 290.
The event subroutine (line 340 through 1980) should
be changed only to modify the FRN arrival or departure
scheduling. The arrival time, stored in attribute 1 is
calculated in line 680 through 700. For this simulation
the arrivals are determined from the TPFDD ALD. A 24 hour
arrival window defined by 0000 hours to 2400 hours is
established. From this window the arrival time is drawn
from an uniform distribution. The departure time is
calculated in lines 730 through 780. More factors are
204

involved in establishing a realistic departure time than
in determining the arrival time. First the departure time
must. be at least the arrival time plus a minimum time for
APOE processing (Line 730). For a very large FRN the APOE
will require more time to process it, so this preparation
time is considered in Line 740. The cargo should not
depart the APOE to arrive at the POD prior to the EAD so
this situation is accouinted for in Line 760. Line 770
selects the highest of these three values which represents
the very earliest the FRN could depart. The latest depar-
ture parameter is the latest the FRN could depart the APOE
and still arrive at the POD by 2400 hours on the LAD.
These two values define a window of time from the earliest
possible to the latest allowable departure time. From
this window the actual departure time is drawn from a
uniform distribution.
Lines 780 through 910 assign-attributes and manipu-
l ate SLAM f il1es.
Another modification a user might consider is the
vehicle/pallet mix~ture. Lines 920 through 960 are two
switched vehicle computation methods. If XX(52) = 1, 75%.
of unit rel ated and 10%/ of non-uni t related cargo is con-
sidered vehicular. The user may change these percentages
in Lines 920 and 930. If XX(52) = 05 all outsized and
oversized cargo are considered vehicles and all bulk cargo
is considered pallets.
205

The initialization subroutine (Lines 2030 through
4030) sets the values for all the global variables. In
this section each variable is explained in the code fol-
lowed by the value. The user may change any of the XX(.)
values as desired.
The user function subroutines (Lines 4100 through
8780) return various values to the SLAM network. Each
user function is documented in the code. The user may
change any arithmetic operation or distribtuion as de-
sired. All the distributions are triangular distribu-
tions, with three parameters. The triangular distribu-
tions are identified TRIAG(X1,X2,X3,X4), where X1 is the
shortest time to accomplish an activity, X2 the most
likely time, and X3 the longest time. X4 identifies the
random number stream and should be left at 2. X1, X2, X3
must be real numbers. The program will not run if integer
values are used as distribtuion parameters.
User functions 6, 7, (Lines 4900 through 5020) 38,
and 39 (Lines 8550 through 8670) collect on-time statis-
tics as personnel and cargo depart. The functions collect
an average rate over the entire simulation run. To col-
lect on-time rates for specific days these functions must
be modified. Specific modifications depend on the user's
desired statistic to be collected and require an under-
standing of FORTRAN programing, so will not be detailed in
this manual.
206

The allocation subroutines (Line 6800 through 11730)
assigns buses, assigns billeting and separates the FRN
cargo into individual pallets and vehicles. Subroutine
Hotput" (Line 11770 through 11900) prints the on-time per-
centages at the simulation conclusion. The user should
not modify the the allocation or "otput" subroutines.
COMPUTER REQUIREMENTS
To input this program to the computer the user must
generate three separate files. The first file is the
FORTRAN code, the second file is the SLAM network, and the
third file is the data. The SLAM computer language must
be attached and the FORTRAN code compiled before initia-
ting the simulation. Local ADP personnel should provide
appropriate job control cards.
At Wright-Patterson on the ASD Cyber computer, with
the data set indicated in Volume II, the simulation
required approximately 340,000 core memory and 400 CPU
seconds for execution.
ASSISTANCE
For further assistance contact:
Capt Gerald White
37 N. Pennsylvania Ave.
Belleville, IL 62221
618-234-5913
207

SELECTED B IBL IOGRAPHY
208

A. REFERENCES CITED
1. Allen, Patricia D. Chief, War and ContingencyPlans Office, 2750 ABW/XPR, Wright-Patterson AFBOH. Personal interviews conducted from 5February 1983 to 25 August 1983.
2. Coleman, Major Joseph W., USAF. AssistantProfessor, Department of Operations Research,AFIT/EN, Wright-Patterson AFB OH. Course SM6.25, "Logistics System Analysis and Design,"Class 1983S. Lectures. 3 January 1983 through11 March 1983.
3. Fortner, First Lieutenant Larry E., USAF. "AMethodology for CONUS APOE Reception Planning."Unpublished master's thesis. LSSR 73-82, Wright-Patterson AFB OH. September 1982. AD A123770
4. Geisler, M. A., Haythorn, W. W., and Steger, W. A.,"Simulation and the Logistics Systems Labratory,"RM-3281-PR, The Rand Corporation, Santa Monica
CA. September 1962.
5. Gibbons, Jean D. Nonparametric Methods forQuantitative Analysis. New York: Holt, Rinehartand Winston, 1976.
6. Howell, Major Skip, USAF. Staff Action Officer,Headquarters USAF, AF/XOXIC, Washington DC.Personal interviews conducted from 25 January 1983through 8 February 1983.
7. Huggins Donald E. Transportation Mobility Officer,2750 ABW/DMTA, Wright-Patterson AFB OH. Personalinterviews conducted from 7 Febraury 1983 through24 August 1983.
8. Jackson, Billy M. Transportation MobilityTechnician, 2750 ABW/DMTA, Wright-Patterson AFBOH. Personal interviews conducted from 7 February1983 through 24 August 1983.
9. Kowalski, Thomas. Chief, Simulation Division, HQMAX/XPSR, Scott AFB IL. Personal interviewsconducted from 17 November 1982 through 30December 1982.
209

10. McGowan, Major Samuel M., USAF. Chief, MobilityPlans Branch, HQ AFLC LOC/XOWM, Wright-PattersonAFB OH. Personal interviews conducted from 7January 1983 through 29 August 1983.
11. Poffenberger, James R. Program Analyst, 2750ABW/XPR, Wright-Patterson AFB OH. Personalinterviews conducted From 5 February 1983 through25 August 1983.
12. Prikster, A. Alan B. Introduction to Simulaion
and SLAM. New York: Halsted Press, 1979.
13. Shannon, Robert E. Systems Simulation: The Artand Science. Englewood Cliffs NJ:Prentice-Hall, Inc., 1975.
14. Schoderbek, Charles G., Schoderbek, Peter P, &Kefalas, Asterios 6. Management SystemsConceptual Considerations. Dallas: BusinessPublications, Inc., 1980.
15. Standberry, Captain Wayne, USAF. Staff Officer, HOMAC/XPSR, Scott AFB IL. Personal interviewsconducted on 30 December 1982 and Course LM 5.50,"Logistics Planning and Policy," Class 1983S.Lecture. 10 August 1983.
16. U.S. Department of Defense, Joint Deployment Agency.Joint Deployment Systems Procedures Manual.Macdill AFB FL. 1 January 1982.
17. U.S. Department of the Air Force. Airlift PlanningFactors. AFR 76-2. Washington: GovernmentPrinting Office, 11 June 1179.
18. U.S. Department of the Air Force. USAF MobilityPlanninQ. AFR 28-4. Washington: GovernmentPrinting Office, 16 November 1978.
19. U.S. Department of the Air Force. U.S. Air Force
Storage. AFR 69-8. Washington: GovernmentPrinting Office, 1 November 1974.
20. U.S. Department of the Air Force. War Planning,USAF Operation Planning Process. AFR 28-3.Washington: Government Printing Office, 18February 1982.
21. Wulsan, Fred. Audit Manager, Air Force AuditAgency, AFAA/FSS. Norton AFB CA. Telephoneinterview. 7 February 1983.
210

22. York, Colonel Charles A, USAF. Director ofDistribution, HO AFLC/LOZ. Letter, subject: AFLC
Air Terminal Capability, to 2750 ABWI/DMTA, 7 April1983.
211

B. RELATED SOURCES
Fisher, Joan G. Program Analyst, 2750 ABW/XPR,Wright-Patterson AFB OH. Personal interviewsfrom 6 July 1983 through 25 August 1983.
Nie, Norman H., and others. Statistical PackaQe forthe Social Sciences. New York: McGraw-Hill BookCoopany, 1975.
Reynold , Daniel E. Assistant Professor, Departmentof athematics, AFIT/EN, Wright-Patterson OH.Cou se MA 4.65, "Logistics Systems Analysis andDesign," Class 1983S. Lectures. 4 October 1982thr ugh 14 December 1982.
Wills, LLeutenant Colonel Victor D., Chief, War andCon ingency Plans Division, HQ AFLC LOC/XOX,Wri ht-Patterson AFB OH. Personal interviewsconducted from 7 January 1983 through 29 August1983.
212

I