a46 strategic link road
TRANSCRIPT

A46 STRATEGIC LINK ROAD
CONSULTATION ANALYSIS REPORT
Author: Chloe Kinton
Date published: March 2021
Report produced by Business Intelligence, Commissioning Support Unit

BACKGROUND
The consultation on proposed plans for a new transport corridor between the A46 Stoneleigh Junction, University of Warwick and Westwood Heath in Coventry took place between 30th November 2020 and 14th February 2021. The consultation sought feedback on early stage scheme proposals and to get respondent views on transport priorities for the area: in particular, the three main proposed options along with some of the key benefits and issues associated with each option. Responses to the consultation were invited from a range of partners, stakeholders and people who live and work in, or visit and travel through, Warwickshire & Coventry. Feedback from the consultation will help inform and develop these indicative scheme proposals, taking into account the issues and concerns raised by residents, businesses and others who have an interest in the area and the area’s transport network. This will be used to inform an outline feasibility design and business case submission to the Department for Transport (DfT), the development of funding applications, and initial site survey and data collection.
METHODOLOGY
A range of methods were used to gather views as part of the consultation. These included:
• An online survey on Ask Warwickshire using Citizen Space.
• A paper-based version of the standard online survey could be requested by telephone or email. Alternative formats and languages could also be requested.
• Comments in relation to the proposed changes to the parking management system could be sent directly to the Transport Design Services Team (via phone, post or email).
• Two live online broadcast events took place (17th December 2020 and 7th January 2021) where people could tune in via Microsoft Teams in order to learn more about the scheme and ask any questions. Copies of questions raised during the broadcasts were added to the supporting documents section of the online survey: ‘Live broadcast 1 – Questions and answers’ and ‘Live broadcast 2 – Questions and answers’.
The duration of the consultation was extended to 10 weeks to allow people more time to respond following a large-scale leaflet drop to approximately 11,000 households in the area (in the hope of reaching as many people as possible during the Coronavirus pandemic). The survey received 522 responses in total (including any paper-based versions of the survey). In addition, a further 98 comments were received via email, post or telephone, and responses/statements were provided by a range of stakeholders including Kenilworth Town Council, Warwick University and West Midlands Friends of the Earth. This material (received via email, post and telephone) has been treated separately to the survey and has been incorporated into the qualitative analysis under the ‘additional information’ section and referenced accordingly. In total, 201 individuals or organisations (counted by unique IDs) joined the live broadcasts at some point (103 joined Broadcast 1 and 98 joined Broadcast 2). This report is structured in three main sections. First, the key messages of the analysis on the A46 strategic link road consultation. The main section of the report presents the results from the consultation analysis which includes: about respondents, your journeys and preferences, your current experience in the area, your future travel in the area, thoughts on Option 1: ‘No infrastructure improvements’, thoughts Option 2: ‘New link road to A429 Kenilworth Road’, thoughts on Option 3: ‘New link road to south of Coventry and University of Warwick’, your option preference, and any other additional comments to the consultation (including feedback from email and letter correspondence) on the potential options. The final section presents the equality and diversity analysis.

KEY MESSAGES
• The survey received a total of 522 responses. 63.4% (n=331) of these were from residents living in the area covered by the consultation.
Journeys and travel preferences in the area
• The number of journeys made in the area has reduced due to the COVID-19 pandemic. Around a quarter of all respondents (26.6%, n=139) were currently making journeys within the consultation area every day and a further quarter (25.5%, n=133) making journeys several times a week. In contrast, prior to the pandemic, 42.7% (n=223) of respondents stated they were making journeys every day – a 16.1 percentage point difference. Statistical testing suggests that this is a statistically significant shift in travel behaviour.
• The mode of transported used in the area has changed due to the COVID-19 pandemic. Car was the most frequently selected method of travel within the consultation area both currently and prior to the pandemic, and there has been little change with regards to the proportion walking (currently 40.8% (n=213)) and cycling (currently 33.7% (n=176)). However, use of public transport appears to be lower currently than before the pandemic: bus – 9.2% (n=48) currently, 21.5% (n=112) prior to the pandemic; and train – 9.0% (n=47) currently, 18.4% (n=96) prior to the pandemic. This is statistically significant and suggests that, whilst people appear to be travelling less frequently within the area, when respondents do choose to travel, they are less likely than they were before the pandemic to use public transport (bus, train) or taxi/private hire.
• Fewer respondents are currently travelling in the area in the traditional peak travel times. Just over half of all respondents (57.1%, n=298) currently travel Monday-Friday during the day (09:00am-16:00pm) which is a similar proportion to prior to the pandemic (52.9%, n=276). However, the proportion of people travelling in the Monday-Friday early morning rush (before 07:00am) has halved to 6.3% (n=33) from 12.6% (n=66); and the proportion travelling in the morning peak (7am-9am) and evening peak (4pm-6pm) have reduced significantly. These figures are statistically significant and indicate a momentous change in the day/time respondents are travelling.
• Transport related issues in the area that were most important to respondents were air quality and being able to easily and safely walk around the area. In total, 87.9% (n=459) stated that air quality was important (either very important or important) whilst being able to easily and safely walk or cycle around the area was considered either very important or important by over three quarters of respondents (77.4%, n=404). More than a quarter (27.6%, n=144) suggested that having a choice of options on how they travel was neither important nor unimportant, with a further 17.4% (n=91) stating this was either of little importance or unimportant.
• Walking and getting a train (23.9%, n=125) and walking and getting a bus (23.6%, n=123) were the options most frequently identified as active travel options already being used by respondents in the area. Interestingly, 44.3% (n=231) of all respondents suggested they would definitely consider Very Light Rail (a battery powered system accommodating 50-70 people similar to a tram). In contrast, over a third stated they would not consider cycling and getting a train (39.3%, n=205), would not get a bus and a train (36.0%, n=188) and would not use park and ride (parking a car and then using public transport to get to the destination) (33.0%, n=172).
Current experience in the area
• Currently, 41.6% (n=217) stated that connectivity (how easily you can get to different places) was either good or very good in the area. In contrast, 45.8% (n=239) felt that the availability of sustainable travel options (walking, cycling, public transport) in the area was either poor or very poor.
• Respondents were asked to what extent they agreed or disagreed that new transport infrastructure and services are needed in the consultation area. The highest level of agreement (agree or strongly agree) was for improved footpaths/walkways (74.3%, n=388) and improved/new cycleways (71.1%, n=371). In

contrast, over half (54.6%, n=285) disagreed (either strongly disagree or disagree) that new roads are needed, and almost a third (31.2%, n=163) disagreed (either strongly disagree or disagree) that a new railway station is required.
Future travel in the area
• Respondents were asked to consider whether they think they will be travelling differently in the future. In total, 59.1% (n=309) of all respondents suggested that they believe there will be no real change in their travelling habits in the future. However, a third (33.7%, n=176) stated that they think they will be travelling less than they were before the COVID-19 pandemic. Just 5.2% (n=27) felt they would be travelling more.
Responses to proposed options
• Around half of respondents either disagreed or strongly disagree with each option (Option 1 (48.3%, n=252), Option 2 (54.6%, n=285) Option 3 (51.5%, n=269). Whilst Option 3 had the highest levels of agreement (39.5%, n=206 stated they agreed or strongly agreed with this option), the highest proportion of respondents strongly disagreed with this option (41.6%, n=217).
• For Option 1, 44.1% (n=23) and 42.7% (n=223) stated that congestion levels and air quality respectively would be slightly worse or much worse. However, across all six issues listed, ‘about the same’ was the most frequently selected response.
• For Option 2, 42.9% (n=224) and 34.9% (n=182) felt air quality and overall travel experience in the area respectively would be slightly worse or much worse. However, a third (32.2%, n=168) of all respondents stated that congestion levels would be slightly better or much better under this proposal.
• For Option 3, 48.7% (n=254) and 36.8% (n=192) felt air quality and overall travel experience in the area respectively would be slightly worse. However, almost half (46.4%, n=242) of all respondents stated that congestion levels would be slightly better or much better under this proposal.
• Overall, just over 40% of respondents thought that all options would have a negative (either negative or very negative) impact on their travel experience (Option 1 - 41.6%, n=217), Option 2 - 42.9% (n=224) and Option 3 - 44.6% (n=233)). Interestingly, 39.1% (n=204) felt the impact of Option 3 would be positive or very positive – a slightly higher proportion than for Option 1 (14.9%, n=53) and Option 2 (21.3%, n=88).
• In terms of respondents’ comments, the most common responses were around concerns regarding increasing/exacerbating congestion/traffic volume, environmental concerns, support for sustainable travel options, and the impact of the COVID-19 pandemic on travelling habits.
• Responses to the sub-option elements of Option 3 were mixed. Whilst 40% (n=209) of all respondents agreed (either agreed or strongly agreed) with a connection into Kenilworth Road, 29.1% (n=152) disagreed (either disagreed or strongly disagreed) with this option. Restricting access for through traffic along Gibbet Hill Road was the element that received the highest level of disagreement – 38.9% (n=203) either disagreed or strongly disagreed with this element.
• In terms of support for other developments in the area under option 3, construction of a Very Light Rail (VLR) route linking the area to central Coventry received slightly more support (51.5%, n=269) than the construction of a new rail station and interchange in the area (42.3%, n=221). Indeed, a third of all respondents said they would not support the construction of a new rail station and interchange.
• As part of the consultation, the local road network had been identified as needing improvement. Respondents were asked to read the information provided in the survey around six local junction improvement schemes and to state whether they agreed or disagreed with each of these. The most frequently selected option across all six schemes was ‘neither agree or disagree’. Scheme 1 (Cromwell Lane/Westwood Heath Road Junction) had the most support (38.9% (n=203) of all respondents stated they either agreed or strongly agreed, whilst only 22.8% (n=119) either agreed or strongly agreed with Scheme 5 (Broad Lane/Job’s Lane).
• Respondents were asked, on completion of the relevant questions on each of the three options, which option they preferred. The response to this question was mixed with no clear nor apparent favourite –38.5% (n=201) preferred Option 3, 23.9% (n=125) preferred Option 1 and 8.8% (n=46) preferred Option

2. Over a quarter of all respondents (27.0%, n=141) stated that none of the proposed options were their preference.
• Those respondents who selected ‘none of the proposed options’ were asked what option(s) should be considered instead. The most common response was support for continued development of walking or cycling active travel options. Other common themes included improvements of specific junctions, public transportation improvements, and minor changes/alterations to aspects of Option 1, 2 or 3.
• At the close of the survey, respondents were asked if they had any additional comments, suggestions or feedback that they would like to share regarding the proposed options. These included general comments in relation to the proposed changes, with many respondents returning to issues raised earlier in the survey. The most common response was around environmental concerns associated with the proposals (e.g. pollution/air quality, noise, destruction of Green Belt land, wildlife, flooding). Other common themes included development of sustainable travel options (walking and/or cycling), and the impact of HS2.

RESULTS – CONSULTATION ANALYSIS
ABOUT RESPONDENTS
Respondents were shown a map of the area (see map below) covered by the consultation and asked what their main reason was for completing the survey. Table 1 gives a breakdown of responses. Map 1. The consultation area
Table 1. Main reason for completing the survey
Reason for completing survey Total
Live in the area covered by the consultation 331 (63.4%)
Own or represent a business based in the area covered by this consultation 2 (0.4%)
Work in the area covered by this consultation 57 (10.9%)
Commuter and travel through the area covered by this consultation 29 (5.6%)
Attend a university or college in the area covered by this consultation 18 (3.4%)
Regularly visit the area covered by this consultation 66 (12.6%)
Responding on behalf of an organisation or group in the area covered by this consultation 3 (0.6%)
Other 15 (2.9%)
Not answered 1 (0.2%)
Total 522

The figures in Table 1 indicate that 63.4% (n=331) of all respondents to the survey were residents living in the area covered by the consultation. In terms of respondents who answered ‘other’, this included respondents who stated that more than one of the options were applicable to them (for example, live and work in the area, live in a neighbouring area and a local Councillor). Table 2. In which district or borough do you live (or your business, organisation, workplace, university or college is located)
Location Total
North Warwickshire Borough 5 (1.0%)
Nuneaton & Bedworth Borough 1 (0.2%)
Rugby Borough 6 (1.1%)
Stratford-on-Avon District 7 (1.3%)
Warwick District 310 (59.4%)
Coventry 167 (32.0%)
I do not live or work in Warwickshire/Coventry (but visit or travel through this area) 10 (1.9%)
Other 14 (2.7%)
Prefer not to say 1 (0.2%)
Not answered 1 (0.2%)
Total 522
Furthermore, respondents were asked to specify the district or borough in which they live (or the location of their business, organisation, workplace, university or college if this was the main reason for completing the survey). The results of this are presented in Table 2. As expected, the majority of respondents (91.4%, n=477) selected either Warwick District (59.4%, n=310) or Coventry (32.0%, n=167) – this is where the consultation area is located. In terms of those who answered ‘other’, several specified the specific town/village/road/postcode where they lived (e.g. Kenilworth) and three respondents said Solihull. Figure 1. How did you hear about this consultation? (Select all that apply)

Respondents were also asked to state how they heard about the consultation. As shown in Figure 1, 28.0% (n=146) of all respondents stated they heard about the consultation via social media (such as Facebook, Twitter) and 16.1% (n=84) said they heard through the local press (newspaper or radio). Almost a third (29.3%, n=153) of all respondents stated they heard about the consultation from other sources. In total, 181 respondents specified the source(s) in the open text box and, of these, 111 (61.3%) stated that they received a flyer to their home address. The majority of those who received a flyer suggested it was an official consultation leaflet, however 20 respondents stated it was a leaflet from the Green Party. Furthermore, 28 respondents who commented (15.5%) mentioned receiving communications from the University of Warwick. Clearly, respondents heard about the consultation from a variety of different sources and some example quotations to illustrate this are presented below:
• “Public consultation invitation leaflet through the door”
• “Via a local councillor also a leaflet posted through my door”
• “City Councillor”
• “Westwood Heath Resident Association newsletter”
• “Crackley Residents Association”
• “I was forwarded the Burton Green Parish update including links”
• “Neighbourhood Watch Group”
• “University of Warwick staff newsletter”
• “University of Warwick internal communication”
• “My employer told me about it”
• “CPRE, the countryside charity”
• “Green Party email”
• “Green Party circular”
• “Green View, Kenilworth Issue 21 Feb 2021”
• “From people we know”
• “Coventry online news” As part of the process, a large-scale leaflet drop took place in the area with the aim to reach as many people as possible during the Coronavirus pandemic. It should be stated here that there were three respondents who said they had not received the official information leaflet (either at the point they completed the online survey or too late to attend the first broadcast event). There was an issue with the initial leaflet drop in the area with some properties being missed. A further leaflet drop was conducted to those properties that were missed and the duration of the consultation was extended to 10 weeks (rather than the originally planned 8 weeks) to account for this. Also, a recording and copy of the questions and answers from each broadcast session was made available to anyone who missed the session (located in the supplementary documents section of the online survey):
• “A friend in Kenilworth who HAD received an information leaflet, which we STILL have not”
• “Post card notice from Council suspiciously arrived after the first consultation event was held”
• “Many people in Coventry have no idea about this proposed scheme. People I know in Kenilworth had information and details about the consultation directly delivered to their homes. I have not found anyone who has received such information and invitation to respond to the consultation in Coventry in this manner, to date. It is hardly a fair democratic process and supposed consultation if such a vast number of people have not been either adequately informed or given a fair chance to respond”

YOUR JOURNEYS & PREFERENCES
First, respondents were asked how frequently they currently make journeys within the consultation area (respondents could select only one option). Using the same scale, respondents were then asked how frequently they made journeys within the area before the COVID-19 pandemic (again, respondents could select only one option). As Figure 2 shows, currently around a quarter of all respondents (26.6%, n=139) were making journeys every day and a further quarter (25.5%, n=133) making journeys several times a week. In contrast, prior to the pandemic, 42.7% (n=223) of respondents stated they were making journeys every day – a 16.1 percentage point difference. Statistical testing suggests that this is statistically significant shift in travel behaviour. Figure 2. Frequency of journeys in the area currently and before the COVID-19 pandemic
Looking at responses by types of respondent, 38.4% (n=127) of respondents who stated they live in the consultation area suggested they were currently making a journey in the area every day, compared to 59.5% (n=197) prior to the pandemic – a 21.1% percentage gap (again, this is statistically significant). In addition, 45.4% (n=128) of those aged 18-59 years stated they made a journey in the area every day prior to the COVID-19 pandemic. The equivalent figure currently was 27.0% (n=76). This reflects the current guidance to work from home where possible for many of the working aged population and perhaps indicates many University students did not return to the area following the Christmas break.
26.6%
4.2%
25.5%
14.9%
9.8%
5.9%
11.3%
1.7%
42.7%
16.7%
25.1%
5.4% 5.0%
2.5% 1.7% 1.0%
0.0%
5.0%
10.0%
15.0%
20.0%
25.0%
30.0%
35.0%
40.0%
45.0%
Every day Every weekday Several times aweek
Once a week 2-3 times amonth
Once a month Less than oncea month
Not answered
Currently Before COVID-19 pandemic

Figure 3. Change in journey frequency pre- and during the COVID-19 pandemic
Figure 3 shows any change in journey frequency by respondents within the consultation area currently compared to prior to the COVID-19 pandemic. Whilst the survey was live, England’s second national lockdown came to an end and was replaced by a three-tier system (on 2nd December 2020) – Coventry and Warwickshire were under Tier 3 ‘very high alert’ with Government advice indicating people should avoid travelling outside of their area (other than when necessary e.g. school or work) and reducing the number of journeys where possible. England entered a third national lockdown on 4th January 2021 which included the Government closing schools and urging people to work from home. These restrictions were still in place at survey closure. This may well have, depending on when respondents completed the survey, influenced responses to this question. However, what is interesting here is that 47.7% (n=249) of respondents gave the same answer to both current and pre-COVID-19 journey frequency (suggesting no real change in the amount of travel within the area), whilst 49.2% (n=257) stated they were travelling less frequently now than they were before the COVID-19 pandemic. Just 2.5% (n=13) stated they were travelling more within the area. Figure 4. What types of transport did you use before the COVID-19 pandemic and do you currently use to travel in this area? (Select all that apply).
2.5%
47.7%49.2%
0.8%
Increased journey frequency No change Decreased journey frequency Not answered
87.0%
2.3%
9.2% 9.0%
33.7%
40.8%
0.2% 2.1% 1.7% 1.5%
89.7%
2.9%
21.5%18.4%
35.1%
41.8%
0.4% 1.9%5.2%
1.0%0%
10%
20%
30%
40%
50%
60%
70%
80%
90%
100%
Car Motorcycle Bus Train Bicycle Walk HGV Van Taxi /private hire
Other(pleasespecify)
Currently Before COVID-19 pandemic
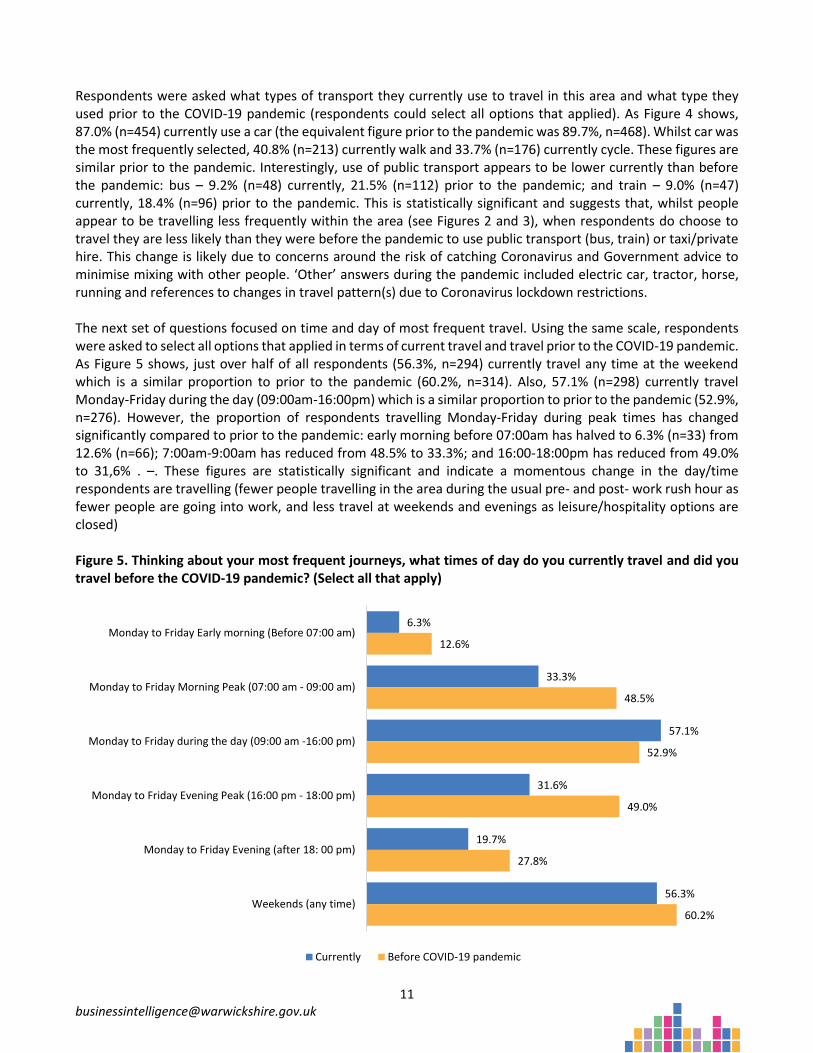
Respondents were asked what types of transport they currently use to travel in this area and what type they used prior to the COVID-19 pandemic (respondents could select all options that applied). As Figure 4 shows, 87.0% (n=454) currently use a car (the equivalent figure prior to the pandemic was 89.7%, n=468). Whilst car was the most frequently selected, 40.8% (n=213) currently walk and 33.7% (n=176) currently cycle. These figures are similar prior to the pandemic. Interestingly, use of public transport appears to be lower currently than before the pandemic: bus – 9.2% (n=48) currently, 21.5% (n=112) prior to the pandemic; and train – 9.0% (n=47) currently, 18.4% (n=96) prior to the pandemic. This is statistically significant and suggests that, whilst people appear to be travelling less frequently within the area (see Figures 2 and 3), when respondents do choose to travel they are less likely than they were before the pandemic to use public transport (bus, train) or taxi/private hire. This change is likely due to concerns around the risk of catching Coronavirus and Government advice to minimise mixing with other people. ‘Other’ answers during the pandemic included electric car, tractor, horse, running and references to changes in travel pattern(s) due to Coronavirus lockdown restrictions. The next set of questions focused on time and day of most frequent travel. Using the same scale, respondents were asked to select all options that applied in terms of current travel and travel prior to the COVID-19 pandemic. As Figure 5 shows, just over half of all respondents (56.3%, n=294) currently travel any time at the weekend which is a similar proportion to prior to the pandemic (60.2%, n=314). Also, 57.1% (n=298) currently travel Monday-Friday during the day (09:00am-16:00pm) which is a similar proportion to prior to the pandemic (52.9%, n=276). However, the proportion of respondents travelling Monday-Friday during peak times has changed significantly compared to prior to the pandemic: early morning before 07:00am has halved to 6.3% (n=33) from 12.6% (n=66); 7:00am-9:00am has reduced from 48.5% to 33.3%; and 16:00-18:00pm has reduced from 49.0% to 31,6% . –. These figures are statistically significant and indicate a momentous change in the day/time respondents are travelling (fewer people travelling in the area during the usual pre- and post- work rush hour as fewer people are going into work, and less travel at weekends and evenings as leisure/hospitality options are closed) Figure 5. Thinking about your most frequent journeys, what times of day do you currently travel and did you travel before the COVID-19 pandemic? (Select all that apply)
6.3%
33.3%
57.1%
31.6%
19.7%
56.3%
12.6%
48.5%
52.9%
49.0%
27.8%
60.2%
Monday to Friday Early morning (Before 07:00 am)
Monday to Friday Morning Peak (07:00 am - 09:00 am)
Monday to Friday during the day (09:00 am -16:00 pm)
Monday to Friday Evening Peak (16:00 pm - 18:00 pm)
Monday to Friday Evening (after 18: 00 pm)
Weekends (any time)
Currently Before COVID-19 pandemic

Respondents were asked to consider the importance of five issues on a scale of ‘unimportant’ to ‘very important’: tackling congestion, reliable journey times, air quality, have a choice of options on how to travel, and being able to easily and safely walk or cycle in the area. The results of this are presented in Figure 6 below. Indeed, 87.9% (n=459) stated that air quality was important (either very important or important). Being able to easily and safely walk or cycle around the area was also considered important (either very important or important) by over three quarters of respondents (77.4%, n=404). Interestingly, more than a quarter (27.6%, n=144) suggested that having a choice of options on how they travel was neither important nor unimportant, with a further 17.4% (n=91) stating this was either of little importance or unimportant. Figure 6. Thinking about this area, how important are the following issues to you?
In the final question of this section, respondents were asked, from a list of options, which active travel or public transport options they would consider using in this area now and in the future, if they were available. The results of this are presented in Figure 7. Walking and getting a train (23.9%, n=125) and walking and getting a bus (23.6%, n=123) were the options most frequently identified as already being used by respondents. Interestingly, 44.3% (n=231) of all respondents suggested they would definitely consider Very Light Rail (a battery powered system accommodating 50-70 people similar to a tram). In contrast, over a third stated they would not consider cycling and getting a train (39.3%, n=205), would not get a bus and a train (36.0%, n=188) and would not use park and ride (parking a car and then using public transport to get to the destination) (33.0%, n=172).
27.6%
15.3%
14.4%
8.6%
7.3%
30.1%
39.3%
28.4%
19.5%
27.0%
21.8%
26.1%
39.1%
57.9%
60.9%
0% 20% 40% 60% 80% 100%
Having a choice of options on how you travel
Reliable journey times
Tackling congestion
Being able to easily and safely walk or cycle around the area
Air quality
Unimportant Of little importance Neither important or unimportant
Important Very important Don't know / not sure
Not answered

Figure 7. If available, would you consider using any of these active travel / public transport options in this area now and in the future?
In terms of those respondents who gave an ‘other’ active travel or public transport option, over half of all comments (n=43, 56.6%) focused on cycling. A number of respondents said that active travel or public transport wasn’t an option with a car being the only means of transport. In total, 76 comments were received to this question and example quotations have been presented below to illustrate key themes identified:
• Cycling (including electric bikes): o “I would cycle, a good cycle path would be great” o “Cycling all the way, given decent infrastructure for that” o “Cycle all the way”
• Walking: o “I regularly just walk, regular user of existing footpath network” o “Could walk into work if wasn't so polluted & proper pavement & crossings available”
• Public transport (e.g. trains, buses): o “Need to get trains at Kenilworth station again as soon as possible - not rail replacement bus” o “Better bus service (preferably electric) using existing roads combined with more incentives to
leave your car at home” o “Drive and get a train; safety/security, convenience and avoiding adverse weather”
• Car (including car share): o “Car share” o “Car is the only viable option due to where I live - I would need to walk and catch two buses to
reach the area, which would probably take three or four times as long”
33.0%
36.0%
39.3%
25.9%
18.2%
20.9%
24.7%
21.3%
14.8%
22.2%
24.3%
17.8%
20.1%
17.6%
22.8%
19.5%
44.3%
26.4%
10.5%
9.2%
9.8%
23.6%
3.4%
23.9%
0% 10% 20% 30% 40% 50% 60% 70% 80% 90% 100%
Park and ride (parking your car then using public transport toget to your destination)
Get a bus and a train
Cycle and get a train
Walk and get a bus
Very Light Rail (a battery powered system accommodating 50-70 people similar to a tram)
Walk and get a train
Other (please specify)
Would not consider Might consider Definitely would consider Already use Don't know / not sure

YOUR CURRENT EXPERIENCE IN THE AREA
In this section of the survey, respondents were asked to answer questions relating to their current travel experience in the area. Again, it is important to note that for most of the time period the survey was live, England was under national lockdown restrictions due to the Coronavirus pandemic. This may well have influenced respondents’ answers to these questions. First, respondents were asked to think about their overall travel experience in the area and rate four issues (on a scale of very poor to very good) (Figure 8). Currently, 41.6% (n=217) stated that connectivity (how easily you can get to different places) was either good or very good. In contrast, 45.8% (n=239) felt that the availability of sustainable travel options (walking, cycling, public transport) was either poor or very poor. Interestingly, more than half (52.1%, n=147) of those respondents aged 18-59 stated that the availability of sustainable travel options was poor or very poor. Between a quarter and two-fifths of all respondents stated that they considered each of the four issues to be acceptable. Figure 8. Thinking about your overall travel experience in this area, how would you rate the following?
Second, respondents were asked to what extent they agreed or disagreed that new transport infrastructure and services are needed in the consultation area. A list of new transport services/infrastructure was provided and the results of this are presented in Figure 9. The highest level of agreement (agree or strongly agree) was for improved footpaths/walkways (74.3%, n=388) and improved/new cycleways (71.1%, n=371). Indeed, the majority of comments (67.1%, n=51) in the previous section (if available, would you consider using any of these active travel / public transport options in this area now and in the future?) focused on cycling and/or walking options. In contrast, over half (54.6%, n=285) disagreed (either strongly disagree or disagree) that new roads are needed, and almost a third (31.2%, n=163) disagreed (either strongly disagree or disagree) that a new railway station is required.
4.4%
8.4%
14.8%
18.8%
14.0%
19.7%
25.3%
27.0%
37.9%
43.1%
37.7%
24.9%
23.4%
17.0%
11.9%
14.2%
18.2%
7.9%
6.3%
8.0%
0% 10% 20% 30% 40% 50% 60% 70% 80% 90% 100%
Connectivity (how easily you can get to different places)
Reliability of journey times
Congestion levels
Availability of sustainable travel options (walking, cycling,public transport)
Very poor Poor Acceptable Good Very good Don't know / not sure

Figure 9. Do you agree or disagree that the following new transport infrastructure and services are needed in this area?
YOUR FUTURE TRAVEL IN THE AREA
Following this, respondents were asked to consider whether they think they will be travelling differently in the future. In total, 59.1% (n=309) of all respondents suggested that they believe there will be no real change in their travelling habits in the future (Figure 10). However, a third (33.7%, n=176) stated that they think they will be travelling less than they were before the COVID-19 pandemic. Just 5.2% (n=27) felt they would be travelling more. The findings of this question support the results presented in Figure 3 regarding journey frequency pre- and during the COVID-19 pandemic. Of course, the results of this question do not help us better understand whether respondents will be travelling at the same time of day or via the same method of transport in the future. Interestingly, 39.0% (n=110) of those respondents aged 18-59 stated they think they will be travelling less in the future, compared to 23.9% of those aged 60 and over. This suggests that those of working age are potentially anticipating a long-term change in travelling (e.g. commuting) habits due to changes in working patterns or practice which will impact less on other age groups.
38.3%
15.1%
8.6%
4.2%
5.9%
19.5%
14.2%
16.3%
9.4%
8.4%
4.4%
3.3%
11.7%
8.6%
9.6%
12.8%
30.7%
12.5%
15.1%
28.5%
24.7%
14.9%
28.4%
27.0%
33.0%
23.4%
15.3%
24.1%
18.0%
31.6%
17.0%
41.4%
47.7%
17.0%
18.0%
0% 10% 20% 30% 40% 50% 60% 70% 80% 90% 100%
New roads
Junction improvements
More bus services
Improved footpaths / walkways
Improved / new cycleways
A railway station
Very Light Rail (a battery powered system accommodating 50-70 people)
Strongly disagree Disagree Neither agree nor disagree Agree Strongly agree Don't know / not sure

Figure 10. Thinking about your possible future travel in the area, do you think your travelling habits will involve:
Those respondents who selected ‘other’ to this question were asked to specify. In total, 49 comments were received (with some respondents taking the opportunity to give reason(s) as to why they had answered the way they had). The majority of responses focused on the COVID-19 pandemic and how this has, and may continue to, shape travelling patterns in the future. Example quotations are presented below to illustrate the key themes:
• Home working / (potentially) changed working patterns due to COVID-19 pandemic: o “This is really dependent on decisions that haven't yet been made by my employer - there is a
possibility that we will be permitted to work from home, however I'd still anticipate travelling into work at least 3/5 days”
o “Ideally I plan to work partially from home and partially in the office. I eventually plan to cycle to work on the days that I am in work, however this is dependent upon reliable and safe cycle routes being fully implemented within the area. My workplace is currently too far to walk to, however I walk for most other things (e.g. food shopping). Car usage is likely to be limited to longer journeys (e.g. visiting family)”
o I expect to work from home at least part of the time. And we will be going down from two cars in the household to one, so I will walk and cycle even more”
o “Travelling more by foot and bike” o “Essential trips only and less inclined to use public transport during the pandemic” o “Likely to only travel into work 2 or 3 days per week, rather than 5 days a week. This is likely to
be the case for a huge number of university staff, meaning that the assumptions around traffic increasing must be reviewed in light of changing working practices”
• Environmental / health concerns: o “The dual carriageway will destroy valuable countryside and the habitats of lots of wild animals.
It will eliminate what remains of these spaces with the rest being destroyed by HS2. This space has been hugely valuable during the pandemic to allow walking without meeting hordes of people that flock to the Greenway and local parks, it will a huge detriment to people’s mental health”
o “We’ve proven we can all work from home. There is a climate emergency we should all pledge to travel less”
5.2%
59.1%
33.7%
1.1%
Travelling more than you were before the COVID-19 pandemicTravelling the same as you were before the COVID-19 pandemicTravelling less than you were before the COVID-19 pandemicOther

o “At the moment cars are running cyclists and pedestrians off the road, polluting the atmosphere and contributing to ill health and obesity”
o “Safe cycle schemes that support good mental health, environment is more important”
• Sustainable transport methods (walking, cycling, public transport etc.): o “Would like to see less cars in the area e.g. going to the University and more sustainable and
green options for travel to the university from Coventry, Kenilworth & Leamington” o “I expect less [travel] therefore, sustainable travel options to my place of work would be ideal as
I wouldn't have to maintain a second car” o “Eventually plan to cycle to work on the days that I am in work, however this is dependent upon
reliable and safe cycle routes being fully implemented within the area” o “I will think twice before getting into the car. I would like to be able to travel efficiently by public
transport”
OPTION 1: ‘NO INFRASTRUCTURE IMPROVEMENTS’
Respondents to the survey were then directed to answer a range of questions related to each of the three option proposals. First, respondents were asked to consider Option 1: ‘no infrastructure improvements’. In particular, to what extent they agreed or disagreed with this option. As Figure 11 shows, almost half of all respondents to this question (48.3%, n=252) disagreed (either disagreed or strongly disagreed) with Option 1. In contrast, just over a third (36.4%, n=190) agreed (either agreed or strongly agreed) with the option of no infrastructure improvements. Figure 11. To what extent do you agree or disagree with Option 1: 'No infrastructure improvements'?
Next, respondents were asked to consider (on a scale of much worse to much better) what impact Option 1 will have on a range of issues. Across all six issues listed, ‘about the same’ was the most frequently selected response (see Figure 12). However, 44.1% (n=23) and 42.7% (n=223) stated that congestion levels and air quality respectively would be slightly worse or much worse if no infrastructure improvements were made. Just 4.2% (n=22) of all respondents stated they thought connectivity would be slightly better or much better due to Option 1. Indeed, a small proportion of respondents considered Option 1 would have a positive impact on the issues
25.7%
22.6%
13.8%
17.4%
19.0%
1.5%
Strongly disagree Disagree Neither agree or disagree Agree Strongly agree Not answered

listed, although air quality was the area where the highest proportion of respondents thought that no improvements would make the area slightly or much better. Figure 12. What impact do you think Option 1: 'No infrastructure improvements' will have on the following?
The next question asked what impact Option 1 would have on respondents’ travel experience. Overall, as Figure 13 shows, over a third (37.7%, n=197) of respondents felt that Option 1: ‘no infrastructure improvements’ will have no impact. However, just 14.9% (n=53) stated Option 1 would be positive (either positive or very positive) whilst 41.6% (n=217) believed that it would have a negative (either negative or very negative) effect on their travel experience. Figure 13. Overall, what impact do you think Option 1: 'No infrastructure improvements' will have on your travel experience?
23.2%
20.5%
20.5%
12.1%
12.1%
17.4%
20.9%
20.1%
22.2%
15.3%
10.7%
19.7%
45.2%
48.5%
38.9%
62.8%
60.7%
48.3%
0% 10% 20% 30% 40% 50% 60% 70% 80% 90% 100%
Congestion levels
Reliability of journey times
Air quality
Connectivity (how easily you can get to different places)
Availability of sustainable travel options (walking, cycling,public transport
Your overall travel experience in this area
Much worse Slightly worse About the same Slightly better Much better Don't know / not sure
14.4%
27.2%
37.7%
8.8%
6.1%
4.0% 1.0%
Very negative Negative No impact Positive Very positive Not sure / don't know Not answered

The final question in this section asked respondents if they had any additional comments/details on the impact(s) of Option 1: ‘no infrastructure improvements’. Analysis was undertaken and themes based on qualitative comments regarding Option 1 are presented in Table 3. In total, 229 respondents gave a comment to this question. Respondents seemingly took this first opportunity to comment on each/any of the three main options proposed (the pros/cons, their preference) rather than specifically focussing on Option 1 – this is reflected in the example quotations below. The overriding sentiment regarding Option 1 was mixed. The most common response was around concerns regarding increasing congestion/traffic volume – 32.3% (n=74) of respondents who left a comment to this question mentioned this in their response. Other common themes included: environmental concerns, support for sustainable travel options, and the impact of the COVID-19 pandemic on travelling habits. Table 3. Themes based on qualitative comments regarding additional details of the impacts (positive or negative) of Option 1: ‘No infrastructure improvements’
Theme / description Count
(%) Example quotation(s) for illustration
Concerns regarding increasing congestion/traffic volume associated with the proposals
74 (32.3%)
“Presumably with rising traffic, this option will simply let the existing problems worsen” “Option 1 means the area cannot grow. With all these new housing estates being built and expansion of the University, the traffic will increase with no relief” “Option 1 has been in place for the last several years and congestion has worsened” “Travel along Westwood Heath Road prior to Covid was very congested during rush hour and poor air quality. All proposals 1, 2, 3 etc will make this worse” “We live on the corner of Cromwell Lane and Westwood Heath Road. The situation is bad enough with traffic, noise and pollution without the impact of additional traffic” [this comment did not specify which Option(s) it was referencing] “There is already heavy traffic levels during morning and work times with inconsiderate drivers blocking off drive ways”[this comment did not specify which Option(s) it was referencing]
Less impact on the environment than other options (e.g. pollution/air quality, noise, destruction of Green Belt land, wildlife, flooding)
61 (26.6%)
“No new road is required - what is required are means to encourage those that may still need to travel to do so in an environmentally friendly manner” “This option will minimise the impact on the environment” “The retention of the green environment and hence biodiversity is of the upmost importance to me” “Option 1 means my air quality, hence my health, is not compromised. Likewise, noise pollution would not be as high”

“Positive impacts of Option 1 are: cleaner air, keeping the rural nature of the area, conserving trees and wilder areas, preserving wildlife, keeping green spaces and avoiding building more housing, preserving the character and beauty of Kenilworth, slowing the spread of urbanisation. All of the above give tranquillity and support everyone’s mental health”
Support for (continued) development of sustainable/active travel options (e.g. walking/cycling routes, public transportation improvements) rather than changing the existing road network
58 (25.3%)
“We should be looking to improve public transport and sustainable travel i.e. cycling/walking not providing new roads for cars. The area in question will already suffer from HS2 development” “This household would like to see improved sustainable travel options: cycle lanes, pedestrian walkways, light railway, improved EV charging infrastructure and more buses” “We need Option 1 to spend money on the proposed railway station, light rail, electric bus services and far better cycle network” “The problem with this consultation is that there is no option that would allow to keep the existing road network and improve the sustainable transport options only” “A switch to active travel (in particular a reliable bus service) would remove a huge amount of existing traffic. The issue here is not road capacity, but the fact that people are tied to their cars through habit and lack of suitable alternatives”
The impact of the COVID-19 pandemic on travel/use of the area and how changes to the way people travel should be considered in any proposals and before any changes to the infrastructure are made
50 (21.8%)
“People will be travelling less, with more working and studying from home” “Why do we need a new link road to Warwick University? We are discovering that more and more activities can be done online, there is less need for people to drive to work/university etc.” “This option, along with the others, is dependent on future work and travel arrangements post Covid-19” “Right now, the commuting situation in the area covered is totally fine as a result of much reduced car traffic due to lockdown and home working. What is difficult to anticipate is how much of that will return post-COVID. I suspect/hope that commuting levels will not need to reach the same levels as we had before COVID, but it's very difficult to anticipate”
Impact(s) of increasing population(s)/housing and/or commercial developments on the area meaning changes need to happen
42 (18.3%)
“With the new housing developments… the current infrastructure may not manage well” “With more housing in the area congestion is likely to be worse if no changes are made” “Why agree to the housing without the infrastructure in place?” “There will probably be some negative impacts as the residential and industrial/commercial commitments come forward putting extra strain on the network”

“There is so much new housing already given planning permission for this side of town that the current infrastructure cannot cope and is not futureproof”
Comments relating to any/all of the proposed options (for example, comparing Option 1, Option 2, and/or Option 3, option preferences)
37 (16.2%)
“We don’t need this... You are pushing people away from living here because its turning into just roads, railways, and housing estates it’s not nice anymore. Please stop building just for monetary gain” “Do nothing isn't an option, option 2 doesn't offer enough benefit but option 3 is so much to do and not for such a long time and we don't know if it will be needed”
Consideration given to minor changes/improvements to Option 1
36 (15.7%)
“There should be an option to improve current infrastructure such as junctions, add a railway station and VLR and see if that's enough” “Changes are needed, but with several minor changes, traffics issues can be improved”
General positive comments towards Option 1
32 (14.0%)
“If traffic levels peak at a lower level, as is very likely, then by definition things will improve by "doing nothing". “There will be some benefits from the already underway phase one junction improvement” “Option 1 is not a solution to the transport problems but it is better than making things worse by building another road”
No benefit(s) / general negative responses associated with Option 1
22 (9.6%)
“By definition "No infrastructure improvements" will see little change IF - and it's a BIG IF - the traffic returns to pre-Covid-19 levels” “This option seems like a universally dreadful idea”
Suggestions that proposals will have a similar (negative) impact as per HS2 so option 1 is preferred
16 (7.0%)
“The positive impact that HS2 will bring to the area has been greatly overestimated” “Much of the area in question has already been subject to destruction due to HS2 “development”. Further infrastructure “improvements” will only have an additional negative impact on this countryside” “In view of the fact that the area will be extremely adversely affected by HS2, I feel that any alterations in the road structure would be overkill”
The role/impact of Warwick University on the area
15 (6.6%)
“Warwick Uni will continue to make the situation worse with its self-centred development plans that ignore, despite what they say, the local community” “The UoW continues to expand and enlarge its car parks, hence traffic will continue to increase” “The roads here are already too busy. With University campus growing and all the housing that has been approved the traffic will only get worse”

Concerns that the proposals are a waste of money/resources so support for Option 1
14 (6.1%)
“We should spend the money on improving flexible and remote working instead of this crazy rush hour phenomenon… To keep pouring money into a black hole that ruins our environment is not very clever. Same goes for that big white elephant called HS2” “Total waste of more money on infrastructure that’s not needed”
Impact on the quality of life and wellbeing of residents in the area
12 (5.2%)
“We live close to the proposed road… You will absolutely destroy us mentally and emotionally if you go ahead with this” “In these times justifying expensive and nature-destructive transport projects of any kind (including the HS2!) is simply criminal. This is no way to care about your population and improve their quality of life. A way to improve our quality of life is to give us much more access to green areas, allotments and orchards” “Noise pollution and air quality would undoubtedly get worse with Option 1 and that would impact adversely on the health and wellbeing of those of us that live alongside the road”
Suggestions of survey/consultation bias
11 (4.8%)
“The survey questions appear to reflect the Council’s predetermined objectives to allow unfettered developments in the area” “This survey is unprofessional and biased. You call a nasty road project an 'improvement'. You don't offer improved cycling and pedestrian access as a single option without cars” “The above questions are narrow in scope and weighted in favour of the scheme” “Clearly option one is not being taken seriously, so why bother putting it forward”
Concerns regarding the modelling assessment/data/information presented
10 (4.4%)
“The predicted housing needs are overstated and not justified” “The assumption of 25% increase in traffic is based on pre-Covid data. It is not possible to assess the impact of any of these options given the shift to new working practices. It may be that no infrastructure improvements are needed because people are commuting less and the traffic demand will actually stay static or decrease” “Guessing as to how much my travel arrangements will be affected is no better than your travel models based on pre-pandemic data which is clearly no longer appropriate”
Other themes mentioned by a smaller number of respondents included: issues in/at specific locations (e.g. specific roads and/or junctions) (n=8), issues around train station(s)/connections (n=8), safety concerns (e.g. speeding) (n=6), concerns proposals would push congestion problems to new areas (n=5), and joined-up/collaborative thinking is required (n=4).

OPTION 2: ‘NEW LINK ROAD TO A429 KENILWORTH ROAD’
Next, respondents were asked to consider Option 2: ‘New link road to A429 Kenilworth Road. First, respondents were asked to what extent they agreed or disagreed with Option 2. In total, more than half (54.6%, n=285) of all respondents either disagreed or strongly disagreed with Option 2. Figure 14. To what extent do you agree or disagree with Option 2: 'New link road to A429 Kenilworth Road'?
Respondents were then asked to consider (on a scale of much worse to much better) what impact Option 2 will have on a range of issues. Figure 15 shows that 42.9% (n=224) and 34.9% (n=182) felt air quality and overall travel experience in the area respectively would be slightly worse or much worse under Option 2. However, a third (32.2%, n=168) of all respondents stated that congestion levels would be slightly better or much better under this proposal. As per Option 1, across all six issues listed, ‘about the same’ was the most frequently selected response.
30.7%
23.9%
18.6%
21.8%
3.1% 1.9%
Strongly disagree Disagree Neither agree or disagree Agree Strongly agree Not answered

Figure 15. What impact do you think Option 2: 'New link road to A429 Kenilworth Road' will have on the following?
The next question specifically focused on the impact of Option 2 on respondents’ travel experience. Figure 16 shows that, overall, 42.9%, (n=224) of all respondents think Option 2 will have a negative (either negative or very negative) impact on their travel experience. This was a similar figure to Option 1 (41.6%, n=217 stated Option 1 would have a negative or very negative impact). Interestingly, 21.3% (n=88) felt that the impact of Option 2 would be positive or very positive – a slightly higher proportion than the same figure for Option 1 (14.9%, n=53). The final question in this section asked respondents if they had any additional comments/details on the impact(s) of Option 2. Analysis was undertaken and themes based on qualitative comments regarding Option 2: ‘new link road to A429 Kenilworth Road’ are presented in Table 4. In total, 269 respondents gave a comment to this question. As per the equivalent question for Option 1, respondents took the opportunity to comment on each/any of the three main Options proposed (the pros/cons, their preference) rather than specifically focussing on Option 2. The overriding sentiment regarding comments that specifically mentioned Option 2 was negative. The most common response related to Option 2 was that this option would not solve (and may even exacerbate) congestion in the area – 35.3% (n=95) of respondents who gave an answer to this question mentioned this in their response. Other common themes included: environmental concerns associated with the proposals, no benefit(s) / negative responses associated with Option 2, and concerns Option 2 pushes problems (e.g. congestion) to new areas.
13.6%
11.5%
22.0%
9.4%
12.8%
17.6%
14.6%
13.0%
20.9%
10.2%
10.7%
17.2%
32.6%
38.5%
32.8%
45.4%
41.0%
36.0%
27.6%
24.9%
12.6%
23.4%
20.7%
16.5%
4.6%
4.4%
3.3%
4.0%
3.6%
4.4%
0% 10% 20% 30% 40% 50% 60% 70% 80% 90% 100%
Congestion levels
Reliability of journey times
Air quality
Connectivity (how easily you can get to different places)
Availability of sustainable travel options (walking, cycling,public transport
Your overall travel experience in this area
Much worse Slightly worse About the same Slightly better Much better Don't know / not sure

Figure 16. Overall, what impact do you think Option 2: 'New link road to A429 Kenilworth Road' will have on your travel experience?
Table 4. Themes based on qualitative comments regarding additional details of the impacts (positive or negative) of Option 2: 'New link road to A429 Kenilworth Road'
Theme / description Count
(%) Example quotation(s) for illustration
Concerns regarding increasing congestion/traffic volume associated with the proposals
95 (35.3%)
“Years more of travel delays or diversions” “Will still be congestion at Kenilworth junction and around university” “Will increase traffic down Westwood Heath Road” “This would increase journey times for our most frequent journeys by making us drive further to the A46” “This plan would definitely create a much worse situation regarding travel on Westwood Heath Road for both ends!” “This option does not address the large traffic flow through the University”
Environmental concerns associated with the proposals (e.g. pollution/air quality, noise, destruction of Green Belt land, wildlife, flooding)
66 (24.5%)
“Have a detrimental effect on the ecology of the region, the flora and fauna, and also on the air quality of the surrounding area” “The new link would destroy a huge swathe of green belt and have a terrible effect upon wildlife. “Major loss of countryside that you CAN'T get back”
19.0%
23.9%
29.1%
18.4%
2.5%
4.2%
2.9%
Very negative Negative No impact Positive Very positive Not sure / don't know Not answered

“Building new roads will reduce air quality and have little impact on congestion. Adding more roads to combat congestion is like loosening your belt to combat obesity” “More roads means more motor traffic and more pollution and more CO2. This is the wrong direction of travel”
No benefit(s) / general negative responses associated with Option 2
64 (23.8%)
“Option 2 appears to offer minimal long-term improvements” “Opportunity missed, would be a complete waste of time. Delivers nothing” “This is option is clearly the "what's the point?" option - building half a bypass” “This only appears to be a half-way solution” “Negative, negative, negative - business case is fluffy at best - Based on aspirations”
Concerns Option 2 pushes problems (e.g. congestion) to new areas
52 (19.3%)
“This proposal simply diverts traffic towards Kenilworth, rather than to the University of Warwick and the business parks, so just creates a new bottleneck on the Coventry Road. Why?” “This proposal just shifts all the traffic to the A429 and effectively a dead end. The A429 is already a busy and important link road between Coventry and Kenilworth but it flows and works OK. This option is effectively pointless and would create problems” “This option will ease flow of traffic from A46 to A429 but then it will have nowhere new to go so it will make congestion on Gibbet Hill Road much worse” “It deals with half a problem and shifts from one spot to another. It’s a bit of a daft option really” “Congestion will just be moved to the A429”
Impact of option on sustainable travel/Support for (continued) development of sustainable/active travel options (e.g. walking/cycling routes, public transportation improvements)
47 (17.5%)
“Consider more sustainable ways of travel, encourage less car use” “could you just build the cycleway? Also, much cheaper. New housing and business should not depend on road access - good public transport and walking and cycling infrastructure much more important, not just for air quality, also for peoples’ health. We do not want to sit in cars all day, people care about climate change and loss of landscape to more roads” “Cycling and walking will be harder because of the road/railways to cross” “Local experience of new roads or widening of roads has shown that the council regularly fail to implement improvements to walking and cycling alongside these roads despite having a clean sheet to do so”
“I believe the impact will be negative because the intention to link to existing cycle routes is flawed in that the existing cycle routes are not fit for purpose”
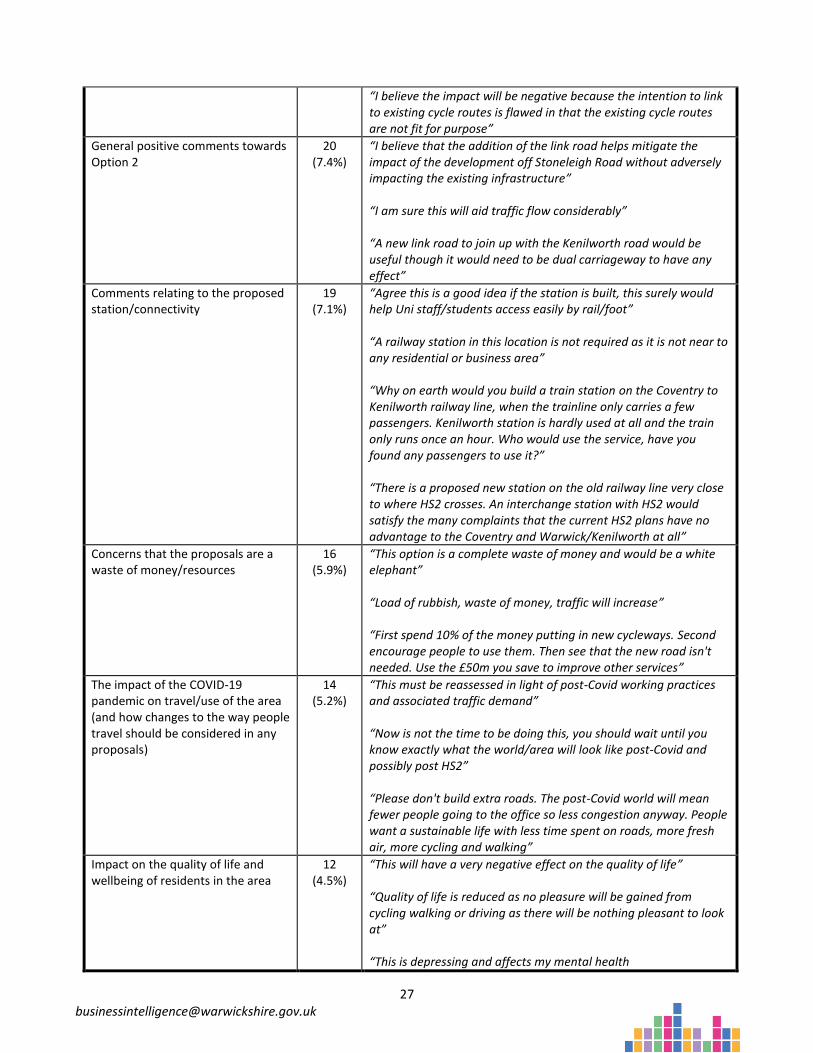
General positive comments towards Option 2
20 (7.4%)
“I believe that the addition of the link road helps mitigate the impact of the development off Stoneleigh Road without adversely impacting the existing infrastructure” “I am sure this will aid traffic flow considerably” “A new link road to join up with the Kenilworth road would be useful though it would need to be dual carriageway to have any effect”
Comments relating to the proposed station/connectivity
19 (7.1%)
“Agree this is a good idea if the station is built, this surely would help Uni staff/students access easily by rail/foot” “A railway station in this location is not required as it is not near to any residential or business area” “Why on earth would you build a train station on the Coventry to Kenilworth railway line, when the trainline only carries a few passengers. Kenilworth station is hardly used at all and the train only runs once an hour. Who would use the service, have you found any passengers to use it?” “There is a proposed new station on the old railway line very close to where HS2 crosses. An interchange station with HS2 would satisfy the many complaints that the current HS2 plans have no advantage to the Coventry and Warwick/Kenilworth at all”
Concerns that the proposals are a waste of money/resources
16 (5.9%)
“This option is a complete waste of money and would be a white elephant” “Load of rubbish, waste of money, traffic will increase” “First spend 10% of the money putting in new cycleways. Second encourage people to use them. Then see that the new road isn't needed. Use the £50m you save to improve other services”
The impact of the COVID-19 pandemic on travel/use of the area (and how changes to the way people travel should be considered in any proposals)
14 (5.2%)
“This must be reassessed in light of post-Covid working practices and associated traffic demand” “Now is not the time to be doing this, you should wait until you know exactly what the world/area will look like post-Covid and possibly post HS2” “Please don't build extra roads. The post-Covid world will mean fewer people going to the office so less congestion anyway. People want a sustainable life with less time spent on roads, more fresh air, more cycling and walking”
Impact on the quality of life and wellbeing of residents in the area
12 (4.5%)
“This will have a very negative effect on the quality of life” “Quality of life is reduced as no pleasure will be gained from cycling walking or driving as there will be nothing pleasant to look at” “This is depressing and affects my mental health

Concerns over safety (e.g. speeding) 11 (4.1%)
“It would cut off some walking routes and cycle paths would become unsafe” “It doesn't seem that this improves anyone's ability to walk or cycle. At the moment there's no way I'd cycle up Stoneleigh Road because I'd just get flattened” “I would worry what this would mean for pedestrians and cyclists on Kenilworth Road”
Other themes mentioned by a smaller number of respondents included: Comments relating to any/all of the proposed options (for example, comparing Option 1, Option 2, and/or Option 3, option preferences) (n=10), disruption associated with proposal(s) (n=9), issues in/at specific locations (e.g. specific roads and/or junctions) (n=9), impact(s) of increasing population(s)/housing and/or commercial developments on the area (n=7), Concerns regarding the modelling assessment/data/information presented (n=7), the role/impact of Warwick University on the area (n=6), suggestions that proposals will have a similar (negative) impact as per HS2 (n=5), consideration given to minor changes/improvements to Option 2 (n=5), suggestions of survey/consultation bias (n=4), joined-up/collaborative thinking is required (n=3).
OPTION 3: ‘NEW LINK ROAD TO SOUTH OF COVENTRY AND UNIVERSITY OF WARWICK’
Respondents were then asked to consider the final option, Option 3: 'New link road to south of Coventry and University of Warwick'. First, respondents were asked to what extent they agreed or disagreed with Option 3. In total, more than half (51.5%, n=269) of all respondents either disagreed or strongly disagreed with Option 3. Figure 17. To what extent do you agree or disagree with Option 3: 'New link road to south of Coventry and University of Warwick'?
Respondents were then asked to consider (on a scale of much worse to much better) what impact Option 3 will have on a range of issues. Figure 18 shows that 48.7% (n=254) and 36.8% (n=192) felt air quality and overall travel experience in the area respectively would be slightly worse or much worse under Option 3. However,
41.6%
10.0%7.5%
21.8%
17.6%
1.5%
Strongly disagree Disagree Neither agree or disagree Agree Strongly agree Not answered

almost half (46.4%, n=242) of all respondents stated that congestion levels would be slightly better or much better under this proposal. Figure 18. What impact do you think Option 3: 'New link road to south of Coventry and University of Warwick' will have on the following?
The next question specifically focused on the impact of Option 3 on respondents’ travel experience. Figure 19 shows that, overall, 44.6%, (n=233) of all respondents think Option 3 will have a negative (either negative or very negative) impact on their travel experience. This was slightly higher than the equivalent figure for Option 1 (41.6%, n=217) and Option 2 (42.9%, n=224). Interestingly, 39.1% (n=204) felt the impact of Option 3 would be positive or very positive – a slightly higher proportion than the same figure for Option 1 (14.9%, n=53) and Option 2 (21.3%, n=88). Clearly, there was a very mixed response to Option 3.
18.8%
13.8%
32.0%
13.0%
18.2%
26.2%
11.1%
11.5%
16.7%
8.4%
9.2%
10.5%
17.0%
22.0%
16.5%
27.8%
21.3%
16.7%
22.4%
23.2%
13.0%
23.8%
23.9%
19.9%
23.9%
21.1%
13.0%
19.0%
14.4%
18.8%
0% 10% 20% 30% 40% 50% 60% 70% 80% 90% 100%
Congestion levels
Reliability of journey times
Air quality
Connectivity (how easily you can get to different places)
Availability of sustainable travel options (walking, cycling,public transport
Your overall travel experience in this area
Much worse Slightly worse About the same Slightly better Much better Don't know / not sure

Figure 19. Overall, what impact do you think Option 3: 'New link road to south of Coventry and University of Warwick' will have on your travel experience?
Respondents were then asked if they had any additional comments/details on the impact(s) of Option 3. Analysis was undertaken and themes based on qualitative comments regarding Option 3: ‘new link to south Coventry & University of Warwick’ are presented in Table 5. In total, 297 respondents gave a comment to this question. The overriding sentiment regarding Option 3 was mixed – some respondents were positive towards Option 3, whilst others expressed concern at this proposal (reflecting the results in Figure 19). The most common response related to Option 3 was generally negative/respondents considered Option 3 to provide no benefit – 43.1% (n=128) of those respondents who gave an answer to this question mentioned this in their response. Other common themes included: environmental concerns associated with the proposals, concerns regarding increasing congestion/traffic volume associated with the proposals, and support for (continued) development of sustainable/active travel options (e.g. walking/cycling routes, public transportation improvements). Table 5. Themes based on qualitative comments regarding additional details of the impacts (positive or negative) of Option 3: 'New link road to south of Coventry and University of Warwick'
Theme / description Count
(%) Example quotation(s) for illustration
No benefit(s) / general negative responses associated with Option 3
128 (43.1%)
“This is the worst of all three options… It has no merit whatsoever” “It potentially makes increased travel even easier and that will increase traffic and worsen progress against an ambition of sustainable services and economy. Therefore we strongly object and disagree to this option” “This is the most drastic option and will have a severely detrimental effect on the ecology of the area and on local resident's ability to walk in the area and enjoy the open countryside and fresh air.
29.5%
15.1%
9.6%
22.6%
16.5%
4.0%2.7%
Very negative Negative No impact Positive Very positive Not sure / don't know Not answered

It will also have an adverse impact on local property prices and the demographic of the area” “The road is unnecessary” “Strongly disagree with a dual carriageway as in Option 3” “Option 3 is basically an additional link road to Warwick University from A46, this road would be of no use to locals… Not really much benefit”
Environmental concerns associated with the proposals (e.g. pollution/air quality, noise, destruction of Green Belt land, wildlife, flooding)
120 (40.4%)
“This will destroy a large area of Green Belt and completely destroy with the assistance of HS2 the green corridor between Kenilworth and Coventry” “It is astounding that the promoters of the project have seen the outcry generated by the environmental damage caused by HS2 and yet they intend to blight a second corridor in the same area” “Unnecessary long-term damage to ecology and the environment for a 1-5 year post construction traffic congestion gain” “It will spoil the only available fairly green option for commuting between Warwick/ Kenilworth and the University of Warwick… the level of noise pollution and air pollution will go much higher” “Air pollution from the A46 is already a health hazard in the summer, the new road will make it worse” “Ruination of local area. Destruction of woodland, wildlife, homes, farmland”
Concerns regarding increasing congestion/traffic volume associated with the proposals
98 (33.0%)
“Building new roads to ease congestion has been shown not to help in the long term” “Building new roads does not ease congestion, it sets a precedent that you're supposed to drive - they will fill up again” “I have never seen a road-building scheme that has resulted in less traffic and congestion. I imagine it will for a few months, and then it will attract more traffic, and we'll end up with more traffic on more tarmac, so the same density of traffic overall” “Only mildly addresses the traffic going to UoW and the business parks. Will cause congestion on Kenilworth Road. And the extra traffic from the housing development will make matters worse” “Congestion levels around Westwood Heath and surrounding areas would be made worse”
Support for (continued) development of sustainable/active travel options (e.g. walking/cycling routes, public transportation improvements)
73 (24.6%)
“Whilst there is benefit in having more cycle routes per se, these need to be planned intelligently according to need (i.e. the route one would take by bicycle is not likely to be the same as a car exiting a large trunk road such as the A46) rather than simply plonked alongside a road” “Consider non-road solutions instead”

“Why isn't there an option to just build the sustainable transport infrastructure? Build a busway, cycleways, new station and VLR. Why hold us to ransom by only building this infrastructure if we accept the road first!” “From an active travel point of view this just doesn't solve the right problem, or enough of the existing problem. Are there not more cost effective, more environmentally friendly, more sustainable options than building this road?” “I would approve of the new road, but only if sufficient sustainable transport options are also included including cycle and pedestrian routes on both sides of the road, and a link to a rail connection”
Concerns Option 3 pushes problems (e.g. congestion) to new areas
45 (15.2%)
“Bigger roads invite more traffic. This has been seen every time there has been an 'improvement' and there is a knock-on elsewhere in the network” “Will just move traffic jams around” “This option will encourage significantly more cut-through traffic via Tile Hill Lane, Cromwell Lane, Banner Lane, Red Lane” “Option 3 will dump traffic onto roads in Westwood Heath, Burton Green, Tile Hill and possibly Cannon Park onto roads that are unsuitable and are already known to have problems at the moment. Rat running will become much worse as traffic finds its way onto and off the nice new dual carriageway and along small urban roads that have many subsidiary roads and driveways exiting onto roads such as Westwood Heath Lane, Cromwell Lane and Cannon Park Road”
General positive comments towards Option 3
38 (12.8%)
“While the improvement are taking place it will make things much worse, but it will be worth it in the end. With through traffic going on the new relief road, it will make Gibbett Hill Road quieter and easier to use. Travelling from A46 to A429 will become much easier” “This will address the unacceptable congestion surrounding the university and improve safety at the university which should be at the forefront of planning considerations” “This the only option worth considering to support both access and flow into the future. “This is the only option that will bring a high overall improvement to traffic movements in the area, by taking large amounts of traffic of Stoneleigh Road and Gibbet Hill Road that is accessing the University of Warwick and Westwood Heath business parks at peak times”
Consideration given to minor changes/improvements to Option 3
32 (10.8%)
“It would seem to be a better option to bring it [road] in to join with Westwood Heath Road lower down at the roundabout then through traffic can go through to the business park”

“This will take a lot of the congestion away from the Gibbet Hill / A429 junction however I worry about a roundabout - this will likely need some traffic light management for people commuting along that road from Kenilworth to Coventry, or there will be tailbacks” “However, unless improvements are made to parking along Station Avenue, Tile Hill, and at Tile Hill Station, this proposal will draw in more through traffic to Tile Hill (esp. Station Ave.)” “The road needs to continue from the A46 past the university towards Cromwell lane as a dual carriageway, with improvements along Westwood Heath Road”
Impact on the quality of life and wellbeing of residents in the area
20 (6.7%)
“It would have a negative impact on the health and wellbeing of local people” “What were once wonderful views will be lost forever. This will mean our property will be devalued by many thousands, if not 100's of thousands of pounds” “This would have a negative impact on our mental health”
Concerns regarding the modelling assessment/data/information presented
19 (6.4%)
“What surveys have been carried out to see how much traffic is single occupancy car traffic? What incentives does Warwick university give for people to use other modes of mass transit?” “The numbers you quote 50 to 80 people per train is totally inadequate. Say 20 trains for an arts centre concert and 100 trains for an 8000 football gate. If it was 16000 = 200. Totally impractical as has been proved at the Ricoh with the station not able to cope so it doesn’t operate” “Have you measured your traffic flows? If so the data needs to be made public”
The role/impact of Warwick University on the area
18 (6.1%)
“The University of Warwick needs to become less car dependent - not more. It does not need a link road” “The malevolent hand of the anti-social neighbour, the UoW, is obvious in this proposal as are the backroom discussions between this body and the Highway Authority. Ever since the A45 Relief Road and then this more recent A46 Link Road proposals were published, the road skirting the University, which has the most to gain, has been pushed further and further away from the University” “Having allowed the University to consistently encroach on and impede the through road, e.g. mixed space, whilst allowing expansion of the business park, it is time to do something”
Suggestions that proposals will have a similar (negative) impact as per HS2
17 (5.7%)
“I am totally against Phase 3 as this area has already been decimated by HS2” “So much destruction has already been inflicted on the area with HS2 that this would really need a lot of thought on how to cause the least amount of impact on the beautiful local countryside which is being eroded with each development project”

“HS2 is having a dreadful impact, don't make it worse!”
Impact(s) of increasing population(s)/housing and/or commercial developments on the area
17 (5.7%)
“The extra traffic from the housing development will make matters worse” “They’re will also be more traffic from the new developments at Balsall Common” “This option enables building even more huge housing estates, so yes there's a new road but there will be huge influx of new users = no change”
Concerns that the proposals are a waste of money/resources
17 (5.7%)
“No requirement – massive funds wasted” “In my view it is a complete waste of public funding” “Encouraging people to pile into a small area in their cars rather than looking for green alternatives is just a crazy waste of money”
The impact of the COVID-19 pandemic on travel/use of the area (and how changes to the way people travel should be considered in any proposals)
16 (5.4%)
“Covid 19 may well have a negative effect on student numbers in the future and this should also be taken into consideration” “The post-Covid world will mean fewer people going to the office so less congestion anyway” “Now is the wrong time to consult and this project should be paused until life resumes to the ‘new norm’ whatever that proves to be. Currently, most people are working from home, the University students are working online and not even in the area and we need to wait until there are accurate and realistic statistics available post Covid19”
Concerns over safety (e.g. speeding) 14 (4.7%)
“How are cyclists going to safely cross the new link? Overbridge? Underpass?” “I am particularly concerned about the safe provision for cyclists at road junctions” “To plan for a new major link road to join a two-lane road serving existing houses is madness. This can only increase the volume and speed of traffic on Westwood Heath Road… creating a major link road to join a suburban road is madness, increasing the risk to the lives of residents and their children”
Comments relating to the proposed station/connectivity
14 (4.7%)
“Surely a train station at the University with connections to Coventry, Kenilworth and Leamington would be better than encouraging more traffic? “Needs the station and VLR included otherwise it’s just more space for more cars” “An interchange station with HS2 would satisfy the many complaints that the current HS2 plans have no advantage to the Coventry and Warwick/Kenilworth at all”
Disruption associated with proposal(s)
14 (4.7%)
“Concerned about the impact of building work to make these changes”
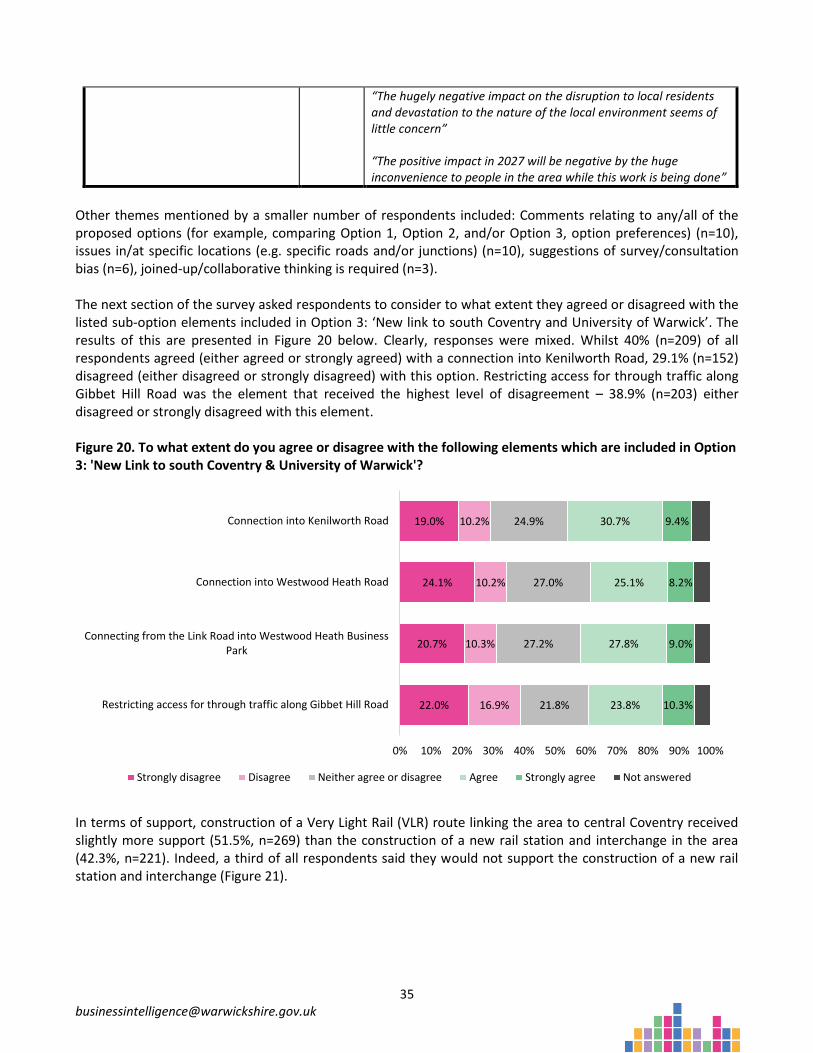
“The hugely negative impact on the disruption to local residents and devastation to the nature of the local environment seems of little concern” “The positive impact in 2027 will be negative by the huge inconvenience to people in the area while this work is being done”
Other themes mentioned by a smaller number of respondents included: Comments relating to any/all of the proposed options (for example, comparing Option 1, Option 2, and/or Option 3, option preferences) (n=10), issues in/at specific locations (e.g. specific roads and/or junctions) (n=10), suggestions of survey/consultation bias (n=6), joined-up/collaborative thinking is required (n=3). The next section of the survey asked respondents to consider to what extent they agreed or disagreed with the listed sub-option elements included in Option 3: ‘New link to south Coventry and University of Warwick’. The results of this are presented in Figure 20 below. Clearly, responses were mixed. Whilst 40% (n=209) of all respondents agreed (either agreed or strongly agreed) with a connection into Kenilworth Road, 29.1% (n=152) disagreed (either disagreed or strongly disagreed) with this option. Restricting access for through traffic along Gibbet Hill Road was the element that received the highest level of disagreement – 38.9% (n=203) either disagreed or strongly disagreed with this element. Figure 20. To what extent do you agree or disagree with the following elements which are included in Option 3: 'New Link to south Coventry & University of Warwick'?
In terms of support, construction of a Very Light Rail (VLR) route linking the area to central Coventry received slightly more support (51.5%, n=269) than the construction of a new rail station and interchange in the area (42.3%, n=221). Indeed, a third of all respondents said they would not support the construction of a new rail station and interchange (Figure 21).
22.0%
20.7%
24.1%
19.0%
16.9%
10.3%
10.2%
10.2%
21.8%
27.2%
27.0%
24.9%
23.8%
27.8%
25.1%
30.7%
10.3%
9.0%
8.2%
9.4%
0% 10% 20% 30% 40% 50% 60% 70% 80% 90% 100%
Restricting access for through traffic along Gibbet Hill Road
Connecting from the Link Road into Westwood Heath BusinessPark
Connection into Westwood Heath Road
Connection into Kenilworth Road
Strongly disagree Disagree Neither agree or disagree Agree Strongly agree Not answered

Figure 21. Would you support any of the following?
As part of the consultation, the local road network had been identified as needing improvement. Respondents were asked to read the information provided in the survey around six local junction improvement schemes and to state whether they agreed or disagreed with each of these. As Figure 22 shows, the most frequently selected option across all six schemes was ‘neither agree or disagree’. Clearly, 38.9% (n=203) of all respondents stated they agreed (either agreed or strongly agreed) with Scheme 1 (Cromwell Lane/Westwood Heath Road Junction) whilst only 22.8% (n=119) agreed (either agreed or strongly agreed) with Scheme 5 (Broad Lane/Job’s Lane). In contrast, 22.8% (n=119) disagreed (either disagreed or strongly disagreed) with Scheme 6 (Kings Hill Access Restrictions). Figure 22. Some parts of the local road network have been identified as needing improvement as part of these proposals - please see the Local junction improvements schemes information below. To what extent do you agree or disagree with each of these?
42.3%
51.5%
33.5%
27.0%
20.7%
17.8%
Construction of a new rail station and interchange in this area
Construction of a Very Light Rail (VLR) route linking the area tocentral Coventry
Yes No Not sure / Don't know Not answered
10.9%
7.9%
8.2%
7.7%
8.4%
10.2%
11.9%
8.6%
8.2%
8.2%
7.3%
6.5%
46.4%
54.2%
45.4%
47.5%
42.9%
39.3%
16.9%
15.9%
22.6%
23.4%
27.2%
25.9%
7.9%
6.9%
9.8%
7.3%
9.0%
13.0%
0.0% 10.0% 20.0% 30.0% 40.0% 50.0% 60.0% 70.0% 80.0% 90.0% 100.0%
Scheme 6
Scheme 5
Scheme 4
Scheme 3
Scheme 2
Scheme 1
Strongly disagree Disagree Neither agree or disagree Agree Strongly agree Not answered

Finally, respondents were asked to consider any other locations on the local road network that they considered to be in need of improvement as a result of these proposals. Figure 23 shows that over a quarter (26.4%, n=138) answered yes to this question. However, almost half of all respondents (44.4%, n=232) were not sure/did not know and 19.3% (n=101) said no. Those who answered ‘yes’ were asked to provide details on specific roads in an open text box. In total, 180 comments were received (some respondents who did not answer ‘yes’ also chose to leave a comment). The majority of responses focused on the specific schemes (1-6). Example quotations presented are in Table 6 to illustrate the key themes raised by respondents. Figure 23. Are there any other locations on the local road network that you think will need improvement as a result of these proposals? (Improvements might include, for example, capacity improvements, traffic calming etc.)
Table 6. Details on other locations on the local road network
Theme / description Example quotation(s) for illustration
General comments on Scheme 1 – Cromwell Lane / Westwood Heath Road junction
“Westwood Heath Road, Cromwell Lane junction will be a disaster waiting to happen, traffic already terrible and needs speed bumps as cars regularly travel at 50 plus mph on a 30mph road, plenty of kids live near junction” “Traffic calming on Westwood Heath Road and Cromwell Lane will be required as it will turn into a rat run which when considered alongside potential new building as well as existing residential could lead to accidents and potential loss of life” “These changes will lead to more traffic congestion and poor air quality on Cromwell Lane. It will be less safe to cycle and unpleasant to walk with increased traffic and noise”
General comments on Scheme 2 – Cromwell Lane / Charter Avenue
“The proposed junction improvements along Cromwell Lane will not improve traffic flow, and in fact will impede some specific traffic flows. For example, Scheme 2 will mean that turning right out of Charter Avenue towards Tile Hill Railway Station will be blocked by waiting traffic along Cromwell Lane”
26.4%
19.3%
44.4%
9.8%
Yes No Not sure / don't know Not answered

“If a bus turns into Charter Ave from Cromwell cars have to sit 20 metres back from the junction to allow them to turn, any improvement would be great” “Charter Avenue... University traffic blocks this roundabout at evening peak impeding local journeys. The proposals are likely to increase traffic at this junction”
General comments on Scheme 3 – Cromwell Lane/Torrington Avenue
“Torrington Ave, I like.... please do not mess with it” “The impossibility of improving the traffic flow from Cromwell Lane ongoing is totally ignored. The only conceivable cut through to the A45 is impossibly congested at all times of the day. The totality of this scheme just transports the congestion to a different area” “Cromwell Lane traffic calming and pedestrian crossing”
General comments on Scheme 4 –
Westwood Heath Road/Westwood Way
“If measures along Cromwell Lane, Westwood Heath Road, Westwood Way are implemented as described, this will worsen the experience for active travel” “Junction of Westwood Heath Road with Station Road/Cromwell Lane - lots of commuters come into the Warwick Uni/Westwood Heath area from this direction. the existing split junction arrangement here is not safe” “Westwood Heath Road - 30mph speed limit for the whole length and traffic calming measures / speed cameras”
General comments on Scheme 5 –
Broad Lane/Job’s Lane
“Please do not add a roundabouts that has the same ridiculous set up as the A45/Broad Lane roundabout. Whoever thought it was a good idea to have traffic enter a roundabout in the right lane from Broad Lane and within 2 car lengths required them to be in the left lane to exit onto Broad Lane … no wonder there has been several accidents there since the new island opened” “Broad Lane / Hockley Lane - Not appropriate to increase traffic. Will have severe adverse impact on active travel, particularly cycling” “Broad Lane…. perform poorly during rush hours now”
General comments on Scheme 6 – Kings Hill Access Restrictions
“Kings Hill Lane needs reviewing especially with the new housing planned” “The housing developments along the A46 and at Kings Hill will generate more traffic into/through Kenilworth - where have these impacts been assessed in the need for a new link road?” “For scheme 6, the current plans are to come from the Kings Hill development onto Stoneleigh Rd. This would hugely increase the number of cars coming onto Stoneleigh Rd. Our suggestion would be to link the new housing estate directly onto the new A46 roundabout and build the new link road from this roundabout as well”
Other specific junctions/roads
“There are several junctions in the area that have not been included, those around the north and west of Westwood Business Park, Tile Hill Lane and Station Avenue, Broad Lane and Banner Lane all of which perform poorly during rush hours now. Traffic trying to use these junctions is from the north of the plan area which only addresses movement from the south and east” “The junction between Cromwell Lane/Station Road and Duggins Lane will also need to be reviewed as this junction gets crowded at peak times”

“If you are endeavouring to address rat run issues, I would like consideration to be given to alleviating traffic congestion through Stoneleigh. At present, we do get commuters cutting through Stoneleigh in order to avoid congestion on the A46 and get to Leamington Spa. Commuters often travel through the village at inappropriate speeds, queueing and causing air pollution and noise pollution”
Consideration of sustainable travel options (e.g. walking, bicycles, non-road travel options)
“Cycle lanes, cycle lanes, cycle lanes. Sustainable transport prioritised over more road-building in line with the authority's own recognition of the climate emergency” “All of these changes seem to be aimed as car journeys. What about starting with cycling and walking and see what can be incorporated for drivers, once sustainable travel has been designed? Make appeasing polluters an afterthought rather than making sustainable travel and after thought” “Before any further money is spent on roads, cycling and walking infrastructure has to catch up which is in large parts not existing or in very poor condition. Car first is not the way to go forward”
Road/traffic calming measures (including speed restrictions)
“We already have too many poorly thought out road calming measures” “The ONLY effective deterrent is speed cameras but more is needed than just speed limit signs” “All these Options will increase traffic on the A429 and traffic calming, 20 mph limits, speed cameras, etc. will become even more essential for reasons of safety as well as noise and air pollution”
Concerns regarding congestion and/or air pollution
“If the new road will go further than Warwick University up to Westwood Heath Road it will vastly increase traffic up Cromwell Lane from both Red Lane and Hoggetts Lane and also from Tile Hill, causing a very severe negative impact on Westwood Heath Residents and residents in Cromwell Lane and Tile Hill as more traffic would come up both Cromwell Lane and Tile Hill Lane to use the extended road from Westwood Heath Road. This area is already totally congested and causes severe delays, congestion and poor air quality and this would be far worse if the road was extended to Westwood Heath Road” “Improving" roads leads only to more traffic and congestion, if not at the site of the 'improvement' there will be congestion elsewhere because of the increased traffic volumes” “This plan fails to connect the A45 and A46. It takes hideous congestion on Warwickshire roads and pumps it into Coventry roads” “The totality of this scheme just transports the congestion to a different area”
YOUR PREFERENCE
Respondents were asked, on completion of the relevant questions on each of the three options, which option they preferred. The results of this are presented in Figure 24. The response to this question was mixed with no clear nor apparent favourite – 38.5% (n=201) of respondents preferred Option 3, 23.9% (n=125) preferred Option 1 and 8.8% (n=46) preferred Option 2. Over a quarter of all respondents (27.0%, n=141) stated that none of the proposed options were their preference (a further 1.7% of respondents did not answer this question).

Figure 24. Which is your preferred option?
Those respondents who selected ‘none of the proposed options’ to this question were asked what option(s) should be considered instead via an open text box. In total, 171 respondents gave a comment to this question (some respondents who stated their preference was for one of the listed options also chose to leave a comment in order to give more detail regarding their choice). The most common response was support for continued development of walking or cycling active travel options – 38.0% (n=65) of those respondents who gave an answer to this question mentioned this in their response. Other common themes included: improvements of specific junctions, public transportation improvements, and minor changes/alterations to aspects of Option 1, 2 or 3. Table 7. If you have selected 'None of the proposed options' please tell us what option(s) should be considered instead.
Theme / description Count
(%) Example quotation(s) for illustration
Development of sustainable/active travel options – walking and/or cycling
65 (38.0%)
“Small improvements to current roads, large scale improvements to cycling infrastructure. It would take a lot of cars off the road if it was safe to travel between Leamington, Kenilworth and Coventry without the intimidation of cars” “Better and real cycling and walking options - not tokenistic signage with no real improvement” “Reducing traffic and car reliance and investment in cycling and pedestrian access” “People want a sustainable life with less time spent on roads, more fresh air, more cycling and walking. Please spend money on
23.9%
8.8%
38.5%
27.0%
1.7%
Option 1 - No infrastructure improvements
Option 2 - New Link to A429 Kenilworth Road
Option 3 - New Link to South Coventry & University of Warwick
None of the proposed options
Not answered

improving Kenilworth, Leamington, Warwick, Coventry and University cycling networks”
Specific junction improvements (e.g. roundabouts, exit/access points, road widening/narrowing, road lengthening/shortening)
54 (31.6%)
“Other, more acceptable options could be improvement of Crackley Lane and connection with Cromwell Lane. Possible improvement of Cryfield Grange Rd and connection of Cryfield Grange Road with Dalehouse Lane (though this may have a detrimental effect on residents of Cryfield Grange Road), or a new road following the same path as Cryfield Grange Road but further South, linking with an improved direct connection between Dalehouse Lane and the A46 Stoneleigh junction” “An A46 island at the university junction is all that is needed” “Spend the money on improving the existing local junctions as this will improve the traffic flow without building a new road. An example of how this has worked is the roundabout on gibbet hill/Kenilworth road/Stoneleigh road junction., which should have been done 20 years ago” “Widen Stoneleigh Road instead of creating a new road”
Development of sustainable/active travel options – public transportation improvements (e.g. VLR, bus service, Park & Ride)
53 (31.0%)
“Discouragement of car use and a major increase in public transport and very light rail” “Improve public transport links around the area instead - primarily buses” “I'd like to see the district council thinking really hard about sustainable transport and good public transport and putting that at the top of the agenda instead of just building more dual carriageways and saying "oh yes, there'll be a cycle track somewhere" “Adapting existing infrastructure – Park & Ride and VLR”
Minor alterations/changes to aspects of Options 1, 2 and/or 3 (or the sub-options)
30 (17.5%)
“Option 1 plus budget for Option 3 spend on sustainable transport improvements” “Option 1 'No infrastructure improvements' can be taken up if we are encouraged to live sustainably and within our means” “Option 3 without closing Gibbet Hill Road to general traffic”
Importance of rail/station connectivity
27 (15.8%)
“An Option that considers improved rail connection” “Need a rail station” “Improved public transport to these areas especially connectivity to nearby (Tile Hill) rail station - there is no direct connection from the train station to the uni/business park. It's about a 2 mile good 30 minute walk or less than 5 minute drive. In the interest of reducing carbon emissions train travel over car should be encourage for sites, such as these, so close to a railway station”
Reconsideration and or postponement of proposals (in light of the COVID-19 pandemic)
23 (13.5%)
“I feel a drastic rethink is needed given the changes in life and work patterns COVID is likely to have”
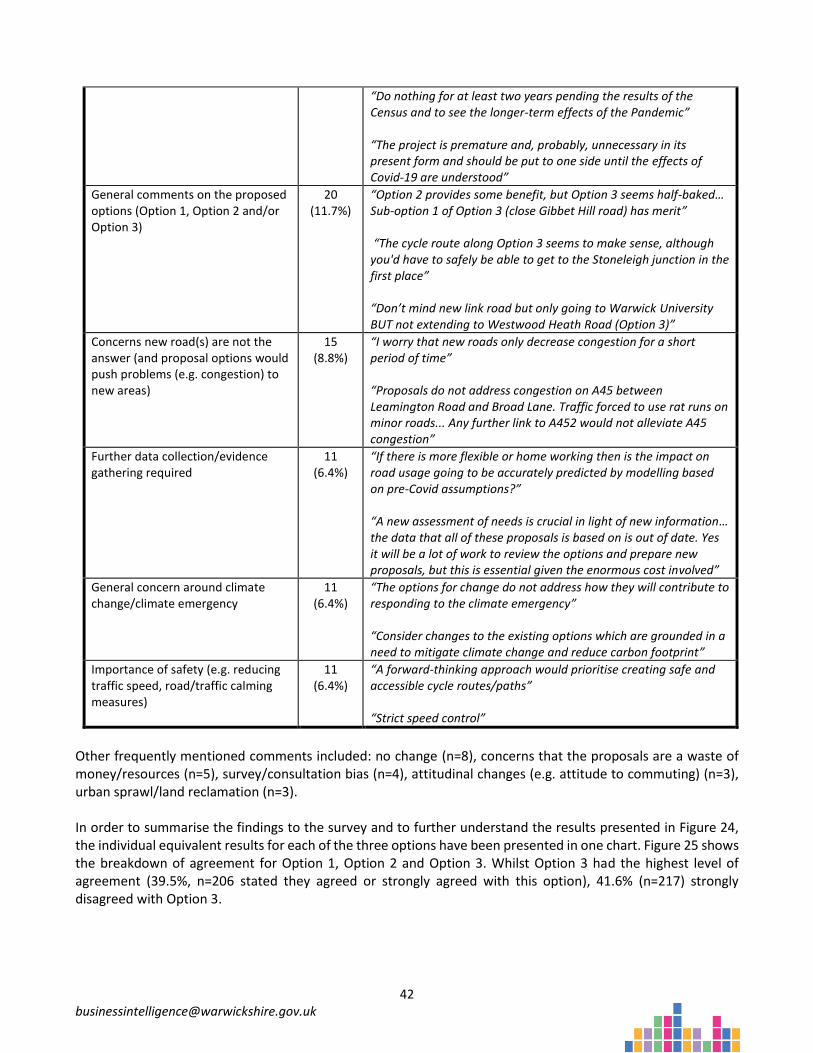
“Do nothing for at least two years pending the results of the Census and to see the longer-term effects of the Pandemic” “The project is premature and, probably, unnecessary in its present form and should be put to one side until the effects of Covid-19 are understood”
General comments on the proposed options (Option 1, Option 2 and/or Option 3)
20 (11.7%)
“Option 2 provides some benefit, but Option 3 seems half-baked… Sub-option 1 of Option 3 (close Gibbet Hill road) has merit” “The cycle route along Option 3 seems to make sense, although you'd have to safely be able to get to the Stoneleigh junction in the first place” “Don’t mind new link road but only going to Warwick University BUT not extending to Westwood Heath Road (Option 3)”
Concerns new road(s) are not the answer (and proposal options would push problems (e.g. congestion) to new areas)
15 (8.8%)
“I worry that new roads only decrease congestion for a short period of time” “Proposals do not address congestion on A45 between Leamington Road and Broad Lane. Traffic forced to use rat runs on minor roads... Any further link to A452 would not alleviate A45 congestion”
Further data collection/evidence gathering required
11 (6.4%)
“If there is more flexible or home working then is the impact on road usage going to be accurately predicted by modelling based on pre-Covid assumptions?” “A new assessment of needs is crucial in light of new information… the data that all of these proposals is based on is out of date. Yes it will be a lot of work to review the options and prepare new proposals, but this is essential given the enormous cost involved”
General concern around climate change/climate emergency
11 (6.4%)
“The options for change do not address how they will contribute to responding to the climate emergency” “Consider changes to the existing options which are grounded in a need to mitigate climate change and reduce carbon footprint”
Importance of safety (e.g. reducing traffic speed, road/traffic calming measures)
11 (6.4%)
“A forward-thinking approach would prioritise creating safe and accessible cycle routes/paths” “Strict speed control”
Other frequently mentioned comments included: no change (n=8), concerns that the proposals are a waste of money/resources (n=5), survey/consultation bias (n=4), attitudinal changes (e.g. attitude to commuting) (n=3), urban sprawl/land reclamation (n=3). In order to summarise the findings to the survey and to further understand the results presented in Figure 24, the individual equivalent results for each of the three options have been presented in one chart. Figure 25 shows the breakdown of agreement for Option 1, Option 2 and Option 3. Whilst Option 3 had the highest level of agreement (39.5%, n=206 stated they agreed or strongly agreed with this option), 41.6% (n=217) strongly disagreed with Option 3.

Figure 25. Comparing levels of agreement: Option 1, Option 2 and Option 3
ANY OTHER FEEDBACK
At the close of the survey, respondents were asked if they had any additional comments, suggestions or feedback that they would like to share regarding the proposed options. Analysis was undertaken and themes based on qualitative comments regarding the A46 link road options are presented in Table 8. These included general comments in relation to the proposed changes, with many respondents returning to issues raised earlier in the survey. In total, 249 respondents gave a comment to this question. The most common response was around environmental concerns associated with the proposals (e.g. pollution/air quality, noise, destruction of Green Belt land, wildlife, flooding) – 20.5% (n=51) of respondents who commented mentioned this in their answer. Other common themes included: development of sustainable travel options (walking and/or cycling), and the impact of HS2. Table 8. Themes based on qualitative comments to additional comments/feedback related to the proposed A46 options
Theme / description Count
(%) Example quotation(s) for illustration
Environmental concerns associated with the proposals (e.g. pollution/air quality, noise, destruction of Green Belt land, wildlife, flooding)
51 (20.5%)
“The green belt is some of the only large wide areas left in Warwickshire, and the Greenway is a vital route as lockdown has shown many” “This consultation is biased towards a car-centric view that is not taking account of the needs of the environment or the majority of people who need to spend more time walking and cycling and less time driving in order to stay healthier and happier”
41.6%
30.7%
25.7%
10.0%
23.9%
22.6%
7.5%
18.6%
13.8%
21.8%
21.8%
17.4%
17.6%
3.1%
19.0%
0% 10% 20% 30% 40% 50% 60% 70% 80% 90% 100%
Option 3
Option 2
Option 1
Strongly disagree Disagree Neither agree or disagree Agree Strongly agree Not answered

“There is no reference anywhere in this consultation to the environmental impact of these proposals… The question and answer sheet states that " Design and construction will be sensitive to the environment", however there is nothing environmentally sensitive about a dual carriageway carrying heavy traffic” “Please consider just the measures that will benefit the environment, particularly the railway station, the buses, the walking, cycling improvements, and when time allows the tram from campus to city. I feel these could be achieved at lower cost than the road and without harming the precious bits of countryside nearby” “Preserve the natural / rural environment in the area” “It makes me so sad to think of our local wildlife and environment being messed with constantly. Completely irresponsible”
Development of sustainable/active travel options - walking and/or cycling
49 (19.7%)
“Sustainable transport and active travel must be front-and-centre of the new proposals. Anything else is unethical given the climate emergency we are facing and the limited funds available to councils” “Please put a priority on exploring the sustainable alternatives to road and car use” “I've seen the estimated cost of this new road circa £100 million. Spend just £10 million on cycle and pedestrian improvements in Coventry and Kenilworth and you could have sustainable travel infrastructure of the very best international standard” “Within any option it is vital that the provision of safe off-road cycle ways and walkways are included. This recent pandemic has highlighted the value of both cycling and walking to general wellbeing” “You have an opportunity to become a role model of how transport can be. Encourage cycling or walking. I would not oppose a network of responsibly placed cycle paths through the countryside” “The post Covid world is a cycling world. Wake up”
Impact of HS2 47 (18.9%)
“Work in conjunction with HS2 to minimise disruption. Plan route in conjunction … to utilise similar/shared noise and visual impact reduction measures” “I see little use/advantage of connections being made to HS2 in this scheme which is a shame given the already devastating impact this is having on the local environment” “We understand the area needs to develop and these improvements are overdue and needed. Our frustration is living and working within what we call the HS2 A46 link road sandwich… Tried to sell commercial property on site but no one is willing to

commit not knowing the location of the road and its impact on site” “These improvements are long overdue, but I don't understand why there is not full use of the HS2 route and a fast trunk road is not being built alongside all the way through to the NEC” “No clarification of how the junction with the A452 would relate to the road modifications due to building HS2 in that same Crackley Gap. Indeed to the whole problem of HS2 construction in the same area”
The role/impact of University of Warwick
33 (13.3%)
“There would be no need for the link road if the University was not in the area, so it should be reasoned that any link road has the university as its central destination, limiting impact on use of green land, or protected land as detailed in the plans for the Option 3” “The University of Warwick must not be allowed to dominate these issues” “The need for improved roads from the University and to reduce traffic through the University is understood. However, terminating on Westwood Heath Road is not a sustainable solution without properly addressing the impact on all the surrounding roads” “The University has repeatedly stated it is reviewing its plans as a result of the Pandemic with the impacts of remote learning as well as expressing its desire to be reduce its impact on the environment by reducing the number of cars on campus and enabling more sustainable travel. The Link Road therefore appears to contradict this message” “What contribution financially are Warwick Uni making? The reason for these changes are: 1. unnecessary destruction of green belt and 2. relentless expansion of the Uni, neither of which benefit locals in the slightest”
Development of sustainable/active travel options – public transport (VLR, bus service, Park & Ride)
31 (12.4%)
“Please consider just the measures that will benefit the environment, particularly the railway station, the buses… and when time allows the tram from campus to city” “Low cost innovative use of alternative transport to reduce congestion/emissions, eliminate need for further and create a city and university for the future. Permanent Park and Ride at Stoneleigh with VLR connection as used for graduations, should negate need for new roads… VLR connections to Birmingham area/HS2” “An integrated public transport system would be advantageous with local buses (or VLR) from the rail stations to employment / education hubs” “Rather than extend the road, build park and ride at A46 junction and light rail or tram into business park”

Specific junction improvements (e.g. roundabouts, exit/access points, road widening/narrowing, road lengthening/shortening)
31 (12.4%)
“Re-route and widen to single carriageway Crackley Lane and Bockendon Lane to new roundabout on Westwood Heath Road and dedicated entrance to University. Additional on-site parking at junction. From roundabout open access to Westwood Business Park for Cars/vans only. Alleviating pressure at Kirby Corner/Westwood Way” “Improve the existing road and junctions... simple, cheaper and doesn't impact green space” “If there's one thing I want to highlight it's the junction between the Greenway and the new road (just to the south of the university), which did not get any attention in this consultation. Please please please do this properly!” “Road widening and/or dualing should be looked at” “The road congestion caused at roundabouts over many years on the A46 eastern bypass by not providing fly overs should inform the junction of any link Road with the Kenilworth Road”
Reconsideration and or postponement of proposals (in light of the COVID-19 pandemic)
28 (11.2%)
“Given that nobody knows the long-term effects of the coronavirus on working from home, this survey should be postponed for at least a year. You cannot make decisions based on what may happen given that the 50 largest companies in the UK have indicated that they expect people to work from home after the pandemic. The link road may never be needed” “Due to the Pandemic I know of many University staff who have happily worked from home and have no intention of spending as much time on the campus as previously even if life returns to normal… Planning new infrastructure before these factors have been evaluated would be foolhardy in the extreme” “Reliance on vehicles will change as will ways of working as a result of technology and impact of COVID 19 pandemic these would render these plans null and void and certainly uneconomic” “As indicated before, much depend on the extent to which people will return to offices and workplaces as before COVID, or whether there are more permanent shifts in attitudes and abilities to working from home. If everyone returns to pre-COVID levels, then significant improvements are needed. If there is a more reduced return to these levels, then perhaps less drastic improvements and options would be satisfactory”
Comments related to the railway station
25 (10.0%)
“I don't see the point of a new railway station in the proposed location” “While not against the idea of a new railway station, I am sceptical about the likelihood of this being built within the next decade. It took years for the new Kenilworth station to be built” “There should be a significant lobby for an HS2 stop in this area, interlinked with the new Station”

“If a station option is included it needs to be close to the University not where it is currently being proposed. Early planning of rail capacity and services linking this with Warwick and Leamington is important given the number of university students who live in this area”
Concerns around funding/costs of proposals (considered a waste of money)
23 (9.2%)
“The whole proposal of improvements to road and rail is, in my opinion, a complete waste of public funding” “Much of the current working from home will continue after the pandemic resulting in permanently reduced traffic levels. This scheme would be a costly white elephant” “The whole consultation is manipulative, designed to garner support for the most expensive Option 3. Maybe costings for all the options are included somewhere but I couldn't find them” “The money this will cost to deliver is simply not worth it and it should be redirected to more vital concerns. The traffic in this area is not at a sufficient level to warrant further road works”
General negative comments towards proposals (e.g. Option 1, Option 2 and/or Option 3, sub-options)
22 (8.8%)
“Please consider the needs and wants of local residents whose lives will be impacted severely and negatively by increased traffic volumes on suburban roads. Our quality of life and our safety is far more important than reducing what is now non-existent congestion elsewhere” “The whole area is in upheaval, wildlife, flora and fauna are being disrupted and spoiled for no good reason. The amount of people who will benefit from these improvements does not justify all the disruption and cost of this overall proposal. I am definitely against any of this going forward” “This consultation contains piteously little detail while bandying aspirations (VLR, Stadium, Uni access etc etc) as though they are facts. It is a sham and deceitful” “Building the road is not a strategic solution as it does not link up major road networks”
Minimising congestion/rat running, moving congestion/issues to new areas
22 (8.8%)
“I am concerned the proposals only relocate the whole problem to Westwood Heath Road and Kirby Corner” “Thought / investment must be given to how Westwood Heath Road will cope with the university traffic at peak times, otherwise the scheme will simply move the current congestion from Stoneleigh Rd to Westwood Heath Road” “If we cannot learn from previous schemes that more roads do not equal less congestion we are very short sighted as a generation” “In terms of supposedly easing congestion the scheme seems to be transferring congestion elsewhere”
Concerns around housing/over-development
19 (7.6%)
“I strongly disagree with the already planned Kings Hill housing development on the green belt. We'll be losing another green area

and it will lead to traffic increase and new development in a near future” “Any more building on the green belt should stop. More roads and housing developments will impact air pollution environmental damage and habitat loss none of which seem to be considered. I would rather be in a queue or add 10 mins to my daily journey than look at more housing estates and tree stumps!” “You state a 25% projected traffic rise in the next 10 years. So why are these figures NOT imposed on the housing development planning assessments prior to Planning approval? Their figures appear ALWAYS over-optimistic!”
Lack of faith in consultation process/survey bias
16 (6.4%)
“I have found many of the questions and options available to respond to in this consultation weighted and geared toward influencing the respondent to accept the proposals and options. The consultation and way the proposals are presented seem designed not to consider or question a range of fundamental areas of concern and issues. They are narrow in remit and design. It is as if the consultation has been deliberately designed to be so and purposefully aimed to steer public perception and thus responses. If it is not through deliberate intent it seems thus clearly designed by those who are so steeped in a particular and narrow way of looking at and assessing things and particular discourse that they appear to those analysing it from outside, as being trapped inside this set narrow agenda and view” “It is biased in the way the information is portrayed and in the questions being asked - they cannot be used to correctly infer anything meaningful” “With something this big a wider consultation area is required”
Concerns regarding the modelling assessment/data/information presented
13 (5.2%)
“The assumption that there will be 25% more traffic is unsound” “It would have been a lot easier to pass comment had some additional information been made available, namely; the future plans of the University - post Covid; the implications a 'stadium' will have on the area; more detail on the new station/ what it will consist of - Park and Ride?” “This consultation contains piteously little detail while bandying aspirations (VLR, Stadium, Uni access etc etc) as though they are facts… The need for the road is partly based on a population model that is known by everyone except the planners to be wrong and which is being challenged”
Quality of life/wellbeing 13 (5.2%)
“I feel confident in saying that such increased traffic, noise, air pollution would have a significant and adverse effect on our residents’ and this communities' quality of life” “Quality of life will deteriorate during the years all these works will be taking place” “I do not think those who propose, design and implement schemes such as the A46 Link Road ever really consider the impact on

mental wellbeing of continued destruction of countryside, of open spaces and of wildlife”
Other comments mentioned less frequently included: general positive comments towards proposals (Option 1, 2 and/or 3, sub-options) (n=7), disruption associated with proposals (n=5), joined up/collaborative thinking is required (n=5), invest in repairing current infrastructure (n=3), concerns over safety (e.g. speeding) (n=3).
ADDITIONAL COMMENTS & FEEDBACK
In addition, there were 98 emails, letters and phone call responses sent to the A46 Team. Whilst several comments were requests for further information and/or clarity around specific aspects of the consultation, the overriding sentiment of correspondence was negative (79.8% of comments were negative, just 1.2% positive and 19.0% neutral). The following concerns were raised (most of which were also key themes raised by respondents in the online survey):
• Environmental concerns (e.g. the development would increase pollution/affect air quality, concerns regarding Kenilworth’s tree-lined conservation area/Green Belt status, increased litter, impact on wildlife, increased noise, increased HGV use).
• Concerns the proposals would just shift the problems (e.g. congestion) to different areas.
• The plans fail to consider residents in/around the Kenilworth area of the University of Warwick (poor junctions, increased traffic/congestion and the urban spread of Coventry/loss of Green Belt).
• Concerns regarding potential loss of allotment land at Westwood Heath due to proposed development.
• Suggestions that the household leaflet drop did not reach the required households (and/or not in time to attend the first online broadcast).
• Requests for clarity regarding the University Warwick’s involvement/comments on the proposals. Furthermore, concerns regarding University of Warwick and Coventry City Football Club plans for a new stadium and the impact this may have on the area.
• Queries regarding aspects of the modelling assessment (for example, model methodology, outdated data, traffic/peak flow, access points, cycle/footpaths/pedestrian crossings, new housing developments).
• Suggestions that the questions/options in the online survey were bias towards Option 3.
• Concerns Option 3 (and some of the sub-options, such as the closure of Gibbet Hill Road) would increase rat-running / traffic volumes on specific roads.
• Queries regarding whether a new station would be utilised and would be better served by expanding services at Kenilworth station instead (also, consideration of HS2 in the area).
• Concerns that people with no/limited access to the internet will be disadvantaged.
• Long-term impact of home/remote working as a result of the COVID-19 pandemic on commuting and usage of road(s) in the consultation area needs reviewing.
Responses were also received from a range of stakeholders. These included: a joint statement from three Warwick District and Warwickshire County Councillors, University of Warwick, CEG Land Promotions III, Hallam Land Management Limited, IM Land, Pittaway family, Highways England, Transport for West Midlands (TfWM), Cycleways, Bicycle Mayor for Coventry, Burton Green and University of Warwick Parish Council, Bubbenhall Parish Council, Kenilworth Town Council, Westwood Heath Residents Association (WHRA), Cannon Park Community Association, West Midlands Friends of the Earth, a technical note, and several letters from local residents. Their concerns included:

• Whilst there was support for Option 3 from some stakeholders, others suggested that Options 1 and 2 were considered to have been quickly discounted as not providing suitable benefit and the documentation/survey seeks to promote and advance Option 3.
• Concerns that there is no clear evidence (from other studies/examples) that Option 3 would fully meet all the stated objectives. Also, Census 2021 results should be incorporated into the work.
• The word ‘strategic’ should be removed from the title of the scheme.
• Suggestions that further detailed modelling and data gathering should be undertaken to fully understand the impacts of the proposals.
• Respondents state that there should be minimal impact of the A46 Link road on local residents – there are concerns that the link road would potentially exacerbate existing congestion issues at various sites/local junctions in the area. For example, residential developments (such as Kings Hill) would have a huge influence on the traffic in the area.
• A range of different suggestions to improve proposals / sub-options were put forward (for example, considering a bypass around Stoneleigh).
• Proposals are considered contrary to the rhetoric around the climate emergency, environment and sustainable growth (with suggestions that the link road will generation more traffic, increase pollution, impact on habitats, impact on drainage/flooding and be highly detrimental to the Green Belt).
• Proposals are considered to exaggerate the benefit to cycle use - sustainable options including public transport and active travel have not been considered as viable standalone alternatives to the road schemes.
• Concerns the new road alignment is intended to be of assistance to the University of Warwick (awaiting the publication of University of Warwick’s 2029 Masterplan).
• Confusion regarding VLR / Coventry South Interchange station and any future stadium (and how this could/should link up with HS2 in terms of economies of scale/land).
• Suggestions that it is premature to be developing plans without knowing how employment numbers, working practices and travel will change post-Covid-19.
• Allow more time for greater communication and transparency between key stakeholders and local residents.

EQUALITY AND DIVERSITY ANALYSIS
The online survey asked respondents to complete information regarding equality and diversity. The results are set out in Table 9 below. Table 9. Overall online respondent profile
Gender Female 168
Male 259
Non-binary 2
Prefer to self-describe 1
Prefer not to say 68
Not answered 24
Gender identity Yes 423
No 2
Prefer not to say 72
Not answered 25
Age in years Under 18 0
18-29 43
30-44 102
45-59 137
60-74 136
75+ 40
Prefer not to say 44
Not answered 20
Long standing illness or disability Yes 29
No 422
Prefer not to answer 48
Not answered 23
Ethnicity White-English/Welsh/Scottish/Northern Irish/ British
369
White - Irish 7
White - Gypsy or Irish Traveller 0
Other White background 30
Black or Black British - African 1
Black or Black British - Caribbean 2
Other Black background 0
Asian or Asian British – Bangladeshi 1
Asian or Asian British – Indian 14

Asian or Asian British - Pakistani 0
Chinese 1
Other Asian Background 2
Mixed – White and Asian 1
Mixed – White and Black African 0
Mixed – White and Black Caribbean 1
Other Mixed background 2
Arab 0
Other Ethnic background 3
Prefer not to say 66
Not answered 22
Religion Buddhist 3
Christian 171
Jewish 0
Muslim 2
Hindu 2
Sikh 9
Spiritual 5
Any other religion or belief 6
No religion 210
Prefer not to say 89
Not answered 25
Sexual orientation Heterosexual or straight 342
Gay man 12
Gay woman / lesbian 0
Bi / bisexual 10
Other 4
Prefer not to say 124
Not answered 30