a4a media briefing: 1q 2019 review & summer air travel ... · a4a media briefing: 1q 2019...
TRANSCRIPT
John P. Heimlich Sharon L. PinkertonVP & Chief Economist SVP, Legislative & Regulatory Policy
A4A Media Briefing:1Q 2019 Review & Summer Air Travel Forecast
May 21, 2019
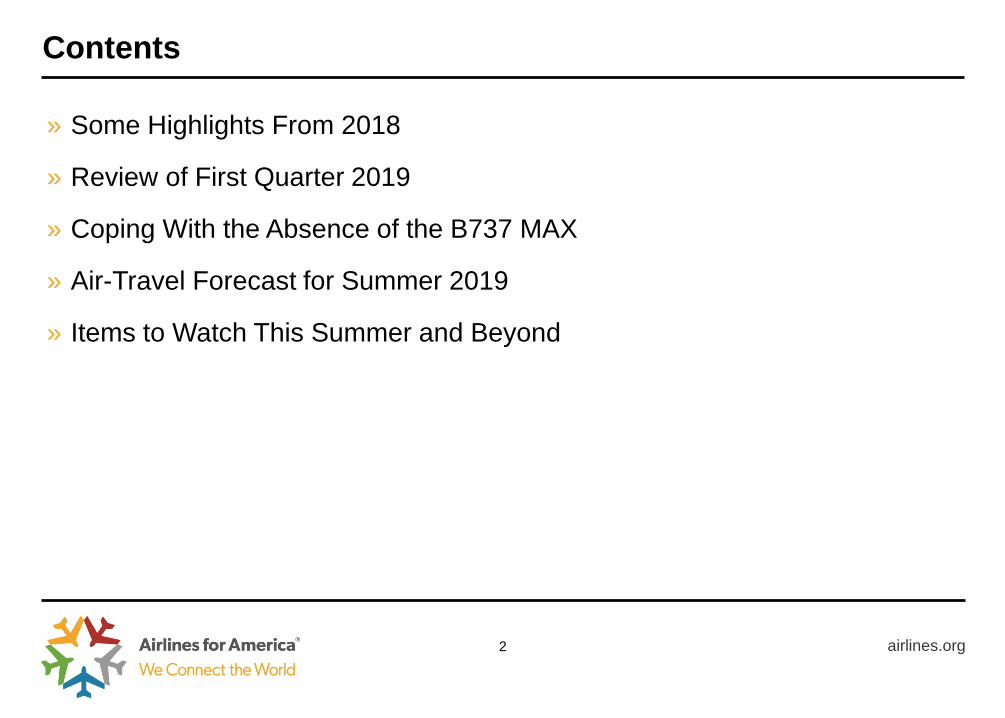
Contents
airlines.org2
» Some Highlights From 2018
» Review of First Quarter 2019
» Coping With the Absence of the B737 MAX
» Air-Travel Forecast for Summer 2019
» Items to Watch This Summer and Beyond
Source: A4A and Bureau of Transportation Statistics for U.S. passenger and cargo airlines
3 airlines.org
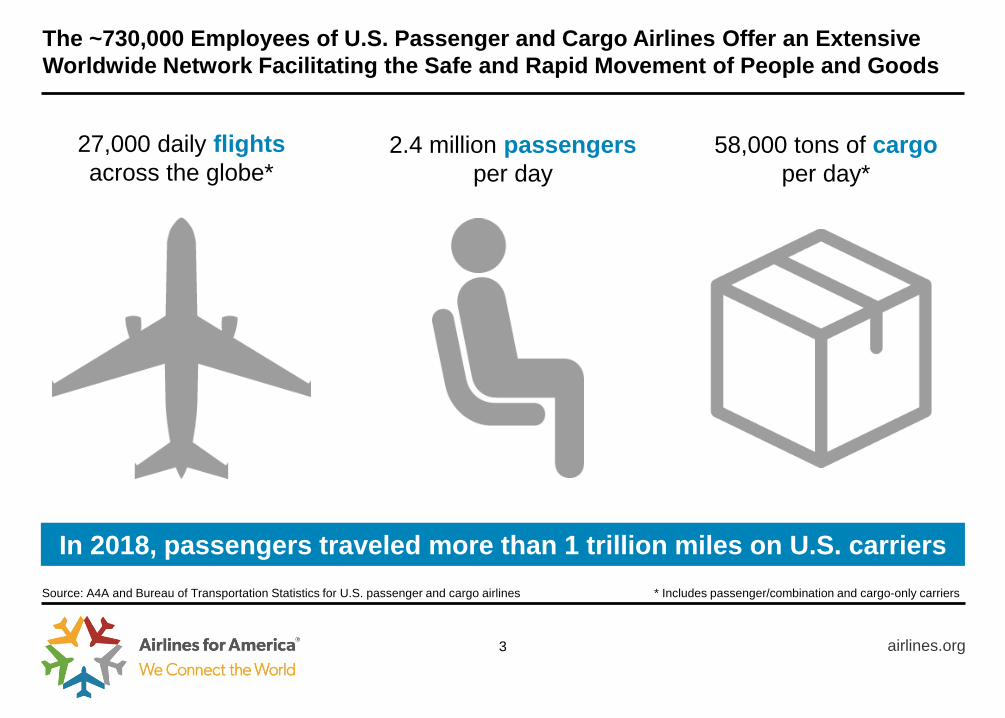
The ~730,000 Employees of U.S. Passenger and Cargo Airlines Offer an Extensive Worldwide Network Facilitating the Safe and Rapid Movement of People and Goods
27,000 daily flightsacross the globe*
58,000 tons of cargo per day*
2.4 million passengersper day
* Includes passenger/combination and cargo-only carriers
In 2018, passengers traveled more than 1 trillion miles on U.S. carriers
airlines.org4
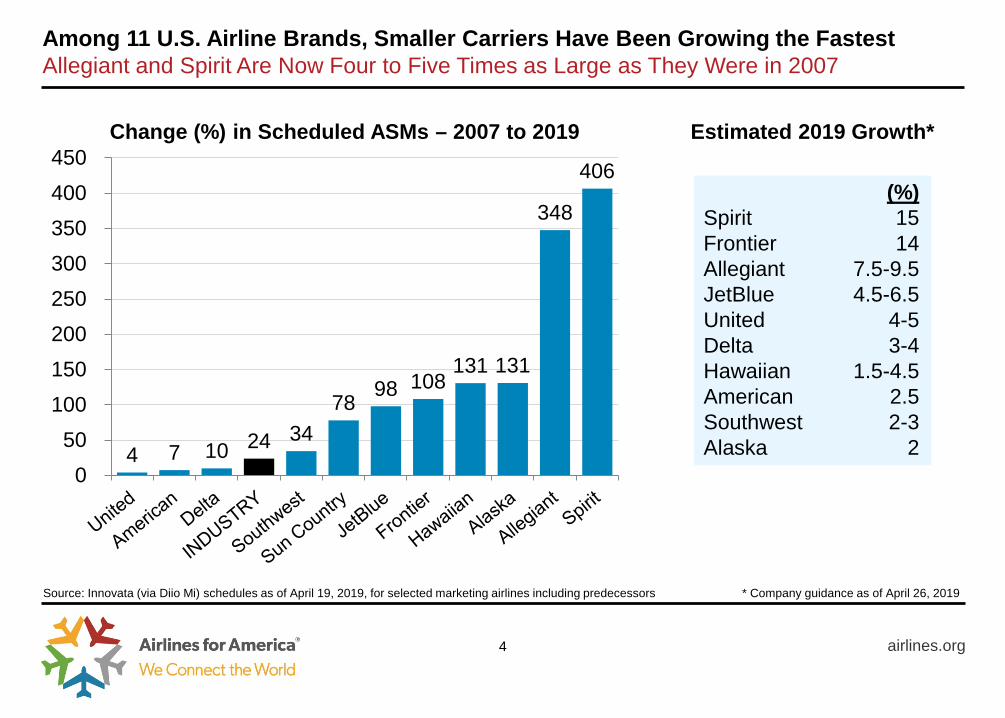
Among 11 U.S. Airline Brands, Smaller Carriers Have Been Growing the FastestAllegiant and Spirit Are Now Four to Five Times as Large as They Were in 2007
4 7 10 24 3478 98 108
131 131
348
406
050
100150200250300350400
450
Source: Innovata (via Diio Mi) schedules as of April 19, 2019, for selected marketing airlines including predecessors * Company guidance as of April 26, 2019
Change (%) in Scheduled ASMs – 2007 to 2019
(%)Spirit 15Frontier 14Allegiant 7.5-9.5JetBlue 4.5-6.5United 4-5Delta 3-4Hawaiian 1.5-4.5American 2.5Southwest 2-3Alaska 2
Estimated 2019 Growth*
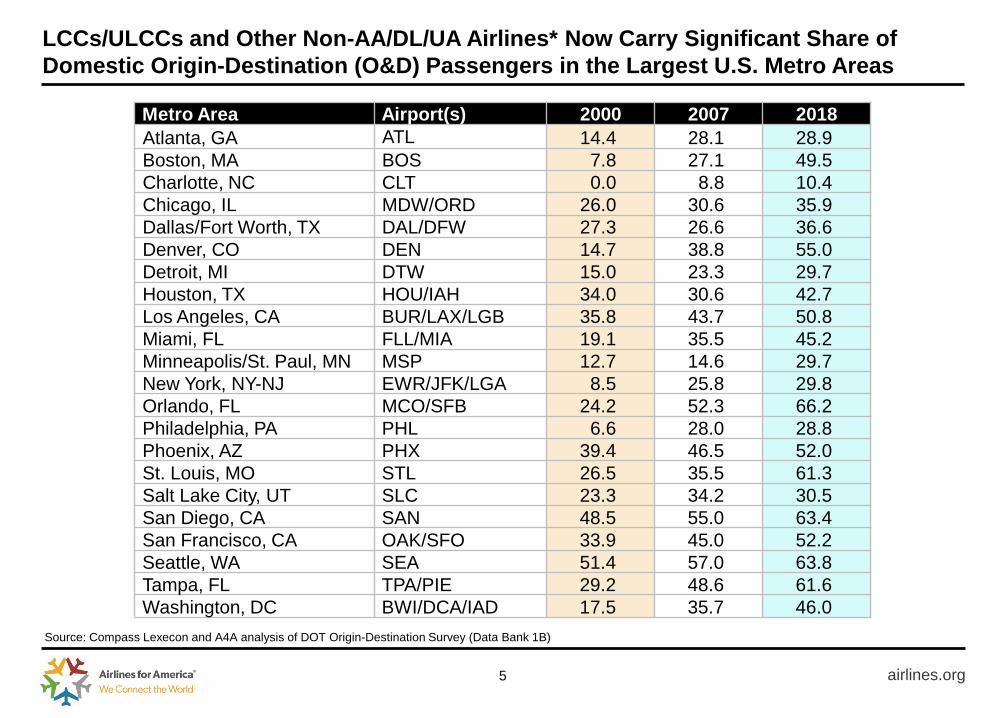
LCCs/ULCCs and Other Non-AA/DL/UA Airlines* Now Carry Significant Share of Domestic Origin-Destination (O&D) Passengers in the Largest U.S. Metro Areas
airlines.org5
Metro Area Airport(s) 2000 2007 2018Atlanta, GA ATL 14.4 28.1 28.9Boston, MA BOS 7.8 27.1 49.5Charlotte, NC CLT 0.0 8.8 10.4Chicago, IL MDW/ORD 26.0 30.6 35.9Dallas/Fort Worth, TX DAL/DFW 27.3 26.6 36.6Denver, CO DEN 14.7 38.8 55.0Detroit, MI DTW 15.0 23.3 29.7Houston, TX HOU/IAH 34.0 30.6 42.7Los Angeles, CA BUR/LAX/LGB 35.8 43.7 50.8Miami, FL FLL/MIA 19.1 35.5 45.2Minneapolis/St. Paul, MN MSP 12.7 14.6 29.7New York, NY-NJ EWR/JFK/LGA 8.5 25.8 29.8Orlando, FL MCO/SFB 24.2 52.3 66.2Philadelphia, PA PHL 6.6 28.0 28.8Phoenix, AZ PHX 39.4 46.5 52.0St. Louis, MO STL 26.5 35.5 61.3Salt Lake City, UT SLC 23.3 34.2 30.5San Diego, CA SAN 48.5 55.0 63.4San Francisco, CA OAK/SFO 33.9 45.0 52.2Seattle, WA SEA 51.4 57.0 63.8Tampa, FL TPA/PIE 29.2 48.6 61.6Washington, DC BWI/DCA/IAD 17.5 35.7 46.0
Source: Compass Lexecon and A4A analysis of DOT Origin-Destination Survey (Data Bank 1B)
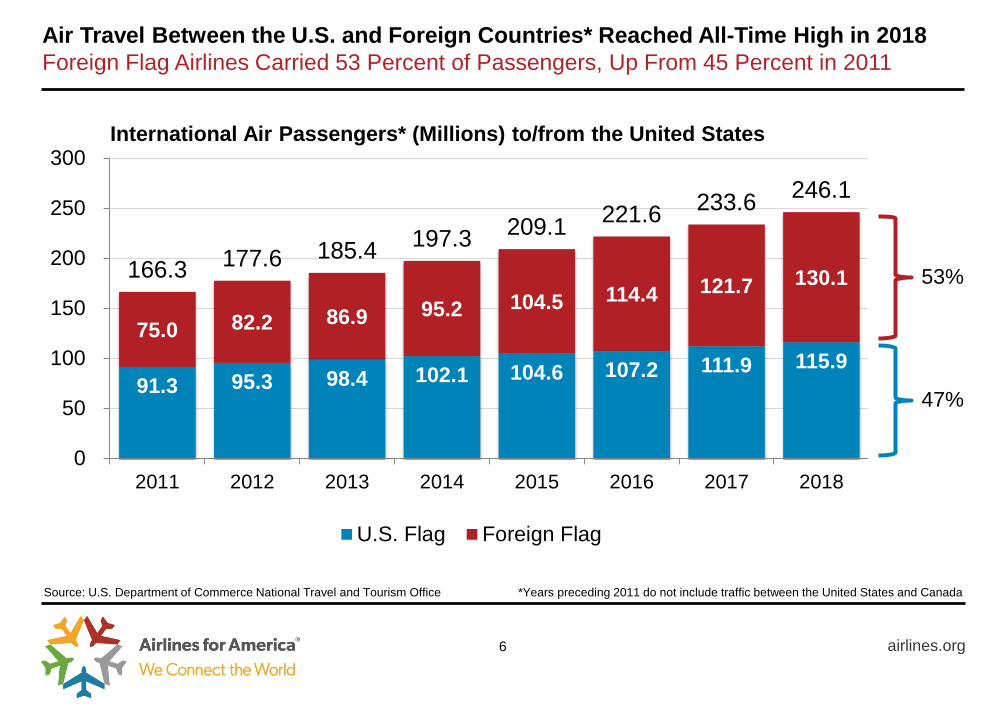
Air Travel Between the U.S. and Foreign Countries* Reached All-Time High in 2018Foreign Flag Airlines Carried 53 Percent of Passengers, Up From 45 Percent in 2011
airlines.org
Source: U.S. Department of Commerce National Travel and Tourism Office
6
*Years preceding 2011 do not include traffic between the United States and Canada
91.3 95.3 98.4 102.1 104.6 107.2 111.9 115.9 75.0 82.2 86.9 95.2 104.5 114.4 121.7 130.1 166.3 177.6 185.4 197.3 209.1 221.6 233.6 246.1
0
50
100
150
200
250
300
2011 2012 2013 2014 2015 2016 2017 2018
U.S. Flag Foreign Flag
International Air Passengers* (Millions) to/from the United States
53%
47%
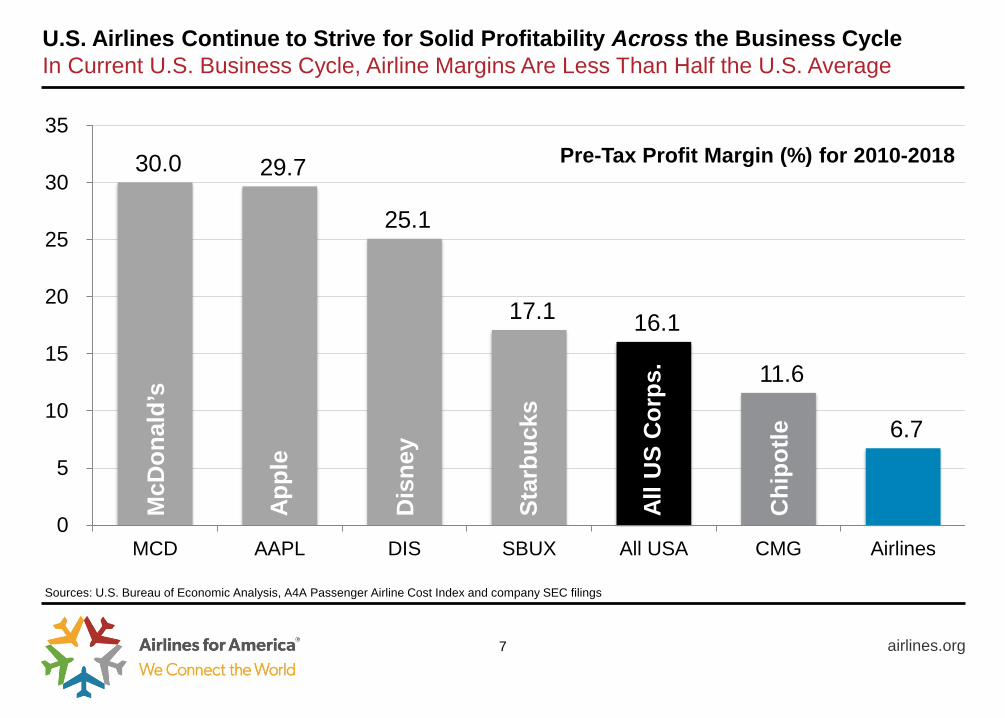
U.S. Airlines Continue to Strive for Solid Profitability Across the Business CycleIn Current U.S. Business Cycle, Airline Margins Are Less Than Half the U.S. Average
airlines.org
30.0 29.7
25.1
17.1 16.1
11.6
6.7
0
5
10
15
20
25
30
35
MCD AAPL DIS SBUX All USA CMG Airlines
7
Sources: U.S. Bureau of Economic Analysis, A4A Passenger Airline Cost Index and company SEC filings
McD
onal
d’s
Appl
e
All U
S C
orps
.
Star
buck
s
Pre-Tax Profit Margin (%) for 2010-2018
Dis
ney
Chi
potle
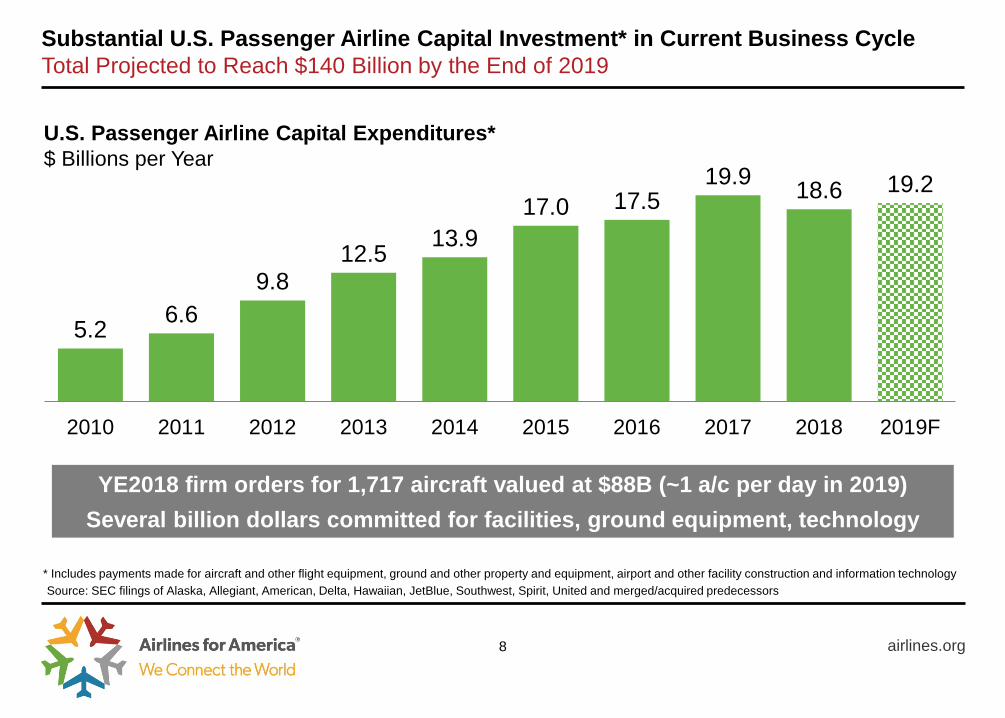
Substantial U.S. Passenger Airline Capital Investment* in Current Business CycleTotal Projected to Reach $140 Billion by the End of 2019
airlines.org8
5.2 6.69.8
12.5 13.917.0 17.5
19.9 18.6 19.2
2010 2011 2012 2013 2014 2015 2016 2017 2018 2019F
Source: SEC filings of Alaska, Allegiant, American, Delta, Hawaiian, JetBlue, Southwest, Spirit, United and merged/acquired predecessors
U.S. Passenger Airline Capital Expenditures*$ Billions per Year
* Includes payments made for aircraft and other flight equipment, ground and other property and equipment, airport and other facility construction and information technology
YE2018 firm orders for 1,717 aircraft valued at $88B (~1 a/c per day in 2019)Several billion dollars committed for facilities, ground equipment, technology
airlines.org
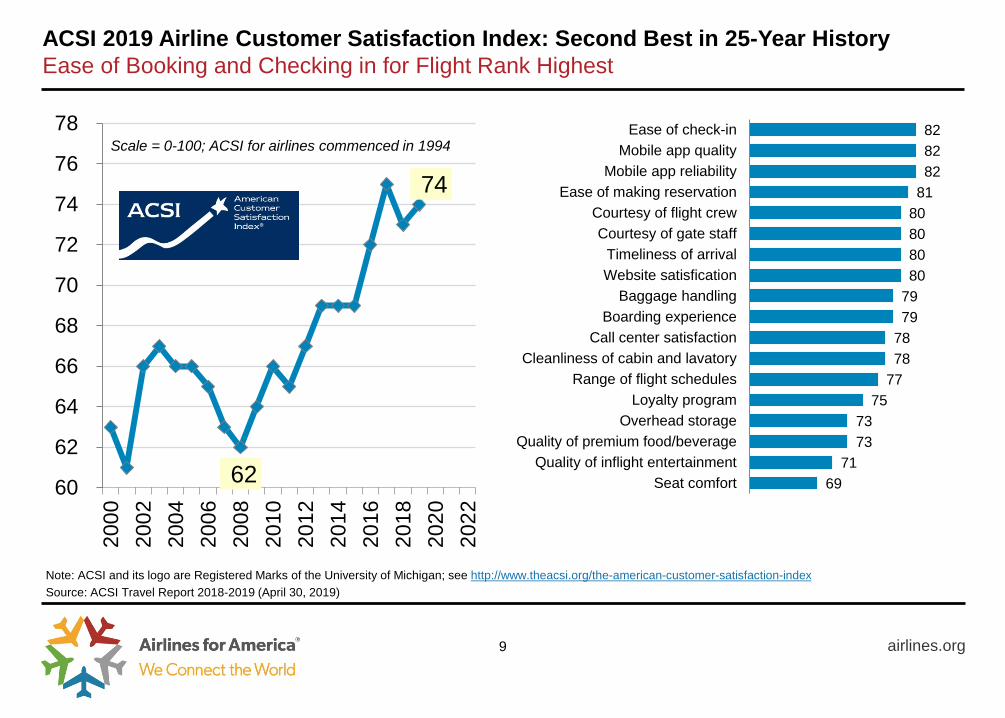
62
74
60
62
64
66
68
70
72
74
76
7820
0020
0220
0420
0620
0820
1020
1220
1420
1620
1820
2020
22
Note: ACSI and its logo are Registered Marks of the University of Michigan; see http://www.theacsi.org/the-american-customer-satisfaction-index
Scale = 0-100; ACSI for airlines commenced in 1994
9
ACSI 2019 Airline Customer Satisfaction Index: Second Best in 25-Year HistoryEase of Booking and Checking in for Flight Rank Highest
828282
8180808080
7979
7878
7775
7373
7169
Ease of check-inMobile app quality
Mobile app reliabilityEase of making reservation
Courtesy of flight crewCourtesy of gate staff
Timeliness of arrivalWebsite satisfication
Baggage handlingBoarding experience
Call center satisfactionCleanliness of cabin and lavatory
Range of flight schedulesLoyalty program
Overhead storageQuality of premium food/beverage
Quality of inflight entertainmentSeat comfort
Source: ACSI Travel Report 2018-2019 (April 30, 2019)
FIRST QUARTER 2019 REVIEW
airlines.org10
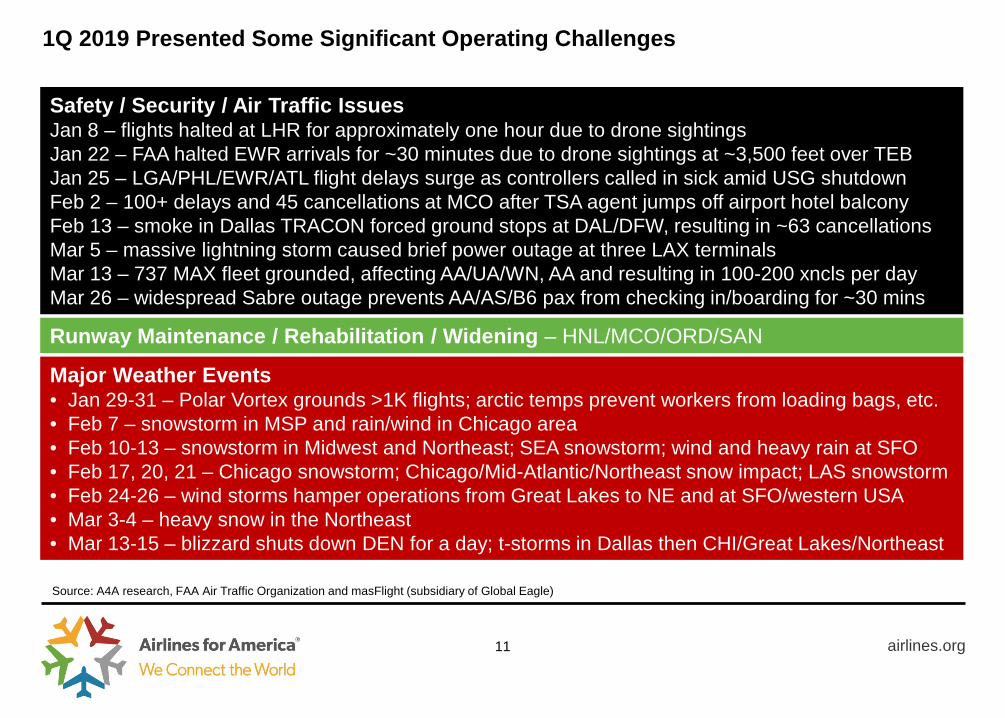
1Q 2019 Presented Some Significant Operating Challenges
airlines.org11
Source: A4A research, FAA Air Traffic Organization and masFlight (subsidiary of Global Eagle)
Safety / Security / Air Traffic IssuesJan 8 – flights halted at LHR for approximately one hour due to drone sightingsJan 22 – FAA halted EWR arrivals for ~30 minutes due to drone sightings at ~3,500 feet over TEBJan 25 – LGA/PHL/EWR/ATL flight delays surge as controllers called in sick amid USG shutdownFeb 2 – 100+ delays and 45 cancellations at MCO after TSA agent jumps off airport hotel balconyFeb 13 – smoke in Dallas TRACON forced ground stops at DAL/DFW, resulting in ~63 cancellationsMar 5 – massive lightning storm caused brief power outage at three LAX terminalsMar 13 – 737 MAX fleet grounded, affecting AA/UA/WN, AA and resulting in 100-200 xncls per dayMar 26 – widespread Sabre outage prevents AA/AS/B6 pax from checking in/boarding for ~30 mins
Major Weather Events• Jan 29-31 – Polar Vortex grounds >1K flights; arctic temps prevent workers from loading bags, etc.• Feb 7 – snowstorm in MSP and rain/wind in Chicago area• Feb 10-13 – snowstorm in Midwest and Northeast; SEA snowstorm; wind and heavy rain at SFO • Feb 17, 20, 21 – Chicago snowstorm; Chicago/Mid-Atlantic/Northeast snow impact; LAS snowstorm• Feb 24-26 – wind storms hamper operations from Great Lakes to NE and at SFO/western USA• Mar 3-4 – heavy snow in the Northeast• Mar 13-15 – blizzard shuts down DEN for a day; t-storms in Dallas then CHI/Great Lakes/Northeast
Runway Maintenance / Rehabilitation / Widening – HNL/MCO/ORD/SAN
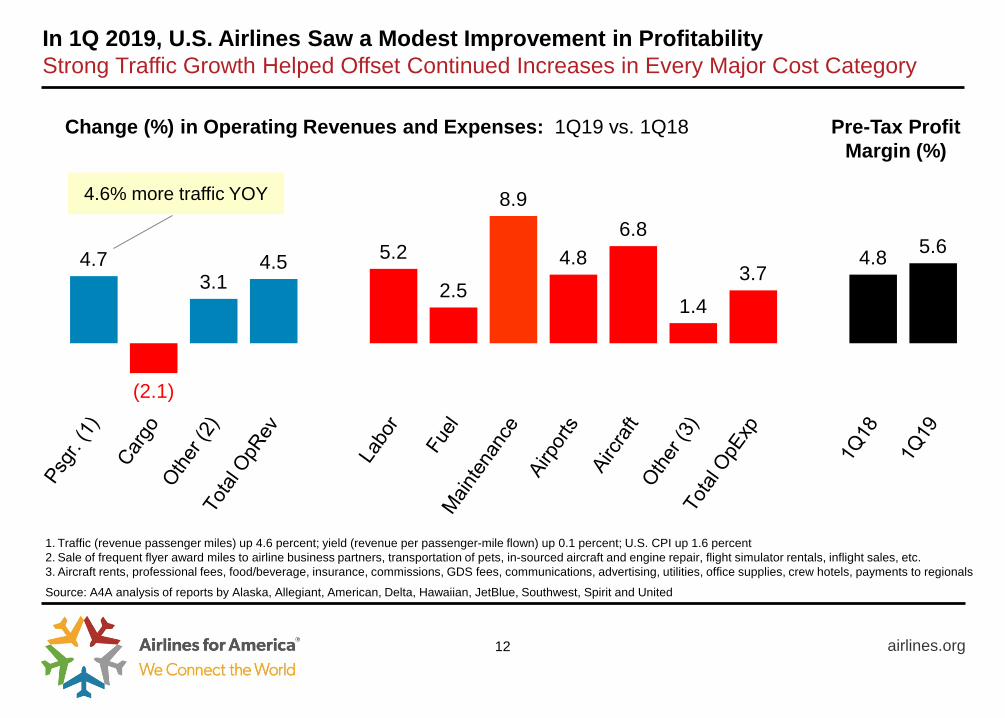
In 1Q 2019, U.S. Airlines Saw a Modest Improvement in ProfitabilityStrong Traffic Growth Helped Offset Continued Increases in Every Major Cost Category
airlines.org12
Change (%) in Operating Revenues and Expenses: 1Q19 vs. 1Q18
4.7
(2.1)
3.1 4.5 5.2
2.5
8.9
4.8 6.8
1.4 3.7
4.8 5.6
Source: A4A analysis of reports by Alaska, Allegiant, American, Delta, Hawaiian, JetBlue, Southwest, Spirit and United
1. Traffic (revenue passenger miles) up 4.6 percent; yield (revenue per passenger-mile flown) up 0.1 percent; U.S. CPI up 1.6 percent2. Sale of frequent flyer award miles to airline business partners, transportation of pets, in-sourced aircraft and engine repair, flight simulator rentals, inflight sales, etc.3. Aircraft rents, professional fees, food/beverage, insurance, commissions, GDS fees, communications, advertising, utilities, office supplies, crew hotels, payments to regionals
Pre-Tax ProfitMargin (%)
4.6% more traffic YOY
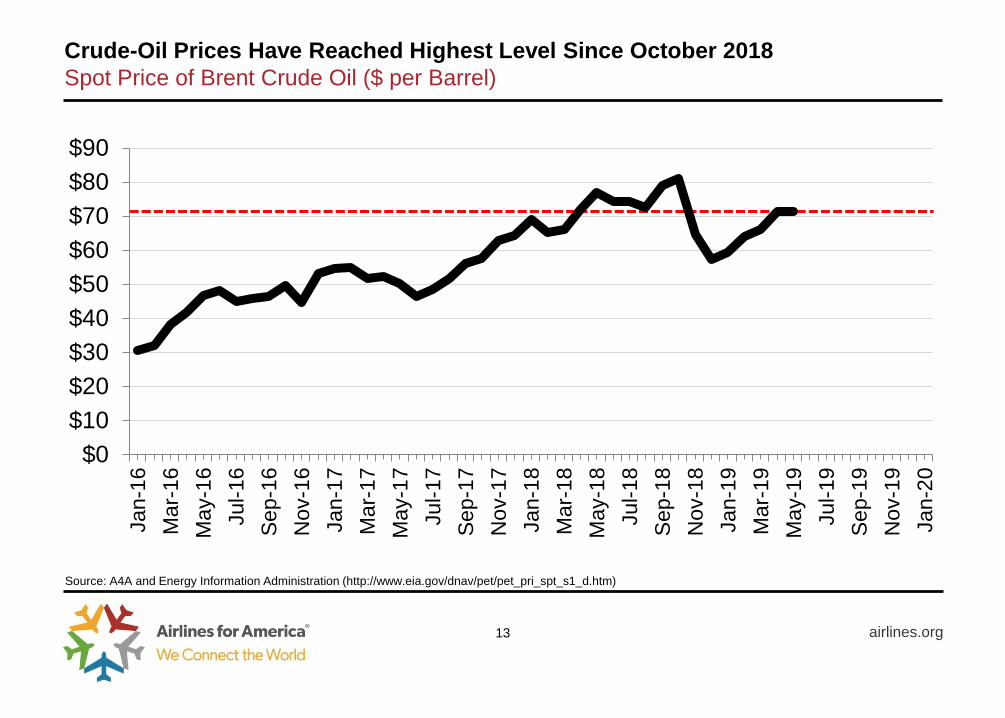
Crude-Oil Prices Have Reached Highest Level Since October 2018Spot Price of Brent Crude Oil ($ per Barrel)
airlines.org13
$0$10$20$30$40$50$60$70$80$90
Jan-
16M
ar-1
6M
ay-1
6Ju
l-16
Sep
-16
Nov
-16
Jan-
17M
ar-1
7M
ay-1
7Ju
l-17
Sep
-17
Nov
-17
Jan-
18M
ar-1
8M
ay-1
8Ju
l-18
Sep
-18
Nov
-18
Jan-
19M
ar-1
9M
ay-1
9Ju
l-19
Sep
-19
Nov
-19
Jan-
20
Source: A4A and Energy Information Administration (http://www.eia.gov/dnav/pet/pet_pri_spt_s1_d.htm)
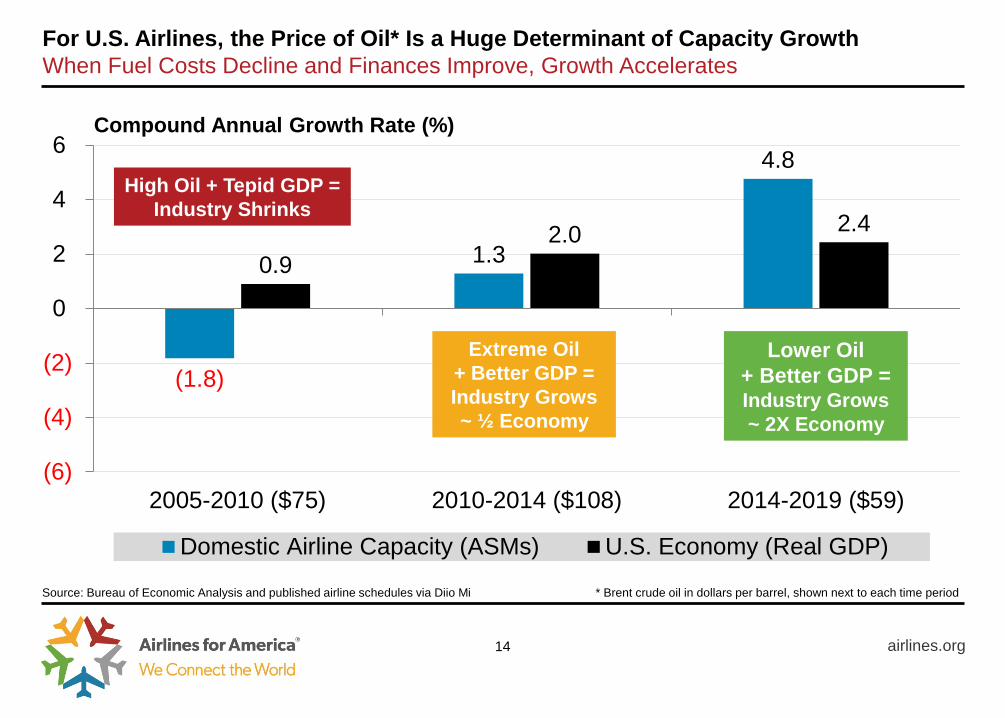
For U.S. Airlines, the Price of Oil* Is a Huge Determinant of Capacity GrowthWhen Fuel Costs Decline and Finances Improve, Growth Accelerates
airlines.org
Source: Bureau of Economic Analysis and published airline schedules via Diio Mi
(1.8)
1.3
4.8
0.9 2.0 2.4
(6)
(4)
(2)
0
2
4
6
2005-2010 ($75) 2010-2014 ($108) 2014-2019 ($59)
Domestic Airline Capacity (ASMs) U.S. Economy (Real GDP)
14
* Brent crude oil in dollars per barrel, shown next to each time period
Compound Annual Growth Rate (%)
High Oil + Tepid GDP =Industry Shrinks
Extreme Oil+ Better GDP =Industry Grows~ ½ Economy
Lower Oil+ Better GDP =Industry Grows~ 2X Economy
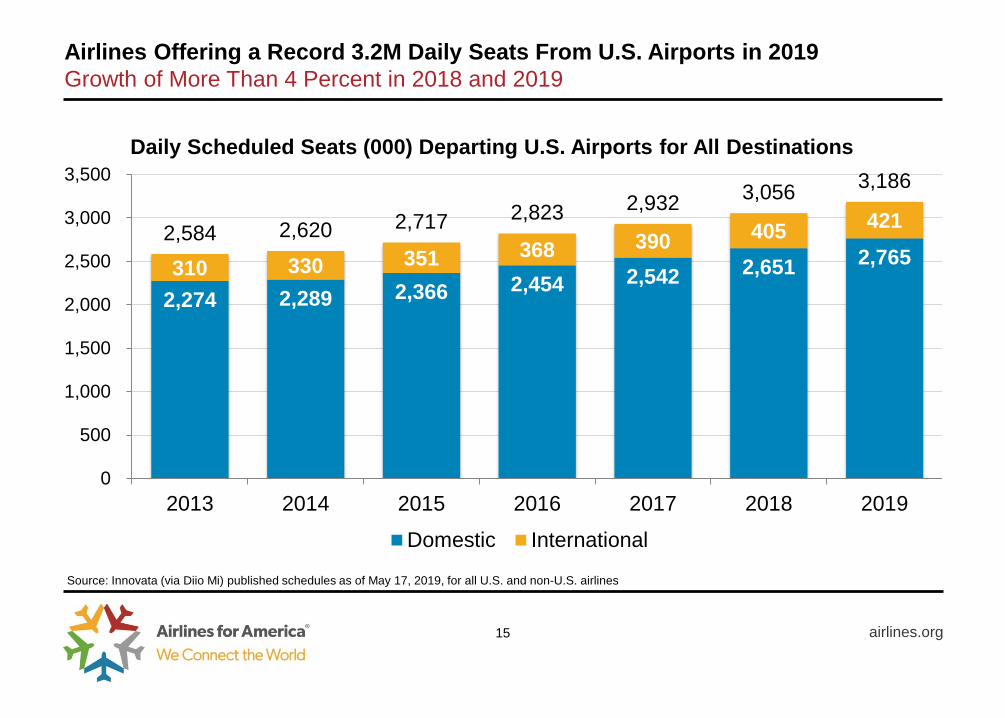
2,274 2,289 2,366 2,454 2,542 2,651 2,765 310 330 351 368 390 405 421 2,584 2,620 2,717 2,823 2,932 3,056 3,186
0
500
1,000
1,500
2,000
2,500
3,000
3,500
2013 2014 2015 2016 2017 2018 2019
Domestic International
Airlines Offering a Record 3.2M Daily Seats From U.S. Airports in 2019Growth of More Than 4 Percent in 2018 and 2019
airlines.org15
Source: Innovata (via Diio Mi) published schedules as of May 17, 2019, for all U.S. and non-U.S. airlines
Daily Scheduled Seats (000) Departing U.S. Airports for All Destinations
COPING WITH THE ABSENCE OF THE B737 MAX
airlines.org16
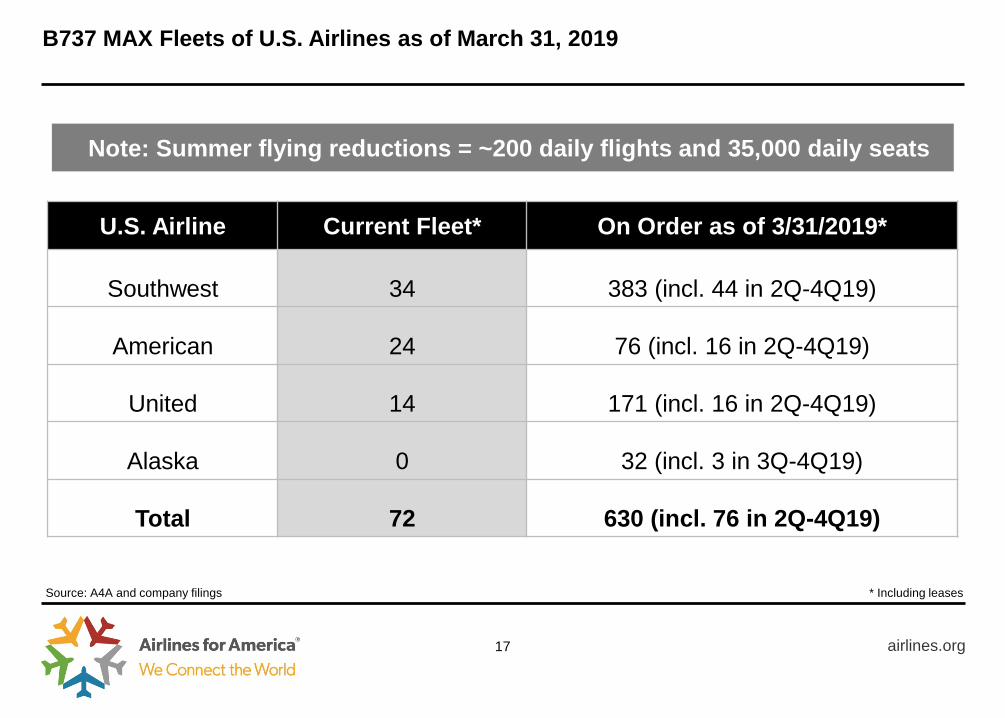
B737 MAX Fleets of U.S. Airlines as of March 31, 2019
airlines.org17
U.S. Airline Current Fleet* On Order as of 3/31/2019*
Southwest 34 383 (incl. 44 in 2Q-4Q19)
American 24 76 (incl. 16 in 2Q-4Q19)
United 14 171 (incl. 16 in 2Q-4Q19)
Alaska 0 32 (incl. 3 in 3Q-4Q19)
Total 72 630 (incl. 76 in 2Q-4Q19)
Source: A4A and company filings * Including leases
Note: Summer flying reductions = ~200 daily flights and 35,000 daily seats
airlines.org18
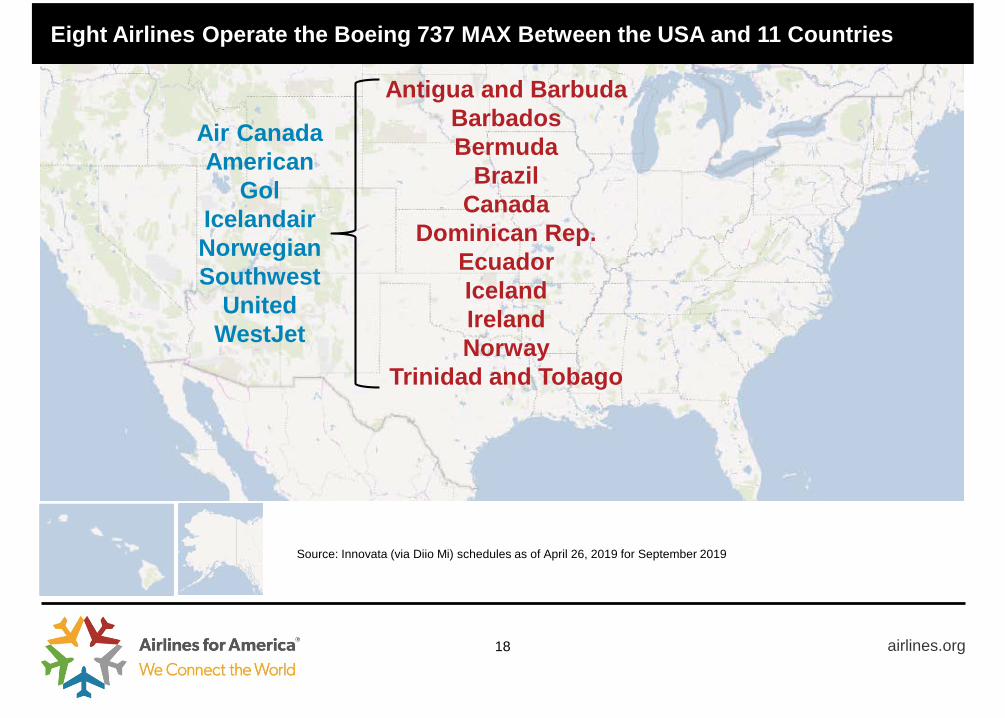
Eight Airlines Operate the Boeing 737 MAX Between the USA and 11 Countries
Air CanadaAmerican
Gol IcelandairNorwegian Southwest
UnitedWestJet
Source: Innovata (via Diio Mi) schedules as of April 26, 2019 for September 2019
Antigua and BarbudaBarbadosBermuda
BrazilCanada
Dominican Rep.EcuadorIcelandIrelandNorway
Trinidad and Tobago
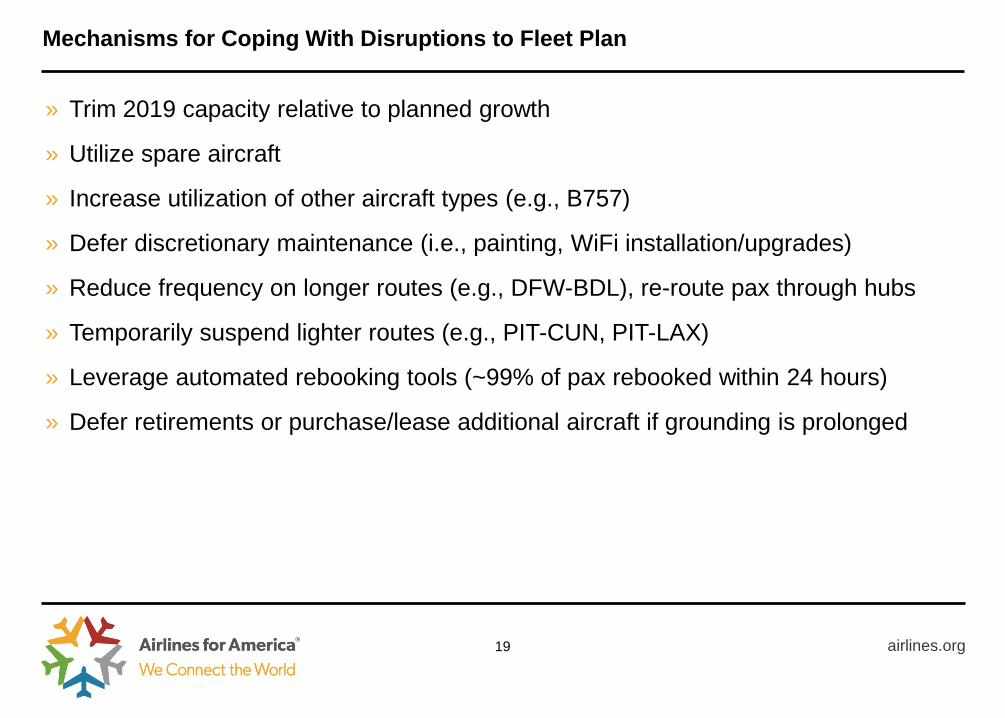
Mechanisms for Coping With Disruptions to Fleet Plan
airlines.org19
» Trim 2019 capacity relative to planned growth
» Utilize spare aircraft
» Increase utilization of other aircraft types (e.g., B757)
» Defer discretionary maintenance (i.e., painting, WiFi installation/upgrades)
» Reduce frequency on longer routes (e.g., DFW-BDL), re-route pax through hubs
» Temporarily suspend lighter routes (e.g., PIT-CUN, PIT-LAX)
» Leverage automated rebooking tools (~99% of pax rebooked within 24 hours)
» Defer retirements or purchase/lease additional aircraft if grounding is prolonged
SUMMER 2019 AIR TRAVEL FORECASTWorldwide Operations of All U.S Passenger Airlines
airlines.org20
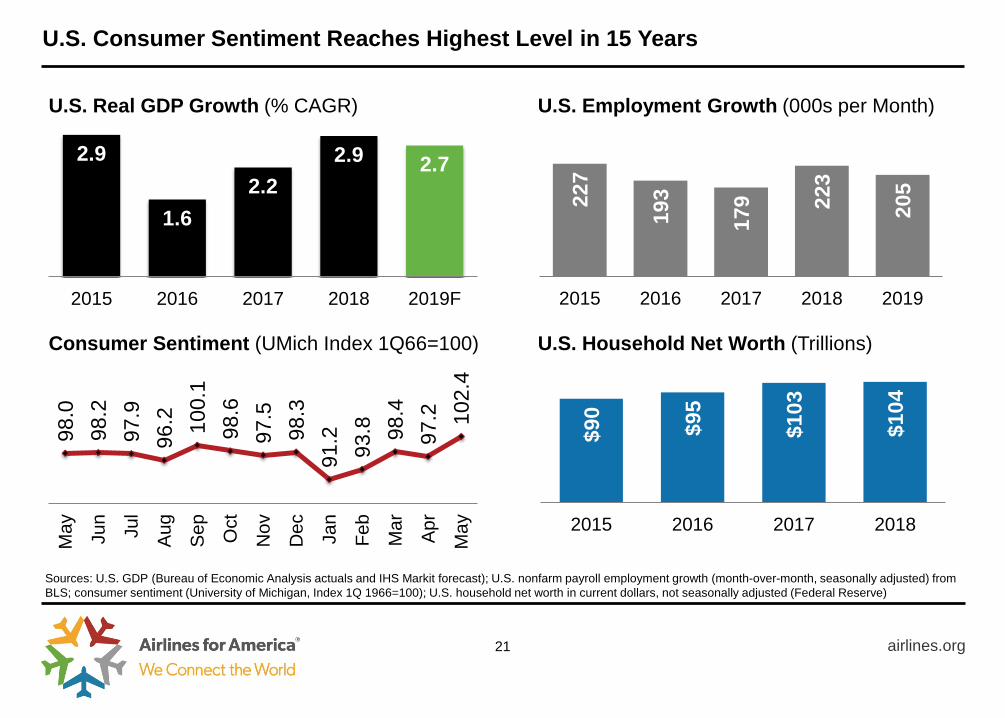
U.S. Consumer Sentiment Reaches Highest Level in 15 Years
airlines.org
2.9
1.6 2.2
2.9 2.7
2015 2016 2017 2018 2019F
U.S. Real GDP Growth (% CAGR)
21
U.S. Employment Growth (000s per Month)
227
193
179 22
3
205
2015 2016 2017 2018 2019
Sources: U.S. GDP (Bureau of Economic Analysis actuals and IHS Markit forecast); U.S. nonfarm payroll employment growth (month-over-month, seasonally adjusted) from BLS; consumer sentiment (University of Michigan, Index 1Q 1966=100); U.S. household net worth in current dollars, not seasonally adjusted (Federal Reserve)
Consumer Sentiment (UMich Index 1Q66=100) U.S. Household Net Worth (Trillions)
$90
$95
$103
$104
2015 2016 2017 2018
98.0
98
.2
97.9
96
.2
100.
1 98
.6
97.5
98
.3
91.2
93
.8
98.4
97
.2
102.
4
May Jun
Jul
Aug
Sep Oct
Nov
Dec Jan
Feb
Mar Apr
May
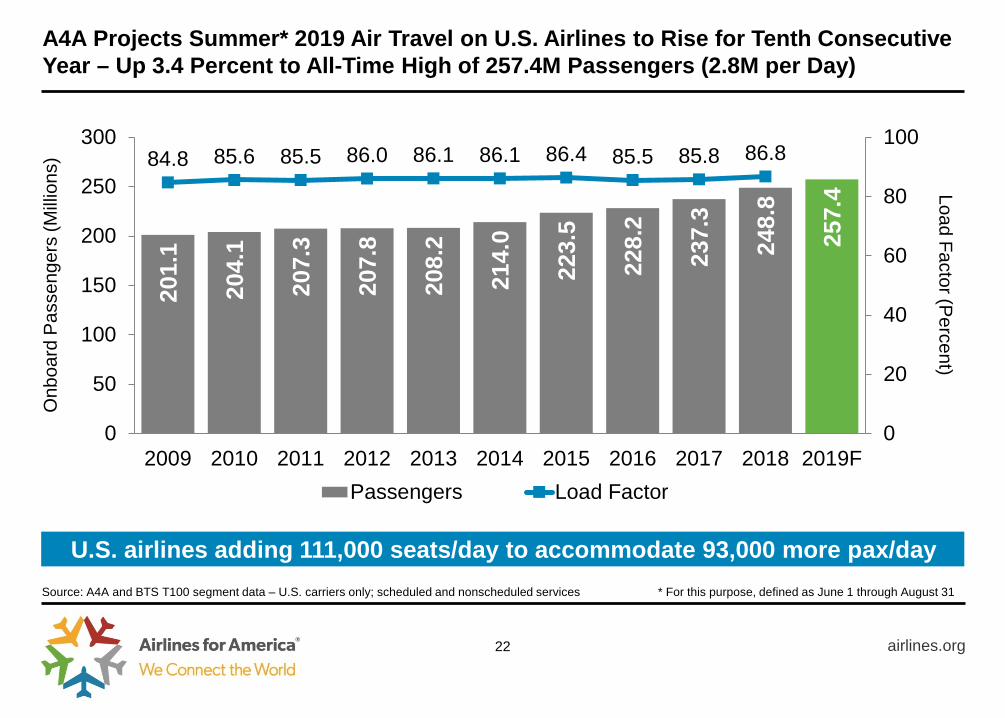
A4A Projects Summer* 2019 Air Travel on U.S. Airlines to Rise for Tenth Consecutive Year – Up 3.4 Percent to All-Time High of 257.4M Passengers (2.8M per Day)
airlines.org22
201.
1
204.
1
207.
3
207.
8
208.
2
214.
0
223.
5
228.
2
237.
3
248.
8
257.
4
84.8 85.6 85.5 86.0 86.1 86.1 86.4 85.5 85.8 86.8
0
20
40
60
80
100
0
50
100
150
200
250
300
2009 2010 2011 2012 2013 2014 2015 2016 2017 2018 2019FPassengers Load Factor
Source: A4A and BTS T100 segment data – U.S. carriers only; scheduled and nonscheduled services * For this purpose, defined as June 1 through August 31
Onb
oard
Pas
seng
ers
(Mill
ions
)Load Factor (P
ercent)
U.S. airlines adding 111,000 seats/day to accommodate 93,000 more pax/day
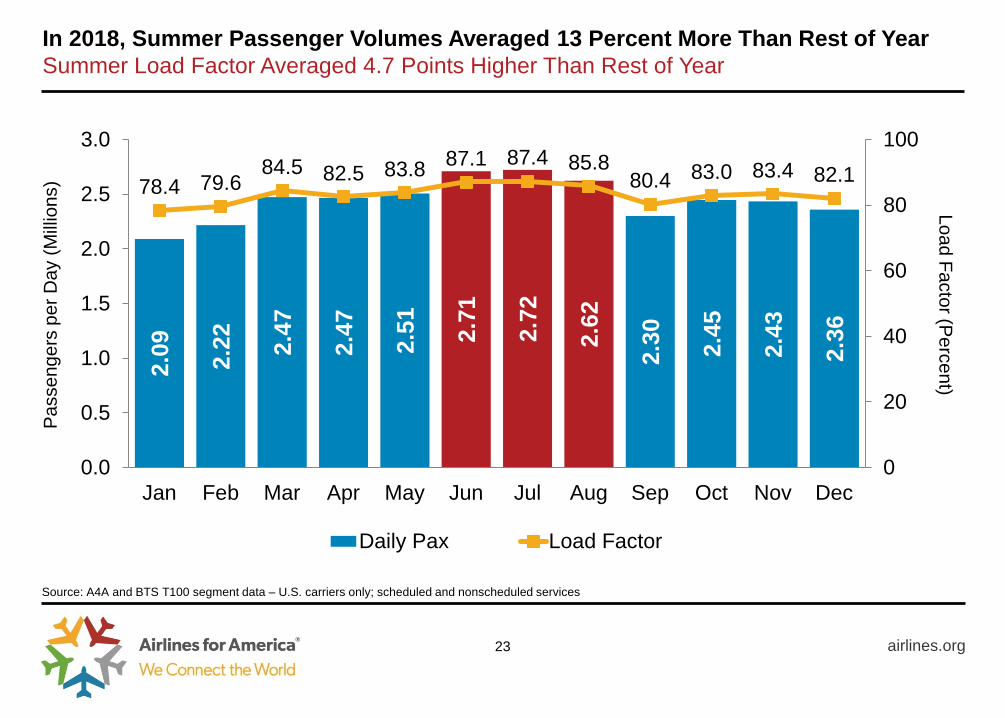
In 2018, Summer Passenger Volumes Averaged 13 Percent More Than Rest of YearSummer Load Factor Averaged 4.7 Points Higher Than Rest of Year
airlines.org23
2.09 2.22 2.
47
2.47
2.51 2.71
2.72
2.62
2.30 2.45
2.43
2.36
78.4 79.6 84.5 82.5 83.8 87.1 87.4 85.8
80.4 83.0 83.4 82.1
0
20
40
60
80
100
0.0
0.5
1.0
1.5
2.0
2.5
3.0
Jan Feb Mar Apr May Jun Jul Aug Sep Oct Nov Dec
Daily Pax Load Factor
Source: A4A and BTS T100 segment data – U.S. carriers only; scheduled and nonscheduled services
Pas
seng
ers
per D
ay (M
illio
ns)
Load Factor (Percent)
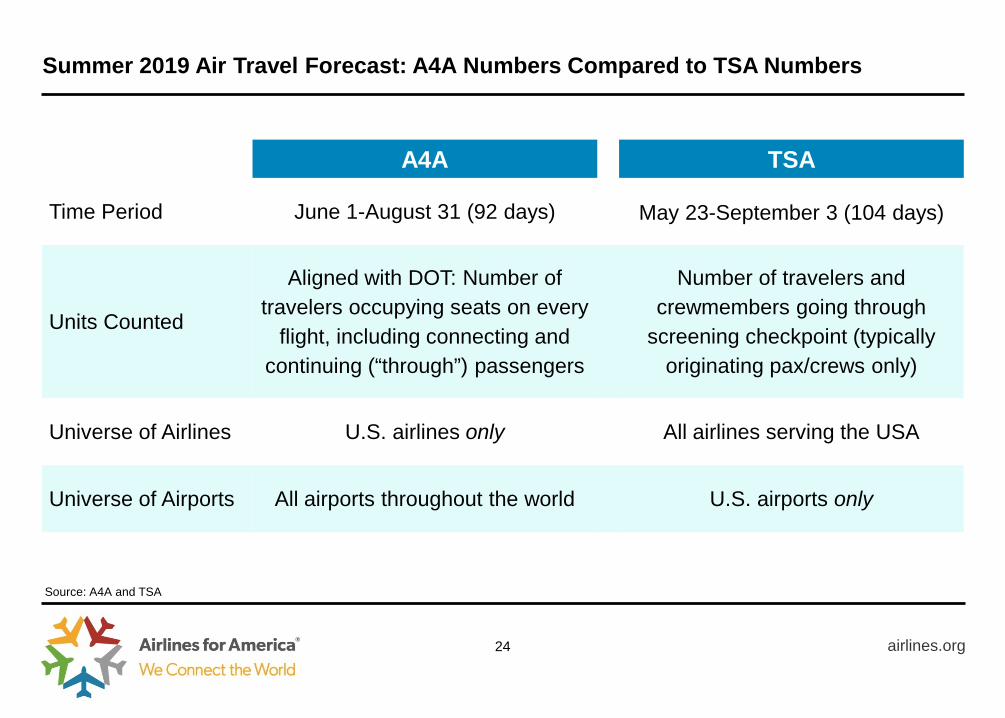
Summer 2019 Air Travel Forecast: A4A Numbers Compared to TSA Numbers
airlines.org24
Source: A4A and TSA
A4A TSA
Time Period June 1-August 31 (92 days) May 23-September 3 (104 days)
Units Counted
Aligned with DOT: Number of travelers occupying seats on every
flight, including connecting and continuing (“through”) passengers
Number of travelers and crewmembers going through
screening checkpoint (typically originating pax/crews only)
Universe of Airlines U.S. airlines only All airlines serving the USA
Universe of Airports All airports throughout the world U.S. airports only

ITEMS TO WATCH THIS SUMMER AND BEYOND
airlines.org25
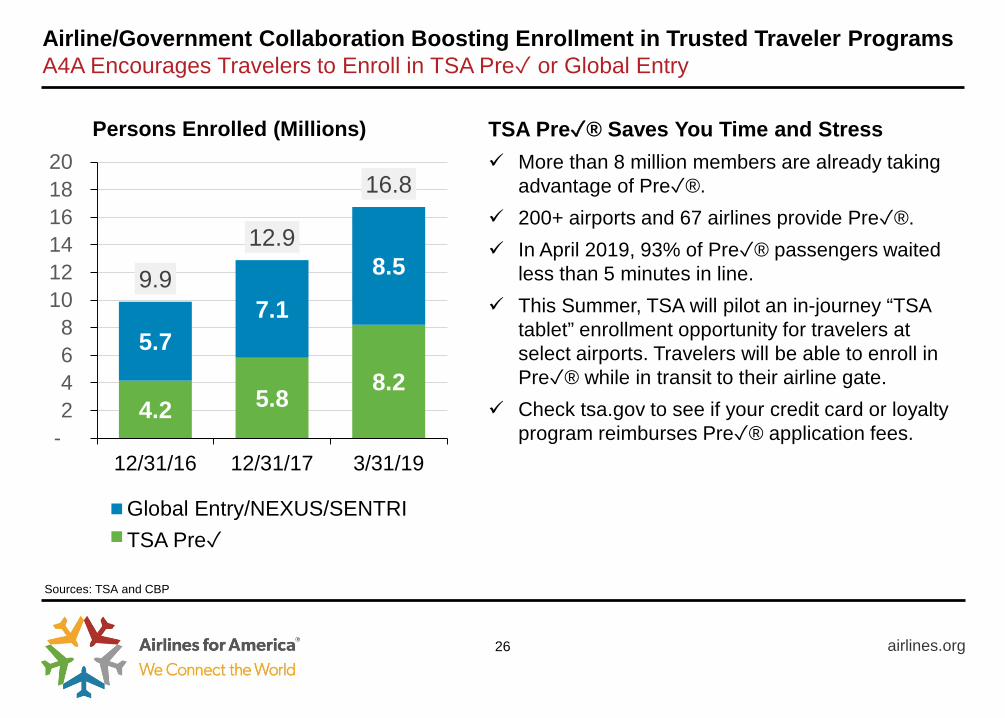
Airline/Government Collaboration Boosting Enrollment in Trusted Traveler ProgramsA4A Encourages Travelers to Enroll in TSA Pre✓ or Global Entry
airlines.org
Sources: TSA and CBP
26
Persons Enrolled (Millions)
4.2 5.8 8.25.7
7.1
8.59.9
12.9
16.8
- 2 4 6 8
10 12 14 16 18 20
12/31/16 12/31/17 3/31/19
Global Entry/NEXUS/SENTRITSA Pre✓
TSA Pre✓® Saves You Time and Stress More than 8 million members are already taking
advantage of Pre✓®. 200+ airports and 67 airlines provide Pre✓®. In April 2019, 93% of Pre✓® passengers waited
less than 5 minutes in line. This Summer, TSA will pilot an in-journey “TSA
tablet” enrollment opportunity for travelers at select airports. Travelers will be able to enroll in Pre✓® while in transit to their airline gate.
Check tsa.gov to see if your credit card or loyalty program reimburses Pre✓® application fees.
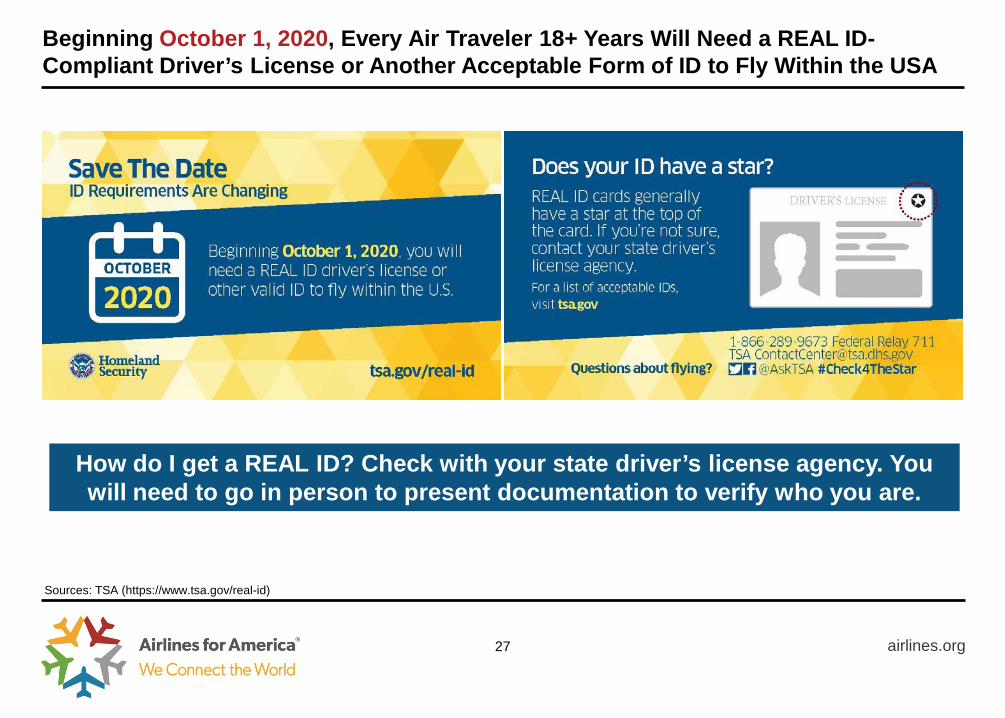
Beginning October 1, 2020, Every Air Traveler 18+ Years Will Need a REAL ID-Compliant Driver’s License or Another Acceptable Form of ID to Fly Within the USA
airlines.org
Sources: TSA (https://www.tsa.gov/real-id)
27
How do I get a REAL ID? Check with your state driver’s license agency. You will need to go in person to present documentation to verify who you are.
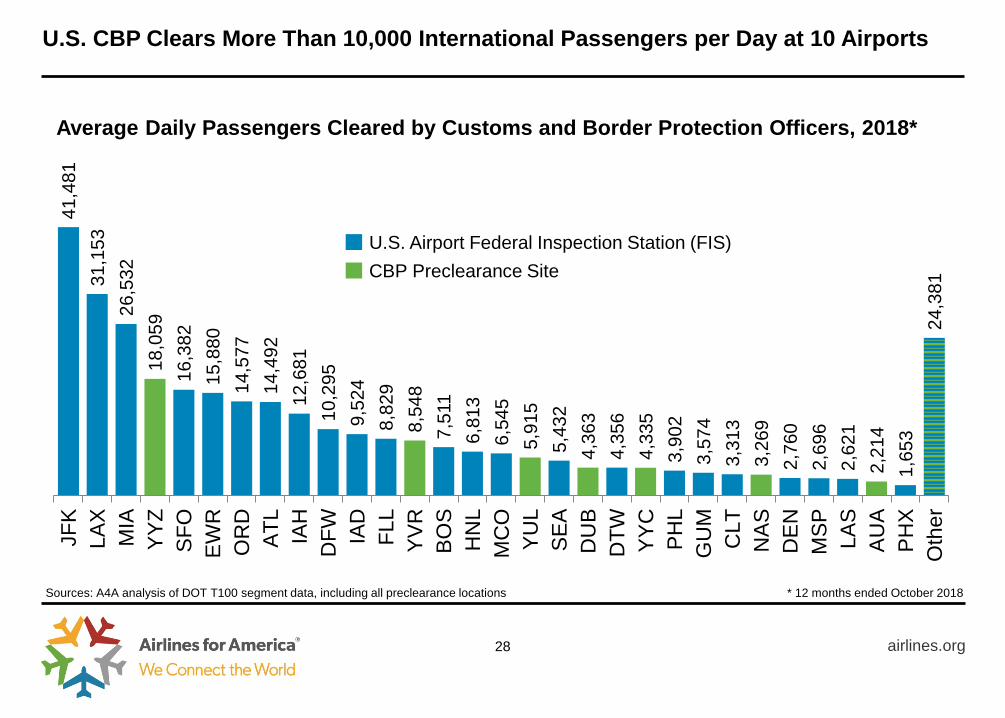
U.S. CBP Clears More Than 10,000 International Passengers per Day at 10 Airports
airlines.org28
Sources: A4A analysis of DOT T100 segment data, including all preclearance locations * 12 months ended October 2018
41,4
81
31,1
53
26,5
32
18,0
59
16,3
82
15,8
80
14,5
77
14,4
92
12,6
81
10,2
95
9,52
4 8,
829
8,54
8 7,
511
6,81
3 6,
545
5,91
5 5,
432
4,36
3 4,
356
4,33
5 3,
902
3,57
4 3,
313
3,26
9 2,
760
2,69
6 2,
621
2,21
4 1,
653
24,3
81
JFK
LAX
MIA
YY
ZS
FOE
WR
OR
DA
TL IAH
DFW IA
DFL
LY
VR
BO
SH
NL
MC
OY
UL
SE
AD
UB
DTW YY
CP
HL
GU
MC
LTN
AS
DE
NM
SP
LAS
AU
AP
HX
Oth
er
Average Daily Passengers Cleared by Customs and Border Protection Officers, 2018*
U.S. Airport Federal Inspection Station (FIS)CBP Preclearance Site
airlines.org29
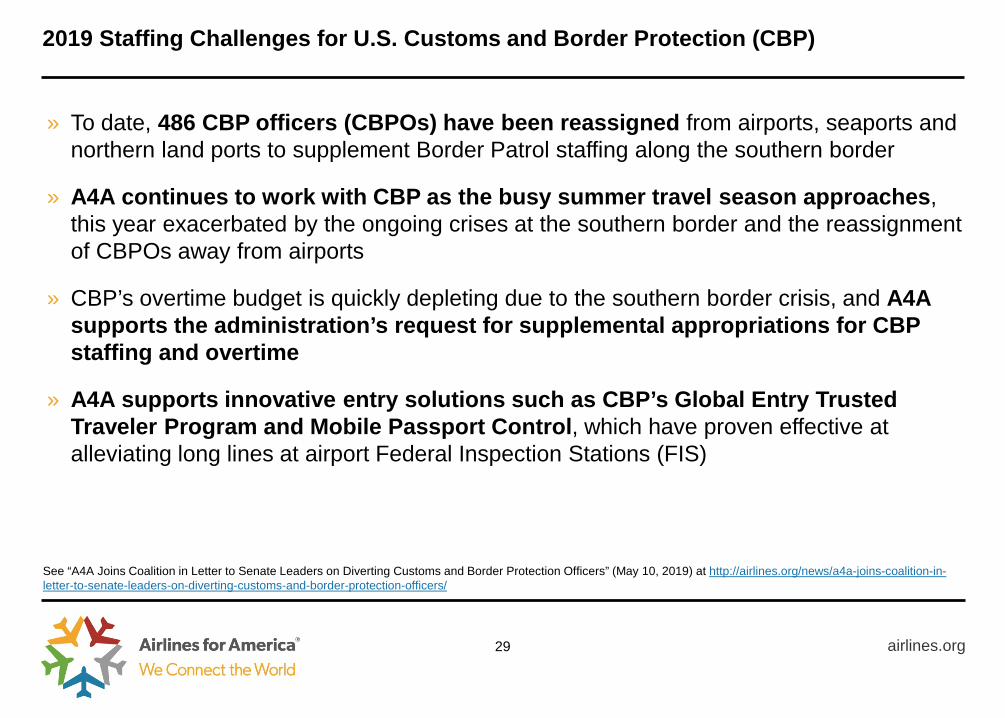
» To date, 486 CBP officers (CBPOs) have been reassigned from airports, seaports and northern land ports to supplement Border Patrol staffing along the southern border
» A4A continues to work with CBP as the busy summer travel season approaches, this year exacerbated by the ongoing crises at the southern border and the reassignment of CBPOs away from airports
» CBP’s overtime budget is quickly depleting due to the southern border crisis, and A4A supports the administration’s request for supplemental appropriations for CBP staffing and overtime
» A4A supports innovative entry solutions such as CBP’s Global Entry Trusted Traveler Program and Mobile Passport Control, which have proven effective at alleviating long lines at airport Federal Inspection Stations (FIS)
2019 Staffing Challenges for U.S. Customs and Border Protection (CBP)
See “A4A Joins Coalition in Letter to Senate Leaders on Diverting Customs and Border Protection Officers” (May 10, 2019) at http://airlines.org/news/a4a-joins-coalition-in-letter-to-senate-leaders-on-diverting-customs-and-border-protection-officers/
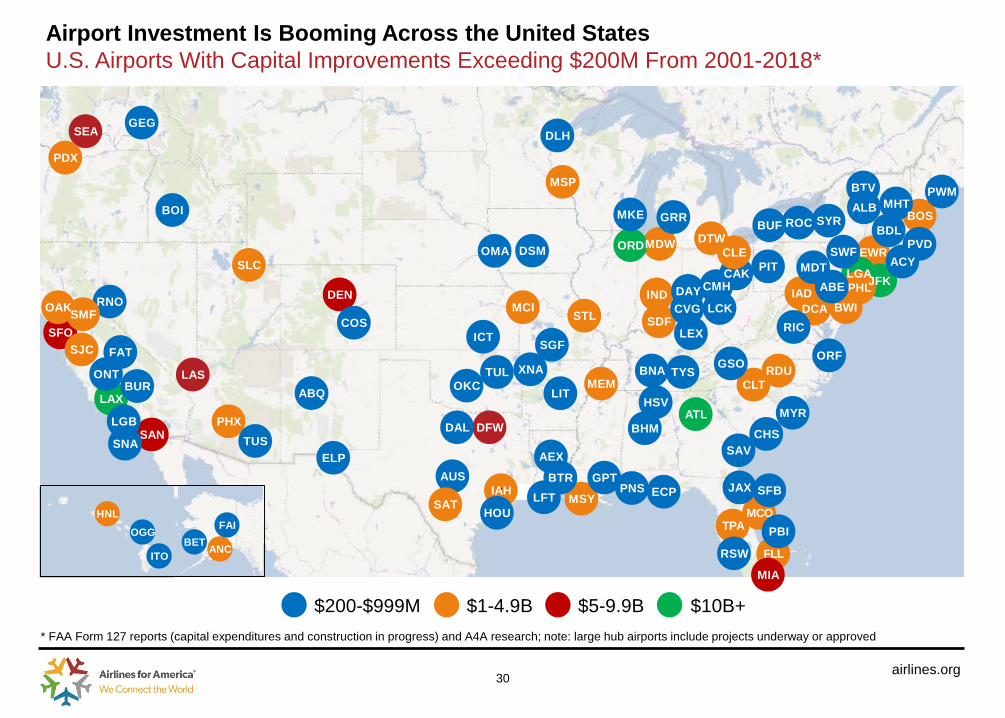
Airport Investment Is Booming Across the United StatesU.S. Airports With Capital Improvements Exceeding $200M From 2001-2018*
$1-4.9B $5-9.9B $10B+$200-$999M
.
ATL
CLT
DCA
DFW
EWR
IAH
JFKLGA
MDW
MIA
PHL
SEA
MCOTPA
MSP
PDX
DEN
LAS
PHX
SLC
SAN
LAX
BWI
MYR
RNO IND
ICT
AUS
MEM
LGB
SJC
MSY
MCI
BHMDAL
HOU
RDUBNA
SMF STL
SGF
DSM
TULOKC
BOI
GPTELP
TUS
JAX
COS
HSV
GRR
SNA
FAT
BURXNA
LIT
ECP
BDL
GEG
AEX
ACY
PNS
PBI
RSW
SAV
SFB
LEX
BTR
PWM
LFT
BUF
GSO
DLH
OMA
ROC SYRMHT
ABQ
BOS
PVD
ABE
CLE
CAK PIT
CHS
DAYCVG
CMH
SAT
TYS
IAD
SWF
FLL
DTW
SDF
ORF
RIC
BTV
MKE
SFO
OAK
ORD
HNL
ANC
FAIOGG
ITOBET
* FAA Form 127 reports (capital expenditures and construction in progress) and A4A research; note: large hub airports include projects underway or approved
30airlines.org
MDT
ALB
ONT
LCK
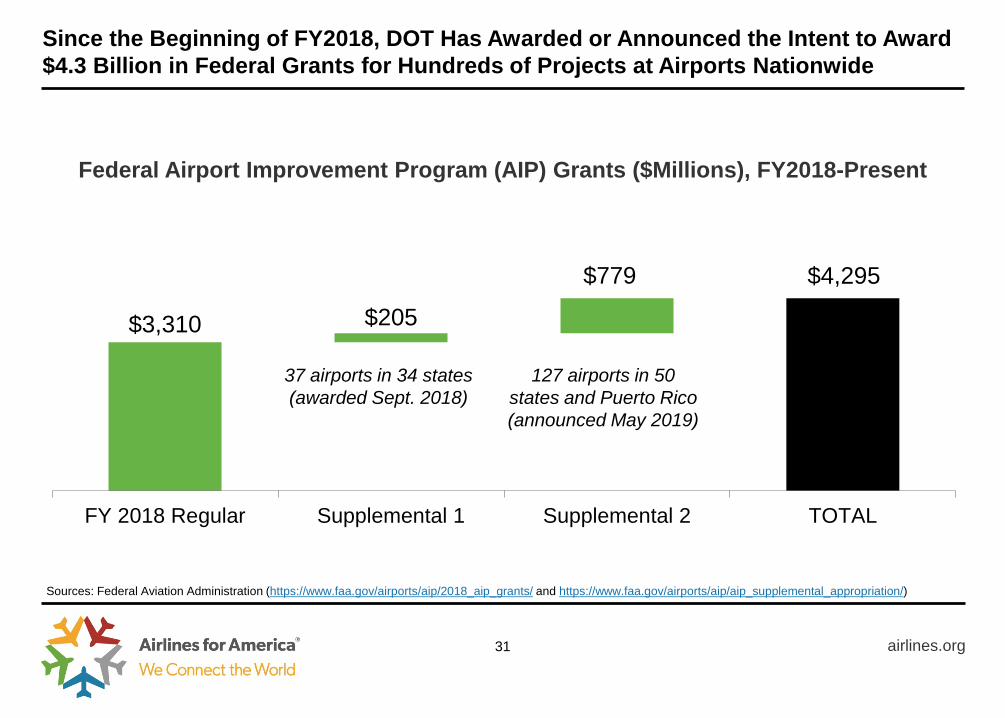
Since the Beginning of FY2018, DOT Has Awarded or Announced the Intent to Award $4.3 Billion in Federal Grants for Hundreds of Projects at Airports Nationwide
Sources: Federal Aviation Administration (https://www.faa.gov/airports/aip/2018_aip_grants/ and https://www.faa.gov/airports/aip/aip_supplemental_appropriation/)
$3,310 $205
$779 $4,295
FY 2018 Regular Supplemental 1 Supplemental 2 TOTAL
airlines.org31
Federal Airport Improvement Program (AIP) Grants ($Millions), FY2018-Present
37 airports in 34 states(awarded Sept. 2018)
127 airports in 50 states and Puerto Rico(announced May 2019)
airlines.org32
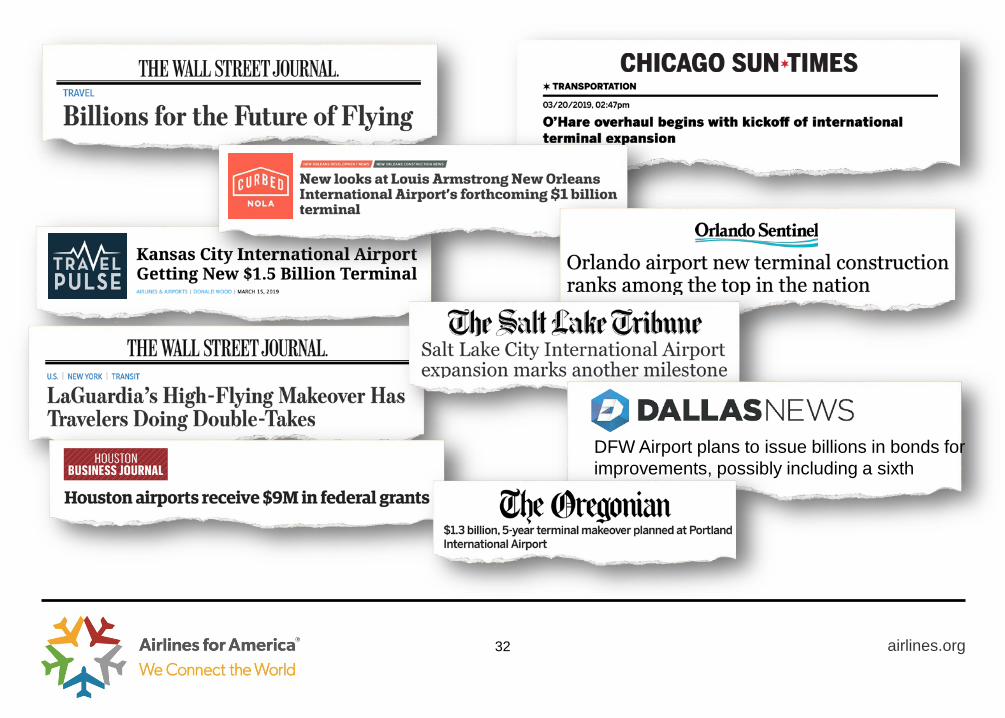
DFW Airport plans to issue billions in bonds forimprovements, possibly including a sixth terminal
airlines.org33
Source: https://www.stopairtaxnow.com/
http://airlines.org/dataset/current-operation-status-for-us-airports/