aade symposium 2011 haynesville shaleshale.pdfdrilling in the core of three of the nation’s...
TRANSCRIPT

1
AADE Symposium 2011
Haynesville Shale
Presented by James R. Redfearn
Vice President Drilling & Completions
Mid Continent Region
January 19, 2011

This communication contains forward-looking information regarding Petrohawk that is intended to be covered by the safe harbor "forward-looking
statements" provided by of the Private Securities Litigation Reform Act of 1995. Forward-looking statements are based on Petrohawk's current
expectations beliefs, plans, objectives, assumptions and strategies. Forward-looking statements often, but not always, can be identified by using words
such as "expects", "anticipates", "plans", "estimates", "potential", "possible", "probable", or "intends", or where Petrohawk states that certain actions,
events or results "may", "will", "should", or "could" be taken, occur or be achieved. Statements concerning oil and gas reserves also may be deemed to be
forward-looking statements in that they reflect estimates based on certain assumptions that the resources involved can be economically exploited.
Forward-looking statements are based on current expectations, estimates and projections that involve a number of risks and uncertainties, which could
cause actual results to differ materially from those reflected in the statements. These risks include, but are not limited to: the risks of the oil and gas
industry (for example, operational risks in exploring for, developing and producing crude oil and natural gas; risks and uncertainties involving geology of
oil and gas deposits; the uncertainty of reserve estimates; the uncertainty of estimates and projections relating to future production, costs and expenses;
potential delays or changes in plans with respect to exploration or development projects or capital expenditures; health, safety and environmental risks
and risks related to weather such as hurricanes and other natural disasters); uncertainties as to the availability and cost of financing; fluctuations in oil and
gas prices; risks associated with derivative positions; inability to realize expected value from acquisitions, inability of our management team to execute its
plans to meet its goals, shortages of drilling equipment, oil field personnel and services, unavailability of gathering systems, pipelines and processing
facilities and the possibility that government policies may change or governmental approvals may be delayed or withheld. Additional information on these
and other factors which could affect Petrohawk's operations or financial results are included in Petrohawk's reports on file with the SEC. Investors are
cautioned that any forward-looking statements are not guarantees of future performance and actual results or developments may differ materially from the
projections in the forward-looking statements. Forward-looking statements are based on the estimates and opinions of management at the time the
statements are made. Petrohawk does not assume any obligation to update forward-looking statements should circumstances or management's
estimates or opinions change.
The SEC generally permits oil and gas companies, in filings made with the SEC, to disclose only proved reserves, which are reserve estimates that
geological and engineering data demonstrate with reasonable certainty to be recoverable in future years from known reservoirs under existing economic
and operating conditions. In this communication, we use the term "resource potential" which the SEC guidelines prohibit from being included in filings
with the SEC. "Resource potential" refers to the Company's internal estimates of hydrocarbon quantities that may be potentially discovered through
exploratory drilling or recovered with additional drilling or recovery techniques. Resource potential may not constitute reserves within the meaning of the
Society of Petroleum Engineer's Petroleum Resource Management System or proposed SEC rules and does not include any proved reserves. Area wide
resource potential has been risked using a risk factor selected by the Company's management. Actual quantities that may be ultimately recovered from
the Company's interests will differ substantially. Factors affecting ultimate recovery include the scope of our ongoing drilling program, which will be
directly affected by the availability of capital, drilling and production costs, availability of drilling services and equipment, drilling results, lease expirations,
transportation constraints, regulatory approvals and other factors; and actual drilling results, including geological and mechanical factors affecting
recovery rates. Estimates of resource potential may change significantly as development of the Company's resource plays provides additional data. In
addition, our production forecasts and expectations for future periods are dependant upon many assumptions, including estimates of production decline
rates from existing wells and the undertaking and outcome of future drilling activity, which may be affected by significant commodity price declines or
drilling cost increases.
Forward Looking Statements

HK Assets: Core, Concentrated
Our properties hold over 8,000 locations of untapped unconventional
drilling in the core of three of the nation’s largest oil and natural gas fields
Petrohawk has 2.75 Tcfe of proved reserves and
over 35.6 Tcf and 356 Mmbo of net risked resource potential(1)
(1) Proved reserves based on product prices at 12/31/09 of $3.87 per Mmbtu of natural gas and $61.18 per Bbl of oil.
(2) Current Petrohawk net risked estimates. Calculation of resource potential assigns a risk factor to net undeveloped acreage (65% for the Haynesville Shale, 80% for the Lower Bossier Shale, and 90% for Hawkville Field and Black Hawk in the Eagle Ford Shale, and 50% for Red Hawk in the Eagle Ford Shale) which is multiplied by average NRI and average estimated EUR per well.
Haynesville Shale~368,000 net acres
1.53 Tcf 2009 proved reserves(1)
20.6 Tcf resource potential(2)
Lower Bossier Shale~122,000 net acres
5.0 Tcfe resource potential(2)
~122,000 net undeveloped acres
Eagle Ford Shale~368,000 net acres
288 Bcfe 2009 proved reserves(1)
10.0 Tcf + 356 Mmbo resource potential(2)
~35%
~65%
of our acreage
is prospective
for either oil or
condensate +
natural gasof our
acreage is
prospective
for natural
gas
~30%
~70%

$200, 9%
$200, 9%
$900, 39%
$900, 39%
$100, 4%
$1,900, 82%
Midstream Segment Leasing Activity Haynesville/Bossier Eagle Ford FV/Other
2011 Capital Budget Summary
2011 Wells Planned
2011 Avg. # Op. Rigs Operated Non-Operated Total
Haynesville 13 92 240 332
Eagle Ford 13 136 9 145
FV/Other(1) 0 1 327 328
Total 26 229 576 805
(1) Not yet adjusted for Fayetteville Shale sale
$2,300 mm $1,900 mm
D&C Budget

306
475
670
905
-
100
200
300
400
500
600
700
800
900
1,000
2008 2009 2010 E 2011 E
Gas Oil NGL
306
475
670
905
-
100
200
300
400
500
600
700
800
900
1,000
2008 2009 2010 E 2011 E
Haynesville Eagle Ford Fayetteville Elm Grove Other
Yet to be
adjusted for
sale of
Fayetteville
Shale
Production Growth – By Product (Mmcfe/d): Production Growth – By Area (Mmcfe/d):Yet to be
adjusted for
sale of
Fayetteville
Shale
Multi-Year Production Growth Outlook
(1) 2010 E - based on midpoint of full year production guidance, 665 - 675 Mmcfe/d with divestitures taken into account(2) 2011 E - used midpoint of 2010 full year guidance and applied mid point of growth range estimates, 30% - 40% year over year growth.
Does not take into account sale of Fayetteville Shale.
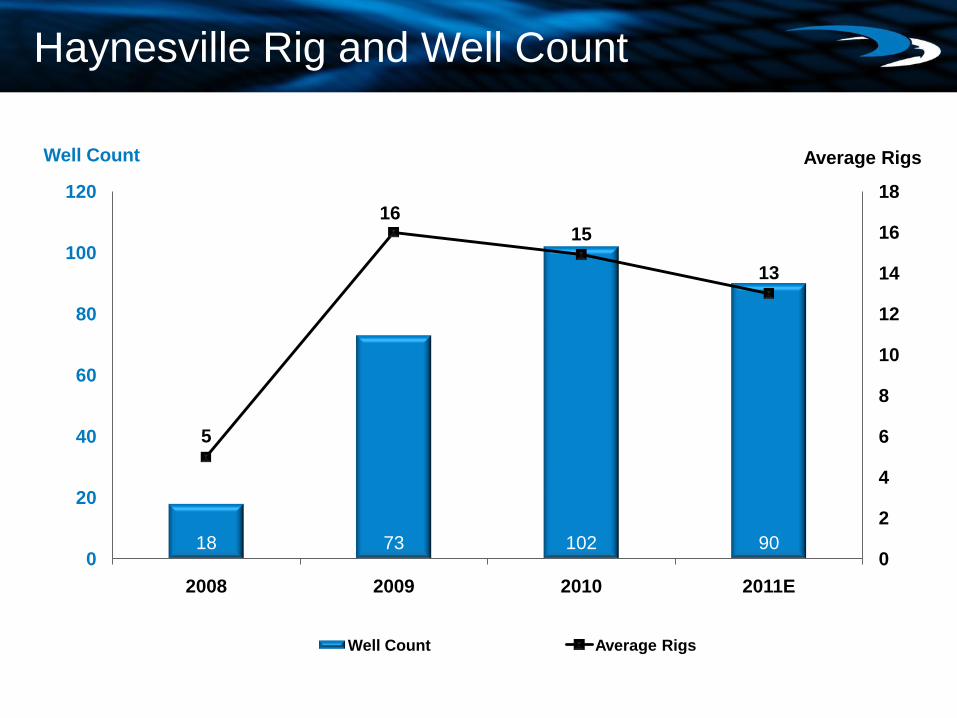
Haynesville Rig and Well Count
18 73 102 90
5
1615
13
0
2
4
6
8
10
12
14
16
18
0
20
40
60
80
100
120
2008 2009 2010 2011E
Average RigsWell Count
Well Count Average Rigs

Areas of Operation
• South East– TD: 18,500’
– TVD: 13,500’
– MW: 16.8 PPG
– Temp: 370 F
– 16 Bed Dips
• North West– TD: 16,000’
– TVD: 11,000’
– MW: <15 PPG
– Temp: 250 F
– 0 Dip6
5 m
iles
65 miles

Haynesville Quarterly Drilling Efficiencies
73
61 60
54 54 53
47
0
5
10
15
20
25
30
35
40
45
50
0
10
20
30
40
50
60
70
80
Q1 2009 Q2 2009 Q3 2009 Q4 2009 Q1 2010 Q2 2010 Q3 2010
ROPS-S Days
Days, Spud to Spud Horizontal ROP

Haynesville Well Construction
2008 Design 2010 DesignHOLE
SIZE
1,850'
13 ½”
9-7/8"
20" Conductor
7 5/8" 29.7# P-110 Intermediate Casing
6-3/4"
EOH: 16,500' MD
11,500' TVD
5000 VS
KOP
11,000
'
12.0°/100' BUR
11,500'
10,500'
4.5" 15.1# P-110 Production Casing
5.5" 23# P-110 Production Casing
8 -3/4”
10 3/4" Surface Casing
HOLE
SIZE
1,850'
12-¼”
8-¾”
16" Conductor
6-1/8"
EOH: 16,500' MD
11,500' TVD
5000 VS
KOP
10,700'
8.0°/100' BUR
11,500'
10,200
'
4.5" 15.1# P-110 Production Casing
7 " 26# P-110 Intermediate Casing
9 5/8" Surface Casing

2008 Well Design Hydraulics
9 5/8” Casing @ 1,800’
7” Casing @ 10,200’
0
1000
2000
3000
4000
5000
6000
7000
8000
9000
10000
11000
12000
13000
14000
15000
16000
17000
7 9 11 13 15 17 19
MD
(F
T)
Equivalent Bottom Hole Pressure (PPG)
Bottom Hole Pressure Vs Pore Pressure & Frac Gradient
Frac Gradient (PPG) Pore Pressure (PPG) 6 1/8" Hole X 3.5" DP Drilling ECD
Swab (3 min/stand) Surge (1 min/stand) Mud Weight
Swab
Drlg ECD
Surge
Small windowFor Int. Csg
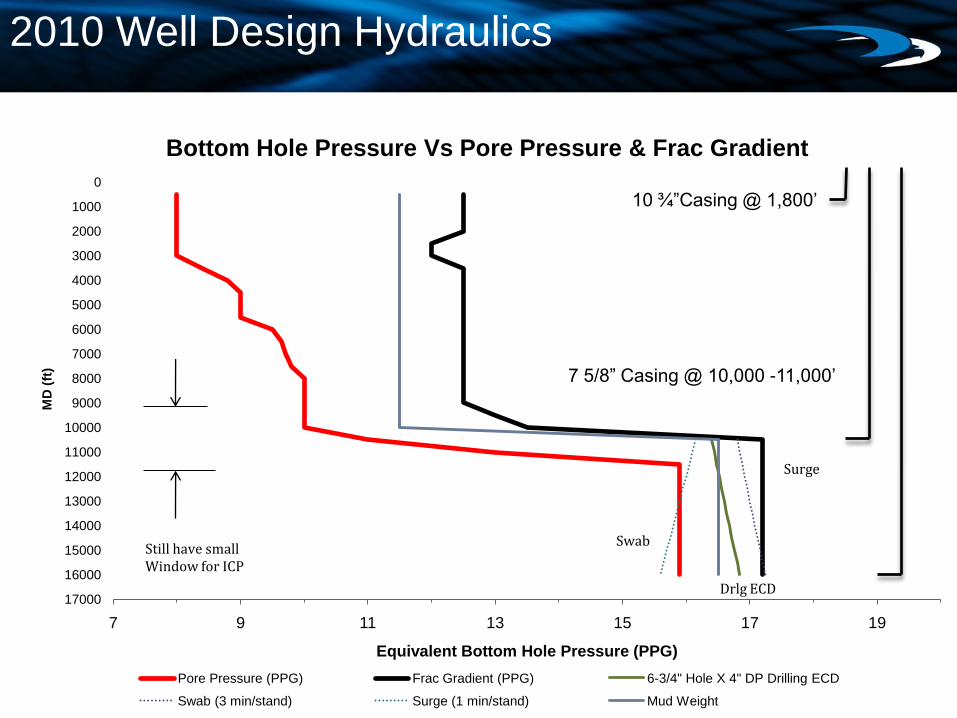
2010 Well Design Hydraulics
10 ¾”Casing @ 1,800’
7 5/8” Casing @ 10,000 -11,000’
0
1000
2000
3000
4000
5000
6000
7000
8000
9000
10000
11000
12000
13000
14000
15000
16000
17000
7 9 11 13 15 17 19
MD
(ft
)
Equivalent Bottom Hole Pressure (PPG)
Bottom Hole Pressure Vs Pore Pressure & Frac Gradient
Pore Pressure (PPG) Frac Gradient (PPG) 6-3/4" Hole X 4" DP Drilling ECD
Swab (3 min/stand) Surge (1 min/stand) Mud Weight
Still have smallWindow for ICP
Swab
Drlg ECD
Surge

Directional Tool Reliability
• Formed alliance with service companies– Goals: decrease NPT and increase run time
– Financial incentives for no failure runs (100 hrs)
• In house service reps were focused– Directional providers actively steering wells to high ROP zones
– More 1,000 ft days resulted in far fewer tool failures
– Maintenance procedures examined from inside
0%
1%
2%
3%
4%
5%
6%
7%
8%
Pre 2010 Jan-10 Feb-10 Mar-10 Apr-10 May-10 June-10 July-10 Aug-10 Sep-10 Oct-10
Downtime Percentage of Downtime
Percentage of Downtime

Surface Hole Improvements
• Increased size from 9-5/8” to 10-3/4”
• Pre-Set casing and conductor with turn-
key rig
• Batch set casing whenever possible
• Included in performance based incentives

Intermediate Hole Improvements
• Increased casing size from 7” to 7-5/8”
– Slowed intermediate hole
– Downsized from 9 7/8” to 8 ¾”
• 5” drill pipe instead of 4.5”
– Rack back 4” DP offline
• Bit/BHA optimization
– MSE / BHA modeling to optimize drilling parameters
– Standardized BHAs: no jars, minimal crossovers
• Eliminate back-builds
– Directional work very costly in large hole and hard abrasive
sands
– Out of unit locations

Production Hole Improvements
• Increased hole size from 6-1/8” to 6-3/4”
– Settled on 4”FH drill pipe
• Balanced hydraulics
• Greater hole cleaning efficiency
• Increased weight transfer / decreased buckling
• Curve Design
– Increased build rates
• Reduced length of curves
• Lay down 5” drill pipe while drilling curve
• Drill pipe oscillation software
• Rotate production casing in hole

Haynesville Rig Performance Through Time
• AC rigs have performed better
– Clear advantage in ROP
– Downtime reduced significantly
– Consistent across all contractors
• Advantages of AC rigs
– Able to eliminate spills through
design
– Quiet for urban drilling
environments
– Help attract and retain best
workers
• Implemented metrics program
– Measure and track key
performance indices
– Able to sort by rig, contractor,
superintendent, and engineer
292
375
409
431
0
10
20
30
40
50
60
70
80
0
50
100
150
200
250
300
350
400
450
500
Contractor 1 Contractor 2 Contractor 3 Contractor 4
DowntimeFeet Per Day Rig Performance
Feet Per Day Average Downtime
SCR AC Drive

Accountability Through Rig Metrics
• Connection Times – 6,000’ to 8,000’
– 14,000’ to 16,000’
• Trip Times – 10,000’ to 2,000’ inside int.
casing
• Land intermediate casing to run in hole with bit.
• Rig up production casing crew to 10,000 feet.
• Total Rig Downtime
• Rig Mobilization
0
2
4
6
8
10
12
14
16
18
20
CXN Time
Avg CXN Time 6-8, Q1 2010 Avg CXN Time 6-8, Q3 2010

Benchmarking in the Haynesville
173
349
349
360
410
427
442
449
470
485
488
554
0
50
100
150
200
250
300
350
400
450
500
550
600
650
700
Feet Per Day
Operator
19
Questions?