aakash capital limitedaakashcapital.com.np/uploads/reports/newsletter_(aug_2nd).pdf · stock...
TRANSCRIPT
AAKASH CAPITAL LIMITED
Weekly Newsletter from Aakash Capital Limited for the week ending on 19th July, 2019
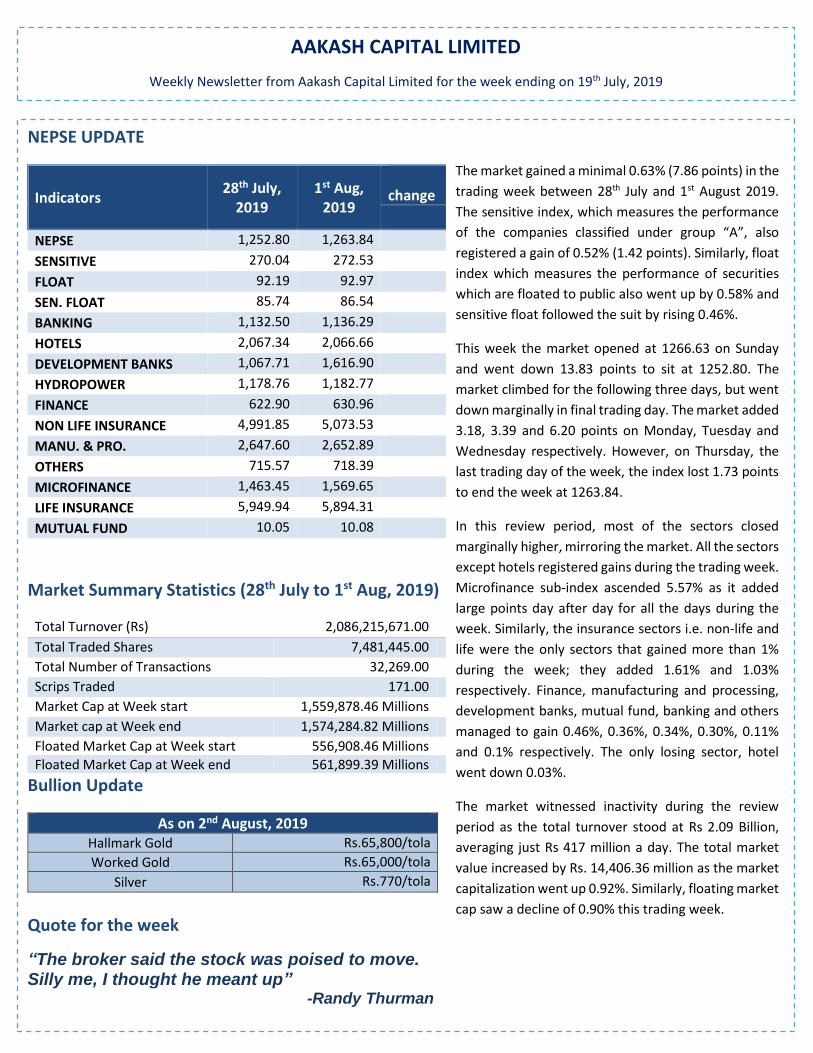
NEPSE UPDATE
Indicators 28th July,
2019 1st Aug,
2019
% change
NEPSE 1,252.80 1,263.84 0.63%
SENSITIVE 270.04 272.53 0.52%
FLOAT 92.19 92.97 0.58%
SEN. FLOAT 85.74 86.54 0.46%
BANKING 1,132.50 1,136.29 0.11%
HOTELS 2,067.34 2,066.66 -0.03%
DEVELOPMENT BANKS 1,067.71 1,616.90 0.34%
HYDROPOWER 1,178.76 1,182.77 0.21%
FINANCE 622.90 630.96 0.46%
NON LIFE INSURANCE 4,991.85 5,073.53 1.61%
MANU. & PRO. 2,647.60 2,652.89 0.36%
OTHERS 715.57 718.39 0.10%
MICROFINANCE 1,463.45 1,569.65 5.57%
LIFE INSURANCE 5,949.94 5,894.31 1.03%
MUTUAL FUND 10.05 10.08 0.30%
Market Summary Statistics (28th July to 1st Aug, 2019)
Total Turnover (Rs) 2,086,215,671.00
Total Traded Shares 7,481,445.00
Total Number of Transactions 32,269.00
Scrips Traded 171.00
Market Cap at Week start 1,559,878.46 Millions
Market cap at Week end 1,574,284.82 Millions
Floated Market Cap at Week start 556,908.46 Millions
Floated Market Cap at Week end 561,899.39 Millions
Bullion Update
As on 2nd August, 2019 Hallmark Gold Rs.65,800/tola
Worked Gold Rs.65,000/tola
Silver Rs.770/tola
Quote for the week
“The broker said the stock was poised to move. Silly me, I thought he meant up” -Randy Thurman
The market gained a minimal 0.63% (7.86 points) in the
trading week between 28th July and 1st August 2019.
The sensitive index, which measures the performance
of the companies classified under group “A”, also
registered a gain of 0.52% (1.42 points). Similarly, float
index which measures the performance of securities
which are floated to public also went up by 0.58% and
sensitive float followed the suit by rising 0.46%.
This week the market opened at 1266.63 on Sunday
and went down 13.83 points to sit at 1252.80. The
market climbed for the following three days, but went
down marginally in final trading day. The market added
3.18, 3.39 and 6.20 points on Monday, Tuesday and
Wednesday respectively. However, on Thursday, the
last trading day of the week, the index lost 1.73 points
to end the week at 1263.84.
In this review period, most of the sectors closed
marginally higher, mirroring the market. All the sectors
except hotels registered gains during the trading week.
Microfinance sub-index ascended 5.57% as it added
large points day after day for all the days during the
week. Similarly, the insurance sectors i.e. non-life and
life were the only sectors that gained more than 1%
during the week; they added 1.61% and 1.03%
respectively. Finance, manufacturing and processing,
development banks, mutual fund, banking and others
managed to gain 0.46%, 0.36%, 0.34%, 0.30%, 0.11%
and 0.1% respectively. The only losing sector, hotel
went down 0.03%.
The market witnessed inactivity during the review
period as the total turnover stood at Rs 2.09 Billion,
averaging just Rs 417 million a day. The total market
value increased by Rs. 14,406.36 million as the market
capitalization went up 0.92%. Similarly, floating market
cap saw a decline of 0.90% this trading week.
.
News Update
The Monetary Policy may not help stabilise interest rates, analysts say
The Monetary Policy 2019-20 recently unveiled by Nepal Rastra Bank might not help stabilize interest rates in the long run as it
has failed to introduce new measures and only focused on making minor changes in the existing policy tools…Read More
Nepalese are consuming 38 percent more electricity than two years ago
Two years ago, a Nepali household used to consume 117 kilowatt-hours of electricity every year. Now, each household utilizes
245 kilowatt-hours per year, 38 percent more than in the fiscal year 2017-18, a recent study shows. The surge in electricity
demand is largely driven by a reliable supply of power and increased use of gadgets and electrical appliances indicating a growth
in the purchasing power of Nepali households…Read More
Alarm bells are ringing as agro imports bill reaches Rs220 billion
Nepal’s agricultural goods import bill ballooned to an all-time high of Rs220 billion in the last fiscal year, ringing the alarm bell
loudly that the country is progressively becoming a net importer of farm products. The latest statistics of the Department of
Customs show that Nepal imported farm products worth Rs220 billion in the last fiscal year that ended July 16. The share of agro
products in the total import bill has swelled to 15.51 percent…Read More
175,909 unemployed benefited from PM Employment Program
The government has provided employment to nearly 175,909 people through 6,864 projects across the country run by various
local units under the Prime Minister Employment Program in FY 2018/19. According to the Ministry of Labor, Employment and
Social Security (MoLESS), these projects provided employment for 13 days per person in average…Read More
Market Announcements
United Insurance Company Nepal Limited is issuing it's 1:2.4 ratio 72,57,600 units right share to its shareholders from
3rd Bhadra to 6th Ashwin, 2076.
Nepal Insurance Company Limited has announced its 70th AGM going to be held on 8th Bhadra, 2076.
Neco Insurance Limited has announced its 23rd AGM going to be held on 14th Bhadra, 2076.
Reliance Life Insurance Limited has announced its 2nd AGM going to be held on 31st Shrawan, 2076.
Prudential Insurance Company Limited has announced its 17th AGM going to be held on 1st Bhadra, 2076.
Terhathum Power Company Limited has announced its AGM going to be held on 32nd Shrawan, 2076.
Himalayan General Insurance Company Limited proclaim its 25th AGM going to be held on Ashwin 06, 2076.
NMB Bank Limited has announced its Special General Meeting going to be held on 28th Shrawan, 2076.
Gurans Life Insurance Company Limited has allotted its 90,571 unit promoter shares in auction to the general public on
15th Shrawan, 2076 and refunding money to non-allottee investors from 19th Shrawan, 2076.
Janautthan Samudayic Laghubitta Bittiya Sanstha Limited is closing it's 1:1 ratio 2,88,000 units right share to its
shareholders from 15th Shrawan, 2076.
NMB Capital Limited has issued 120 million units of Rs 10 face value each mutual fund scheme worth Rs 1.20 billion
(NMB 50) to the general public from 13th Shrawan, 2076.
NIC Asia Capital Limited has extended the date of its "NIC ASIA Balance Fund " (10,62,50,000 units @ Rs.10 per unit) to
the general public till (Bhadra 05, 2076.)
Deva Bikas Bank Limited has urged its shareholders to pay tax amount for 5.5% bonus share distribution purpose.
NMB Sulav Investment Fund-1 proposed 15% dividend.
NMB Hybrid Fund L-1 propose 10% dividend.

NEPSE - TECHNICAL ANALYSIS
The Nepalese stock market declined continuously after it made its top on 27th of July, 2016. Currently, the index is in at support
zone as seen in the weekly chart. The market had shown short term bull after Nepali New Year. This week the market closed at
1263.84 forming a red candle on last trading day. This week NEPSE opened at 1266.63 and formed a red candle by closing at
1252.80, losing 13.83 points during the day. The transaction turnover decreased from Rs.550.53 million of previous week ending
to Rs.590.58 million at the end of this week. This week transaction was not that supportive as the market was able to cross the
turnover of Rs.500 million only in the last trading day. As of weekly line chart the short term resistance might be at around 1273.
Taking the Fibonacci retracement from 1100 to 1316, the 0.382 Fibonacci ratio lies at 1235, which indicates strong psychological
support.
Technical Indicators
Indicators Value Signal
Support (S1) 1252 -
Resistance (R1) 1268 -
Relative Strength Index (RSI) 49.86 Moderate zone
Moving Average Convergence Divergence (MACD) -0.1398 Bearish
5-Day Exponential Moving Average (EMA) 1259.51 Bullish
20-Day Exponential Moving Average (EMA) 1261.52 Bullish
180-Day Exponential Moving Average (EMA) 1206.66 Bullish

Relative Strength Index (RSI) Analysis
RSI is a moment indicator that measures the magnitude of recent price changes to evaluate overbought or oversold conditions
in the price of a stock. RSI is typically used on a 14-day time frame, measured on a scale from 0 to 100, where a value above 70
represents overbought and below 30 represents oversold condition.
Current RSI value of NEPSE is 49.86 which indicates that the market is at moderate zone. There is no any short term divergence
as fall in price and RSI chart is similar.
Moving Average Convergence Divergence (MACD)
MACD is a momentum oscillator formed by using two different moving averages, typically a 26 day EMA and 12 day EMA, which
provides specific buy/sell signal. When the MACD line crosses signal line from above, it is considered bearish, indicating a sell
signal and vice-versa.
Currently MACD and signal line is at -0.13 and 0.61 respectively. MACD has already crossed the signal line and below the base
line line which indicates the negative signal for the market. MACD has shown bearish signal for the overall market.
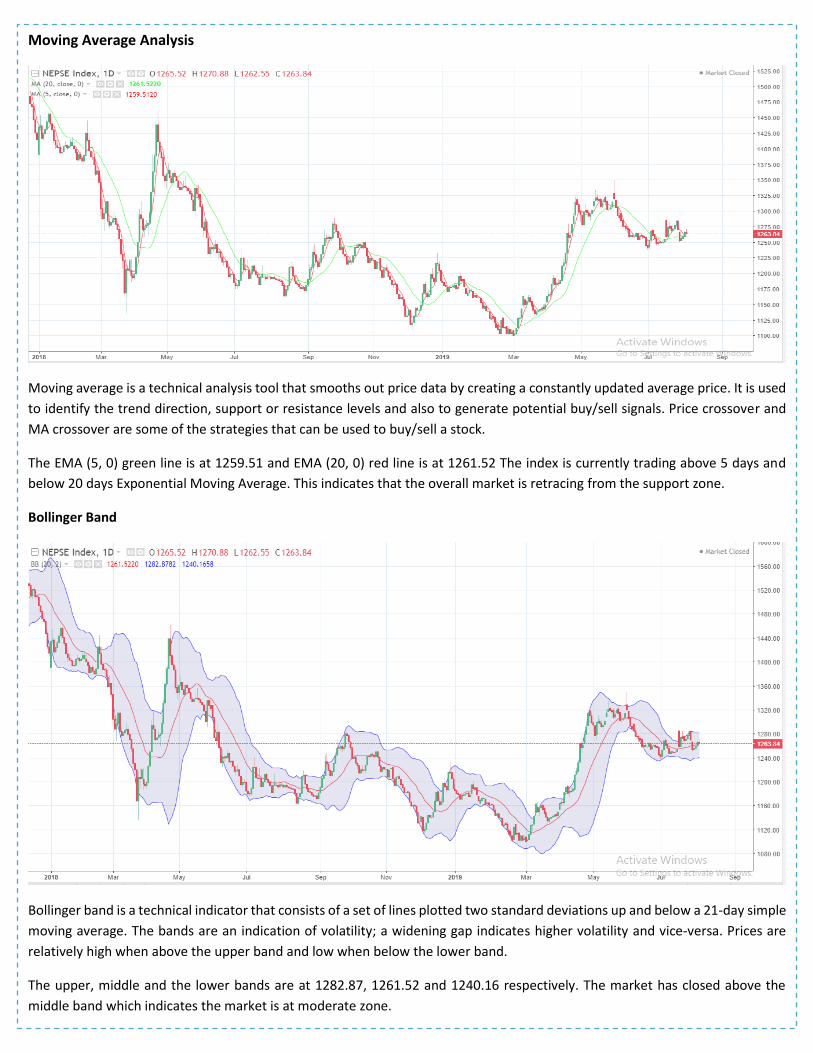
Moving Average Analysis
Moving average is a technical analysis tool that smooths out price data by creating a constantly updated average price. It is used
to identify the trend direction, support or resistance levels and also to generate potential buy/sell signals. Price crossover and
MA crossover are some of the strategies that can be used to buy/sell a stock.
The EMA (5, 0) green line is at 1259.51 and EMA (20, 0) red line is at 1261.52 The index is currently trading above 5 days and
below 20 days Exponential Moving Average. This indicates that the overall market is retracing from the support zone.
Bollinger Band
Bollinger band is a technical indicator that consists of a set of lines plotted two standard deviations up and below a 21-day simple
moving average. The bands are an indication of volatility; a widening gap indicates higher volatility and vice-versa. Prices are
relatively high when above the upper band and low when below the lower band.
The upper, middle and the lower bands are at 1282.87, 1261.52 and 1240.16 respectively. The market has closed above the
middle band which indicates the market is at moderate zone.
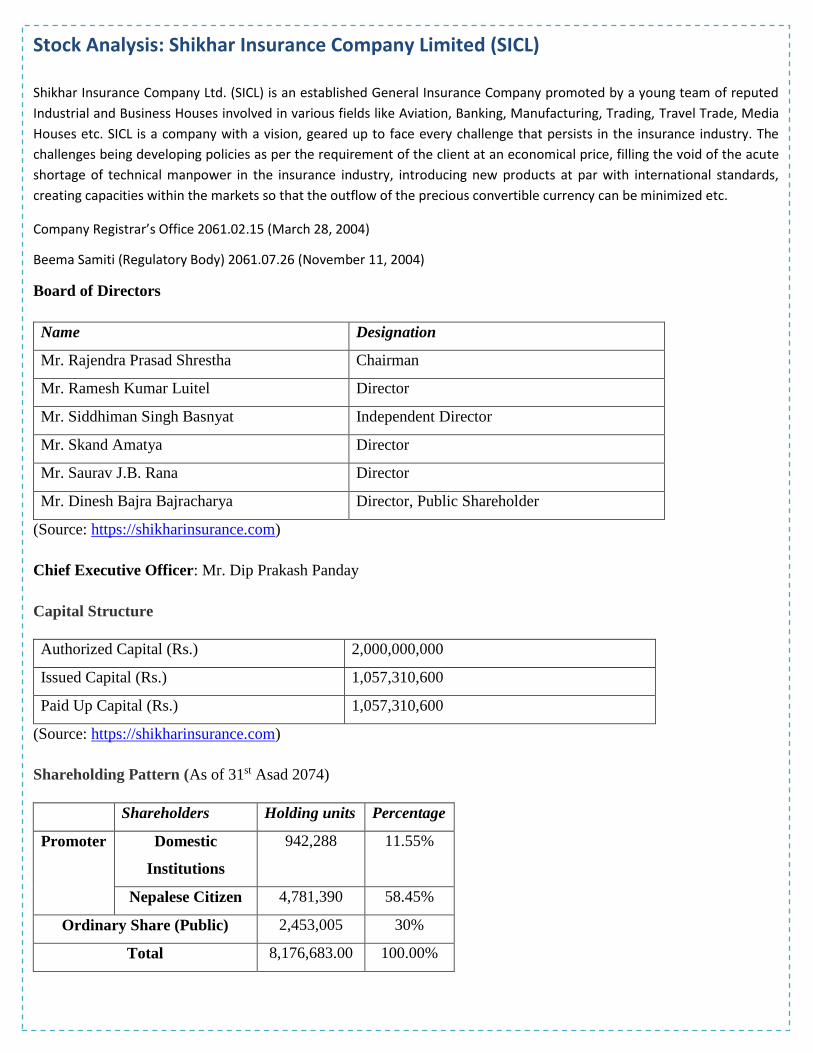
Stock Analysis: Shikhar Insurance Company Limited (SICL)
Shikhar Insurance Company Ltd. (SICL) is an established General Insurance Company promoted by a young team of reputed
Industrial and Business Houses involved in various fields like Aviation, Banking, Manufacturing, Trading, Travel Trade, Media
Houses etc. SICL is a company with a vision, geared up to face every challenge that persists in the insurance industry. The
challenges being developing policies as per the requirement of the client at an economical price, filling the void of the acute
shortage of technical manpower in the insurance industry, introducing new products at par with international standards,
creating capacities within the markets so that the outflow of the precious convertible currency can be minimized etc.
Company Registrar’s Office 2061.02.15 (March 28, 2004)
Beema Samiti (Regulatory Body) 2061.07.26 (November 11, 2004)
Board of Directors
Name Designation
Mr. Rajendra Prasad Shrestha Chairman
Mr. Ramesh Kumar Luitel Director
Mr. Siddhiman Singh Basnyat Independent Director
Mr. Skand Amatya Director
Mr. Saurav J.B. Rana Director
Mr. Dinesh Bajra Bajracharya Director, Public Shareholder
(Source: https://shikharinsurance.com)
Chief Executive Officer: Mr. Dip Prakash Panday
Capital Structure
Authorized Capital (Rs.) 2,000,000,000
Issued Capital (Rs.) 1,057,310,600
Paid Up Capital (Rs.) 1,057,310,600
(Source: https://shikharinsurance.com)
Shareholding Pattern (As of 31st Asad 2074)
Shareholders Holding units Percentage
Promoter Domestic
Institutions
942,288 11.55%
Nepalese Citizen 4,781,390 58.45%
Ordinary Share (Public) 2,453,005 30%
Total 8,176,683.00 100.00%
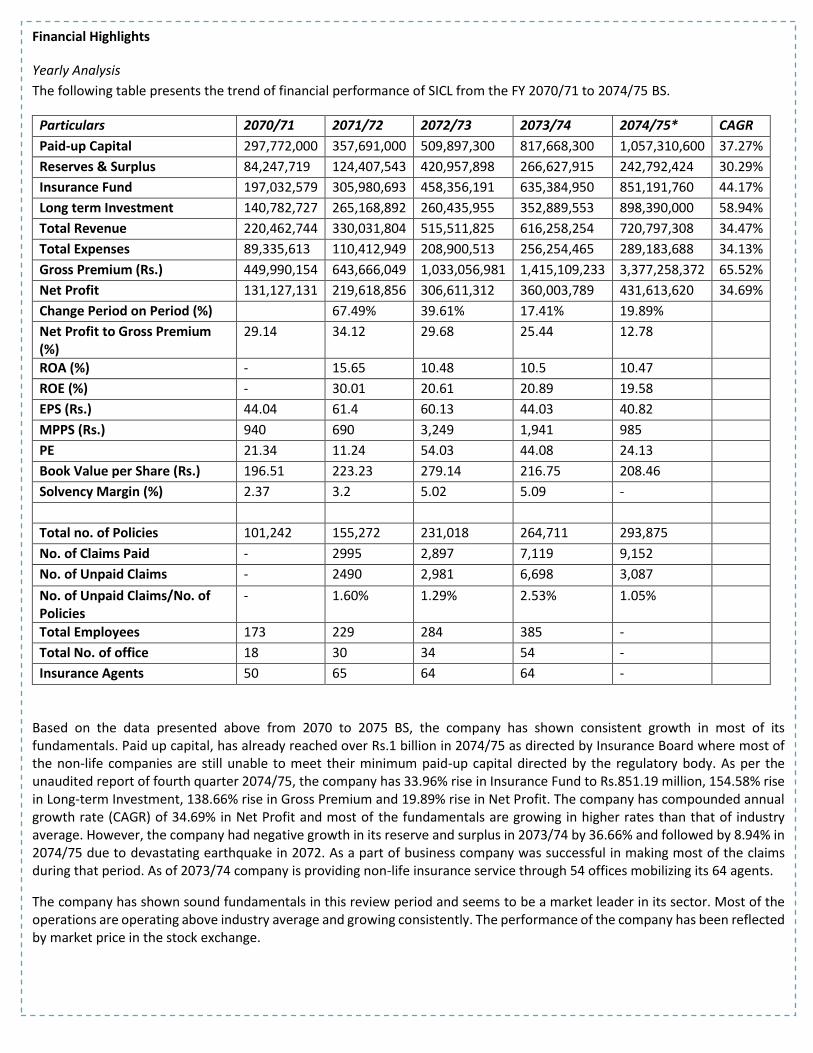
Financial Highlights
Yearly Analysis
The following table presents the trend of financial performance of SICL from the FY 2070/71 to 2074/75 BS.
Particulars 2070/71 2071/72 2072/73 2073/74 2074/75* CAGR
Paid-up Capital 297,772,000 357,691,000 509,897,300 817,668,300 1,057,310,600 37.27%
Reserves & Surplus 84,247,719 124,407,543 420,957,898 266,627,915 242,792,424 30.29%
Insurance Fund 197,032,579 305,980,693 458,356,191 635,384,950 851,191,760 44.17%
Long term Investment 140,782,727 265,168,892 260,435,955 352,889,553 898,390,000 58.94%
Total Revenue 220,462,744 330,031,804 515,511,825 616,258,254 720,797,308 34.47%
Total Expenses 89,335,613 110,412,949 208,900,513 256,254,465 289,183,688 34.13%
Gross Premium (Rs.) 449,990,154 643,666,049 1,033,056,981 1,415,109,233 3,377,258,372 65.52%
Net Profit 131,127,131 219,618,856 306,611,312 360,003,789 431,613,620 34.69%
Change Period on Period (%)
67.49% 39.61% 17.41% 19.89%
Net Profit to Gross Premium (%)
29.14 34.12 29.68 25.44 12.78
ROA (%) - 15.65 10.48 10.5 10.47
ROE (%) - 30.01 20.61 20.89 19.58
EPS (Rs.) 44.04 61.4 60.13 44.03 40.82
MPPS (Rs.) 940 690 3,249 1,941 985
PE 21.34 11.24 54.03 44.08 24.13
Book Value per Share (Rs.) 196.51 223.23 279.14 216.75 208.46
Solvency Margin (%) 2.37 3.2 5.02 5.09 -
Total no. of Policies 101,242 155,272 231,018 264,711 293,875
No. of Claims Paid - 2995 2,897 7,119 9,152
No. of Unpaid Claims - 2490 2,981 6,698 3,087
No. of Unpaid Claims/No. of Policies
- 1.60% 1.29% 2.53% 1.05%
Total Employees 173 229 284 385 -
Total No. of office 18 30 34 54 -
Insurance Agents 50 65 64 64 -
Based on the data presented above from 2070 to 2075 BS, the company has shown consistent growth in most of its fundamentals. Paid up capital, has already reached over Rs.1 billion in 2074/75 as directed by Insurance Board where most of the non-life companies are still unable to meet their minimum paid-up capital directed by the regulatory body. As per the unaudited report of fourth quarter 2074/75, the company has 33.96% rise in Insurance Fund to Rs.851.19 million, 154.58% rise in Long-term Investment, 138.66% rise in Gross Premium and 19.89% rise in Net Profit. The company has compounded annual growth rate (CAGR) of 34.69% in Net Profit and most of the fundamentals are growing in higher rates than that of industry average. However, the company had negative growth in its reserve and surplus in 2073/74 by 36.66% and followed by 8.94% in 2074/75 due to devastating earthquake in 2072. As a part of business company was successful in making most of the claims during that period. As of 2073/74 company is providing non-life insurance service through 54 offices mobilizing its 64 agents.
The company has shown sound fundamentals in this review period and seems to be a market leader in its sector. Most of the operations are operating above industry average and growing consistently. The performance of the company has been reflected by market price in the stock exchange.

Snapshot of performance
29.78 35.7750.99
81.77105.73
8.42 12.44
42.1026.66 24.28
0.00
50.00
100.00
150.00
2070/71 2071/72 2072/73 2073/74 2074/75*
Paid-up Capital & Reserves and Surplus
Paid-up Capital (Rs.crores) Reserves & Surplus (Rs.crores)
19.7030.60
45.84
63.54
85.12
0.00
20.00
40.00
60.00
80.00
100.00
2070/71 2071/72 2072/73 2073/74 2074/75*
Insurance Fund (Rs.crores)
8.93 11.04
20.8925.63
28.92
13.11
21.96
30.6636.00
43.16
0.00
10.00
20.00
30.00
40.00
50.00
2070/71 2071/72 2072/73 2073/74 2074/75*
Expenses vs Net Profit
Total Expenses (Rs.crores) Net Profit (Rs.crores)
44.04 61.4 60.13 44.03 40.82
940690
3,249
1,941
985
0
500
1000
1500
2000
2500
3000
3500
2070/71 2071/72 2072/73 2073/74 2074/75*
EPS vs MPPS
EPS (Rs.) MPPS (Rs.)
155,272
231,018264,711
293,875
2490 2,981 6,698 3,0870
100,000
200,000
300,000
400,000
2071/72 2072/73 2073/74 2074/75*
Total no. of policies vs No. of unpaid claims
Total no. of Policies 10,242 No. of Unpaid Claims -
21.05%25.26%
63.15%
30.53%
0.00%
10.00%
20.00%
30.00%
40.00%
50.00%
60.00%
70.00%
2070/71 2071/72 2072/73 2073/74
Dividend (%)

Quarter to Quarter Comparison
Particulars Q3 2074/75
Q3 2075/76
Change (%)
Paid-up Capital (Rs.000) 1,057,310 1,057,311 0.00%
Reserves & Surplus (Rs.000) 182,039 410,914 125.73%
Insurance Fund (Rs.000) 790,438 1,019,313 28.96%
Gross Premium (Rs.000) 2,459,270 2,500,236 1.67%
Net Premium (Rs.000) 1,228,860 1,243,623 1.20%
Total Expenses (Rs.000) 2,061,130 2,368,818 14.93%
Net Profit (Rs.000) 310,106 336,243 8.43%
Net Premium to Gross Premium (%) 49.97% 49.74% -0.46%
Net Profit to Gross Premium (%) 12.61% 13.45% 6.65%
EPS (Rs.) 39.11 42.40 8.41%
MPS (Rs.) 1,013 874 -13.73%
P/E ratio 25.90 20.61 -20.42%
Book Value per Share (Rs.) 196.97 240.27 21.98%
ROE (%) 19.85% 17.65% -11.08%
ROA (%) 10.06% 9.76% -2.98%
As per Q3 of fiscal year 2075/76, the company has shown outstanding growth in some of its fundamentals. Reserves and surplus has reached to Rs.410.91 million which is 125% higher than that of the corresponding quarter of 2074/75. Similarly, it has shown rise of 28% in Insurance Fund, 8.43% rise in Net income. However, gross premium has increased by just 1.67% which might affect in the long term profit growth. The market price of the company has fallen by 13.73% to Rs.874 per share with P/E ratio of 20.61%. which is below industry P/E indicating that the share price of the company is undervalued as per relative valuation.
Dividend History
Year Dividend
Total
%
Cash % Bonus %
2070/71 1.05% 20% 21.05%
2071/72 1.26% 24% 25.26%
2072/73 3.15% 60% 63.15%
2073/74 1.53% 29% 30.53%
The bank is providing consistent dividend either in the form of cash or bonus. Looking at the history of dividend distribution,
the bank seems to be highly focused on distributing bonus share.
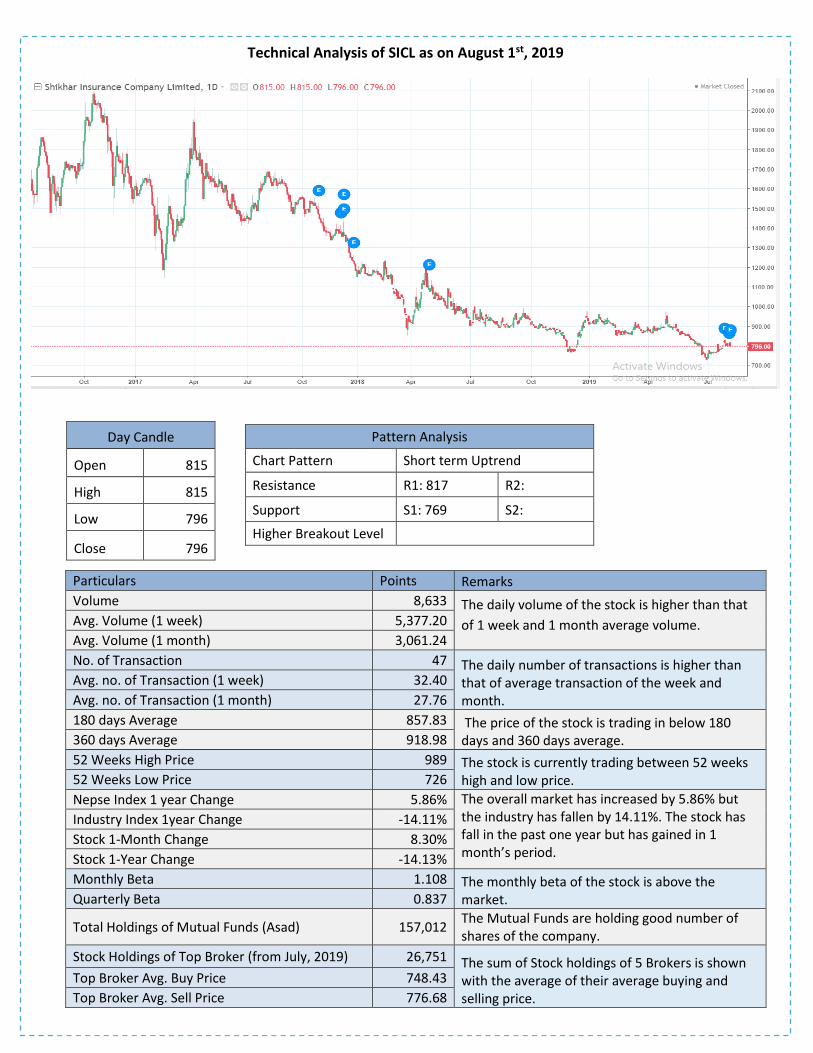
Technical Analysis of SICL as on August 1st, 2019
Day Candle
Open 815
High 815
Low 796
Close 796
Pattern Analysis
Chart Pattern Short term Uptrend
Resistance R1: 817 R2:
Support S1: 769 S2:
Higher Breakout Level
Particulars Points Remarks
Volume 8,633 The daily volume of the stock is higher than that
of 1 week and 1 month average volume. Avg. Volume (1 week) 5,377.20
Avg. Volume (1 month) 3,061.24
No. of Transaction 47 The daily number of transactions is higher than that of average transaction of the week and month.
Avg. no. of Transaction (1 week) 32.40
Avg. no. of Transaction (1 month) 27.76
180 days Average 857.83 The price of the stock is trading in below 180 days and 360 days average. 360 days Average 918.98
52 Weeks High Price 989 The stock is currently trading between 52 weeks high and low price. 52 Weeks Low Price 726
Nepse Index 1 year Change 5.86% The overall market has increased by 5.86% but the industry has fallen by 14.11%. The stock has fall in the past one year but has gained in 1 month’s period.
Industry Index 1year Change -14.11%
Stock 1-Month Change 8.30%
Stock 1-Year Change -14.13%
Monthly Beta 1.108 The monthly beta of the stock is above the market. Quarterly Beta 0.837
Total Holdings of Mutual Funds (Asad) 157,012 The Mutual Funds are holding good number of shares of the company.
Stock Holdings of Top Broker (from July, 2019) 26,751 The sum of Stock holdings of 5 Brokers is shown with the average of their average buying and selling price.
Top Broker Avg. Buy Price 748.43
Top Broker Avg. Sell Price 776.68
Concluding Remarks
Insurance business contributing 2.04% to the domestic GDP is considered as a forced selling business in Nepal. Due to its low
market penetration of just 18%, this industry is facing a lot of criticism as compared to other sector. Most of the people are
unaware about insurance and even educated people are reluctant to buy insurance policy. Most of the people underestimate
the return of insurance and lacks knowledge how insurance protects an individual financially. If companies can convince their
customers about the risk and reward of their policies, they can do better in this emerging economy.
Being a leader in non-life insurance business Shikhar Insurance is successful in creating value for its customers. It has sound
fundamentals and seems to be a blue chip company operating above the industry average which indicates the benefit of
competitive advantage. There seems huge vacuum in this sector and this company can fill that gap through its expansion in
rural parts with more affordable policies and efficient operation.
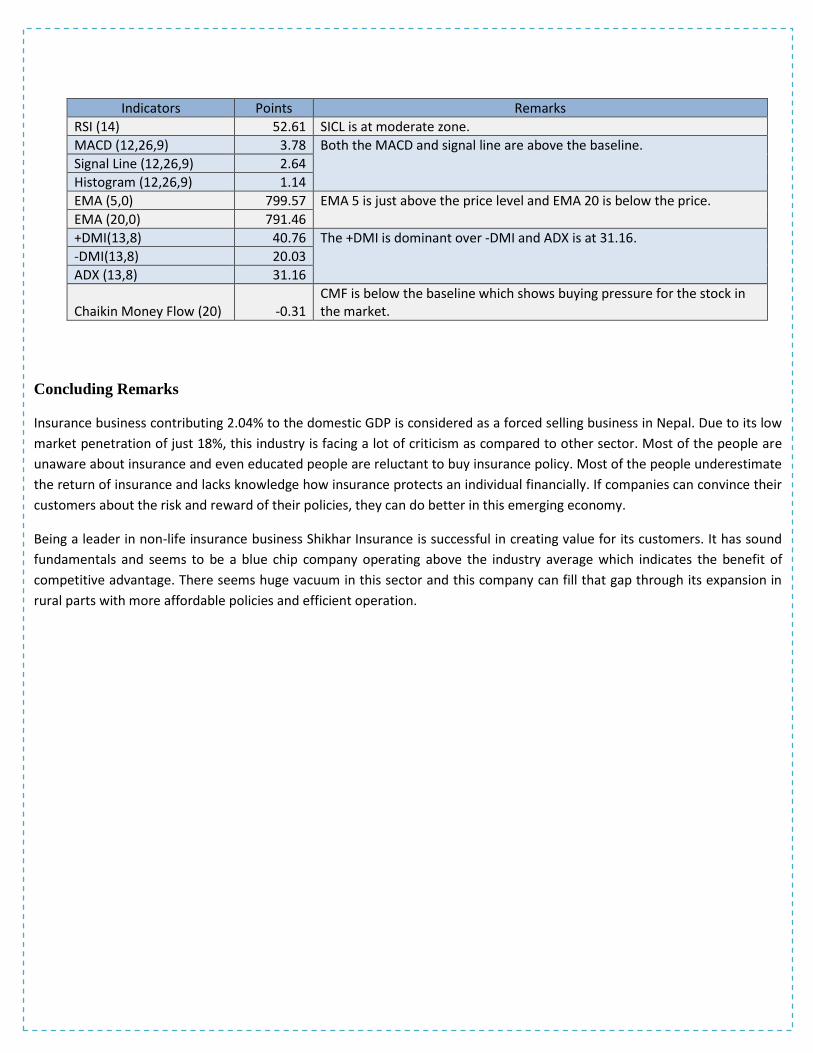
Indicators Points Remarks
RSI (14) 52.61 SICL is at moderate zone.
MACD (12,26,9) 3.78 Both the MACD and signal line are above the baseline.
Signal Line (12,26,9) 2.64
Histogram (12,26,9) 1.14
EMA (5,0) 799.57 EMA 5 is just above the price level and EMA 20 is below the price.
EMA (20,0) 791.46
+DMI(13,8) 40.76 The +DMI is dominant over -DMI and ADX is at 31.16.
-DMI(13,8) 20.03
ADX (13,8) 31.16
Chaikin Money Flow (20) -0.31 CMF is below the baseline which shows buying pressure for the stock in the market.

Investing Solutions
Investing solutions enable individuals to realize their aspirations by making their money work for them.
Growing our hard-earned money should be simple and accessible to everybody, so that each of us is able to live the life we
desire. With this objective, we ensure we gain an in-depth understanding of each individual’s aspirations and ambitions so that
we are able to recommend the right investment solution. We encourage people to link their investments to specific life goals so
that they are able to realize these goals meticulously and with ease.
Portfolio Management Services
Tailor made solutions to meet your investing needs
Across the world people are turning to specialists Portfolio Management Services for managing their equity investments.
Portfolio Management Services is the Portfolio Management division of Aakash Capital that helps you access the equity market
in Nepal.
Portfolio Management Service brings you a whole range of investment products,
from which your portfolio manager puts together your optimal portfolio. We take
into account your financial goals, time horizon, risk appetite and investment
outlook.
Choose a solution that fits your needs
Disclaimer and important information: This document has been prepared by Aakash Capital Limited for information and
illustration purpose only. The information provided in this document is subject to change. While this information has been
obtained from sources believed to be reliable, Aakash Capital Limited is not liable for erroneous information obtained from the
sources. Aakash Capital Limited, its directors and employees are not liable/responsible for any direct, indirect or consequential
loss arising from use of this document or its contents. Past performance is no indication of future results. Aakash Capital is
regulated by Securities Board of Nepal. This document may not be reproduced, distributed or published by any person for any
purpose without Aakash Capital Limited’s prior written consent.
Aakash Capital Limited
4th Floor, Trade Tower, Thapathali, Kathmandu, Nepal
Tel: 01-5111145
Email: [email protected]
Website: www.aakashcapital.com.np
Facebook: www.facebook.com/AakashCap