aalborg universitet danwec - empirical analysis of … · 1 danwec - empirical analysis of the wave...
TRANSCRIPT

Aalborg Universitet
DANWEC - Empirical Analysis of the Wave Climate at the Danish Wave Energy Centre
Tetu, Amélie; Nielsen, Kim; Kofoed, Jens Peter
Publication date:2016
Document VersionPublisher's PDF, also known as Version of record
Link to publication from Aalborg University
Citation for published version (APA):Tetu, A., Nielsen, K., & Kofoed, J. P. (2016). DANWEC - Empirical Analysis of the Wave Climate at the DanishWave Energy Centre. Paper presented at CORE 2016 - Second International Conference on OffshoreRenewable Energy, Glasgow, United Kingdom.
General rightsCopyright and moral rights for the publications made accessible in the public portal are retained by the authors and/or other copyright ownersand it is a condition of accessing publications that users recognise and abide by the legal requirements associated with these rights.
? Users may download and print one copy of any publication from the public portal for the purpose of private study or research. ? You may not further distribute the material or use it for any profit-making activity or commercial gain ? You may freely distribute the URL identifying the publication in the public portal ?
Take down policyIf you believe that this document breaches copyright please contact us at [email protected] providing details, and we will remove access tothe work immediately and investigate your claim.
Downloaded from vbn.aau.dk on: May 01, 2017

1
DANWEC - EMPIRICAL ANALYSIS OF THE WAVE CLIMATE AT THE DANISH WAVE ENERGY CENTRE Amélie Têtu, Kim Nielsen & Jens Peter Kofoed, Aalborg University, DK
ABSTRACT The wave energy sector is at a development stage where real-sea testing is imperative. Dedicated test sites for wave energy converters (WECs) [1-6] are being established around Europe to facilitate sea trials. The Danish Wave Energy Centre (DanWEC) test site at Hanstholm has been the preferred test site for several Danish WECs. In 2013 DanWEC has received Greenlab funding from the EUDP programme to establish the site including more detailed information on its wave climate and bathymetry and seabed conditions. The project “Resource Assessment, Forecasts and WECs O&M strategies at DanWEC and beyond” has been initiated to deliver detailed information of the environmental conditions of DanWEC and to review implementation of O&M procedures, which will ultimately improve WEC’s operation and reduce WEC’s costs. The work so far has been concentrated on establishing the base for gaining detailed information on the DanWEC wave and current climate. In this paper an analysis of the wave climate of the DanWEC test site will be presented. This includes a description of the data quality control and filtration for analysis and the observations and data analysis. Relevant characteristics of the test site, as for example scatter diagram (Hm0, Tz) will be analysed and wave power distribution given. Based on the data gathered so far a preliminary analysis of extreme events at the DanWEC test site will be presented. Deployment, control strategies and O&M strategies of wave energy converters are sensitive to the wave and current conditions and weather windows to perform the suitable maintenance and corrections during an experimental phase in real ocean conditions are essential information also in the planning phase of the experiments.
1. INTRODUCTION
Test sites have been established throughout Europe over the past couple of decades for testing and demonstration of WEC prototypes in real sea as depicted in figure 1 below.
From the figure it is clear to see that the location of the different test sites will provide very different test conditions. Some of the most exposed sites correspond well to the conditions the WECs will be facing at full scale while others can be seen as scaled sites.
Sites like BIMEP and the Pilot Zone sites are dominated by significantly longer waves compared to tests sites with less swell. This has to be carefully considered when designing the WEC prototypes for these locations, and a good understanding of the wave climate at each site will determine the success of the sea trail.
This study will first introduce the on-going project “Resource Assessment, Forecasts and WECs O&M strategies at DanWEC and beyond”.
Figure 1: Wave energy test sites throughout Europe [8].
Table 1: The summary data from different test sites presented in [11]
Country Site Power Depth Hs max kW/m m M UK EMEC 21 50 15 UK Wave Hub 17 50-65 14,4 PT Ocean Plug 25 30-90 15,5 SP Bimep 21 50-90 11,4 DK DanWEC 6 20-30 6,5 DK Nissum B 0,2 3-5 1,2 IE Galway Bay 2,4 20-25 5 AU Port Kembla 6,7 6 7

2
2. THE DANWEC TEST SITE DanWEC test site is situated in Hanstholm, on the North-West coast of mainland Denmark, in the Danish part of the North Sea. The data acquisition network of the test site comprises three buoys, as summarised in Table 2 and depicted in figure 2. The non-directional buoy ‘Buoy I’ has been installed in 1998 and has provided data since then [7]. Before 1998 a similar older version of a wave rider buoy was placed outside the harbour and paper records of wave data over the period 1979 – 1988 was analyzed in relation to the first Wave Power experiments by DWP in 1989 [7]. The two DanWEC directional buoys have been installed in March 2015 and have been providing new information on the wave climate at this location, including insight on the directionality of the waves, the wave spectra and current characteristics. Table 2: Description of the buoys for the DanWEC test Coordinates
(Lat o, Lon o) Water Depth [m]
Model
Buoy I (57.1171, 8.5173)
17.5 Datawell Mark II (non directional)
Buoy II (57.1171, 8.5173)
27.5 Datawell Mark IV (directional wave and current)
Buoy III (57.1171, 8.5173)
24.6 Datawell Mark IV (directional wave and current)
The sensor network is depicted in Figure 1. It consists of one Datawell Mark II non directional buoy, placed outside Hantsholm’s harbour, and two Datawell DWR4 directional buoys.
2.1 WATER DEPTH AND SEABED CONDITIONS The water depth in the test site varies from 15 meter closest to the coast to about 25 meter at the deepest as shown on figure 3. In general the seabed is covered with sand and silt, however at some locations this cover is washed away and the chalk is exposed. DanWEC has carried out a geotechnical survey of the test area which defines the water depth variation – as well as the typical variation of the sediments. This
information is made available for developers that enter a testing agreement with DanWEC.
Figure 2: DanWEC network sensor situated on the north-west coast of mainland Denmark.
Figure 3: The bathymetry of the DanWEC test site at Hanstholm 2.2 MEASUREMENTS Since 2015 DanWEC has been measuring data concerning the waves, currents, wind and water level at the site. DanWEC owns two directional wave rider buoys one is shown on figure 4. Data measurements include directional wave characteristic as well as the current speed and direction. In addition measurements are carried out by the Harbour. An anemometer is providing wind measurements. Water level, mean wind speed, wind direction, wind gust, pressure and temperature are average over periods of 10 minutes [7].

3
Figure 4 Picture of one of Danwec’s directional wave rider.
The two directional buoys are situated at a distance of approximately 3 km from the shore and are equipped with accelerometers providing displacements over time after proper filtering and double integration. The accelerometer measuring the vertical displacement is placed on a gravity-stabilized platform, decoupling the movement of the buoy from the measurement of the wave height through vertical acceleration. The directional buoys are also equipped with three acoustic current transducers placed 120o laterally apart. They measure the Doppler shift of reflected 2 MHz pings at roughly 1 m water depth. All directions are measured relative to the north magnetic pole as both systems are equipped with a magnetic compass.
The directional buoys measure the north, west and vertical displacements at a rate of 2.56 Hz and the raw data is transferred to a computer onshore through a radio link signal. The current measurement is taken every 10 minutes and is sent by radio link signal to the same computer onshore. The raw data is processed with Datawell Waves4 software suite (ref Datawell 2014). Fourier analysis is used to obtain the spectral parameters from the horizontal and vertical displacements over a period of 30 minutes.
The wave data from the non-directional buoy is transmitted to shore, via radio link, to Hanstholm’s harbour office. Time domain parameters are calculated by Datawell waves21 software and further processed to obtain the frequency domain parameters. More details are presented in ref [7].
Figure 5 present the time series of wave measurements from the three buoys over the period November 2015 – December 2015. It can be seen that the Buoy 1 in general measure the lowest value while Buoy III measures the largest values. The difference in values is during storms up to 1.5 m (i.e. on the 30th of December Buoy I measure Hs = 5 m while Buoy II and III measure Hs = 6.5 m and Hs = 7.0 m. This is a significant difference – a few days later Buoy III measure Hs = 5 meter while Buoy I and Buoy II measure Hs lower between 2 and 3 m.
Figure 5: Time series showing the difference in wave height across the sensor network at DanWEC. 3. WAVE CONDITIONS IN HANSTHOLM The difference in wave height measurements are expected to be real and not due to a calibration error. Under this assumption it is shown in figure 6 that the resource is larger at the location of Buoy III, SW of the harbour compared to the resource at the location of Buoy I and Buoy II and the more energetic the sea conditions, the bigger the difference.

4
Figure 6: Distribution of the flux per unit width across the sensor network at DanWEC from April to December 2015.
The direction from where the wave power is coming is shown on figure 7 based on the measured waves from Buoy II and III. Most energetic waves come from direction 300 NW – which is the direction with the largest fetch.
Figure 7: Scatter plot showing the distribution of the flux per unit width as a function of the direction for the period April to December 2015.
3.1 WAVE SCATTER DIAGRAMS AND WAVE ENERGY RESOURCE From the measured wave data from April 2015 to April 2016, the frequency of sea states expressed in terms of Hs and Tz can be presented as scatter diagrams. Those scatter diagrams are shown in figure 8a, 8b and 8c for Buoy III, Buoy II and Buoy I respectively, with Tz in increments of 0.5 s and Hs in increments of 0.5 m.
The significant wave height Hs (Hm0) and the average wave periods Tz (To2) have been derived from the spectrum
2
02,0m
m
mT
zT
0
10,1m
m
mT
eT
04 m
sH
Figure 8a: Scatter diagram obtained from data measured by Buoy III April 2015 to April 2016.
5
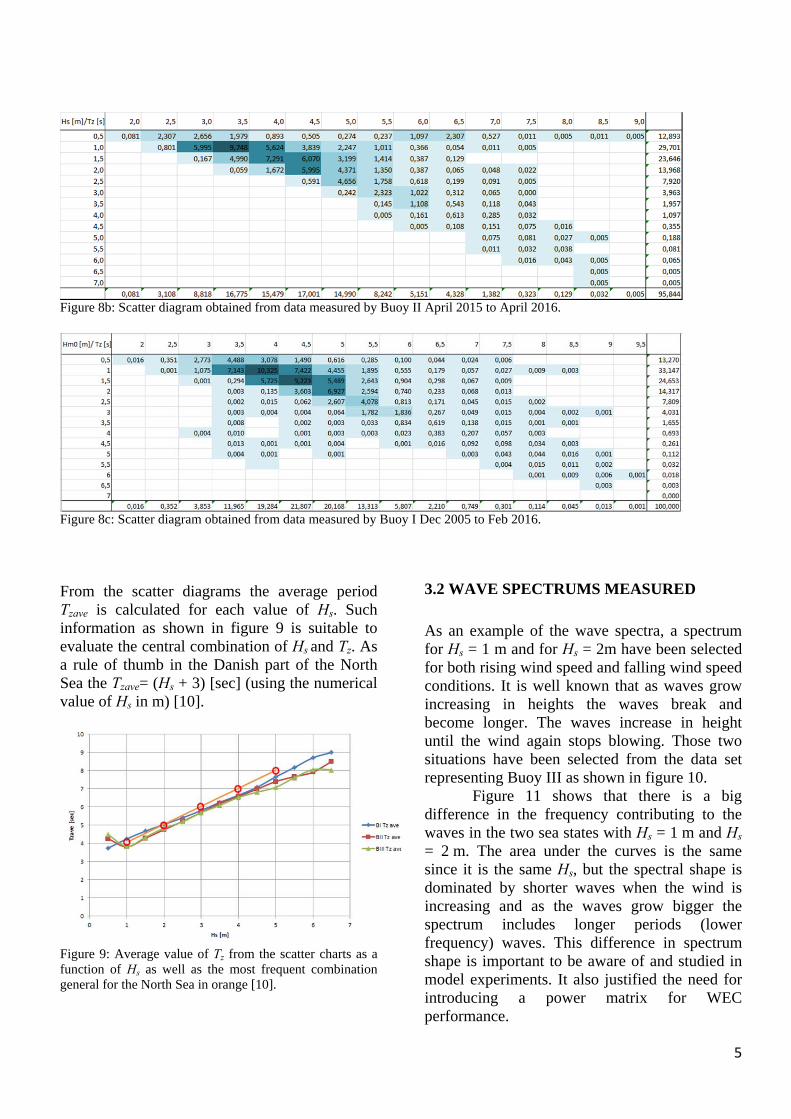
Figure 8b: Scatter diagram obtained from data measured by Buoy II April 2015 to April 2016.
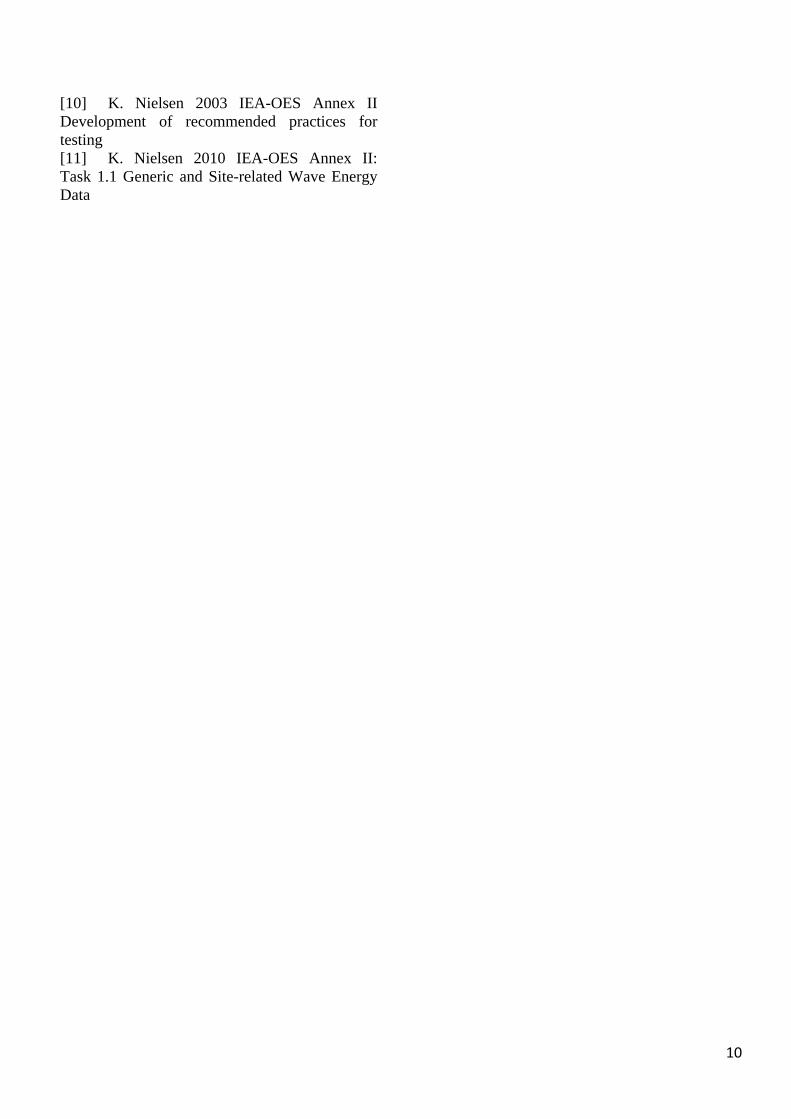
Figure 8c: Scatter diagram obtained from data measured by Buoy I Dec 2005 to Feb 2016. From the scatter diagrams the average period Tzave is calculated for each value of Hs. Such information as shown in figure 9 is suitable to evaluate the central combination of Hs and Tz. As a rule of thumb in the Danish part of the North Sea the Tzave= (Hs + 3) [sec] (using the numerical value of Hs in m) [10].
Figure 9: Average value of Tz from the scatter charts as a function of Hs as well as the most frequent combination general for the North Sea in orange [10].
3.2 WAVE SPECTRUMS MEASURED
As an example of the wave spectra, a spectrum for Hs = 1 m and for Hs = 2m have been selected for both rising wind speed and falling wind speed conditions. It is well known that as waves grow increasing in heights the waves break and become longer. The waves increase in height until the wind again stops blowing. Those two situations have been selected from the data set representing Buoy III as shown in figure 10.
Figure 11 shows that there is a big difference in the frequency contributing to the waves in the two sea states with Hs = 1 m and Hs = 2 m. The area under the curves is the same since it is the same Hs, but the spectral shape is dominated by shorter waves when the wind is increasing and as the waves grow bigger the spectrum includes longer periods (lower frequency) waves. This difference in spectrum shape is important to be aware of and studied in model experiments. It also justified the need for introducing a power matrix for WEC performance.

6
Figure 10: Time series of wind speed and wave height variation February 2016 (Buoy III).
Figure 11: Selected examples of measured wave spectra for Hs = 1 m and Hs = 2 m
The wave power per unit length is obviously an important parameter and can be approximate by:
gCs
HP g
16
2
(1)
where ρ is the sea water density taken as 1025 kg/m3 and g is the gravitational acceleration taken as 9.81 m/s2. Cg stands for the group velocity and is given by:
kdkd
kdegT
gC tanh
2sinh
21
4
(2)
where d is the water depth in meter and k is the wave number obtained from the wave dispersion relation:
kdgk tanh2 (3)
where ω is the wave frequency (e
T 2 ). Based on the scatter diagrams and an omnidirectional estimate using
zT
sHP 257.0 kW/m (4)
the average annual wave power flux is calculated to be 8.5 kW/m at Buoy I, 8.9 kW/m at Buoy II and 11 kW/m at Buoy III. Those values should be compared to earlier estimates of about 6 kW/m. 3.2 EXTREME WAVE DESIGN CONDITIONS Table 3 below shows the significant wave height Hs as a function of direction and different exceeding probabilities based on the first wave measurements from the period 1962 – 65 during the planning and building of the Harbour. Table 3: Exceeding wave heights for different directions
Exceeding probability Wave direction (deep water) (Significant wave height Hs in meter)
SV V NV N NE 3 hours/1 Year 4.1 4.7 4.8 4.1 3.0 3 hours/10 Year 5.0 5.6 5.8 5.2 3.9 3hours/100 Year 5.8 6.5 6.6 6.1 4.5
Extreme statistics of the wave measurements taken outside the harbour on about 15 m water depth from the period 1979 – 1988 confirmed that the most probable largest wave is about Hmax=11.5 m and the corresponding significant wave height Hs = 6.4 m. 4. WIND CONDITIONS From the period 1962 – 65 the probability of wind speeds and water levels exceeding certain values was analysed [8] as shown in the Table 4 and Table 5 below: Table 4 Exceedance of extreme wind speeds
Exceeding probability Wind directions (wind speeds in m/s)
SV V NV N NE 3 hours/1 Year 21 25 25 19 20 3 hours/10 Year 24 30 29.5 23.5 25 3hours/100 Year 28 34 33 28 29 Probability of wind direction
15.5% 18.4% 11.8% 5.2% 8.4%
5. WATER LEVEL VARIATIONS High and low water conditions can have an impact on the mooring design of the converter,

7
such extreme levels should be indicated. At Hanstholm the tidal variation is relatively small: •Mean Spring tide high water level: 0.3m •Mean Neap tide high water level: 0.2m •Mean Neap tide low water level: 0.1m •Mean Spring tide low water level: 0.0m The extreme water levels are associated with the storms as indicated in Table 5. Table 5: Exceedance of extreme water levels
Exceeding probability High water Low water 3 hours / year 1.22 m 1.28 m 3 hours / 10 year 1.58 m 1.52 m 3 hours / 100 year 1.96 m 1.78 m
6. DESIGN CURRENT DATA Depending on the submerged part of the wave energy converter the current forces can have an impact on the design loads, the maximum current speed with the same return period as the waves and wind should be used for the each direction.
The current running outside Hanstholm harbour follows the coast and as a guiding rule winds from directions South, West and North West gives currents running north. Winds from directions N and NE gives currents running south. This seems to be in agreement with measurements taken during January – March 2016 as shown on figure 12 below.
Figure 12: Correlation between current direction and wind direction from the 1st of January to the 31st of March 2016.
For the same period figure 13 shows the measured wind speed and current speed. A semi-empirical relation between the current velocity and the wind speed is proposed as U = 0.2 V where U is the current velocity in m/s og V is the wind speed in Beauford [8]. During storm at Beaufort V=10 current velocities of about 2 m/s can be expected.

8
Figure 13: Correlation between current speed and wind speed and for the period from the 1st of January to the 31st of March 2016.
Figure 14: Correlation wind – current speed, NE direction
Figure 15: Correlation wind – current speed, SW direction
Table 6: Wind speed and Current speed Wind force Beaufort
2 4 6 8 10
Mean Wind [m/s]
3 7 12 19 27
Average current speed [m/s] (empirical)
0.4 0.8 1.2 1.6 2.0
Based on the recent on-going
measurements at DanWEC the correlation between wind speed and current speed is shown on figure 14 for NE going current and figure 15 for currents with direction SW.
The measured correlation between wind speed and current speed indicates that the empirical relation gives a value of the current speed relatively close to the upper value measured, especially for the NE direction.
7. WEATHER WINDOWS FOR O&M
DanWEC will also provide links to the best forecast services concerning the weather conditions – information that will be helpful when planning installation and maintenance operations.
Weather windows are periods of time with wave heights below certain values. Taking

9
the wave data from July 2015, it can be seen from figure 16 that three time periods of less than 1 m significant wave height occurred – the minimum duration was of about 2 days. Similar 4 weather windows with Hs < 2 m of duration longer than 2 days occurred.
The project will further analyse and present the statistical information on weather windows for the users of the site.
Figure 16: Illustration of the duration weather windows with sea states below Hs = 1 m and 2 m respectively in July 2015.
8. CONCLUSIONS
The present paper describes some of the historic measurements related to Hanstholm harbour and the DanWEC Hanstholm test site. The paper presents results from recent and on-going measurements of wind, waves, currents and water levels taken place at DanWEC. The on-going measurements indicate that the largest sea state might be Hs 7 m compared to historic data of 6.5 m – and that the average wave power assumed to be 6 kW/m could be as high as 11 kW/m. The results will feed into the on-going project “Resource Assessment, Forecasts and WECs O&M strategies at DanWEC and beyond” which has been initiated to deliver detailed information of the environmental conditions of DanWEC and to review implementation of O&M procedures, which will ultimately improve WEC’s operation and reduce WEC’s costs.
ACKNOWLEDGEMENTS
The authors gratefully acknowledge the financial support from the Danish Energy Agency under The Energy Technology Development and Demonstra-tion Program (EUDP) (Resource Assessment, Forecasts and WECs O&M strategies at DanWEC and beyond) which render this work possible.
REFERENCES
[1] V. Venugopal and R. Nemalidinne, Wave resource assessment for Scottish waters using a large scale North Atlantic spectral wave model, Renewable Energy, vol 76, 2015, pp. 503-525. [2] B.G. Cahill and T. Lewis, Wave energy resource characterization of the Atlantic Marine Energy Test Site, International Journal of Marine Energy, vol. 1, 2013, pp. 3-15. [3] A.R. Bento, P. Martinho, and C.G. Soares, Numerical modelling of the wave energy in Galway Bay, Renewable energy, vol. 78, 2015, pp. 457-466. [4] J.C.C. van Nieuwkoop, H.C.M. Smith, G.H. Smith, and L. Johanning, Wave resource assessment along the Cornish coast (UK) from a 23-year hindcast dataset validated against buoy measurements, Renewable Energy, vol. 58, 2013, pp. 1-14. [5] M. Goncalves, P. Martinho, and C.G. Soares, Wave energy conditions in the western French coast, Renewable Energy, vol. 62, 2014, pp. 155-163. [6] A. Vögler, J. Morrison, and V. Venugopal, “An empirical analysis of coastal shoaling induced modifications to wave climate and its impact on wave power,” Proc. ISOPE’13, 2013, pp. 508-515. [7] J. Lavelle and J. P. Kofoed, Providing Online Wave Data for the DanWEC Test Site (DanWEC Vaekstforum 2011), DCE Technical Reports; No.138: Aalborg University, 2012. [8] K. Nielsen &. N. Scholten, Wave power experiments at Hanstholm Phase 1 August 1988-1990 . Copenhagen : Danish Wave Power Aps., 1991. [9] http://www.sowfia.eu/index.php?id=3
10
[10] K. Nielsen 2003 IEA-OES Annex II Development of recommended practices for testing [11] K. Nielsen 2010 IEA-OES Annex II: Task 1.1 Generic and Site-related Wave Energy Data