aalborg universitet expert finder systems – design and use
TRANSCRIPT

Aalborg Universitet
Expert finder systems – design and use
Survey results
Lykke, Marianne; Weidel, Eva
Publication date:2011
Document VersionEarly version, also known as pre-print
Link to publication from Aalborg University
Citation for published version (APA):Lykke, M., & Weidel, E. (2011). Expert finder systems – design and use: Survey results.
General rightsCopyright and moral rights for the publications made accessible in the public portal are retained by the authors and/or other copyright ownersand it is a condition of accessing publications that users recognise and abide by the legal requirements associated with these rights.
- Users may download and print one copy of any publication from the public portal for the purpose of private study or research. - You may not further distribute the material or use it for any profit-making activity or commercial gain - You may freely distribute the URL identifying the publication in the public portal -
Take down policyIf you believe that this document breaches copyright please contact us at [email protected] providing details, and we will remove access tothe work immediately and investigate your claim.
Downloaded from vbn.aau.dk on: February 07, 2022

Department of Communication and Psychology Kroghstræde 3 9220 Aalborg Øst Denmark Tlf. +45 9940 9940 Fax +45 9815 9434 [email protected] www.kommunikation.aau.dk
Marianne Lykke, Professor, PhD Eva Weidel, Master LIS e-Learning Lab - Center for User-driven Innovation, Learning and Design E-mail: [email protected] Direct phone: +45 9940 8157 Mobile: +45 2125 1854
Survey results
Expert finder systems – design and use
Summary The survey aimed at investigating how companies deal with the challenge of sharing of employees’ expert knowledge. We wanted to find out which tools are being used to register, communicate and search employees as a knowledge resource. Specifically, we wanted to know how service organizations use expert finder systems to share knowledge about employees’ knowledge, interest, competences and activities. The purpose of the survey was to provide insight into goals, content and functionality of expert finder systems, including updating strategies and connection to social media knowledge sharing tools, for example LinkedIn, Twitter, Facebook, Lotus Quickr, RSS feed. We ran our survey with the online-service SurveyXact. The survey was open February and March 2011. The questionnaire was distributed by e-mail and sent to 2.853 service companies in Denmark, Norway, Sweden, Finland, Germany, Holland, Belgium, Switzerland, Ireland, United Kingdom, France, Portugal, Greece, Monaco, Italy, Luxemburg, Turkey, USA, Canada, Australia, New Zealand, Mexico, Chile, and China. The sample was drawn from Kompass: the business to business search engine, and covered service providers with 500+ employees and distributed location. 25 companies completed the questionnaire, 22 confirmed to have an expert finder system and 3 reported that they did not have any expert finder system. The companies were situated in Europe and USA. Most companies had 500+ employees, 40% of the companies had more than 5000 employees. All companies had a distributed structure with more than one location, 80% with an international branch. Although the data is not statistically reliable there are some valuable insights:
Expertise description should be rich and contextual – contain descriptive information about skills and credibility, practical contact information, and behavioral data about activities, documents, network and preferences
Integration with social technologies is central - codification supports awareness and expertise retrieval, social networking supports sharing and interactive formation of knowledge

2
Background information
The questionnaire survey was carried out during February and March 2011. The questionnaire was distributed by e-mail and sent to 2.853 service organizations in first mailing February 9 2011 and 2757 in second mailing March 7 2011. The questionnaire was sent to respondents in Denmark, Norway, Sweden, Finland, Germany, Holland, Belgium, Switzerland, Ireland, United Kingdom, France, Portugal, Greece, Monaco, Italy, Luxemburg, Turkey, USA, Canada, Australia, New Zealand, Mexico, Chile, and China. The sample was drawn from Kompass: the business to business search engine and covers service providers with 500+ employees and distributed location within the Kompass activity codes 82010-82950, see Table 1: 82 Service providers
82010 Central banks 82030 Commercial banks 82050 Offshore banks/banks with restricted licence 82070 Investment and merchant banks 82110 Building societies and mortgage banks, savings banks 82130 Discount houses 82150 Foreign bank representation 82160 Banking services 82170 Moneylenders and pawnbrokers 82190 Issuing houses and security underwriters 82210 Security brokers 82220 Foreign exchange brokers and dealers 82240 Commodity brokers and commodity futures brokers and dealers 82250 Bill of exchange brokers 82260 Financial futures and options brokers 82270 Currency exchange bureaux 82280 Guarantee funds 82290 Bullion brokers 82300 Factoring 82310 Credit reporting and debt recovery/collection 82330 Finance houses 82340 Credit and charge card organisations 82350 Clearing houses
82360 Voucher organisations, goods and services 82370 Stock and financial futures exchanges 82380 Commodity and commodity futures exchanges 82390 Financial services: Leasing and leaseback 82500 Holding companies and groups of companies 82510 Joint ventures 82550 Investment companies (trusts) 82600 Unit trust management companies 82610 Unit trusts 82630 Independent financial advisers 82700 Life assurance companies 82720 General insurance companies 82740 Health insurance companies 82750 Credit insurance companies 82760 Re-insurance companies 82780 Foreign insurance companies service offices 82800 Insurance underwriters 82820 Insurance brokers 82840 Re-insurance brokers 82860 Foreign insurance company representatives 82880 Law protection insurance companies 82900 Insurance actuarial consultants 82950 Loss adjusters and surveyors
Table 1: Selected Kompass activity codes
3
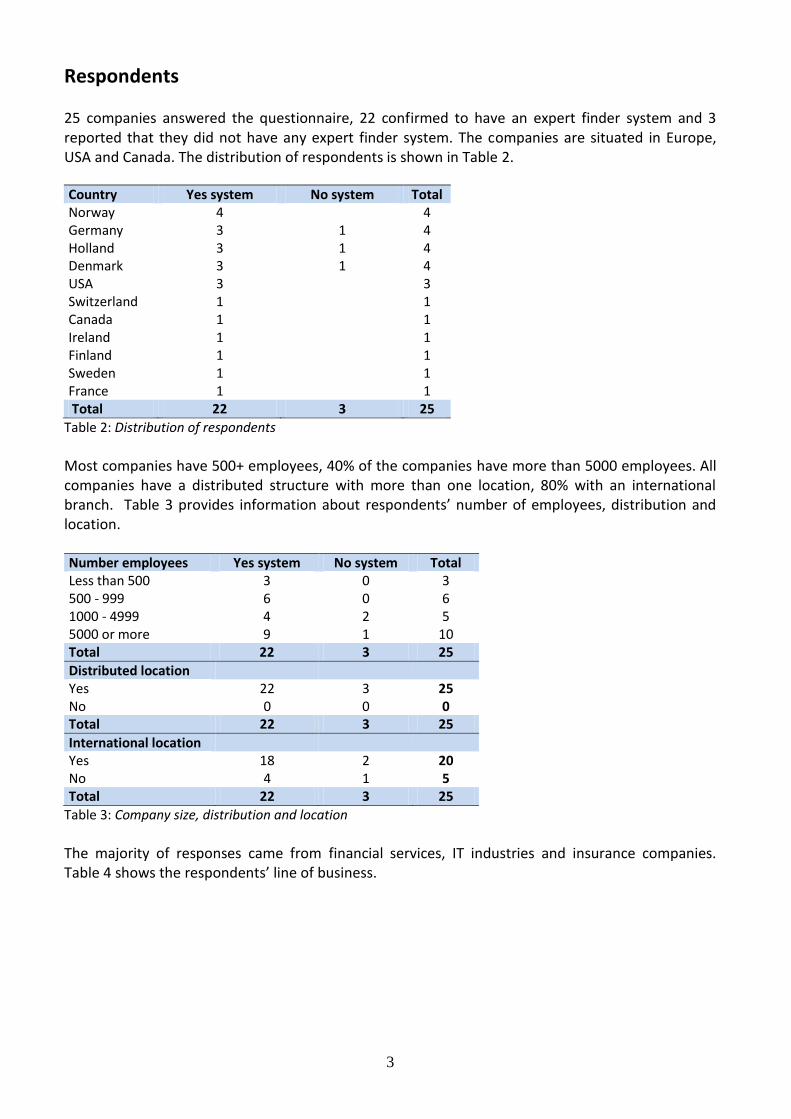
Respondents 25 companies answered the questionnaire, 22 confirmed to have an expert finder system and 3 reported that they did not have any expert finder system. The companies are situated in Europe, USA and Canada. The distribution of respondents is shown in Table 2.
Country Yes system No system Total Norway 4
4
Germany 3 1 4 Holland 3 1 4 Denmark 3 1 4 USA 3
3
Switzerland 1
1 Canada 1
1
Ireland 1
1 Finland 1
1
Sweden 1
1 France 1
1
Total 22 3 25
Table 2: Distribution of respondents
Most companies have 500+ employees, 40% of the companies have more than 5000 employees. All companies have a distributed structure with more than one location, 80% with an international branch. Table 3 provides information about respondents’ number of employees, distribution and location. Number employees Yes system No system Total Less than 500 3 0 3 500 - 999 6 0 6 1000 - 4999 4 2 5 5000 or more 9 1 10 Total 22 3 25
Distributed location Yes 22 3 25
No 0 0 0 Total 22 3 25
International location Yes 18 2 20
No 4 1 5 Total 22 3 25
Table 3: Company size, distribution and location
The majority of responses came from financial services, IT industries and insurance companies. Table 4 shows the respondents’ line of business.
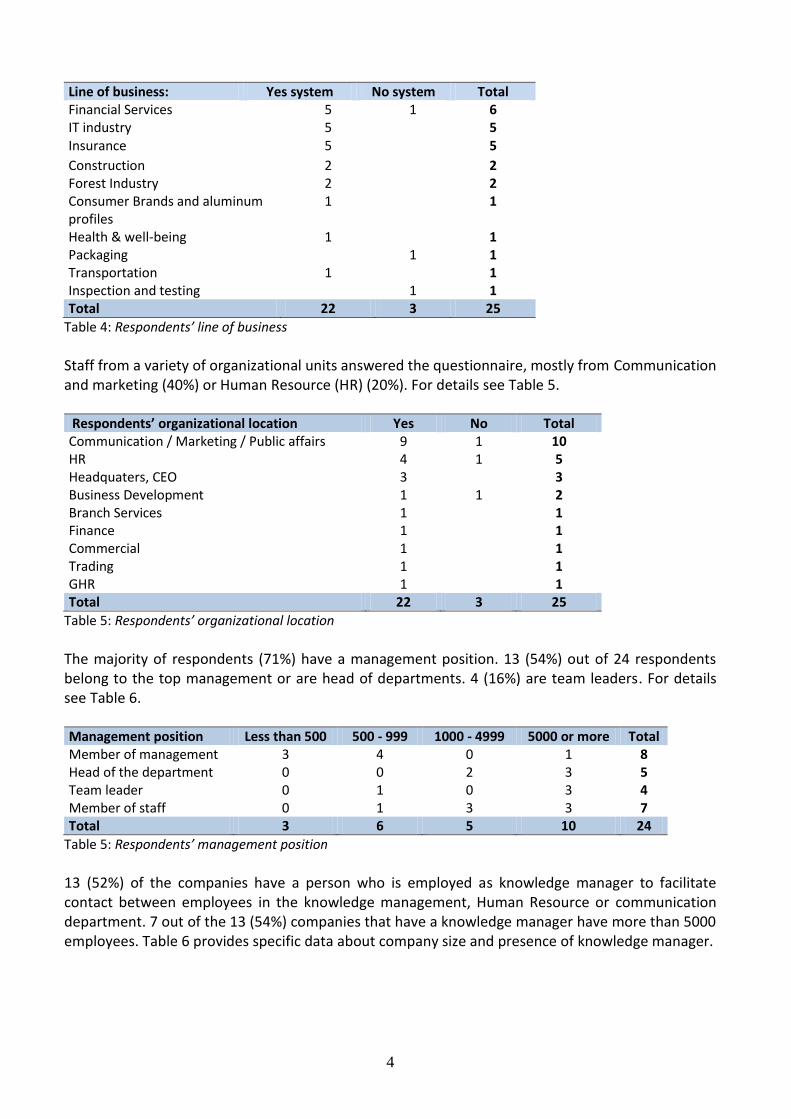
4
Line of business: Yes system No system Total Financial Services 5 1 6 IT industry 5 5 Insurance 5 5
Construction 2 2 Forest Industry 2 2 Consumer Brands and aluminum profiles
1 1
Health & well-being 1 1 Packaging 1 1 Transportation 1 1 Inspection and testing 1 1 Total 22 3 25
Table 4: Respondents’ line of business
Staff from a variety of organizational units answered the questionnaire, mostly from Communication and marketing (40%) or Human Resource (HR) (20%). For details see Table 5. Respondents’ organizational location Yes No Total Communication / Marketing / Public affairs 9 1 10 HR 4 1 5 Headquaters, CEO 3
3
Business Development 1 1 2 Branch Services 1
1
Finance 1
1 Commercial 1
1
Trading 1
1 GHR 1
1
Total 22 3 25
Table 5: Respondents’ organizational location
The majority of respondents (71%) have a management position. 13 (54%) out of 24 respondents belong to the top management or are head of departments. 4 (16%) are team leaders. For details see Table 6. Management position Less than 500 500 - 999 1000 - 4999 5000 or more Total
Member of management 3 4 0 1 8 Head of the department 0 0 2 3 5 Team leader 0 1 0 3 4 Member of staff 0 1 3 3 7 Total 3 6 5 10 24 Table 5: Respondents’ management position
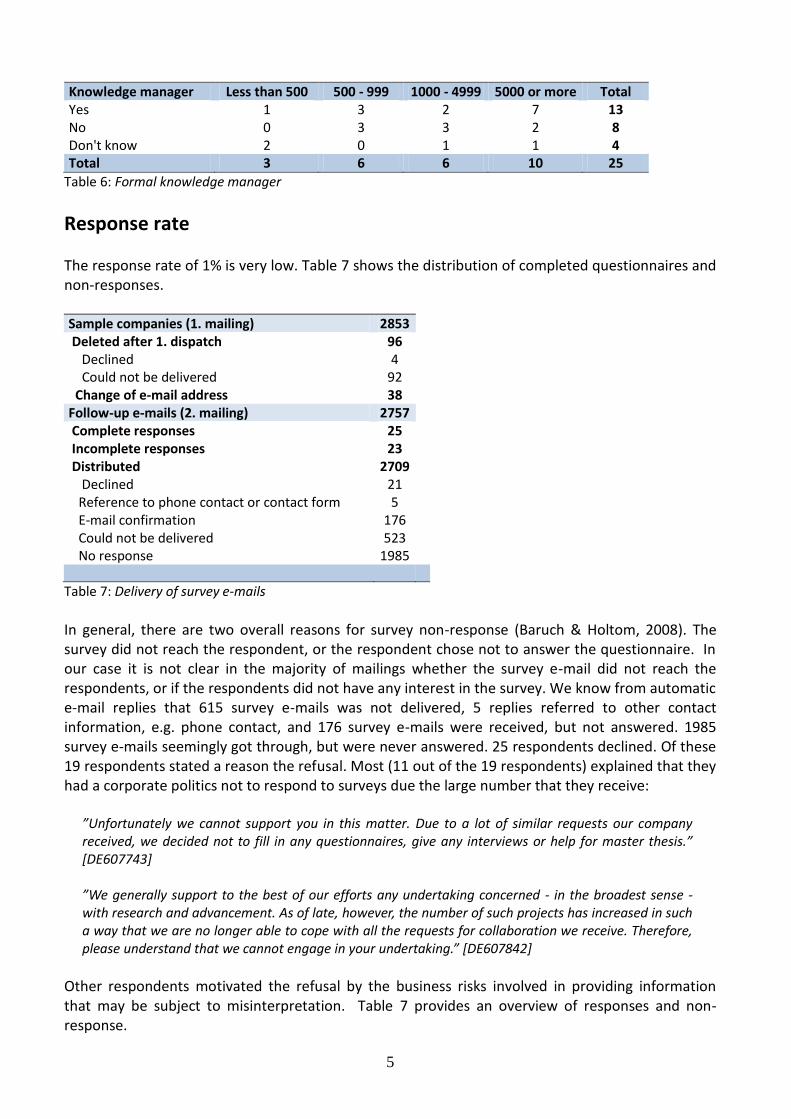
13 (52%) of the companies have a person who is employed as knowledge manager to facilitate contact between employees in the knowledge management, Human Resource or communication department. 7 out of the 13 (54%) companies that have a knowledge manager have more than 5000 employees. Table 6 provides specific data about company size and presence of knowledge manager.
5
Knowledge manager Less than 500 500 - 999 1000 - 4999 5000 or more Total Yes 1 3 2 7 13 No 0 3 3 2 8 Don't know 2 0 1 1 4 Total 3 6 6 10 25
Table 6: Formal knowledge manager
Response rate The response rate of 1% is very low. Table 7 shows the distribution of completed questionnaires and non-responses. Sample companies (1. mailing) 2853
Deleted after 1. dispatch 96 Declined 4 Could not be delivered 92 Change of e-mail address 38 Follow-up e-mails (2. mailing) 2757 Complete responses 25 Incomplete responses 23 Distributed 2709 Declined 21
Reference to phone contact or contact form 5 E-mail confirmation 176 Could not be delivered 523 No response 1985
Table 7: Delivery of survey e-mails
In general, there are two overall reasons for survey non-response (Baruch & Holtom, 2008). The survey did not reach the respondent, or the respondent chose not to answer the questionnaire. In our case it is not clear in the majority of mailings whether the survey e-mail did not reach the respondents, or if the respondents did not have any interest in the survey. We know from automatic e-mail replies that 615 survey e-mails was not delivered, 5 replies referred to other contact information, e.g. phone contact, and 176 survey e-mails were received, but not answered. 1985 survey e-mails seemingly got through, but were never answered. 25 respondents declined. Of these 19 respondents stated a reason the refusal. Most (11 out of the 19 respondents) explained that they had a corporate politics not to respond to surveys due the large number that they receive:
”Unfortunately we cannot support you in this matter. Due to a lot of similar requests our company received, we decided not to fill in any questionnaires, give any interviews or help for master thesis.” [DE607743] ”We generally support to the best of our efforts any undertaking concerned - in the broadest sense - with research and advancement. As of late, however, the number of such projects has increased in such a way that we are no longer able to cope with all the requests for collaboration we receive. Therefore, please understand that we cannot engage in your undertaking.” [DE607842]
Other respondents motivated the refusal by the business risks involved in providing information that may be subject to misinterpretation. Table 7 provides an overview of responses and non-response.

6
Low response rate is common for business surveys (Baruch & Holtom (2008). They studied 1607 surveys and report four reasons for not responding: too busy (28%), not considered relevant (14%), address unavailable to return the questionnaire (12%), and cases when it was company policy not to complete surveys (22%). The remaining 24 percent did not state clear reasons. Obviously, all of these reasons are problematic, but the formal policies against responding represent a genuine threat to survey-based organizational research. Another explanation may relate to the fact that the survey e-mail primarily have been sent to managers. Baruch and Holtom (2008, 1144) describe how surveys sent to managers probably will result in lower response rate compared to surveys sent to employees. Harzing (1996) mentions language barriers as an important reason for non-responses. In her study that was distributed from a Dutch university, she found a correlation between English language skills and ‘high response countries’ such as Holland, Denmark, Norway, Finland and Sweden and low-response countries such as South American countries. Responses from two German organizations in our survey indicated that language barriers may have affected the response rate:
”Since we are a German private bank, we primarily offer our services in German language. We would be grateful if you could contact us by telephone in order to be put through to one of our English-speaking agents, who shall be glad to help you. We apologize for any inconvenience incurred.”[DE608770]
”Please accept our apologies that currently any communication with our bank can only be dealt with in German. It is necessary, therefore, that you send your request again in German language so that we can process it.”[DE606113]
Survey results The findings are primarily based on the 25 companies that answered the questionnaire completely. The findings concerning profile elements used to describe and search for persons and skills also include responses from incomplete questionnaires that have filled out the profile questions. The presentation of results includes findings about system functionality, expert profiles, integration with other systems, social technologies, up-dating procedures, evaluation and satisfaction with the expert finder system.
System functionality 22 (88%) companies responded that they have an expert finder system such as an employee directory, expert recommender, people locator, phonebook, yellow pages, where some or all employees are represented by a profile. All systems allow the user to search for known persons (100%), search for skills (50%) and, to contact persons (77%). For details see Table 8. A third of the systems (27%) allow users to annotate or tag employees and to filter by pre-defined categories, e.g. availability or subject areas. 3 systems (14%) allow users to write recommendations for employees. One respondent reports that their system contains blogs and wikis and communities.

7
Other (please specify): - “Communities, blogs, wikis”
Table 8: System functionality
11 of the 22 respondents have used the system to search for a person without having a specific name. This finding correspond to the finding that only half of the systems allow the user to search for skills, and indicates that expert finder systems are primarily used as phone books to search for known persons. Search without a name Respondents Yes 11 No 11 Total 22
Table 9: Searching for experts without a name
Profile elements Generally the systems contain descriptive, explicit information such as contact information (22), department (21), managers (16), availability (13), responsibilities (13), related colleagues (12), etc. that describes explicit demographic, practical organizational dimensions of the employee. Only few systems include implicit information based on user behavior and activities, e.g. recent projects, documents clicked by profile owner or persons looked up by profile owner. Demographic information (contact information and department), accessibility information (availability) and organizational information (related colleagues, managers) is most commonly used, whereas credential information describing the employee’s competences and qualities, for example education (8), skills (8), level of competence (9), CV (7), interests (6) are used by less than half of the systems. Only few systems use information about user behavior to represent and search employees. Activity or interest behavioral data is primarily used. 8 systems contain information about recent projects, 4 systems show documents edited by profile owner, 3 systems show documents written or clicked by profile owner, and 1 system show persons looked up by the profile owner as descriptive profile element. No systems include behavioral value data such as social media data, e.g. blog content, uploads. Related colleagues are used as the only social network information. No system includes for example contact lists, email contacts, or email correspondence. A large part of the respondents show interest in using implicit behavior information by marking them as relevant information that is “nice to have, but not present at the moment”. The lack of use may be explained by the technical complications and need of system compability connected with this kind of dynamic, implicit data that must be drawn automatically from other systems. The implied surveillance of employees may also influence the lack of usage.
Functionality Respondents Searching a person 22 Contacting a person 17 Searching for skills 11 Tagging a person 6 Filtering results 5 Recommening a person 3 Other (please specify) 1 Don't know 0 Total 22

8
In sum, most systems contain explicit, background information, e.g. contact information, department, managers, availability that can be extracted automatically from HR systems or calendar systems, whereas interpretive, topical information describing the employee’s competences, subject and work areas that build on semantic description of some kind are less used. Information about user behavior and activities that are extracted dynamically from other systems such as communication and document management systems are little used. Table 10 provides an overview of the profile information elements that are present or considered relevant in expert finder systems. Profile elements Present Nice to have Total Contact information 22 0 22 Department 21 1 22 Managers 16 3 19 Availability (e.g. “out of office”, “in call” 13 6 19 Responsibilities 13 3 16 Related colleagues 12 6 18 Level of competence 9 6 15 Education 8 8 16 Skills 8 8 16 CV 7 10 17 Recent projects 7 8 15 Alternative names (e.g. nickname, abbreviations) 7 8 15 Areas of subject related to the person (e.g. tag) 7 7 14 Interests 6 8 14 Documents edited by profile owner 4 11 15 Preferred mode of communication (e.g. call, chat) 4 11 15 Documents written by profile owner 3 11 14 Documents clicked by profile owner 3 11 14 Persons looked up by profile owner 1 13 14
Table 10: Use and opinion about profile elements
There seems to be a correlation between number of present profile elements and satisfaction with the amount of information included in the profiles. In general, the most satisfied respondents also have the largest number of elements, see table 11 for details. However, the correlation may be caused by the so called “order effect” of questions in the survey (Saris & Gallhofer, 2007, 166). The question about presence and preference of profile elements appeared before the question about satisfaction with the profile content. The large number of alternative profile elements shown to the respondents may have caused a feeling of limitations in their present systems regarding number and type of profile elements. One respondent from the pilot test commented: “[it] seems overwhelming with all the possibilities now that we have only a primitive phone book” [PT04].

9
Satisfaction - depth Number of profile elements Very satisfied: 8 respondents
19 17 15 12 12 8 5 3
Somewhat satisfied: 4 respondents
12 10 4 3
Mixed feelings: 4 respondents
13 4 4 1
Somewhat dissatisfied: 6 respondents
6 6 5 5 4 4
Table 11: Satisfaction with amount of profile elements
Up-dating procedures Most systems (16/73%) are up-dated by a partly automatic and partly manual up-dating procedure. No systems are fully automatic up-dated and 5 are fully manually up-dated. See Table 12 for details. Up-dating procedure Respondents Partly automatic and partly manual 16 Manual 5 Automatic 0 Don't know 1 Total 22
Responsible for up-date - one answer Respondents Everybody is responsible for his/ her own profile 8 An administrator keeps all our profiles up-to-date 9 Other (please specify) 2 Don't know 3 Total 22
Other (please specify):
- “HR system – personal responsibility” - “Batch upload in addition to each individual is encouraged to
keep the info up to date”
Table 13: Responsibility for up-date
9 (41%) are up-dated by a formal administration, whereas the employees individually are responsible for content and up-date in 8 (36%) systems. There is a correlation between number and

10
type of profile elements and responsibility for up-date. Systems maintained by employees contain on average 11,5 profile elements (minimum 4, max 19) compared to systems up-dated by an administrator that in average contain 5,2 elements (minimum 1, max 12). Self-administrated systems contain more credential information such as CV, skills and education compared to administrator systems. Behavioral information is exclusively present in self-administrated systems, e.g. documents written, edited, and clicked on by profile owners. There seems to be a tendency that systems containing more interpretive, semantic content information are administrated by the employees themselves. This is not surprising as this kind of information requires detailed and current topical and domain-specific knowledge.
Integration with other technologies 16 (67%) of the companies integrate the expert finder system with other technologies, primarily with e-mail (11/69%) and intranet (10/63%). Systems in companies with fewer than 1000 employees integrate with fewer technologies, and only e-mail and intranet is mentioned by this group. Table 14 provides an overview of the integrated technologies. Other technologies Respondents % E-mail program 11 69 Intranet 10 63 Other (please specify) 4 25 Social software 3 19 Wall' with news and updates 3 19 Document management system 3 19 Don't know 1 6 Total 16 100%
Other (please specify): - “HR SAP system” - “Active directory” - “LMS”
Table 14: Integration with other technologies (multiple answers)
Expert finder systems are primarily integrated with social technologies, walls and document management systems by 5000+ companies. This includes other technologies such as Human Resource SAP, Active Directory and learning management systems. It seems that technology that demands more advanced and dynamic integration are primarily used by larger companies. Social technologies Yes No Total
% Antal % Antal % Use social media: 64 14 67 2 64 - LinkedIn 50 12 33 1 48 - RSS feed 46 10 33 1 44 - Twitter Connect 32 7 0 0 28 - Facebook Connect 23 5 0 0 20 - Lotus Quickr 18 4 0 0 16 - Other (please specify): 14 3 0 0 12 - Add this (addthis.com) or Share this (sharethis.com) 9 2 0 0 8 - Google FriendConnect 5 1 0 0 4 - Feedburner 0 0 0 0 0 - Friendfeed 0 0 0 0 0 - Yahoo pipes 0 0 0 0 0

11
Don’t use social media: 14 3 33 1 16 Don't know 23 5 0,0 0 20
Total
22
3 25
Other (please specify): Lotus Connections IBM Connections Microsoft Office Communicator Social media tools - Multiple answers x System
Table 15: Use of social technologies (multiple answers)
Social technologies 16 (64%) of the companies use social technologies or other knowledge sharing systems, see Table 15. LinkedIn (12/50%) and RSS feed (10/46%) are the most used tools followed by Twitter (7/32%). LinkedIn is used more compared to Facebook (5/23%), which is not surprising in relation to work-related knowledge sharing. 4 companies use Lotus Quickr, which is a IBM team collaboration software that facilitates access and interaction with the people, information and project materials. 2 companies use social bookmarking (AddThis.com/ShareThis.com). ShareThis and AddThis are plugins that allow sharing of content by e-mail and social network. As opposed to the other tools social book marking and Quickr provide directly access to information in documents and websites. The companies that use most social technologies are two IT companies. One offer IT courses, for instance in social technologies and communication systems, and the other develop software and provide IT management and consultancy. These two companies are the only ones that use social book marking, and among the companies that use Facebook and Twitter. When we compare findings about number of social technologies in use with use of system functionality, there is a tendency that respondents that have used the expert finder system to search for a person without having a specific name also have access to the largest number of social knowledge sharing tools, on average 2.8 tools compared to 1.1. Due to the small data set the correlation is tentative. It will be interesting to investigate whether an information strategy that encourages networks and social knowledge sharing tools creates a specific culture. See Table 16 for details. Search without a name Yes No Number of respondents 11 11
- LinkedIn 6 5 - RSS feed 7 3 - Twitter Connect 5 2 - Facebook Connect 4 1 - Lotus Quickr 4 0 - Other (please specify) 2 1 - Add this (addthis.com) or Share this (sharethis.com) 2 0 - Google FriendConnect 1 0 - Feedburner 0 0 - Friendfeed 0 0 - Yahoo pipes 0 0
Total number of social technologies and knowledge sharing tools used 31 12
Don’t use social media: 1 2 Don't know 1 4
Table 16: Use of social technologies and knowledge sharing tools compared to search without name

12
Evaluation of expert finder system 13 (59%) respondents judge the system as adequate and fair, and 8 (36%) as well or very well. See Table 17 for detailed information. Respondents judge colleagues’ attitude a bit more positive. See Table 18 for detailed information. Satisfaction with expert finder system Respondents Percent Very well 2 9 Well 6 27 Fair 13 59 Poor 1 5 Very poor 0 0 Don’t know 0 0 Total 22 100
Table 17: Satisfaction with expert finder system
15 (68%) are judged as very or somewhat positive, 3 (14%) have mixed feelings, 2 (9%) are negative of very negative. 2 respondents do not know colleagues’ attitude. In sum, most respondents consider their system as reasonable and fair. Only 2 respondents are negative in their evaluation of the existing system. Colleagues’ attitude Respondents Percent Very positive 6 27 Somewhat positive 9 41 Mixed feelings 3 14 Somewhat negative 1 4.5 Negative 1 4.5 Very negative 0 0 Don’t know 2 9 Total 22 100
Table 18: Colleagues’ attitude
Findings about companies without an expert finder system Ways to find colleagues Respondents %
Ask a colleague 3 100 I haven't experienced that 0 0 Don't know 0 0 Other (please specify) 0 0
Total 3 100 Table 19: Non system companies’ ways to find colleagues Only three respondents do not have an expert finder system. All three responded that they will Ask a colleague when they need to find a colleague, and that they will choose a colleague that they work closely with. However, the small number of respondents makes it impossible to conclude anything about expert searching in companies without an expert finder system.

13
Colleague Respondents %
Someone I work closely with 3 100
Someone with whom I share my office 0 0,0
My mentor/ advisor or other person who is meant to support me 0 0,0
My manager 0 0,0
The colleague, whose job function best matches the skills/expertise needed 0 0,0
Don't know 0 0,0
Other (please specify) 0 0,0
Total 3 100 Table 20: Types of colleagues
Discussion and conclusions The survey results correspond to previous findings about expert finding systems. They are a valuable tool for individuals to develop awareness of “who knows what” and to reach out to people across the organization (Ehrlich, 2003). They are a way of mapping tacit knowledge by expressing and codifying employees’ demographic, credential, organizational and accessibility information. Also indirect expression of expertise is important and recognized as a useful way to communicate expertise, e.g. by showing persons looked up by profile owner or documents written by profile owner. There seems to be a correlation between number of profile elements and satisfaction with the system – more information, more satisfaction. Many companies integrate the expert finder system with other technologies, mostly e-mail and intranet. Integration with interactive systems such as social technologies, online walls, and learning management systems are primarily used in larger companies with 5000+ employees. Around half of the companies use social media for knowledge sharing, e.g. LinkedIn, RSS feeds, Twitter, Facebook and Lotus Quick. Only two companies use social book marking. The companies make use of both of the dominant approaches to knowledge sharing, the cognitive model for knowledge sharing where knowledge is codified and transferred through text and information systems and the community model where knowledge is transferred through participation and interaction using web 2.0 technologies (Swan, Newell, Robertson, 2000). The idea behind the cognitive model is reuse of knowledge, built on the assumption that information is ready to use. Information does not need revision, negotiation or contextualization. The community approach highlights the importance of dialogue, relationships, shared understandings, and interactive formation of new knowledge. The two approaches are sometimes contrasted as issues of knowledge exploitation and knowledge exploration. Their use depends on purpose and tasks e.g. previous findings show that especially knowledge intensive companies codify and reuse knowledge (McAfee, 2009). In practice as well as theory the community model has often been under-emphasized (Swan, Newell, Robertson, 2000). In the present study the large companies with 5000+ employees make use of both approaches. The two IT companies tend to have the most advanced usage. Not surprising because they develop knowledge management solutions. Summing up, the survey specifies importance of rich expertise descriptions, with practical contact information, descriptive information about skills and credibility, and behavioral data about activities, documents, networks and preferences. The findings furthermore point to a combination of expertise codification and expertise networking through social media. Codification establishes knowledge about expertise and allows employees to find and get to know the expert before making
14
a connection. Networking builds and bridge connections, also to weak ties that are often considered to provide most innovation and knowledge sharing (Ehrlich, 2003). Both approaches face challenges and require careful planning. Codification should be consistent and describe expertise with domain-specific, up-to-date vocabulary. A taxonomy may be a useful tool to ensure precise and relevant description (Ehrlich, 2003). Networking requires time, trust, and recognition from management to work well (Ardichvill, Page & Wentling, 2003; Paroutis & Saleh, 2009). Procedures, common practice and proactive ‘network gardeners’ are essential for success. Tools are needed that bridge between the expert finding systems and the social communication technologies. Question-answering services may be such a tool, dynamic clouds of descriptive tags integrated in the corporate search engine, e-mails, signatures may be another tool. Future research should focus on development and design of tools that bridge between codification and networking. Tools leading from expertise finding to expertise formation. Literature Ardichvili, A., Page, V. & Wentling, T. (2003). Motivations and barriers to participation in virtual knowledge-sharing communities of practice. Journal of Knowledge Management, 7 (1). 64 – 77. Baruch, Y. & Holtom, B. C. (2008). Survey response rate levels and trends in organizational research. Human Relations, 61 (8). 1139 – 1160. Ehrlich, K. (2003). Locating expertise: design issues for an expertise locator system. In: Ackerman, et al. (eds.): Sharing expertise: Beyond knowledge management. 135 – 158. Harzig, A-W (1996). Response rates in international mail surveys. Results of a 22-country study. Available at: http://www.harzing.com/download/resprates.pdf McAfee, A. (2009). Enterprise 2.0. New collaborative tools for your organization’s toughest challenges. Boston: Harvard Business Press. Paroutis, S. & Saleh, A. A. (2009). Determinants of knowledge sharing using Web 2.0 technologies. Journal of Knowledge Management, 13 (4). 52 -63. Saris, W. & Gallhofer, I. N. (2007). Design, evaluation and analysis of questionnaires for survey research. New Jersey (NJ): Hoboken. Swan, J., Newell, S. & Robertson, M. (2000). Limits of IT-driven knowledge management initiatives for interactive innovation processes. In: Proceedings of the 33rd Hawaii International Conference on System Sciences, 2000.