aaron bar - the dynamic wind energy market & the impact on blade technology
TRANSCRIPT
Analyst PRESENTATION
The Dynamic Wind
Energy Market and
Impact on Blade
Technology
Aaron Barr
August 30, 2014
Contents
22016 Sandia Wind Turbine Blade Workshop
August, 2016
Global wind energy market dynamics
– Long-term market forecast by region
– Long term United States demand driven by PTC extension
– Economies of scale accelerate LCOE gains in North America
– Traditional markets to drive installs, while new markets emerge
Blade market and technology trends
– Recent mergers and acquisitions will impact blade technology
– Historically MW-limited markets see 3MW movement
– Best in class products defined by blades
– Modular portfolio strategies lead to rapid turbine proliferation
– Blade lengths will continue to grow in all regions
– Blade technology prospects and impact on LCOE
– Blades a central focus of O&M technology development

Delivering renewableenergy insight
8 September 2016 3
Global wind energy
market dynamics
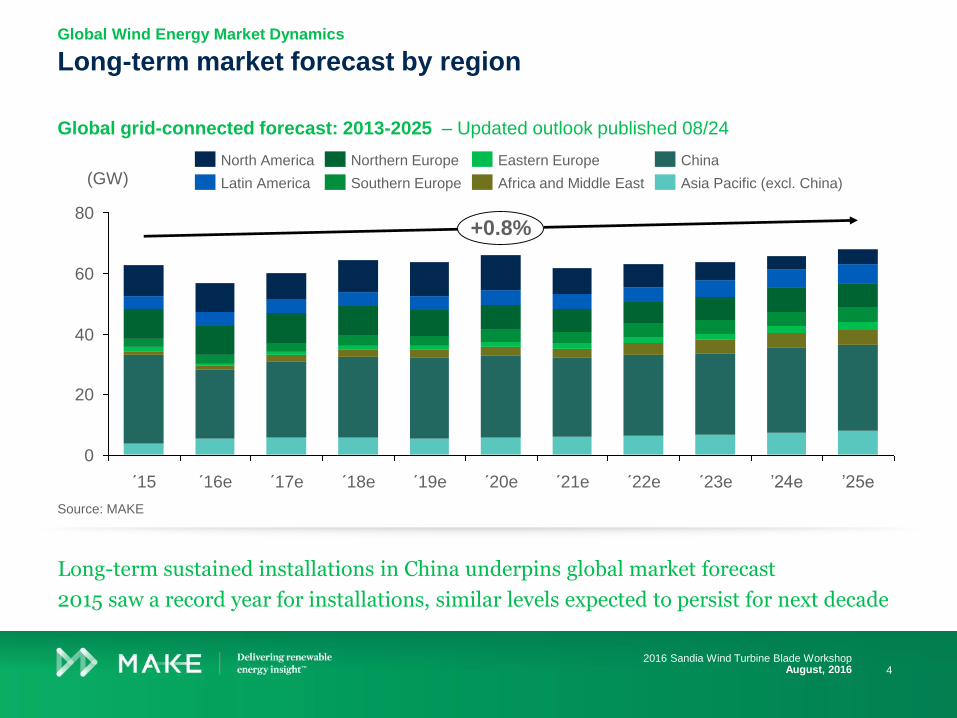
Global grid-connected forecast: 2013-2025 – Updated outlook published 08/24
Long-term market forecast by regionGlobal Wind Energy Market Dynamics
Source: MAKE
Long-term sustained installations in China underpins global market forecast
2015 saw a record year for installations, similar levels expected to persist for next decade
42016 Sandia Wind Turbine Blade Workshop
August, 2016
80
40
20
60
0
´20e´18e´15
+0.8%
´23e´22e
(GW)
´21e´19e´17e´16e ’24e ’25e
China
Latin America Southern Europe
North America
Asia Pacific (excl. China)Africa and Middle East
Northern Europe Eastern Europe

United States market outlook, 2013-2025e (GW) – Updated outlook published 08/24
Long term United States demand driven by PTC extensionGlobal Wind Energy Market Dynamics
52016 Sandia Wind Turbine Blade Workshop
August, 2016
0
2
12
6
10
4
8
GW
Grid
Co
nn
ecte
d
+14%-31%
-22%-17%
-26%+9%
2024e
+24%
2025e
+4%
-11%
2023e2018e 2019e 2022e2017e 2020e2015 2021e2016e
StrongerWeaker
Transmission
PTC
Retirements
LCOE
C&I demand
CPP/RES
Gas prices
Solar power
Ba
rrie
rsD
rive
rs

Regional economies of scale in North America
Economies of scale accelerate LCOE gains in North America
Contributors and benefits of regional scale
Global Wind Energy Market Dynamics
Contributors to regional growth and scale
Excellent and consistent wind resources
Limited terrain complexity – flat sites
Large tracts of land with few constraints
Infrastructure – transmission and rail
Local supply chain – turbines, services, equipment
Benefits of regional scale
Capital equipment savings – local network of cranes,
trucks and equipment
Turbine pricing – Familiarity reduces risk to OEMs
and allows for lower turbine pricing
BOP pricing – well understood foundation and road
design and construction reduces BOP costs
Experience – Money and time savings due to
experienced local network of installers
O&M savings – Highly trained and fluid network of
technicians lead to cost savings in maintenanceNote: Unsubsidized LCOE. Local assumptions for debt, equity, CAPEX, CF, wind
Source; MAKE
Installation centers of Texas and the Midwest benefit from experience of 17+ GW
LCOE lessons learned from the “Wind Belt” are now being applied to emerging markets
62016 Sandia Wind Turbine Blade Workshop
August, 2016
30
35
40
45
50
55
60
65
70
75
80
85
90
0 2 4 6 8 10 12 14 16 18 20 22 24
LC
OE
–U
SD
/MW
h
Midwest
66
Total cumulative GW
83
Northeast
47
58
Texas
Canada
US Average
2015 annual
installations (GW)
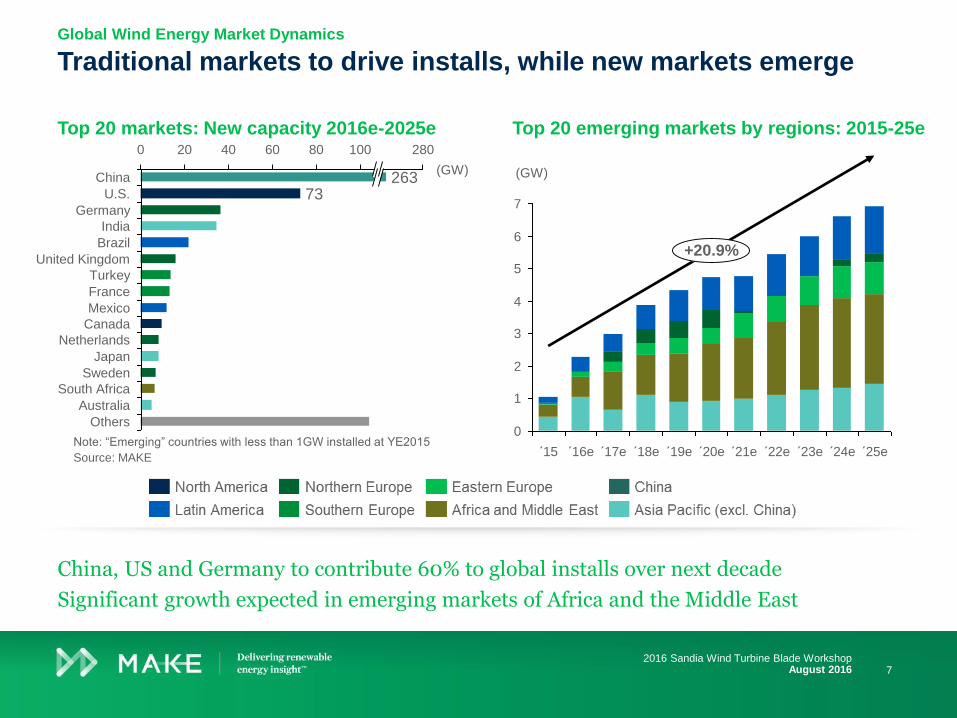
Top 20 markets: New capacity 2016e-2025e
Traditional markets to drive installs, while new markets emerge
Top 20 emerging markets by regions: 2015-25e
Global Wind Energy Market Dynamics
Note: “Emerging” countries with less than 1GW installed at YE2015
Source: MAKE
China, US and Germany to contribute 60% to global installs over next decade
Significant growth expected in emerging markets of Africa and the Middle East
72016 Sandia Wind Turbine Blade Workshop
August 2016
0 20 40 60 28010080
Canada
France
South Africa
(GW)
Netherlands
Turkey
Sweden
Australia
Others
Mexico
India
Japan
Brazil
Germany
U.S.
China
United Kingdom
73263
7
6
5
4
3
2
0
1
+20.9%
´25e´24e´23e´22e´21e´20e´17e ´18e´16e´15 ´19e
(GW)
Delivering renewableenergy insight
8 September 2016 8
Blade market and
technology trends

Diverging technical paths within OEM M&A
Recent mergers and acquisitions will impact blade technology
Technology acquisitions to secure blade IP
Lower
CAPEXVarious options
Higher
CAPEX
Blade
Materials Glass Carbon
Blade
Sourcing3rd party
suppliers
Vertically
integrated
Blade
StructureShells
& web
Single
infusion
Pitch
Systems Electric Hydraulic
Converter
TypesPartial
Power
Full
Power
Tower
technology Steel Concrete
Blade market and technology trends
Source: MAKE, Espacenet
Only includes USPTO filings made prior to acquisitions
Looming industry consolidation will force tough technical choices in blade technology
M&A will lead to restriction of some blade innovation through exclusive access to IP
92016 Sandia Wind Turbine Blade Workshop
August 2016
NordexAccionaGamesaSiemens
8 20
3
11
7
18Modwind
Patent
Applications
Rodpack
Granted
Patents
29
Blade
Dynamics
10
28GE acquired
Deployment TBD
Vestas acquired
Not evident in products
Senvion acquired
Use in offshore 74.4m blade,
Note: CAPEX: Capital expenditure on either component or factory level

Orders for 3MW products on the rise in US
Historically MW-limited markets see 3MW movement
3MW capacity factors are catching up
Blade market and technology trends
Note: Orders shown only include those with known turbine types
Orders shown may not include balance of PTC Safe Harbor orders
Note: Gross capacity factor at 8.5m/s
Construction cost given at a plant level – 150MW plant assumed
BOP and O&M cost savings for larger turbines, combined with economies of scale have blurred the lines between MW-limited and turbine-limited markets
102016 Sandia Wind Turbine Blade Workshop
August, 2016
0%
10%
20%
30%
40%
50%
60%
70%
80%
90%
100%
Announced
Orders*
4,80212,870
20142012
8,402*
2013
8,5891,128
2015
>3.5MW2.3-2.791.0-1.79MW 1.8-2.29 2.8-3.49
58.4
55.7 55.7
V110-2.0
-5%
58.4
V136-3.45
3.XMW
-6%
2.XMW
Construction cost savings are significant
150
200
250
300
350
1.5 2.0 2.5 3.0 3.5 4.0 4.5
Specific
Rating
(W
/m2)
MW Rating
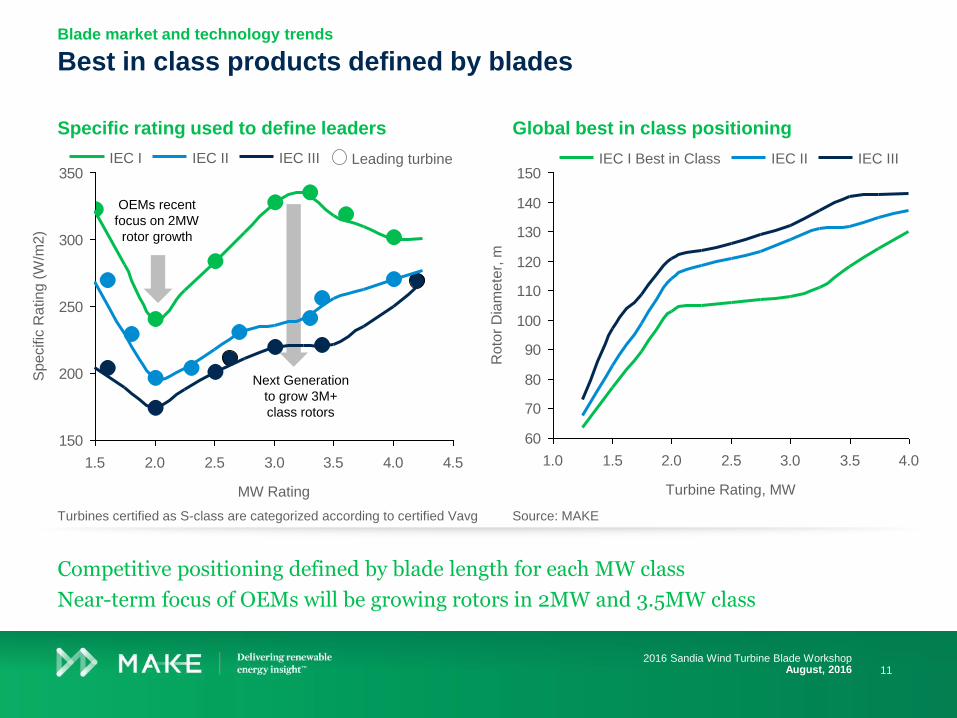
Specific rating used to define leaders
Best in class products defined by blades
Global best in class positioning
Blade market and technology trends
Competitive positioning defined by blade length for each MW class
Near-term focus of OEMs will be growing rotors in 2MW and 3.5MW class
112016 Sandia Wind Turbine Blade Workshop
August, 2016
IEC I IEC IIIIEC II Leading turbine
OEMs recent
focus on 2MW
rotor growth
Next Generation
to grow 3M+
class rotors
60
70
80
90
100
110
120
130
140
150
1.0 1.5 2.0 2.5 3.0 3.5 4.0
Ro
tor
Dia
me
ter,
mTurbine Rating, MW
IEC I Best in Class IEC II IEC III
Source: MAKETurbines certified as S-class are categorized according to certified Vavg
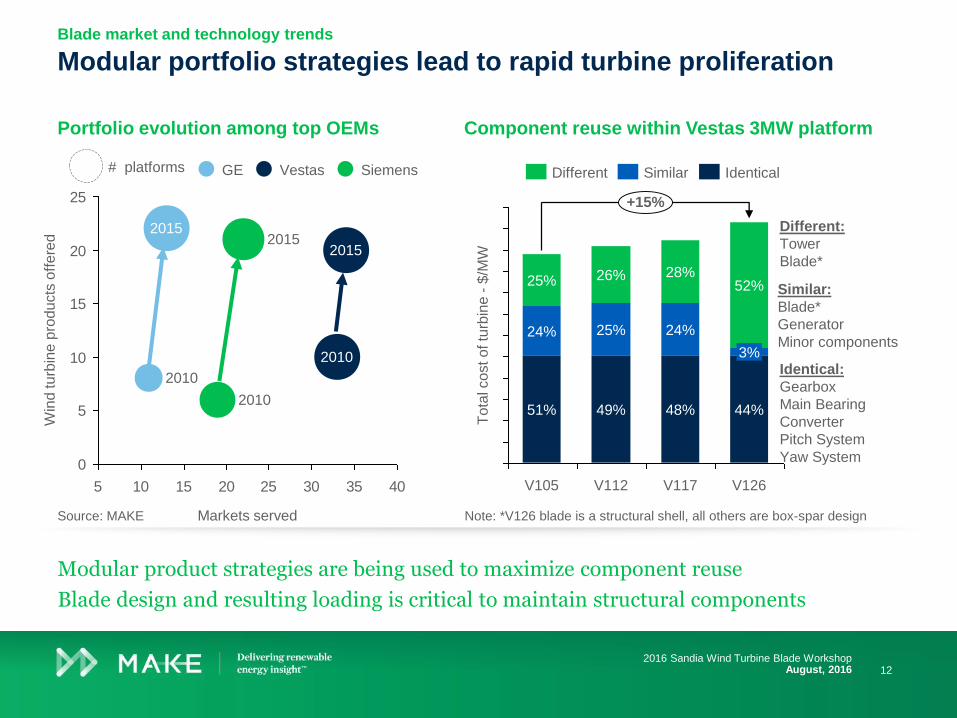
Portfolio evolution among top OEMs
Modular portfolio strategies lead to rapid turbine proliferationBlade market and technology trends
Modular product strategies are being used to maximize component reuse
Blade design and resulting loading is critical to maintain structural components
122016 Sandia Wind Turbine Blade Workshop
August, 2016
Component reuse within Vestas 3MW platform
Note: *V126 blade is a structural shell, all others are box-spar design
0
5
10
15
20
25
5 10 15 20 25 30 35 40
Markets served
2015
2010
2015
2015
2010
2010
Win
d turb
ine p
roducts
off
ere
d
SiemensVestasGE# platforms
Source: MAKE
26%
V105
51%
24%
25%
To
tal co
st o
f tu
rbin
e -
$/M
W
24%
28%
V112
49%
25%
+15%
V126
44%
3%
52%
V117
48%
IdenticalSimilarDifferent
Similar:
Blade*
Generator
Minor components
Identical:
Gearbox
Main Bearing
Converter
Pitch System
Yaw System
Different:
Tower
Blade*
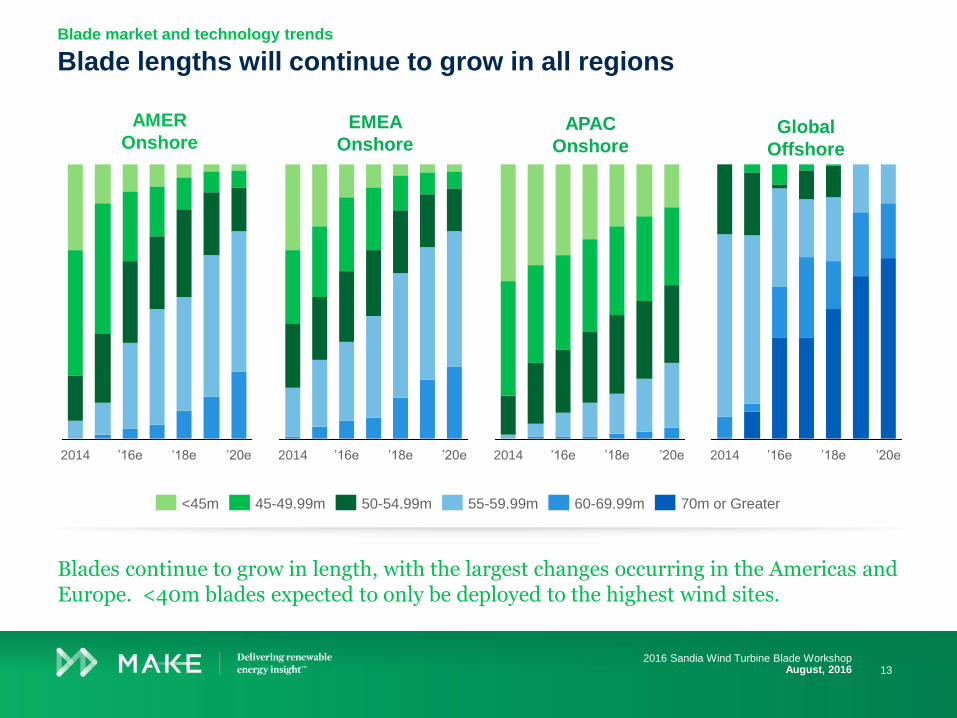
Blade lengths will continue to grow in all regionsBlade market and technology trends
Blades continue to grow in length, with the largest changes occurring in the Americas and Europe. <40m blades expected to only be deployed to the highest wind sites.
132016 Sandia Wind Turbine Blade Workshop
August, 2016
AMER
OnshoreEMEA
OnshoreAPAC
Onshore
2014 ’20e’18e’16e
45-49.99m 70m or Greater60-69.99m<45m 55-59.99m50-54.99m
’20e’16e ’18e2014 ’16e ’18e2014 ’20e ’20e2014 ’16e ’18e
Global
Offshore
0
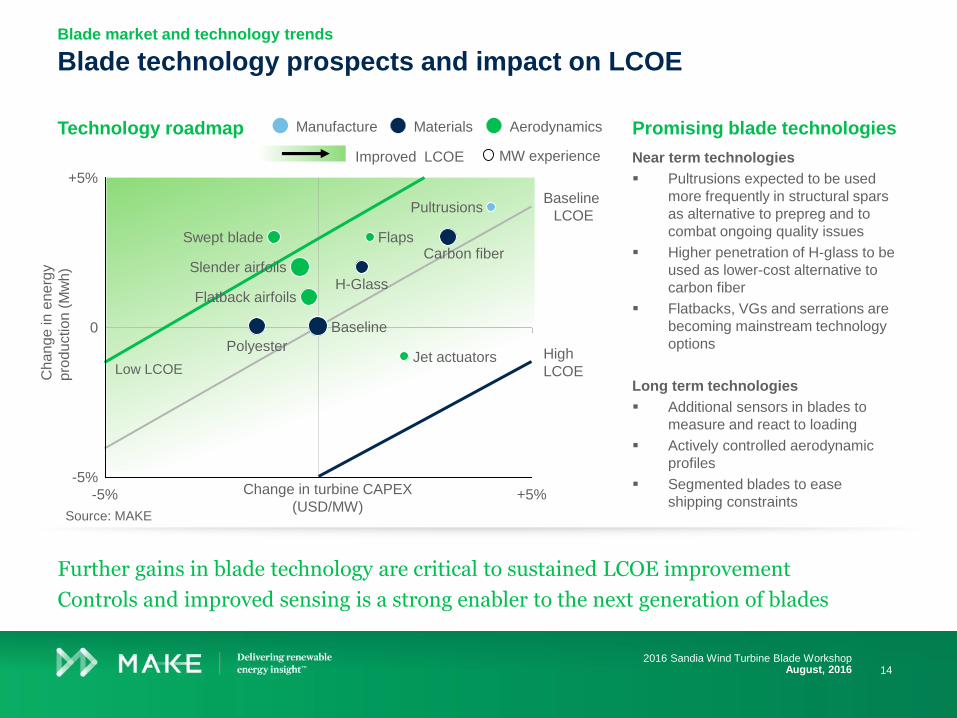
High
LCOE
Baseline
LCOE
-5% +5%
-5%
+5%
Carbon fiber
Baseline
Flatback airfoils
Swept blade
Slender airfoils
Jet actuators
Flaps
Polyester
H-Glass
Pultrusions
Technology roadmap Promising blade technologies
Near term technologies
Pultrusions expected to be used
more frequently in structural spars
as alternative to prepreg and to
combat ongoing quality issues
Higher penetration of H-glass to be
used as lower-cost alternative to
carbon fiber
Flatbacks, VGs and serrations are
becoming mainstream technology
options
Long term technologies
Additional sensors in blades to
measure and react to loading
Actively controlled aerodynamic
profiles
Segmented blades to ease
shipping constraints
Blade technology prospects and impact on LCOEBlade market and technology trends
Source: MAKE
Further gains in blade technology are critical to sustained LCOE improvement
Controls and improved sensing is a strong enabler to the next generation of blades
142016 Sandia Wind Turbine Blade Workshop
August, 2016
Chang
e in e
nerg
y
pro
du
ction
(M
wh)
Change in turbine CAPEX
(USD/MW)
Improved LCOE MW experience
AerodynamicsManufacture Materials
Low LCOE
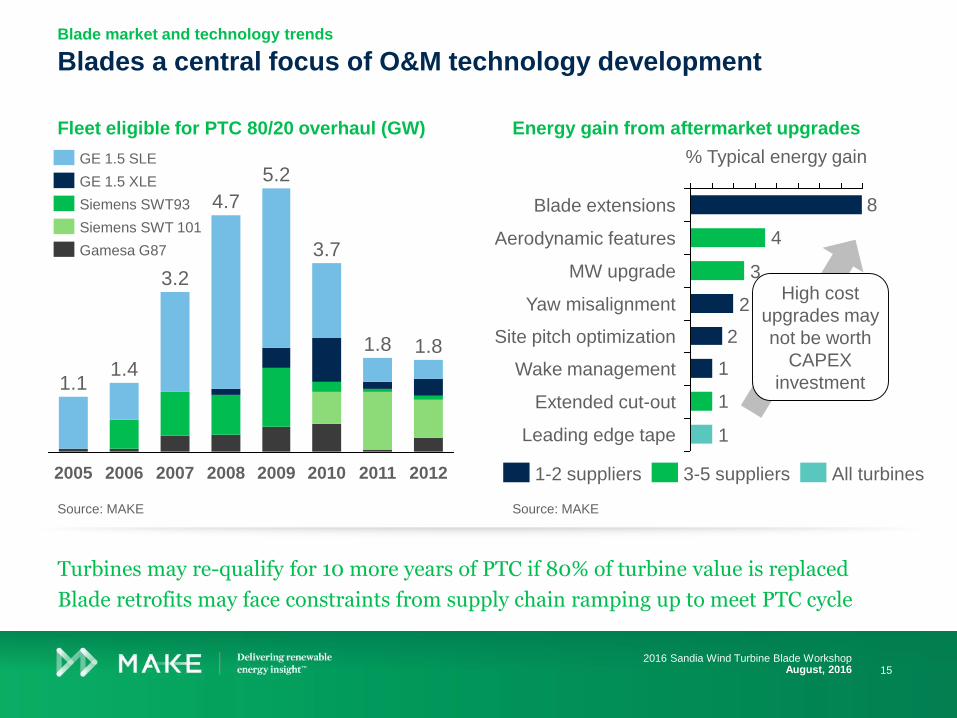
Fleet eligible for PTC 80/20 overhaul (GW)
Blades a central focus of O&M technology development
Energy gain from aftermarket upgrades
Blade market and technology trends
Source: MAKE Source: MAKE
Turbines may re-qualify for 10 more years of PTC if 80% of turbine value is replaced
Blade retrofits may face constraints from supply chain ramping up to meet PTC cycle
152016 Sandia Wind Turbine Blade Workshop
August, 2016
1.1
5.2
3.2
2006 2009
4.7
1.8
2005
1.8
2011 20122010
3.7
20082007
1.4
Siemens SWT 101
Siemens SWT93
GE 1.5 SLE
GE 1.5 XLE
Gamesa G87
1
1
1
2
2
3
4
8
% Typical energy gain
Leading edge tape
Extended cut-out
Wake management
Site pitch optimization
Yaw misalignment
MW upgrade
Aerodynamic features
Blade extensions
All turbines3-5 suppliers1-2 suppliers
High cost
upgrades may
not be worth
CAPEX
investment
Contact
consultmake.com
© 2016 MAKE Consulting A/S. All rights reserved. Reproduction or distribution of this report in any form without prior written permission is strictly forbidden.
Violation of the above restrictions will be subjects to legal action under the Danish Arbitration Act. The information herein is taken from sources considered
reliable, but its accuracy and completeness are not warranted, nor are the opinions, analyses and forecasts on which they are based. MAKE Consulting A/S
cannot be held liable for any errors in this report, neither can MAKE Consulting A/S be liable for any financial loss or damage caused by the use of the
information presented in this report.
Denmark
Sønder Allé 9
DK-8000
Aarhus
T +45 7026 6628
U.S.
117 N. Jefferson Street
Suite 400
Chicago, IL 60661
T +1 312 441 9590
U.S.
225 Franklin Street
26th floor
Boston, MA 02110
T +1 978 448 3186
China
Level 26, Shanghai
Times Sq. Office Tower,
Shanghai 200021
T +86 21 5117 9329
Germany
Neuer Wall 10
20354
Hamburg
T +49 40 822 15 3111
Aaron Barr
162016 Sandia Wind Turbine Blade Workshop
August, 2016