ab initio phonon coupling and optical response of …€¦ · physical review b 94, 075120 (2016)...
TRANSCRIPT

PHYSICAL REVIEW B 94, 075120 (2016)
Ab initio phonon coupling and optical response of hot electrons in plasmonic metals
Ana M. Brown,1 Ravishankar Sundararaman,2 Prineha Narang,1,2,3 William A. Goddard III,2,4 and Harry A. Atwater1,2
1Thomas J. Watson Laboratories of Applied Physics, California Institute of Technology, Pasadena, California 91125, USA2Joint Center for Artificial Photosynthesis, California Institute of Technology, Pasadena, California 91125, USA
3NG NEXT, 1 Space Park Drive, Redondo Beach, California 90278, USA4Materials and Process Simulation Center, California Institute of Technology, Pasadena, California 91125, USA
(Received 1 February 2016; revised manuscript received 26 July 2016; published 11 August 2016)
Ultrafast laser measurements probe the nonequilibrium dynamics of excited electrons in metals with increasingtemporal resolution. Electronic structure calculations can provide a detailed microscopic understanding of hotelectron dynamics, but a parameter-free description of pump-probe measurements has not yet been possible,despite intensive research, because of the phenomenological treatment of electron-phonon interactions. Wepresent ab initio predictions of the electron-temperature dependent heat capacities and electron-phonon couplingcoefficients of plasmonic metals. We find substantial differences from free-electron and semiempirical estimates,especially in noble metals above transient electron temperatures of 2000 K, because of the previously neglectedstrong dependence of electron-phonon matrix elements on electron energy. We also present first-principlescalculations of the electron-temperature dependent dielectric response of hot electrons in plasmonic metals,including direct interband and phonon-assisted intraband transitions, facilitating complete theoretical predictionsof the time-resolved optical probe signatures in ultrafast laser experiments.
DOI: 10.1103/PhysRevB.94.075120
I. INTRODUCTION
Understanding the energy transfer mechanisms during ther-mal nonequilibrium between electrons and the lattice is criticalfor a wide array of applications. Nonequilibrium electronproperties on time scales of 10 s–100 s of femtoseconds aremost efficiently observed with pulsed laser measurement tech-niques [1–7]. Laser irradiation of a metal film or nanostructurewith an ultrashort laser pulse pushes the electron gas out ofequilibrium; describing the evolution of this nonequilibriumdistribution has been the subject of intense research for twodecades. A majority of investigations so far employ various ap-proximate models, typically based on free-electron models andempirical electron-phonon interactions, to calculate the energyabsorption, electron-electron thermalization, and electron-phonon relaxation [8–19]. However, a complete ab initiodescription of the time evolution and optical response of thisnonequilibrium electron gas from femtosecond to picosecondtime scales has remained elusive, especially because of theempirical treatment of electron-phonon interactions [20].
The initial electron thermalization via electron-electronscattering is qualitatively described within the Landau theoryof Fermi liquids [21–24]. The subsequent relaxation of the hightemperature electron gas with the lattice is widely describedby the two-temperature model (TTM) [1,5–7,17,20], givenby coupled differential equations for the electron and latticetemperatures, Te and Tl ,
Ce(Te)dTe
dt= ∇ · (κe∇Te) − G(Te) × (Te − Tl) + S(t),
Cl(Tl)dTl
dt= ∇ · (κp∇Tl) + G(Te) × (Te − Tl). (1)
Here, κe and κp are the thermal conductivities of the electronsand phonons, G(Te) is the electron-phonon coupling factor,Ce(Te) and Cl(Tl) are the electronic and lattice heat capacities,and S(t) is the source term which describes energy depositionby a laser pulse. In nanostructures, the temperatures become
homogeneous in space rapidly and the contributions of thethermal conductivities drop out. A vast majority of studies,both theoretical and experimental, treat the remaining materialparameters, G(Te), Ce(Te), and Cl(Tl), as phenomenologicaltemperature-independent constants [25–32].
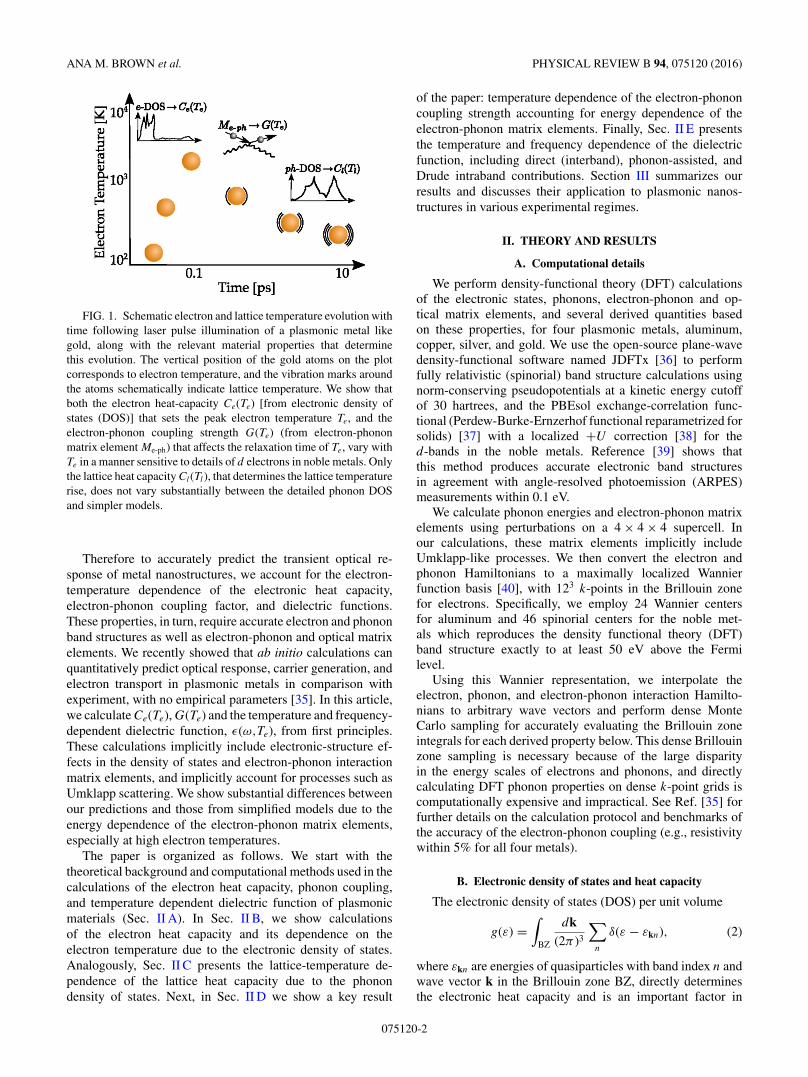
Figure 1 schematically shows the time evolution of theelectron and lattice temperatures in a plasmonic metal likegold, and the role of the temperature-dependent materialproperties. The electronic density of states and the resultantelectronic heat capacity Ce(Te) determine the peak electrontemperature Te reached after electron-electron thermalization.The electron-phonon matrix elements and the resulting cou-pling strength G(Te) determine the rate of energy transfer fromthe electrons to the lattice, which along with Ce(Te) determinesthe rate of relaxation of Te. Finally, the phonon density of statesand the resulting lattice heat capacity Cl(Tl) determine the risein lattice temperature Tl .
A key challenge in the quantitative application of TTMmodels is the determination of these temperature-dependentmaterial parameters. With pulsed lasers, it is possible toabsorb sufficient energy in plasmonic nanostructures to meltthe metal once the electrons and lattice have equilibrated[33]. The highest electron temperature, T max
e , accessible inrepeatable measurements is therefore limited only by theequilibrated lattice temperature being less than the meltingtemperature Tm of the metal [34], which yields the condition∫ T max
e
TmdTeCe(Te) = ∫ Tm
T0dTlCl(Tl). Starting at room tempera-
ture T0 = 300 K and using our calculations of the electron andlattice heat capacities, Ce(Te) and Cl(Tl), we find T max
e ≈ 5700,8300, 7500, and 6700 K, respectively, for aluminum, silver,gold, and copper. For gold and copper in particular, thesetemperatures are sufficient to change the occupations of thed-bands ∼2 eV below the Fermi level. Consequently, it isimportant to derive the temperature dependence of thesematerial parameters from electronic structure calculationsrather than free-electron like models [20].
2469-9950/2016/94(7)/075120(10) 075120-1 ©2016 American Physical Society
ANA M. BROWN et al. PHYSICAL REVIEW B 94, 075120 (2016)
FIG. 1. Schematic electron and lattice temperature evolution withtime following laser pulse illumination of a plasmonic metal likegold, along with the relevant material properties that determinethis evolution. The vertical position of the gold atoms on the plotcorresponds to electron temperature, and the vibration marks aroundthe atoms schematically indicate lattice temperature. We show thatboth the electron heat-capacity Ce(Te) [from electronic density ofstates (DOS)] that sets the peak electron temperature Te, and theelectron-phonon coupling strength G(Te) (from electron-phononmatrix element Me-ph) that affects the relaxation time of Te, vary withTe in a manner sensitive to details of d electrons in noble metals. Onlythe lattice heat capacity Cl(Tl), that determines the lattice temperaturerise, does not vary substantially between the detailed phonon DOSand simpler models.
Therefore to accurately predict the transient optical re-sponse of metal nanostructures, we account for the electron-temperature dependence of the electronic heat capacity,electron-phonon coupling factor, and dielectric functions.These properties, in turn, require accurate electron and phononband structures as well as electron-phonon and optical matrixelements. We recently showed that ab initio calculations canquantitatively predict optical response, carrier generation, andelectron transport in plasmonic metals in comparison withexperiment, with no empirical parameters [35]. In this article,we calculate Ce(Te), G(Te) and the temperature and frequency-dependent dielectric function, ε(ω,Te), from first principles.These calculations implicitly include electronic-structure ef-fects in the density of states and electron-phonon interactionmatrix elements, and implicitly account for processes such asUmklapp scattering. We show substantial differences betweenour predictions and those from simplified models due to theenergy dependence of the electron-phonon matrix elements,especially at high electron temperatures.
The paper is organized as follows. We start with thetheoretical background and computational methods used in thecalculations of the electron heat capacity, phonon coupling,and temperature dependent dielectric function of plasmonicmaterials (Sec. II A). In Sec. II B, we show calculationsof the electron heat capacity and its dependence on theelectron temperature due to the electronic density of states.Analogously, Sec. II C presents the lattice-temperature de-pendence of the lattice heat capacity due to the phonondensity of states. Next, in Sec. II D we show a key result
of the paper: temperature dependence of the electron-phononcoupling strength accounting for energy dependence of theelectron-phonon matrix elements. Finally, Sec. II E presentsthe temperature and frequency dependence of the dielectricfunction, including direct (interband), phonon-assisted, andDrude intraband contributions. Section III summarizes ourresults and discusses their application to plasmonic nanos-tructures in various experimental regimes.
II. THEORY AND RESULTS
A. Computational details
We perform density-functional theory (DFT) calculationsof the electronic states, phonons, electron-phonon and op-tical matrix elements, and several derived quantities basedon these properties, for four plasmonic metals, aluminum,copper, silver, and gold. We use the open-source plane-wavedensity-functional software named JDFTx [36] to performfully relativistic (spinorial) band structure calculations usingnorm-conserving pseudopotentials at a kinetic energy cutoffof 30 hartrees, and the PBEsol exchange-correlation func-tional (Perdew-Burke-Ernzerhof functional reparametrized forsolids) [37] with a localized +U correction [38] for thed-bands in the noble metals. Reference [39] shows thatthis method produces accurate electronic band structuresin agreement with angle-resolved photoemission (ARPES)measurements within 0.1 eV.
We calculate phonon energies and electron-phonon matrixelements using perturbations on a 4 × 4 × 4 supercell. Inour calculations, these matrix elements implicitly includeUmklapp-like processes. We then convert the electron andphonon Hamiltonians to a maximally localized Wannierfunction basis [40], with 123 k-points in the Brillouin zonefor electrons. Specifically, we employ 24 Wannier centersfor aluminum and 46 spinorial centers for the noble met-als which reproduces the density functional theory (DFT)band structure exactly to at least 50 eV above the Fermilevel.
Using this Wannier representation, we interpolate theelectron, phonon, and electron-phonon interaction Hamilto-nians to arbitrary wave vectors and perform dense MonteCarlo sampling for accurately evaluating the Brillouin zoneintegrals for each derived property below. This dense Brillouinzone sampling is necessary because of the large disparityin the energy scales of electrons and phonons, and directlycalculating DFT phonon properties on dense k-point grids iscomputationally expensive and impractical. See Ref. [35] forfurther details on the calculation protocol and benchmarks ofthe accuracy of the electron-phonon coupling (e.g., resistivitywithin 5% for all four metals).
B. Electronic density of states and heat capacity
The electronic density of states (DOS) per unit volume
g(ε) =∫
BZ
dk(2π )3
∑n
δ(ε − εkn), (2)
where εkn are energies of quasiparticles with band index n andwave vector k in the Brillouin zone BZ, directly determinesthe electronic heat capacity and is an important factor in
075120-2

Ab INITIO PHONON COUPLING AND OPTICAL . . . PHYSICAL REVIEW B 94, 075120 (2016)
0.1
0.2
0.3
0.4
DO
S [1
029 e
V-1
m-3
] (a) Al
PBEsol+U (this work)Lin et al. 2008
free electron 0.5
1
1.5
2
2.5(b) Ag
0
0.5
1
1.5
-10 -5 0 5 10
DO
S [1
029 e
V-1
m-3
]
ε-εF [eV]
(c) Au
0
1
2
3
-10 -5 0 5 10ε-εF [eV]
(d) Cu
FIG. 2. Comparison of electronic density of states for (a) Al,(b) Ag, (c) Au, and (d) Cu from our relativistic PBEsol+U
calculations, previous semilocal PBE DFT calculations [20] (lessaccurate band structure), and a free electron model.
the electron-phonon coupling and dielectric response of hotelectrons. Above, the band index n implicitly counts spinorialorbitals in our relativistic calculations, and hence we omit theexplicit spin degeneracy factor.
Figure 2 compares the DOS predicted by our relativisticPBEsol+U method with a previous nonrelativistic semilocalestimate [20] using the PBE (Perdew-Burke-Ernzerhof) func-tional [41], as well as a free electron model εk = �
2k2
2mefor which
g(ε) =√
ε
2π2 ( 2me
�2 )3/2
. The free electron model is a reasonableapproximation for aluminum and the PBE and PBEsol+U
density-functional calculations also agree reasonably well inthis case (U = 0 for aluminum). The regular 313 k-point gridused for Brillouin zone sampling introduces the sharp artifactsin the DOS from Ref. [20], compared to the much denser MonteCarlo sampling in our calculations with 640 000 k-points forAu, Ag, and Cu, and 1 280 000 k-points for Al.
For the noble metals, the free electron model and thedensity functional methods agree reasonably near the Fermilevel, but differ significantly ∼2 eV below the Fermi levelwhere d-bands contribute. The free electron models ignorethe d-bands entirely, whereas the semilocal PBE calculationspredict d-bands that are narrower and closer to the Fermilevel than the PBEsol+U predictions. The U correction [38]accounts for self-interaction errors in semilocal DFT andpositions the d-bands in agreement with ARPES measure-ments (to within ∼0.1 eV) [39]. Additionally, the DOS in thenonrelativistic PBE calculations strongly peaks at the top ofthe d-bands (closest to the Fermi level), whereas the DOS inour relativistic calculations is comparatively balanced betweenthe top and middle of the d-bands due to strong spin-orbitsplitting, particularly for gold. Below, we find that theseinaccuracies in the DOS due to electronic structure methodspreviously employed for studying hot electrons propagatesto the predicted electronic heat capacity and electron-phononcoupling.
The electronic heat capacity, defined as the derivative of theelectronic energy per unit volume with respect to the electronic
2
4
6
8
Ce
[105 J
/m3 K
] (a) Al
Eq. 3 (this work)Lin et al. 2008
Sommerfeld
4
8
12(b) Ag
0
4
8
12
0 2 4 6 8
Ce
[105 J
/m3 K
]
Te [103 K]
(c) Au
0
5
10
15
20
0 2 4 6 8Te [103 K]
(d) Cu
FIG. 3. Comparison of the electronic heat capacity as a functionof electron temperature, Ce(Te), for (a) Al, (b) Ag, (c) Au, and(d) Cu, corresponding to the three electronic density-of-statespredictions shown in Fig. 2. The free electron Sommerfeld modelunderestimates Ce for noble metals at high Te because it neglectsd-band contributions, whereas previous DFT calculations [20] over-estimate it because their d-bands are too close to the Fermi level.
temperature (Te), can be related to the DOS as
Ce(Te) =∫ ∞
−∞dε g(ε)ε
∂f (ε,Te)
∂Te
, (3)
where f (ε,Te) is the Fermi distribution function. The term∂f/∂Te is sharply peaked at the Fermi energy εF with awidth ∼kBTe, and therefore the heat capacity depends onlyon electronic states within a few kBTe of the Fermi level.For the free electron model, Taylor expanding g(ε) around εF
and analytically integrating (3) yields the Sommerfeld model
Ce(Te) = π2nek2B
2εFTe, which is valid for Te � TF (∼105 K).
Above, ne = 3π2k3F , εF = �
2k2F
2me, and kF are respectively the
number density, Fermi energy, and Fermi wave vector of thefree electron model.
At temperatures Te � TF , the electronic heat capacitiesare much smaller than the lattice heat capacities [5,10,23],which makes it possible for laser pulses to increase Te by103–104 K, while Tl remains relatively constant [6,42,43].Figure 3 compares Ce(Te) from the free-electron Sommerfeldmodel with predictions of (3) using DOS from PBE andPBEsol+U calculations. The free-electron Sommerfeld modelis accurate at low temperatures (up to ∼2000 K) for all fourmetals.
With increasing Te, ∂f/∂Te in (3) is nonzero increasinglyfurther away from the Fermi energy, so that deviationsfrom the free electron DOS eventually become important.For aluminum, the DOS remains free-electron-like over awide energy range and the Sommerfeld model remains validthroughout. For the noble metals, the increase in DOS dueto d-bands causes a dramatic increase in Ce(Te) once Te ishigh enough that ∂f/∂Te becomes nonzero in that energyrange. Copper and gold have shallower d-bands and deviateat lower temperatures compared to silver. Additionally, thed-bands are too close to the Fermi level in the semilocal PBEcalculations of Ref. [20], which results in an overestimation of
075120-3

ANA M. BROWN et al. PHYSICAL REVIEW B 94, 075120 (2016)
60
120
180
240
300
DO
S [1
029 e
V-1
m-3
]
(a) AlEq. 4 (this work)Debye
60
120
180
240
300(b) Ag
0
60
120
180
240
0 0.02 0.04 0.06
DO
S [1
029 e
V-1
m-3
]
ε [eV]
(c) Au
0
60
120
180
240
0 0.02 0.04 0.06ε [eV]
(d) Cu
FIG. 4. Comparison of DFT-calculated phonon density of statesand the Debye model for (a) Al, (b) Ag, (c) Au, and (d) Cu.
Ce(Te) compared to our predictions based on the more accuraterelativistic PBEsol+U method.
C. Phonon density of states and lattice heat capacity
Similarly, the phonon DOS per unit volume
D(ε) =∫
BZ
dq(2π )3
∑α
δ(ε − �ωqα), (4)
where �ωqα are energies of phonons with polarization index α
and wave vector q, directly determines the lattice heat capacity,
Cl(Tl) =∫ ∞
0dε D(ε)ε
∂n(ε,Tl)
∂Tl
, (5)
where n(ε,Tl) is the Bose occupation factor.Within the Debye model, the phonon energies are ap-
proximated by an isotropic linear dispersion relation ωqα =vαq up to a maximum Debye wave vector qD chosen toconserve the number of phonon modes per unit volume.This model yields the analytical phonon DOS, D(ε) =
ε2
(2π2)
∑α θ (�qDvα − ε)/(�vα)3, where vα = {vL,vT ,vT } are
the speeds of sound for the one longitudinal and two degeneratetransverse phonon modes of the face-centered cubic metalsconsidered here [34].
Figure 4 compares the DFT-calculated phonon DOS withthe Debye model predictions, and shows that the Debye modelis a good approximation for the DOS only up to 0.01 eV.However, Fig. 5 shows that the corresponding predictions forthe lattice heat capacities are very similar, rapidly approachingthe equipartition theorem prediction of Cl = 3kB/� at hightemperatures, which is insensitive to details in the phononDOS. In fact, the largest deviations of the Debye model arebelow 100 K and less than 10% from the direct calculations forall four metals. We therefore find that a simple model of thephonons is adequate for predicting the lattice heat capacity, incontrast to the remaining quantities we consider below whichare highly sensitive to details of the phonons and their couplingto the electrons.
10
20
30
40
Cl [
105 J
/m3 K
] (a) Al
Eq. 5 (this work)Debye
10
20
30
40(b) Ag
0
10
20
30
0 0.5 1 1.5 2
Cl [
105 J
/m3 K
]
Tl [103 K]
(c) Au
0
10
20
30
0 0.5 1 1.5 2Tl [103 K]
(d) Cu
FIG. 5. Comparison of DFT and Debye model predictions of thelattice heat capacity as a function of lattice temperature, Cl(Tl), for(a) Al, (b) Ag, (c) Au, and (d) Cu. Despite large differences in thedensity of states (Fig. 4), the predicted lattice heat capacities of thetwo models agree within 10%.
D. Electron-phonon coupling
In Sec. II B we have shown that the electronic heat capacity,which determines the initial temperature that the hot electronsequilibrate to, is sensitive to electronic structure especiallyin noble metals at high Te where d-bands contribute. Nowwe analyze the electron-phonon coupling which determinesthe subsequent thermalization of the hot electrons with thelattice. We show that details in the electron-phonon matrixelements calculated using DFT also play a significant role, inaddition to the electronic band structure, and compare previoussemiempirical estimates of the Te-dependent phonon couplingto our direct calculations.
The rate of energy transfer from electrons at temperatureTe to the lattice (phonons) at temperature Tl per unit volumeis given by Fermi’s golden rule as
dE
dt≡ G(Te)(Te − Tl)
= 2π
�
∫BZ
�dk dk′
(2π )6
∑nn′α
δ(b − �ωk′−k,α)
× �ωk′−k,α
∣∣gk′−k,αk′n′,kn
∣∣2STe,Tl
(εkn,εk′n′ ,�ωk′−k,α), (6)
with
STe,Tl(ε,ε′,�ωph) ≡ f (ε,Te)n(�ωph,Tl)(1 − f (ε′,Te))
− (1 − f (ε,Te))(1 + n(�ωph,Tl))f (ε′,Te).
(7)
Here, � is the unit cell volume, �ωqα is the energy of a phononwith wave vector q = k′ − k and polarization index α, andg
k′−k,αk′n′,kn is the electron-phonon matrix element coupling this
phonon to electronic states indexed by kn and k′n′.Above, S is the difference between the product of oc-
cupation factors for the forward and reverse directions ofthe electron-phonon scattering process kn + qα → k′n′, withf (ε,Te) and n(�ω,Tl) being the Fermi and Bose distribution
075120-4

Ab INITIO PHONON COUPLING AND OPTICAL . . . PHYSICAL REVIEW B 94, 075120 (2016)
function for the electrons and phonons, respectively. Usingthe fact that STe,Te
= 0 for an energy-conserving processε + �ωph = ε′ by detailed balance, we can write the electron-phonon coupling coefficient as
G(Te) = 2π
�
∫BZ
�dk dk′
(2π )6
∑nn′α
δ(εk′n′ − εkn − �ωk′−k,α)
× �ωk′−k,α
∣∣gk′−k,αk′n′,kn
∣∣2(f (εkn,Te) − f (εk′n′ ,Te))
× n(�ωk′−k,α,Te) − n(�ωk′−k,α,Tl)
Te − Tl
. (8)
This general form for DFT-based electronic and phononicstates is analogous to previous single-band/free electrontheories of the electron-phonon coupling coefficient; see,for example, the derivation by Allen et al. [44]. Note thatunlike previous empirical models, here the coupling coefficientdepends on the lattice temperature Tl as well, but we omit theTl label in G(Te) to keep the notation consistent with previousapproaches [20], and present results below for Tl = 298 K(ambient temperature).
The direct evaluation of G(Te) using (8) requires a six-dimensional integral over electron-phonon matrix elementsfrom DFT with very fine k-point grids that can resolve bothelectronic and phononic energy scales. This is impracticalwithout the recently developed Wannier interpolation andMonte Carlo sampling methods for these matrix elements[35,45], and therefore our results are the first parameter-freepredictions of G(Te), derived entirely from DFT.
Previous theoretical estimates of G(Te) are semiempirical,combining DFT electronic structure with empirical modelsfor the phonon coupling. For example, Wang et al. [46]assume that the electron-phonon matrix elements averagedover scattering angles is independent of energy and that thephonon energies are smaller than kBTe, and then approximatethe electron-phonon coupling coefficient as
G(Te) ≈ πkB
�g(εF )λ〈(�ω)2〉
∫ ∞
−∞dε g2(ε)
−∂f (ε,Te)
∂ε, (9)
where λ is the electron-phonon mass enhancement parameterand 〈(�ω)2〉 is the second moment of the phonon spectrum[8,20,47]. Lin et al. [20] treat λ〈(�ω)2〉 as an empiricalparameter calibrated to experimental G(Te) at low Te obtainedfrom thermoreflectance measurements, and extrapolate it tohigher Te using (9). See Refs. [46] and [20] for more details.
For clarity, we motivate here a simpler derivation of anexpression of the form of (9) from the general form (8). First,making the approximation �ωqα � Te (which is reasonablyvalid for Te above room temperature) allows us to approximatethe difference between the electron occupation factors in thesecond line of (8) by �ωqα∂f/∂ε (using energy conservation).Additionally, for Te Tl , the third line of (8) simplifiesto kB/(�ωk′−k,α). With no other approximations, we canthen rearrange (8) to collect contributions by initial electronenergy,
G(Te) ≈ πkB
�g(εF )
∫ ∞
−∞dε h(ε)g2(ε)
−∂f (ε,Te)
∂ε, (10)
0
200
400
600
800
-10 -5 0 5
h(ε)
[meV
2 ]
ε-εF [eV]
(a) Al
Eq. 11 (this work)Lin et al. 2008
0
50
100
150
-6 -3 0 3ε-εF [eV]
(b) Ag
0
15
30
45
60
-8 -4 0
h(ε)
[meV
2 ]
ε-εF [eV]
(c) Au
0
50
100
150
200
250
300
-8 -4 0 4ε-εF [eV]
(d) Cu
FIG. 6. Energy-resolved electron-phonon coupling strength h(ε),defined by (11), for (a) Al, (b) Ag, (c) Au, and (d) Cu. For the noblemetals, h(εF ) is substantially larger than its value in the d-bands,which causes previous semiempirical estimates [20] using a constanth(ε) to overestimate the electron-phonon coupling [G(Te)] at Te �3000 K, as shown in Fig. 7.
with
h(ε) ≡ 2g(εF )
g2(ε)
∫BZ
�dk dk′
(2π )6
∑nn′α
δ(ε − εkn)
× δ(εk′n′ − εkn − �ωk′−k,α)�ωk′−k,α
∣∣gk′−k,αk′n′,kn
∣∣2. (11)
Therefore, the primary approximation in previous semiem-pirical estimates [20,46] is the replacement of h(ε) by anenergy-independent constant λ〈(�ω)2〉, used as an empiricalparameter.
Figure 6 compares our calculations of this energy-resolvedelectron-phonon coupling strength, h(ε), with previous empir-ical estimates of λ〈(�ω)2〉, and Fig. 7 compares the resultingtemperature dependence of the electron-phonon coupling,G(Te), from (8) and semiempirical methods (9). For noblemetals, G(Te) increases sharply beyond Te ∼ 3000 K becauseof the large density of states in the d-bands. However, h(ε) issmaller by a factor of 2–3 in the d-bands compared to nearthe Fermi level. Therefore, assuming h(ε) to be an empiricalconstant [17,20] results in a significant overestimate of G(Te)at high Te, compared to the direct calculations. Additionally,the shallowness of the d-bands in the semilocal PBE bandstructure used in Ref. [20] lowers the onset temperature ofthe increase in G(Te), and results in further overestimationcompared to our predictions.
Our predictions agree very well with the experimentalmeasurements of G(Te) available at lower temperatures fornoble metals [3,14,15,32,48]. In fact, the semiempirical calcu-lation based on λ〈(�ω)2〉 underestimates the room temperatureelectron-phonon coupling for these metals; the significantoverestimation of G(Te) seen in Fig. 7 is despite this partialcancellation of error. This shows the importance of detailedDFT electron-phonon matrix elements in calculating thecoupling between hot electrons and the lattice.
Experimental measurements of the electron-phonon cou-pling in noble metals are reliable because of the reasonably
075120-5

ANA M. BROWN et al. PHYSICAL REVIEW B 94, 075120 (2016)
2
4
6
8
G [1
017 W
/m3 K
] (a) AlEq. 8 (this work)Lin et al. 2008Hostetler et al. 1999
0.2
0.4
0.6
0.8(b) Ag
Eq. 8 (this work)Lin et al. 2008Groeneveld et al. 1990Groeneveld et al. 1995
0
0.4
0.8
1.2
0 2 4 6 8
G [1
017 W
/m3 K
]
Te [103 K]
(c) Au
Eq. 8 (this work)Lin et al. 2008Hostetler et al. 1999Hohlfeld et al. 2000
0
2
4
0 2 4 6 8Te [103 K]
(d) Cu
Eq. 8 (this work)Lin et al. 2008Elsayed-Ali et al. 1987Hohlfeld et al. 2000
FIG. 7. Comparison of predictions of the electron-phonon cou-pling strength as a function of electron temperature, G(Te), for (a) Al,(b) Ag, (c) Au, and (d) Cu, with experimental measurements whereavailable [3,14,15,32,48]. The DFT-based semiempirical predictionsof Lin et al. [20] overestimate the coupling for noble metalsat high temperatures because they assume an energy-independentelectron-phonon coupling strength (Fig. 6) and neglect the weakerphonon coupling of d-bands compared to the conduction band.The experimental results (and hence the semiempirical predictions)for aluminum underestimate electron-phonon coupling because theyinclude the effect of competing electron-electron thermalizationwhich happens on the same time scale.
clear separation between a fast electron-electron thermal-ization rise followed by a slower electron-phonon decay inthe thermoreflectance signal. In aluminum, these time scalessignificantly overlap resulting in strong nonequilibrium effectsand making experimental determination of the equilibriumelectron-phonon coupling G(Te) difficult. Consequently, thevalue of G(Te) for Al is not well agreed upon [32,49].Using a simplified single-band free-electron-like model ofthe electrons, Ref. [50] estimates G ≈ 2.9 × 10⁷ W/m3K forthermalized electrons at 2000 K, which is 1.5× larger than
G ≈ 1.9 × 10⁷ W/m3K for nonthermalized electrons withthe same amount of energy. In Fig. 7(a), our predictionsusing (8) which assumes equilibrium are 2× larger thanthe experimental estimates [32] which implicitly include thenonequilibrium effects. On the other hand, the semiempiricalmodel of Ref. [20] assumes thermalized electrons, but fitsto experimental data that includes nonthermal effects (andmatches experiment by construction). The single-band-modelnonequilibrium predictions do not match experiment becauseit assumes a simple model for electron-phonon matrix elementsthat ignores Umklapp processes [50]. Ultimately, quantitativeagreement with experiments for aluminum (for the rightreasons) therefore requires an extension of our nonempiricalDFT approach (8) to include nonequilibrium effects, a subjectof current work in our group.
E. Dielectric function
The final ingredient for a complete theoretical descrip-tion of ultrafast transient absorption measurements is thetemperature-dependent dielectric function of the material. Wepreviously showed [35] that we could predict the imaginarypart of the dielectric function Im ε(ω) of plasmonic metals inquantitative agreement with ellipsometric measurements for awide range of frequencies by accounting for the three dominantcontributions,
Im ε(ω) = 4πσ0
ω(1 + ω2τ 2)+ Im εdirect(ω) + Im εphonon(ω).
(12)
We briefly summarize the calculation of these contributionsand focus on their electron temperature dependence below;see Ref. [35] for a detailed description.
The first term of (12) accounts for the Drude responseof the metal due to free carriers near the Fermi level, withthe zero-frequency conductivity σ0 and momentum relaxationtime τ calculated using the linearized Boltzmann equation withcollision integrals based on DFT [35]. The second and thirdterms of (12),
Im εdirect(ω) = 4π2e2
m2eω
2
∫BZ
dk(2π )3
∑n′n
(fkn − fkn′ )δ(εkn′ − εkn − �ω)∣∣λ · 〈p〉k
n′n
∣∣2, (13)
Im εphonon(ω) = 4π2e2
m2eω
2
∫BZ
dk′dk(2π )6
∑n′nα±
(fkn − fk′n′)
(nk′−k,α + 1
2∓ 1
2
)δ(εk′n′ − εkn − �ω ∓ �ωk′−k,α)
×∣∣∣∣∣λ ·
∑n1
(g
k′−k,αk′n′,kn1
〈p〉kn1n
εkn1 − εkn − �ω + iη+ 〈p〉k′
n′n1g
k′−k,αk′n1,kn
εk′n1 − εkn ∓ �ωk′−k,α + iη
)∣∣∣∣∣2
, (14)
capture the contributions due to direct interband excitationsand phonon-assisted intraband excitations, respectively. Here〈p〉k
n′n are matrix elements of the momentum operator, λ
is the electric field direction (results are isotropic for crys-tals with cubic symmetry), and all remaining electron andphonon properties are exactly as described previously. Theenergy-conserving δ functions are replaced by a Lorentzianof width equal to the sum of initial and final electron
linewidths, because of the finite lifetime of the quasipar-ticles.
The dielectric function calculated using (12)–(14) dependson the electron temperature Te in two ways. First, the electronoccupations fkn directly depend on Te. Second, the phasespace for electron-electron scattering increases with electrontemperature, which increases the Lorentzian broadening in theenergy conserving δ functions in (13) and (14).
075120-6
Ab INITIO PHONON COUPLING AND OPTICAL . . . PHYSICAL REVIEW B 94, 075120 (2016)
TABLE I. Coefficient of the temperature dependence of theelectron-electron scattering rate as given by (15), extracted fromfits to the energy dependence of DFT-calculated electron-electronscattering rates at room temperature [35].
Metal Al Ag Au Cu
De (eV-1) 0.017 0.021 0.016 0.020
We calculate electron linewidths from DFT using Fermigolden rule calculations for electron-electron and electron-phonon scattering at room temperature, as detailed in Ref. [35].These calculations are computationally expensive and difficultto repeat for several electron temperatures; we instead use thelinewidths at room temperature with an analytical correctionfor the Te dependence. The electron-phonon scattering ratedepends on the lattice temperature, but is approximatelyindependent of Te because the phase space for scattering isdetermined primarily by the electronic density of states andelectron-phonon matrix elements, which depend strongly onthe electron energies but not on the occupation factors or Te.The phase space for electron-electron scattering, on the otherhand, depends on the occupation factors and Te because anelectron at an energy far from the Fermi level can scatterwith electrons close to the Fermi level. The variation of thisphase space with temperature is primarily due to the change inoccupation of states near the Fermi level, and we can thereforeestimate this effect in plasmonic metals using a free electronmodel.
Within a free electron model, the phase space for electron-electron scattering grows quadratically with energy relativeto the Fermi level, resulting in scattering rates ∝(ε − εF )2 atzero electron temperatures, as is well known [2,51]. We canextend these derivations to finite electron temperature to showthat the energy and temperature-dependent electron-electronscattering rate
τ−1ee (ε,Te) ≈ De
�[(ε − εF )2 + (πkBTe)2] (15)
for |ε − εF | � εF and Te � εF /kB . Within the freeelectron model, the constant of proportionality De =
mee4
4π�2(ε0b )2ε
3/2S
√εF
(√
4εF εS
4εF +εS+ tan−1
√4εF
εS), where the background
dielectric constant ε0b and the Thomas-Fermi screening energy
scale εS are typically treated as empirical parameters [2].Here, we extract De by fitting (15) to the electron-electronscattering rates at room temperature T0 calculated using DFT[35]. The resulting fit parameters are listed in Table I. Wethen estimate the total scattering rates at other temperatures byadding (De/�)(πkB)2(T 2
e − T 20 ) to the total DFT-calculated
results (including electron-phonon scattering) at T0. Note thatwe could have equivalently fit the DFT-calculated scatteringrates at zero temperature, but the Fermi golden rule resultsat room temperature are less noisy at finite k-point sampling,and moreover these rates do not differ appreciably for electronenergies more than ∼πkBT0 ≈ 0.08 eV away from the Fermilevel anyway.
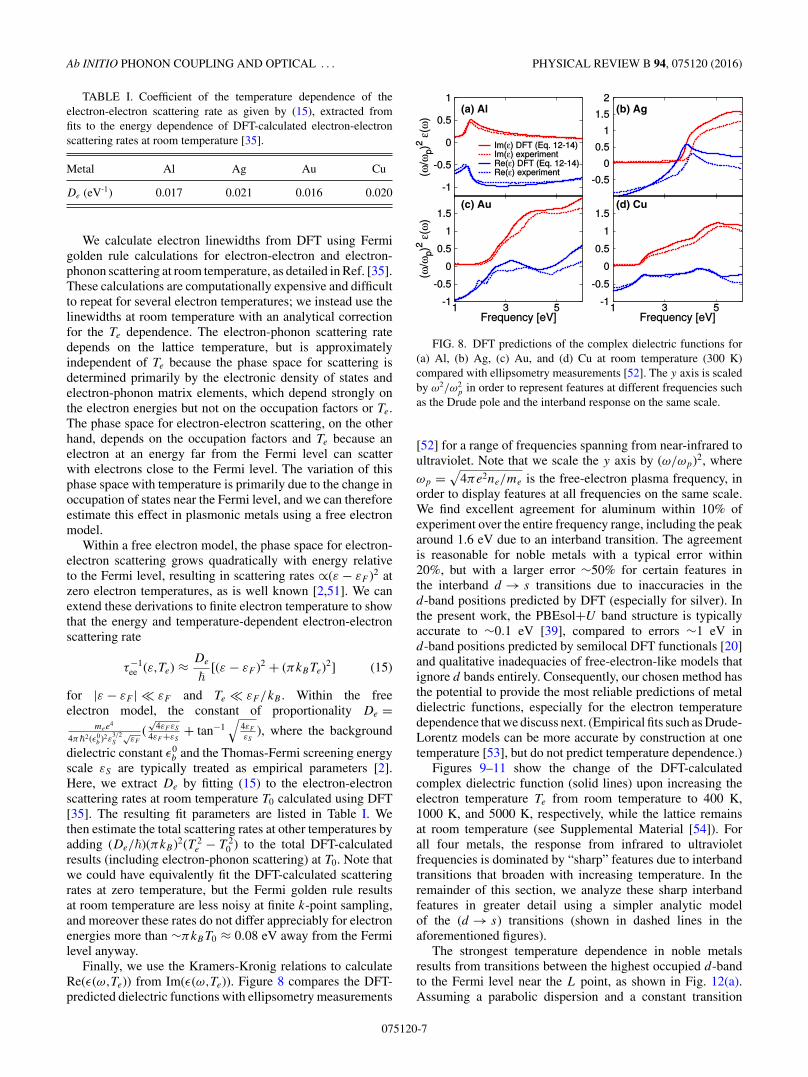
Finally, we use the Kramers-Kronig relations to calculateRe(ε(ω,Te)) from Im(ε(ω,Te)). Figure 8 compares the DFT-predicted dielectric functions with ellipsometry measurements
(a) Al (b) Ag
(c) Au (d) Cu
FIG. 8. DFT predictions of the complex dielectric functions for(a) Al, (b) Ag, (c) Au, and (d) Cu at room temperature (300 K)compared with ellipsometry measurements [52]. The y axis is scaledby ω2/ω2
p in order to represent features at different frequencies suchas the Drude pole and the interband response on the same scale.
[52] for a range of frequencies spanning from near-infrared toultraviolet. Note that we scale the y axis by (ω/ωp)2, whereωp =
√4πe2ne/me is the free-electron plasma frequency, in
order to display features at all frequencies on the same scale.We find excellent agreement for aluminum within 10% ofexperiment over the entire frequency range, including the peakaround 1.6 eV due to an interband transition. The agreementis reasonable for noble metals with a typical error within20%, but with a larger error ∼50% for certain features inthe interband d → s transitions due to inaccuracies in thed-band positions predicted by DFT (especially for silver). Inthe present work, the PBEsol+U band structure is typicallyaccurate to ∼0.1 eV [39], compared to errors ∼1 eV ind-band positions predicted by semilocal DFT functionals [20]and qualitative inadequacies of free-electron-like models thatignore d bands entirely. Consequently, our chosen method hasthe potential to provide the most reliable predictions of metaldielectric functions, especially for the electron temperaturedependence that we discuss next. (Empirical fits such as Drude-Lorentz models can be more accurate by construction at onetemperature [53], but do not predict temperature dependence.)
Figures 9–11 show the change of the DFT-calculatedcomplex dielectric function (solid lines) upon increasing theelectron temperature Te from room temperature to 400 K,1000 K, and 5000 K, respectively, while the lattice remainsat room temperature (see Supplemental Material [54]). Forall four metals, the response from infrared to ultravioletfrequencies is dominated by “sharp” features due to interbandtransitions that broaden with increasing temperature. In theremainder of this section, we analyze these sharp interbandfeatures in greater detail using a simpler analytic modelof the (d → s) transitions (shown in dashed lines in theaforementioned figures).
The strongest temperature dependence in noble metalsresults from transitions between the highest occupied d-bandto the Fermi level near the L point, as shown in Fig. 12(a).Assuming a parabolic dispersion and a constant transition
075120-7

ANA M. BROWN et al. PHYSICAL REVIEW B 94, 075120 (2016)
(a) Al (b) Ag
(c) Au (d) Cu
FIG. 9. Change in the DFT-predicted complex dielectric function(solid lines) for (a) Al, (b) Ag, (c) Au, and (d) Cu from roomtemperature (300 K) to electron temperature Te = 400 K (with thelattice remaining at room temperature). In comparison, the analyticald → s model (16) (dashed lines) captures essential features of theDFT results for noble metals at lower temperatures, but misses thecontributions of broadening due to electron-electron scattering athigher temperatures. Note that the y axis is scaled as in Fig. 8 forclarity.
matrix element, this temperature dependence can be modeledas [17,55]
�ε(ω) = −�K A0
(�ω)2
∫ ∞
−εc
dε(1 − f (ε,Te))√(m∗
v/m∗c )(�ω − (ε + ε0 + εc))
− (ε + εc)
.
(16)
The denominator captures the joint density of states fortransitions between the bands, and the numerator countsunoccupied states near the Fermi level, which introduces thetemperature dependence. Above, K fills in the real part of
(a) Al (b) Ag
(c) Au (d) Cu
FIG. 10. Change in the DFT-predicted complex dielectric func-tion (solid lines) for (a) Al, (b) Ag, (c) Au, and (d) Cu from roomtemperature (300 K) to electron temperature Te = 1000 K (with thelattice remaining at room temperature), compared to the analyticald → s model (16) (dashed lines).
(a) Al (b) Ag
(c) Au (d) Cu
FIG. 11. Change in the DFT-predicted complex dielectric func-tion (solid lines) for (a) Al, (b) Ag, (c) Au, and (d) Cu from roomtemperature (300 K) to electron temperature Te = 5000 K (with thelattice remaining at room temperature), compared to the analyticald → s model (16) (dashed lines).
the dielectric function, given the imaginary part using theKramers-Kronig relation.
Table II lists the parameters for the parabolic band ap-proximation obtained from the PBEsol+U band structures.Figure 9 shows that this approximation (dashed lines) capturesthe correct shape of �ε(ω) for small changes in Te. However,this model underestimates the Te dependence for higher Te
because it ignores the quadratic increase in broadening of theelectronic states due to increased electron-electron scattering,as Figs. 10 and 11 show. Aluminum exhibits a sharp change inthe dielectric function around �ω ≈ 1.5 eV, which results fromseveral transitions to/from the Fermi level near the W point asFig. 12(b) shows. Additionally two of the involved bands arenot parabolic, making it difficult to construct a simple modellike (16). Therefore, simplified models are adequate for quali-tative analysis of lower temperature excitation experiments innoble metals [17], but dielectric functions from first-principlesDFT calculations are necessary for a quantitative analysis ofhigher temperature experiments and a wider range of materialsand probe frequencies.
-4
-2
0
2
W L
ε-
ε F[e
V]
-2
0
2
X W
ε-
ε F[e
V]
FIG. 12. Critical interband transitions determining the “sharp”features in the dielectric function change for (a) noble metals (goldshown; similar shapes for silver and copper) and (b) aluminum. Aparabolic band model around the L point (parameters in Table II)approximates the critical transition in noble metals. This is difficultin aluminum because of four such transitions in a narrow energy range≈1.3–1.6 eV.
075120-8

Ab INITIO PHONON COUPLING AND OPTICAL . . . PHYSICAL REVIEW B 94, 075120 (2016)
TABLE II. Parameters to describe the change in dielectricfunction of noble metals with electron temperature using the d → s
model (16) with a parabolic band approximation, extracted from fitsto the PBEsol+U band structure. The energies and effective massesare also labeled in Fig. 12(a).
Ag Au Cu
Physical constants:ωp (eV/�) 8.98 9.01 10.8τ−1 (eV/�) 0.0175 0.0240 0.0268Fits to DFT calculations:A0 (eV3/2) 70 22 90εc (eV) 0.31 0.96 0.98ε0 (eV) 3.36 1.25 1.05m∗
v/m∗c 5.4 3.4 16.1
III. CONCLUSIONS
Our parameter-free DFT calculations of electron-phononcoupling, electron, and lattice heat capacities, and dielectricfunctions show qualitative differences from free-electron andprevious semiempirical estimates because of the substantialenergy dependence of electron-phonon matrix elements andelectronic density of states. These changes are particularly im-portant for gold and copper at transient electron temperaturesgreater than 2000 K because of the change in occupations ofthe d-bands situated ∼2 eV below the Fermi level in thesemetals.
The temperature dependence of the optical response is, inparticular, important for a wide range of applications beyondunderstanding ultrafast measurements. We show that whilesimple models can account for some of the qualitative featuresof the change in dielectric function for small changes intemperature, an electronic structure treatment is essential to
quantitatively account for the complete frequency and temper-ature dependence, including effects such as carrier linewidthbroadening and transitions between multiple nonparabolicbands. Given the dearth of published temperature-dependentdielectric functions in the literature, we include detailed tablesof our predictions for electron temperatures up to 8000 K, andspanning frequencies from the infrared to the ultraviolet, inthe Supplemental Material [54].
This work has direct implications for analysis of exper-imental pump-probe studies of metal nanostructures and isthe subject of ongoing work in our group. With the predictedmaterial properties we anticipate a parameter-free descriptionof the spectra obtained in transient absorption studies sincewe implicitly account for all the microscopic processes in thenonequilibrium dynamics of electrons in plasmonic metals.
ACKNOWLEDGMENTS
This material is based upon work performed by the JointCenter for Artificial Photosynthesis, a DOE Energy InnovationHub, supported through the Office of Science of the U.S.Department of Energy under Award No. DE-SC0004993.This research used resources of the National Energy ResearchScientific Computing Center, a DOE Office of Science UserFacility supported by the Office of Science of the U.S. Depart-ment of Energy under Contract No. DE-AC02-05CH11231.P.N. and W.A.G. acknowledge financial support from NGNEXT for this project. P.N. is supported by a National ScienceFoundation Graduate Research Fellowship and by the ResnickSustainability Institute. A.B. is supported by a NationalScience Foundation Graduate Research Fellowship, a LinkFoundation Energy Fellowship, and the DOE “Light-MaterialInteractions in Energy Conversion” Energy Frontier ResearchCenter (Grant No. DE-SC0001293).
[1] S. I. Anisimov, B. L. Kapeliovich, and T. L. Perel’man, Zh.Eksp. Teor. Fiz. 66, 776 (1974) [J. Exp. Theor. Phys. 39, 375(1974)].
[2] N. Del Fatti, C. Voisin, M. Achermann, S. Tzortzakis,D. Christofilos, and F. Vallee, Phys. Rev. B 61, 16956 (2000).
[3] H. Elsayed-Ali, T. Norris, M. Pessot, and G. Mourou, Phys. Rev.Lett. 58, 1212 (1987).
[4] H. E. Elsayed-Ali, T. Juhasz, G. O. Smith, and W. E. Bron, Phys.Rev. B 43, 4488 (1991).
[5] A. Giri, J. T. Gaskins, B. M. Foley, R. Cheaito, and P. E. Hopkins,J. Appl. Phys. 117, 044305 (2015).
[6] G. V. Hartland, Chem. Rev. 111, 3858 (2011).[7] M. I. Kaganov, I. M. Lifshitz, and L. V. Tanatarov, Zh. Eksp.
Teor. Fiz. 31, 232 (1957) [J. Exp. Theor. Phys. 4, 173 (1957)].[8] G. Grimvall, The Electron-phonon Interaction in Metals (North-
Holland, New York, 1981), Vol. 8.[9] Y. Gan, C. Wang, and Z. Chen, Opt. Lett. 40, 340 (2015).
[10] S. Link and M. A. El-Sayed, J. Phys. Chem. B 103, 8410 (1999).[11] T. Luo and G. Chen, Phys. Chem. Chem. Phys. 15, 3389 (2013).[12] P. M. Norris, A. P. Caffrey, R. J. Stevens, J. M. Klopf, J.
T. McLeskey, and A. N. Smith, Rev. Sci. Instrum. 74, 400(2003).
[13] B. Y. Mueller and B. Rethfeld, Appl. Surf. Sci. 302, 24 (2014).
[14] R. H. Groeneveld, R. Sprik, and A. Lagendijk, Phys. Rev. Lett.64, 784 (1990).
[15] R. H. Groeneveld, R. Sprik, and A. Lagendijk, Phys. Rev. B 51,11433 (1995).
[16] B. Rethfeld, A. Kaiser, M. Vicanek, and G. Simon, Phys. Rev.B 65, 214303 (2002).
[17] C.-K. Sun, F. Vallee, L. H. Acioli, E. P. Ippen, and J. G. Fujimoto,Phys. Rev. B 50, 15337 (1994).
[18] Y. Ma, J. Appl. Phys. 116, 243505 (2014).[19] A. J. Leenheer, P. Narang, N. S. Lewis, and H. A. Atwater,
J. Appl. Phys. 115, 134301 (2014).[20] Z. Lin and L. V. Zhigilei, Phys. Rev. B 77, 075133 (2008).[21] L. D. Landau and E. M. Lifschitz, Electrodynamics of Contin-
uous Media, Course of Theoretical Physics (Pergamon Press,Oxford, 1960), Vol. 8.
[22] J. M. Ziman, Electrons and Phonons (Clarendon Press, Oxford,1962).
[23] N. W. Ashcroft and N. D. Mermin, Solid State Physics (Holt,Rinehart and Winston, New York, 1976).
[24] D. Pines and P. Nozieres, Normal Fermi Liquids, The Theory ofQuantum Liquids (Addison-Wesley, New York, 1966), Vol. 1.
[25] H. Inouye, K. Tanaka, I. Tanahashi, and K. Hirao, Phys. Rev. B57, 11334 (1998).
075120-9
ANA M. BROWN et al. PHYSICAL REVIEW B 94, 075120 (2016)
[26] E. Knoesel, A. Hotzel, and M. Wolf, Phys. Rev. B 57, 12812(1998).
[27] J. Gavnholt, A. Rubio, T. Olsen, K. Thygesen, and J. Schiotz,Phys. Rev. B 79, 195405 (2009).
[28] E. Carpene, Phys. Rev. B 74, 024301 (2006).[29] S. Brorson, J. Fujimoto, and E. Ippen, Phys. Rev. Lett. 59, 1962
(1987).[30] C. Frischkorn and M. Wolf, Chem. Rev. 106, 4207 (2006).[31] H. Harutyunyan, A. B. F. Martinson, D. Rosenmann, L. K.
Khorashad, L. V. Besteiro, A. O. Govorov, and G. P. Wiederrecht,Nat. Nanotechnol. 10, 770 (2015).
[32] J. L. Hostetler, A. N. Smith, D. M. Czajkowsky, and P. M. Norris,Appl. Opt. 38, 3614 (1999).
[33] S. Link, C. Burda, M. B. Mohamed, B. Nikoobakht, and M. A.El-Sayed, J. Phys. Chem. A 103, 1165 (1999).
[34] D. Lide, CRC Handbook of Chemistry and Physics, 84th ed.(Taylor & Francis, London, 2003).
[35] A. Brown, R. Sundararaman, P. Narang, W. A. Goddard III, andH. A. Atwater, ACS Nano 10, 957 (2016).
[36] R. Sundararaman, D. Gunceler, K. Letchworth-Weaver, andT. A. Arias, JDFTx, http://jdftx.sourceforge.net.
[37] J. P. Perdew, A. Ruzsinszky, G. I. Csonka, O. A. Vydrov, G. E.Scuseria, L. A. Constantin, X. Zhou, and K. Burke, Phys. Rev.Lett. 100, 136406 (2008).
[38] S. L. Dudarev, G. A. Botton, S. Y. Savrasov, C. J. Humphreys,and A. P. Sutton, Phys. Rev. B 57, 1505 (1998).
[39] R. Sundararaman, P. Narang, A. S. Jermyn, W. A. Goddard III,and H. A. Atwater, Nat. Commun. 5, 5788 (2014).
[40] I. Souza, N. Marzari, and D. Vanderbilt, Phys. Rev. B 65, 035109(2001).
[41] J. P. Perdew, K. Burke, and M. Ernzerhof, Phys. Rev. Lett. 77,3865 (1996).
[42] C. Voisin, N. Del Fatti, D. Christofilos, and F. Vallee, J. Phys.Chem. B 105, 2264 (2001).
[43] J. H. Hodak, A. Henglein, and G. V. Hartland, J. Phys. Chem. B104, 9954 (2000).
[44] P. B. Allen, Phys. Rev. Lett. 59, 1460 (1987).[45] F. Giustino, M. L. Cohen, and S. G. Louie, Phys. Rev. B 76,
165108 (2007).[46] X. Y. Wang, D. M. Riffe, Y.-S. Lee, and M. C. Downer, Phys.
Rev. B 50, 8016 (1994).[47] W. McMillan, Phys. Rev. 167, 331 (1968).[48] J. Hohlfeld, S.-S. Wellershoff, J. Gudde, U. Conrad, V. Jahnke,
and E. Matthias, Chem. Phys. 251, 237 (2000).[49] C. Guo, G. Rodriguez, A. Lobad, and A. Taylor, Phys. Rev. Lett.
84, 4493 (2000).[50] B. Y. Mueller and B. Rethfeld, Phys. Rev. B 87, 035139 (2013).[51] F. Ladstadter, U. Hohenester, P. Puschnig, and C. Ambrosch-
Draxl, Phys. Rev. B 70, 235125 (2004).[52] E. D. Palik, Handbook of Optical Constants of Solids (Academic
Press, New York, 1985).[53] A. D. Rakic, A. B. Djurisic, J. M. Elazar, and M. L. Majewski,
Appl. Opt. 37, 5271 (1998).[54] See Supplemental Material at http://link.aps.org/supplemental/
10.1103/PhysRevB.94.075120 for plots of the complex dielec-tric function at several electron temperatures, and completedata sets as a function of temperature and frequency for usein numerical analyses.
[55] R. Rosei, F. Antonangeli, and U. Grassano, Surf. Sci. 37, 689(1973).
075120-10