ab initio phonon scattering by dislocations - tu wien · an efficient ab initio approach based on...
TRANSCRIPT
PHYSICAL REVIEW B 95, 245304 (2017)
Ab initio phonon scattering by dislocations
Tao Wang,1,* Jesús Carrete,2 Ambroise van Roekeghem,3 Natalio Mingo,3 and Georg K. H. Madsen2,†1CMAT, ICAMS, Ruhr-Universität Bochum, 44780 Bochum, Germany
2Institute of Materials Chemistry, TU Wien, A-1060 Vienna, Austria3LITEN, CEA-Grenoble, 38054 Grenoble Cedex 9, France
(Received 8 February 2017; published 6 June 2017)
Heat management in thermoelectric and power devices as well as in random access memories poses a grandchallenge and can make the difference between a working and an abandoned device design. Despite the prevalenceof dislocations in all these technologies, the modeling of their thermal resistance is based on 50-year-old analyticalapproximations, whose simplicity was driven by practical limitations rather than physical insight. We introducean efficient ab initio approach based on Green’s functions computed by two-dimensional reciprocal spaceintegration. By combining elasticity theory and density functional theory, we calculate the scattering strengthof a 90◦ misfit edge dislocation in Si. Because of the breakdown of the Born approximation, earlier literaturemodels fail, even qualitatively. We find that a dislocation density larger than 109 cm−2 is necessary to substantiallyinfluence thermal conductivity at room temperature and above. We quantify how much of the reduction of thermalconductivity measured in nanograined samples can be explained by realistic dislocation concentrations.
DOI: 10.1103/PhysRevB.95.245304
I. INTRODUCTION
The length scales of modern semiconductor architectureshave long passed below the intrinsic mean free paths of theheat-carrying phonons in the underlying materials [1], makingpredictive modeling of the thermal transport an inherentlymultiscale problem. Despite the prevalence of dislocations inall these technologies [2–4], the modeling of their contributionto thermal resistance is based on 50-year-old analyticalapproximations [5–7]. Due to the assumptions underlyingtheir derivation, these models can differ by several orders ofmagnitude, both with respect to each other and with respectto experiment [7]. Phonon scattering by dislocations can bemodeled at an atomic level by molecular dynamics simulations[8,9]. However, due to the length and time scales involved,these calculations have to rely on semiempirical potentialswhich inherently are limited when it comes to transferabilityand quantitative predictive power of thermal conductivity [10].
The multiscale nature of phonon transport leads to the basicdilemma of, on one hand, the need for a density functionaltheory (DFT) level of precision [11,12] and, on the otherhand, the need for large length scales to quantify the phonon-scattering strength caused by various types of defects, e.g.,vacancies, interfaces, and dislocations, inside the materials.For the quantification of defect scattering, the Green’s-functionapproach [13–15] would seem ideal. It can rely on DFT for thecalculation of the scattering matrix elements and be combinedwith the Boltzmann transport equation to describe anharmonicsystems. When applied to interfaces [16] and point defects[17,18] good agreement with experiment has been found.
The lack of applications of the Green’s-function approachcan partly be attributed to the large model sizes needed tocalculate converged numbers for, e.g., dislocation structures.In the present paper we combine elasticity theory with DFT toshow how the quantitative predictive calculation of phonon
*[email protected]†[email protected]
scattering can be extended to dislocations. We do this bycalculating the energy- and momentum-dependent scatteringrate of a quadrupolar arrangement of 90◦-misfit dislocations inSi. The structures are set up using elasticity theory, whereby thedislocation structure can be controlled precisely. The scatteringrates are obtained by dividing the three-dimensional Brillouinzone (BZ) into parallel planes perpendicular to the defectline. We find that the obtained scattering rates deviate, evenqualitatively, from the simple historical approximations.
II. BACKGROUND
A. Supercell approach
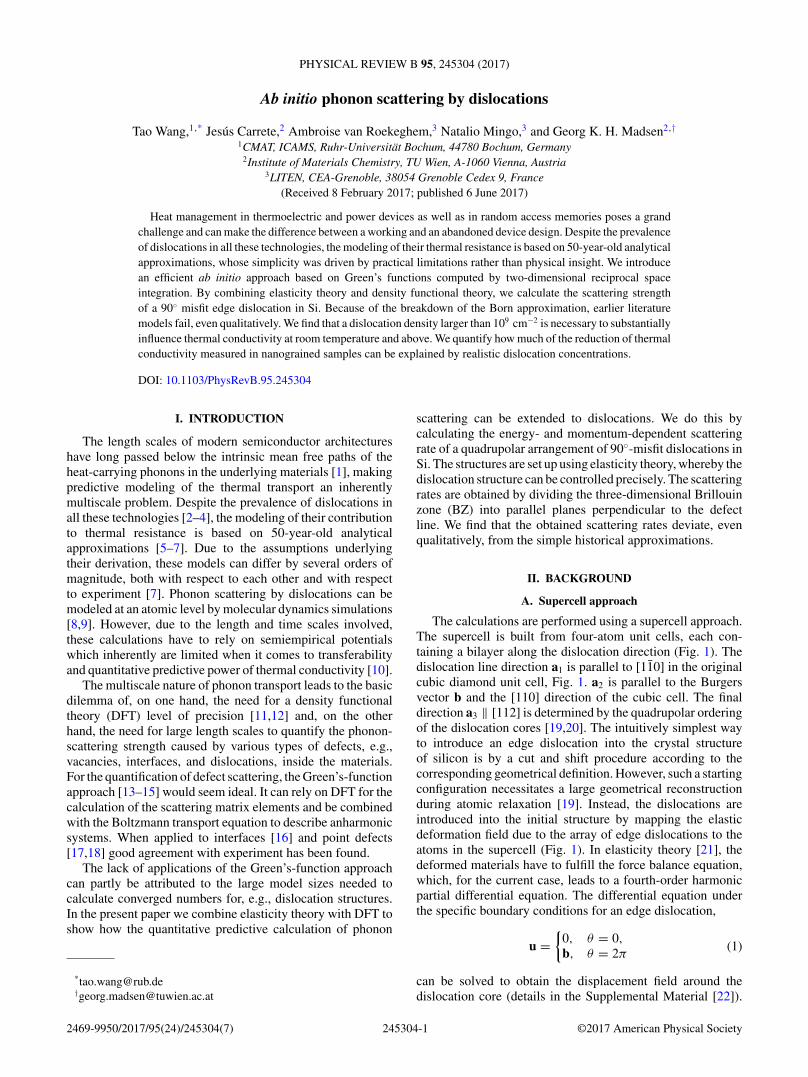
The calculations are performed using a supercell approach.The supercell is built from four-atom unit cells, each con-taining a bilayer along the dislocation direction (Fig. 1). Thedislocation line direction a1 is parallel to [11̄0] in the originalcubic diamond unit cell, Fig. 1. a2 is parallel to the Burgersvector b and the [110] direction of the cubic cell. The finaldirection a3 ‖ [112] is determined by the quadrupolar orderingof the dislocation cores [19,20]. The intuitively simplest wayto introduce an edge dislocation into the crystal structureof silicon is by a cut and shift procedure according to thecorresponding geometrical definition. However, such a startingconfiguration necessitates a large geometrical reconstructionduring atomic relaxation [19]. Instead, the dislocations areintroduced into the initial structure by mapping the elasticdeformation field due to the array of edge dislocations to theatoms in the supercell (Fig. 1). In elasticity theory [21], thedeformed materials have to fulfill the force balance equation,which, for the current case, leads to a fourth-order harmonicpartial differential equation. The differential equation underthe specific boundary conditions for an edge dislocation,
u ={
0, θ = 0,
b, θ = 2π(1)
can be solved to obtain the displacement field around thedislocation core (details in the Supplemental Material [22]).
2469-9950/2017/95(24)/245304(7) 245304-1 ©2017 American Physical Society

WANG, CARRETE, VAN ROEKEGHEM, MINGO, AND MADSEN PHYSICAL REVIEW B 95, 245304 (2017)
50-5Atomic Stress (GPa)Diamond lattice
elasticdisplacementa2
a3a1
a3*
a1*
a2*
FIG. 1. The supercell used to set up a quadrupolar arrangement of b = (a/2)〈110〉 edge dislocations, where b is the Burgers vector, a isthe lattice constant of the conventional cubic cell, and 〈110〉 is the equivalent directions. In the left pane the blue cell illustrates the four-atomcell used to set up the 8 × 4 supercell. The vectors give the directions of the supercell axes in the conventional diamond-lattice cell. The rightpanel shows the structure after mapping the elastic displacement field and DFT relaxation. The dislocation cores are marked by ⊥, and theseven- and fivefold rings are shown by atoms connected by black lines. The atoms are colored according to the σ22 component of the virialstress tensor with red corresponding to a tensile and blue corresponding to a compressive strain.
Using this procedure we obtain a starting structure closeto the optimal one, thereby greatly reducing the number ofcomputational steps required for the geometry optimization.
B. Green’s function approach
The scattering of phonons due to defects is predominantlyelastic and can be expressed using the T-matrix formalism[17,23,24]. In the present paper we extend the earlier formal-ism to a one-dimensional periodic defect where a conservedwave number can be defined. In the setup illustrated in Fig. 1the periodicity is along a1, which is parallel to a∗
1. We canthus introduce a mixed-space basis of states with well-definedvalues of q1,
|φ(q1)〉 =∑
l
eiq1Rl |φ(l)〉. (2)
Consequently, the perturbation cannot mix states with differentvalues of q1. The T-matrix T = V + VgT is then expressed as
T+(q1,ω2) = [I − V(q1)g+(q1,ω
2)]−1V(q1). (3)
The scattering rate on the q1 Brillouin-zone plane can then beexpressed as
τ−1λ,q1
= S
ωλ,q1
∑λ′,q ′
1
|〈φλ′(q ′1)|T+(q1,ω
2)|φλ(q1)〉|2δ(ω′2 − ω2),
(4)
where φ is the phonon state indexed by q1 and the compoundindex λ of q2, q3, and the index of the phonon state (1 �j � 12 in the four-atom primitive cell, see Fig. 1). ωλ(q1)is the dispersion on the plane. |φλ′(q ′
1)〉 and |φλ(q1)〉 are thecorresponding final and incident eigenstates, respectively. S isthe ratio of the normalization area of the eigenvector and thescatterer’s area. Equation (4) gives the contribution of eachfinal eigenstate to the total scattering strength. By employingthe optical theorem, the scattering rate can be rewritten as
τ−1λ,q1
= − S
ωλ,q1
Im{〈φλ(q1)|T+(q1,ω2)|φλ(q1)〉}. (5)
The two expressions must give the same results, but Eq. (5)is more efficient to evaluate numerically than Eq. (4). TheT matrix can also be approximated according to the Born
approximation by truncating the Born series for the perturbedstates,
|ψ〉 = |φ〉 + g(ω2)V|φ〉 + [g(ω2)V]2|φ〉 + · · · , (6)
at first order.
III. COMPUTATIONAL PROCEDURE
The DFT calculations were carried out using VASP [25,26]with the local density approximation. The force calculationsare performed using the projector-augmented-wave method(with a cutoff of 430 eV) and a 4 × 2 × 2 k-point mesh.The second-order interatomic force constants (IFCs) are builtusing the PHONOPY package [27]. The third-order IFCs of theunperturbed cell are calculated by systematically displacingthe atoms pairwise and collecting the resulting DFT force[28]. The phonon band structures of the dislocation structurealso were checked. No negative frequencies were observed,showing that the supercell is stable. The mass-disorderscattering due to isotopes was evaluated according to Ref. [29].
To obtain the perturbation matrix V we treat each disloca-tion pair as an independent scattering center. V then is calcu-lated by displacing each atom in the defected supercell, Fig. 1,individually and obtaining the forces. A fully relaxed supercellwith the size of 3 × 8 × 4 times the specific four-atom unitcell, containing 384 atoms in total, was used for the forceconstant calculations (details of the convergence tests can befound in the Supplemental Material [22]). As the dislocationsbreak the cubic symmetry this corresponds to a large numberof displacements, and this step is computationally the mostcostly. Further details for the calculation of the IFCs thatare necessary to obtain the perturbation matrix and Green’sfunction are documented in the Supplemental Material [22].
To obtain g the three-dimensional (3D) BZ is dividedinto parallel planes spanned by a∗
2 − a∗3. A triangulation
scheme followed by barycentric interpolation in the trianglesas described in the Appendix is adopted to discretize eachof the two-dimensional BZ planes. This treatment allowsus to split the three-dimensional domain into independenttwo-dimensional domains.
245304-2

Ab INITIO PHONON SCATTERING BY DISLOCATIONS PHYSICAL REVIEW B 95, 245304 (2017)
FIG. 2. Phonon band structure of silicon on the q1 = 0 planeof the Brillouin zone of the four-atom unit cell shown in Fig. 1. Thethree directions are on the q1 = 0 plane and are parallel to the Burgersvector q‖ ‖ a∗
2 + a∗3 (blue), perpendicular to the Burgers vector q⊥ ‖
a∗3 (green) and the intermediate direction q∠ ‖ a∗
2 (red), Fig. 1.
IV. RESULTS AND DISCUSSION
The optimized edge dislocation structure is shown in Fig. 1.Known edge dislocation core structures composed of a five-atom- and a seven-atom-ring pattern [20] can be observed,thereby underlining the reliability of the approach. Except forthe atoms making up the dislocation core, all atoms possess astrained cubic diamond crystal structure.
The phonon band structure of the defect-free Si is shownin Fig. 2. The dispersion along the three selected directionsq‖, q⊥, and q∠ is marked. One potential shortcoming ofthe analytic approximations of dislocation scattering [5–7] isthat they are limited to the Born approximation, obtained bytruncating the Born series for the perturbed states at the firstorder, instead of the full T-matrix formalism Eqs. (3)–(5).Based on the IFCs obtained with DFT, the scattering rates arecalculated using both the Born approximation and the T-matrixformalism, Fig. 3. Using the Born approximation we recovera monotonically increasing scattering rate for phonons with
frequencies up to 1 THz, similar to early analytic results [5–7].However, at higher frequencies, corresponding to wave vectorsaway from the center of the BZ, the scattering deviates from amonotonic behavior. Furthermore, the τ−1’s computed basedon the T -matrix method deviate strongly from those obtainedwith the Born approximation, Fig. 3. This is understandableas the dislocations strongly perturb the environment of theneighboring atoms and underline that the assumptions behindthe analytic results compromise their precision. Interestingly,in the Born approximation the trend for the low-frequencyphonons is closer to a ω3 behavior, which would be expectedfor a line of point defects, indicating that the dislocationcore structure is important in determining the scattering [6,7].However, we underline that this trend only covers a very smallpart of the BZ, which is mainly noticeable due to the log-logscale used in Fig. 3, meaning that it will only substantiallycontribute to lowering the thermal conductivity at very lowtemperatures.
The anisotropy in the dependence of the scattering rate onthe direction of the q vector, that can clearly be seen in Fig. 3,can originate from the heterogeneous strain field. An analyticmodel based on a theoretical study of an edge dislocationembedded in an infinite homogeneous elastic medium [7]
predicted a ratio of τ−1‖b /τ−1
⊥b = 2/[1 + ( ν1−ν
)2], where ν is
Poisson’s ratio. However, Fig. 3 shows that the constant ratiobetween τ−1
‖b and τ−1⊥b can only be reproduced for one of the
branches due to the strongly perturbed atomic environment bythe dislocation cores. Furthermore, for Si, Poisson’s ratio isν ≈ 0.28(<1/2), and the analytic models would thus leadto a prediction of τ−1
‖b > τ−1⊥b . Figure 3 on the other hand
shows that τ−1⊥b can be even larger than τ−1
‖b , indicating thefailure of a model based purely on the strain field and the Bornapproximation.
Figure 4 shows the dislocation scattering in comparisonto the phonon-phonon and isotope scatterings for the entireBZ. The τ−1
qj |(disloc)’s are calculated according to Eqs. (3)–(5).The three-phonon scattering rates are obtained on the sametransport q mesh according to the procedure explained earlier[28]. It is apparent that the increasing trend only is foundin a small part of the BZ and for certain directions in
FIG. 3. The scattering rate for the three acoustic phonon branches along three selected directions of q. The directions are labeled asexplained in Fig. 2 and are calculated using the T matrix. The black dots correspond to the scattering rates obtained with the Born approximationalong q∠.
245304-3

WANG, CARRETE, VAN ROEKEGHEM, MINGO, AND MADSEN PHYSICAL REVIEW B 95, 245304 (2017)
FIG. 4. Different scattering rates computed in the current calcu-lation: three-phonon scattering, phonon-dislocation scattering, andisotope scattering. The three-phonon scattering was calculated at300 K. The dislocation scattering is computed from the T matrixand the Green’s functions Eqs. (3)–(5). The points correspond toa 34 × 34 × 28 q mesh. For clarity, the scattering rates have beencalculated for a very high dislocation density (ρ = 5 × 1013 cm−2).Changing the dislocation density to, e.g., ρ = 1011 cm−2 wouldrigidly shift the red points by the same magnitude, i.e., from beingcentered around τ−1 = 5 to around τ−1 = 10−2 ps−1.
agreement with the earlier observations. The overall behavioris better understood as a ω0 behavior, similar to the usualmodels of grain boundaries. This makes sense taking intoaccount that the structure of small-angle grain boundariescan be understood as a lineup of edge dislocations [30].However, it is also clear that a constant ω0 behavior is avery approximate description and that the actual dislocationscattering rates vary by two to three orders of magnitude. Itclearly is seen that, even for a dislocation density that is twoto three orders of magnitude smaller than that used to makeFig. 4, corresponding to a realistic [31,32] dislocation densityof ρ ≈ 1010–1011 cm−2, the scattering due to dislocationsis comparable to the phonon-phonon scattering at roomtemperature.
Within the relaxation time approximation the thermalconductivity tensor can be estimated by summing all theexcited phonons in the BZ as
κι =∑
j
∫BZ
Cqj vqj ⊗ vqj τqj
dq8π3
, (7)
where vqj , τqj , and Cqj are the group velocity and lifetimeof the j th branch phonon with wave-number q and itscontribution to the heat capacity. Based on Matthiessen’s rule,the total scattering strength τ−1
qj for each phonon qj can besummed together over all the possible scattering processes in
FIG. 5. Temperature-dependent thermal conductivity of siliconcomputed with various scattering mechanisms. The gray area standsfor the influence region of dislocation with the line density range fromρ = 106 to ρ = 1012 cm−2. The experimental data are taken fromRef. [31] and labeled with their average grain size in nanometers anddensity in percentages of pure Si as in the original work.
the material,
τ−1qj = τ−1
qj |(3p) + τ−1qj |(isotope) + τ−1
qj |(disloc) + · · · . (8)
With the computed scattering rates, Fig. 4 as well as phonondispersion, Fig. 2, the thermal conductivity is ready forevaluation according to Eq. (7). The scattering rates andvelocities are computed on the same transport 34 × 34 × 28 q
mesh. The nonequal numbers of the q points along the threereciprocal axes are necessary due to the nonequal lengths ofthe reciprocal lattice vectors of our specific four-atom unit cell,Fig. 1. For the Green’s-function calculations a much denser34 × 80 × 80 q mesh was used (see the Supplemental Materialfor the grid mesh convergence check [22]).
Figure 5 shows the temperature dependence of the thermalconductivity of silicon when various dislocation densities areconsidered. When the thermal conductivity of bulk siliconis computed by considering only anharmonic and isotopephonon scatterings we obtain a κ = 139 W/mK at 300 K.The value agrees well with experimental data for bulk siliconwith an underestimation of about 10% due to the use of therelaxation time approximation [11,12]. Phonon-dislocationscattering is averaged over all directions on the plane tosimulate a random orientation of the dislocations and theoverall thermal conductivity as shown in Fig. 5. With theincrease in temperature, the anharmonic scattering tends todominate the total scattering strength, which means thatdislocation densities ρ larger than 109 cm−2 are necessaryto substantially influence the thermal transport. However, inagreement with the discussion of Fig. 4 it is clearly seen that,for a realistic dislocation density around ρ ≈ 1010–1011 cm−2,
245304-4

Ab INITIO PHONON SCATTERING BY DISLOCATIONS PHYSICAL REVIEW B 95, 245304 (2017)
the scattering due to dislocations plays a substantial role inlowering the thermal conductivity.
The experimental data in Fig. 5 are taken from a systematicstudy of lattice thermal conductivity of nanograined Si as afunction of average grain size by Wang et al. [31]. Wang et al.showed that low-temperature dependence of κ followed a T 2
trend and interpreted this in terms of a grain-size distribution.A different interpretation was proposed by Kim et al. [33]who modeled the data based on a ω1 and ω3 dependence ofdislocation scattering. A fair conclusion of these two studiesprobably is that the experimental data can be fitted by acombination of a Debye model with a power-law description ofthe scattering. However, to explain the experimental data anddiscriminate between scattering mechanisms, a quantitativepredictive methodology is necessary. Figure 5 illustrateshow dislocation scattering can indeed go a long way toexplain the magnitude of the experimental lowering of thermalconductivity due to grain-size reduction. Dislocation scatteringfurthermore lowers the T 3-bulk trend to a T 2.6-bulk trendbut is not enough to reproduce the T 2 trend. We interpretthis as indicating that further scattering mechanisms, such asgrain-size distribution [31,34] play an important role in theexperimental data.
V. CONCLUSION
We have introduced a Green’s-function-based methodto quantitatively predict the phonon-scattering strength ofdislocations at the precision of density functional theory. Asystematic approach based on elasticity theory was used toset up the atomic model. The mapping of the elastic strainfield to atomic displacements can be extended to complexdislocation array structures via well-developed discrete dis-location dynamics modeling approaches [35]. It was foundthat a dislocation density larger than ρ = 109 cm−2 is neces-sary to substantially influence thermal conductivity at roomtemperature and above. Interestingly, this is the dislocationdensity range found in the buffer layers of GaN-based devices,which have been suggested to play an important role in thermalresistance [36].
ACKNOWLEDGMENTS
C. Begau is thanked for helpful discussions concerningelasticity theory. We acknowledge support from EU Horizon2020 Grant No. 645776 (ALMA).
APPENDIX: TWO-DIMENSIONAL GREEN’S FUNCTIONTRIANGULATION SCHEME
Based on the precomputed IFCs for the defect-free system,the dispersion relation ω(q) in the given q mesh of the BZcan be obtained. Together with ωλ,q1 , the integral form of theGreen’s function on each plane can be computed as
g+i,j (ω2,q1) =
∑λ
〈φλ(q1)|i〉〈j |φλ(q1)〉Wλ(ω2; q1), (A1)
where the weight function Wλ(ω2; q1) is obtained via a two-dimensional integral of the spectral function for each branchand q1. In order to evaluate W accurately each dispersionsurface ω2
λ is sampled using a regular grid. The grid istriangulated, and each dispersion is approximated by linearinterpolation in barycentric coordinates inside each of thetriangles. Under these approximations, analytic expressionscan be derived for the real and imaginary contributions toW from each triangle and the total weight is a sum of thesecontributions,
W (ω2; q1) =∑
n
∑i
wni (ω2; q1), (A2)
where n indexes the triangles, i indexes the vertices, and thebranch indices have been suppressed.
The triangulation scheme is adapted from the earlier work[37,38]. The equations for the real part as listed in Ref. [38]contain errors and are corrected here. Only the final equationsare listed here, whereas the detailed derivation procedure canbe found in Refs. [37,38]. Taking the one-triangle elementwith vertices q1–3 each with the associated frequencies ω2
1–3,Fig. 6(b), we first define Eij ,
Eij = ω2 − ω2i
ω2j − ω2
i
. (A3)
FIG. 6. (a) Two-dimensional qx plane discretized in triangular elements used to compute the Green’s function. (b) Interpolation over theone-triangle element. The vertices are labeled so that ω2
1 � ω22 � ω2
3. When ω21 < ω2 � ω2
2, only the subtriangle with vertices (q1,qα,qβ )contributes to the imaginary part where the interpolated dispersions are qα = E12q1 + E21q2 and qβ = E13q1 + E31q3. When ω2
2 < ω2 � ω23,
only the tetragon with vertices (q1,q2,qγ ,qδ) contributes with interpolated qγ = E23q2 + E32q3 and qδ = E13q1 + E31q3.
245304-5

WANG, CARRETE, VAN ROEKEGHEM, MINGO, AND MADSEN PHYSICAL REVIEW B 95, 245304 (2017)
FIG. 7. (a) Real part and (b) imaginary part of g(ω2) contributed by summing all the planes. The black crosses on the curves stand for theresults obtained using the tetrahedron method [39] implemented in the ALMABTE code [40]. The blue curve is the density of states obtainedfrom PHONOPY. The IFCs are obtained using DFT.
Let D1 = E21E31, D3 = E13E23, Xi = ω2 − ω2i , and St be the area of the triangle. When ω2 ∈ (ω2
1,ω22], only the subtriangle
with vertices (q1,qα,qβ), Fig. 6(b), contributes to the imaginary part,
Im[wi(ω2)] =
{E12+E13
ω2−ω21
D1St , i = 1,Ei1
ω2−ω21D1St , i = 2,3.
(A4)
The real part is obtained via an analytic Hilbert transform of the imaginary part,
Re[wi(ω2)] =
⎧⎪⎪⎪⎪⎪⎪⎪⎪⎨⎪⎪⎪⎪⎪⎪⎪⎪⎩
[E21ln
∣∣∣ X1X2
∣∣∣(E12+E13)+ 12 (E21−E12)−E13
ω21−ω2
3− ω2
2−ω21
2(ω2
1−ω23
)2
]St , i = 1,[
E21ln∣∣∣ X1
X2
∣∣∣E21−E21
ω21−ω2
3− 1
2(ω2
1−ω23
)]St , i = 2,[
E21ln∣∣∣ X1
X2
∣∣∣E31−E31
ω21−ω2
3− ω2
1−ω22
2(ω2
1−ω23
)2
]St , i = 3.
(A5)
When ω2 ∈ (ω22,ω
23], only the triangle with vertices (q1,q2,qγ ,qδ), Fig. 6(b), contributes
Im[wi(ω2)] =
⎧⎨⎩
Ei3
ω23−ω2 D3St , i = 1,2,
E31+E32
ω23−ω2 D3St , i = 3,
(A6)
and the real part is given as
Re[wi(ω2)] =
⎧⎪⎪⎪⎪⎪⎪⎪⎨⎪⎪⎪⎪⎪⎪⎪⎩
[E23ln
∣∣∣ X2X3
∣∣∣E13−E21
ω21−ω2
3+ ω2
2−ω23
2(ω2
1−ω23
)]St , i = 1,[
E23ln∣∣∣ X2
X3
∣∣∣E23−E31
ω21−ω2
3+ 1
2(ω2
1−ω23
)]St , i = 2,[
E23ln∣∣∣ X2
X3
∣∣∣(E31+E32)+ 12 (E32−E23)+E31
ω21−ω2
3+ ω2
3−ω22
2(ω2
1−ω23
)2
]St , i = 3.
(A7)
Generally, Re[wi(ω2)] is the summation of Eqs. (A5) and (A7). However, in the case of energy degeneration at the vertices of atriangle [38] Re[wi(ω2)] is given by Eq. (A7) if ω2
1 = ω22 �= ω2
3 and by Eq. (A5) if ω21 �= ω2
2 = ω23.
To validate the implemented Green’s function we compare the results obtained by summing over all planes with the resultsobtained with linear interpolation of the tetrahedron’s elements [39]. Figure 7 shows the real and imaginary parts of the trace ofthe Green’s function obtained by summing the contributions from all planes. The curves agree well with the results computedusing the 3D tetrahedron method. We have, furthermore, compared the imaginary part of the Green’s function to the phonon
245304-6

Ab INITIO PHONON SCATTERING BY DISLOCATIONS PHYSICAL REVIEW B 95, 245304 (2017)
density of states [ρ(ω)]. Taking the ρ(ω) from PHONOPY [27] with the same IFCs and using the conversion ρ(ω) = 2ωρ(ω2), weobtain excellent agreement, Fig. 7.
[1] D. G. Cahill, P. V. Braun, G. Chen, D. R. Clarke, S. Fan, K. E.Goodson, P. Keblinski, W. P. King, G. D. Mahan, A. Majumdaret al., Appl. Phys. Rev. 1, 011305 (2014).
[2] W. Ng, M. Lourenco, R. Gwilliam, S. Ledain, G. Shao, and K.Homewood, Nature (London) 410, 192 (2001).
[3] S. Nakamura, Rev. Mod. Phys. 87, 1139 (2015).[4] S. I. Kim, K. H. Lee, H. A. Mun, H. S. Kim, S. W. Hwang, J. W.
Roh, D. J. Yang, W. H. Shin, X. S. Li, Y. H. Lee et al., Science348, 109 (2015).
[5] P. Klemens, Proc. Phys. Soc., London, Sect. A 68, 1113 (1955).[6] P. Carruthers, Rev. Mod. Phys. 33, 92 (1961).[7] K. Ohashi, J. Phys. Soc. Jpn. 24, 437 (1968).[8] B. Deng, A. Chernatynskiy, P. Shukla, S. Sinnott, and S. Phillpot,
J. Nucl. Mater. 434, 203 (2013).[9] Y. Ni, S. Xiong, S. Volz, and T. Dumitric, Phys. Rev. Lett. 113,
124301 (2014).[10] A. Katre and G. K. H. Madsen, Phys. Rev. B 93, 155203 (2016).[11] D. A. Broido, M. Malorny, G. Birner, N. Mingo, and D. A.
Stewart, Appl. Phys. Lett. 91, 231922 (2007).[12] K. Esfarjani, G. Chen, and H. T. Stokes, Phys. Rev. B 84, 085204
(2011).[13] T. Yamamoto and K. Watanabe, Phys. Rev. Lett. 96, 255503
(2006).[14] N. Mingo, Phys. Rev. B 74, 125402 (2006).[15] J.-S. Wang, J. Wang, and N. Zeng, Phys. Rev. B 74, 033408
(2006).[16] P. Chen, N. A. Katcho, J. P. Feser, W. Li, M. Glaser, O. G.
Schmidt, D. G. Cahill, N. Mingo, and A. Rastelli, Phys. Rev.Lett. 111, 115901 (2013).
[17] N. A. Katcho, J. Carrete, W. Li, and N. Mingo, Phys. Rev. B 90,094117 (2014).
[18] A. Katre, J. Carrete, and N. Mingo, J. Mater. Chem. A 4, 15940(2016).
[19] J. R. K. Bigger, D. A. McInnes, A. P. Sutton, M. C. Payne, I.Stich, R. D. King-Smith, D. M. Bird, and L. J. Clarke, Phys.Rev. Lett. 69, 2224 (1992).
[20] F. Liu, M. Mostoller, V. Milman, M. F. Chisholm, and T. Kaplan,Phys. Rev. B 51, 17192 (1995).
[21] J. Hirth and J. Lothe, Theory of Dislocations (Krieger, Malabar,FL, 1982).
[22] See Supplemental Material at http://link.aps.org/supplemental/10.1103/PhysRevB.95.245304 for convergence tests and detailsof the calculation of the IFCs.
[23] N. Mingo, K. Esfarjani, D. A. Broido, and D. A. Stewart, Phys.Rev. B 81, 045408 (2010).
[24] A. Kundu, N. Mingo, D. A. Broido, and D. A. Stewart, Phys.Rev. B 84, 125426 (2011).
[25] G. Kresse and J. Furthmüller, Phys. Rev. B 54, 11169(1996).
[26] G. Kresse and D. Joubert, Phys. Rev. B 59, 1758 (1999).[27] A. Togo, L. Chaput, and I. Tanaka, Phys. Rev. B 91, 094306
(2015).[28] W. Li, J. Carrete, N. A. Katcho, and N. Mingo, Comput. Phys.
Commun. 185, 1747 (2014).[29] S.-i. Tamura, Phys. Rev. B 27, 858 (1983).[30] G. Gottstein, Physical Foundations of Materials Science
(Springer, Berlin/Heidelberg, 2004).[31] Z. Wang, J. E. Alaniz, W. Jang, J. E. Garay, and C. Dames, Nano
Lett. 11, 2206 (2011).[32] G. Chen and M. Neagu, Appl. Phys. Lett. 71, 2761 (1997).[33] H.-S. Kim, S. D. Kang, Y. Tang, R. Hanus, and G. J. Snyder,
Mater. Horiz. 3, 234 (2016).[34] X. Yang, J. Carrete, and Z. Wang, Appl. Phys. Lett. 108, 113901
(2016).[35] V. V. Bulatov, L. L. Hsiung, M. Tang, A. Arsenlis, M. C. Bartelt,
W. Cai, J. N. Florando, M. Hiratani, M. Rhee, G. Hommeset al., Nature (London) 440, 1174 (2006).
[36] D. Kotchetkov, J. Zou, A. Balandin, D. Florescu, and F. Pollak,Appl. Phys. Lett. 79, 4316 (2001).
[37] S. Kurganskii, O. Dubrovskii, and E. Domashevskaya, PhysicaStatus Solidi B 129, 293 (1985).
[38] J. A. Ashraff and P. D. Loly, J. Phys. C 20, 4823 (1987).[39] P. Lambin and J. P. Vigneron, Phys. Rev. B 29, 3430
(1984).[40] J. Carrete, B. Vermeersch, A. Katre, A. van Roekeghem, T.
Wang, G. K. H. Madsen, and N. Mingo, arXiv:1704.04142.
245304-7