a/b testing best practices - do's and don'ts
TRANSCRIPT

Intended for Knowledge Sharing only
A/B Testing is not Art, it is Science
Business Analytics Innovation Summit 2015
Business Analytics Innovation Summit | May 2015

Intended for Knowledge Sharing only
Disclaimer: Participation in this summit is purely on personal basis and not representing VISA in any form or matter. The talk is based on learnings from work across industries and firms. Care has been taken to ensure no proprietary or work related info of any firm is used in any material.
Director, Insights at Visa, Inc.
Help Executives/Product/Marketing
with actionable insights
RAMKUMAR RAVICHANDRAN

Intended for Knowledge Sharing only
Quick recap of what is it?Quick recap of what it is
Intended for Knowledge Sharing only
Quick recap on A/B Testing

Intended for Knowledge Sharing only 44
OK, SO WHAT EXACTLY IS…
A/B Testing is the simplest form of Experimental Design used to test reactions of Customers something new or changed(a feature/s, product/s, campaign/s)….
“Similar” Users
Variation 1
Variation 2
Is the delta (V1-V2)
statistically significant?
Test Metric
Value (V1)
Test Metric
Value (V2)
Intended for Knowledge Sharing only
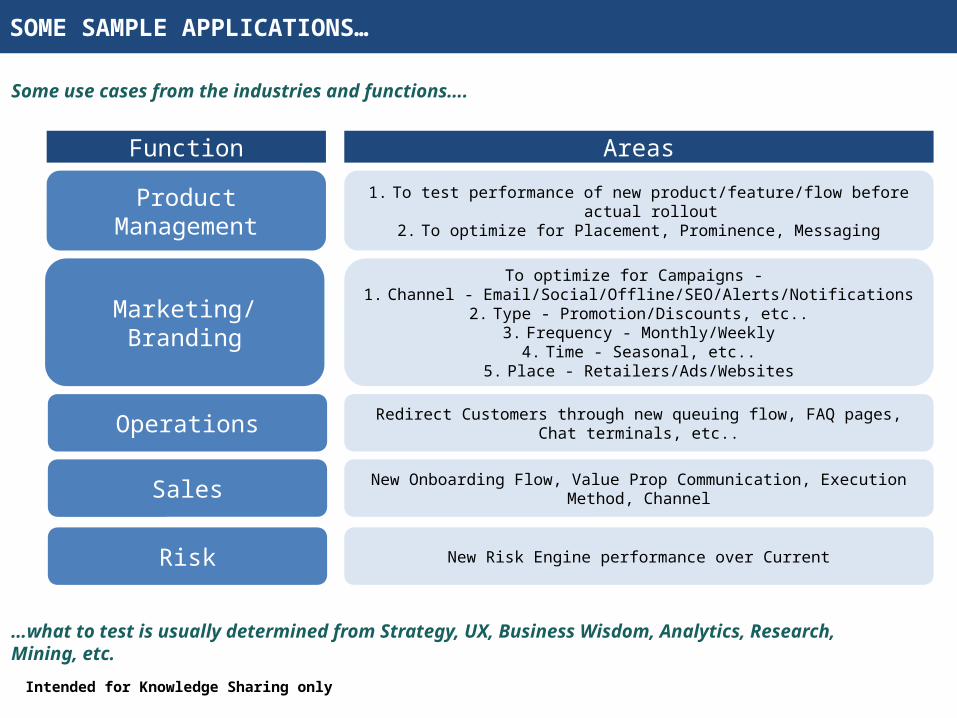
SOME SAMPLE APPLICATIONS…
Some use cases from the industries and functions….
Intended for Knowledge Sharing only
Product Management
Marketing/Branding
Operations
1. To test performance of new product/feature/flow before actual rollout
2. To optimize for Placement, Prominence, Messaging
To optimize for Campaigns - 1. Channel - Email/Social/Offline/SEO/Alerts/Notifications
2. Type - Promotion/Discounts, etc..3. Frequency - Monthly/Weekly
4. Time - Seasonal, etc..5. Place - Retailers/Ads/Websites
Redirect Customers through new queuing flow, FAQ pages, Chat terminals, etc..
Function Areas
Sales New Onboarding Flow, Value Prop Communication, Execution Method, Channel
Risk New Risk Engine performance over Current
…what to test is usually determined from Strategy, UX, Business Wisdom, Analytics, Research, Mining, etc.

Intended for Knowledge Sharing only
Quick recap of what is it?Quick recap of what it is
Intended for Knowledge Sharing only
Common Misconceptions

A DAY IN THE LIFE OF AN A/B TESTER
*only satiric to wake you up and not indicative of anyone or anything- any similarity is purely coincidental!
https://www.youtube.com/watch?v=_CHLE9hmbEw

COMMON MISPERCEPTIONS
We often hear these statements in the context of testing…
Very easy
A/B Testing will prove who is right
Test everything
Coolness is in the quantity and complexity of the test
Oh results aren’t significant – A/B Testing is a failure
…so let’s check how many of these are right
Intended for Knowledge Sharing only
Quick recap of what is it?Quick recap of what it is
Intended for Knowledge Sharing only
The big picture
THE REAL QUESTION
“Are we putting the right face in front of the Consumers”

WHAT DO YOU MEAN BY RIGHT FACE?
Message
Prominence
Flow
Form
Clear and crisp Value Prop and Call to Action (CTA)
Trendy and easy to spot
Easily spotted and fitting with the Consumer’s mental model
Quick and efficient
Minimal and relevant elements only
Placement

WHAT ARE THE HIGH LEVEL STEPS?
• Analytics team creates direct/proxy metrics to measure the performance
• Instrument metrics if needed
• Decision on the Research Methodology based on Analytical findingsA
CTIO
NS
• Defined the question to be answered and why, Design the changes, know the cost and finalize success criteria
• Quantify/Analyze the impact
• Size the potential impact on launching
Measure LaunchStrategy
PH
AS
ES
Analyze
Primary Metrics, e g.,
• Click Through Rate
• NPS
Secondary Metrics
• Repeat Visits• Lifetime Value
Questions
• Target Customers• Where and What is
being checked?• Why is this even
being considered?• Target Metrics and
success criteria
Research Methods
• Attitudinal vs. Behavioral
• Qualitative vs. Quantitative
• Context for Product Use
Factors deciding Research Methods
• Speed of execution
• Cost of execution• Reliability• Product
Development Stage
Factors deciding eventual rollout (in order of priority)
• Strategic need• Estimated impact
calculation from Analytics
• Findings from other sources (Data Analytics/Mining, Consumer Feedback
DETA
ILS
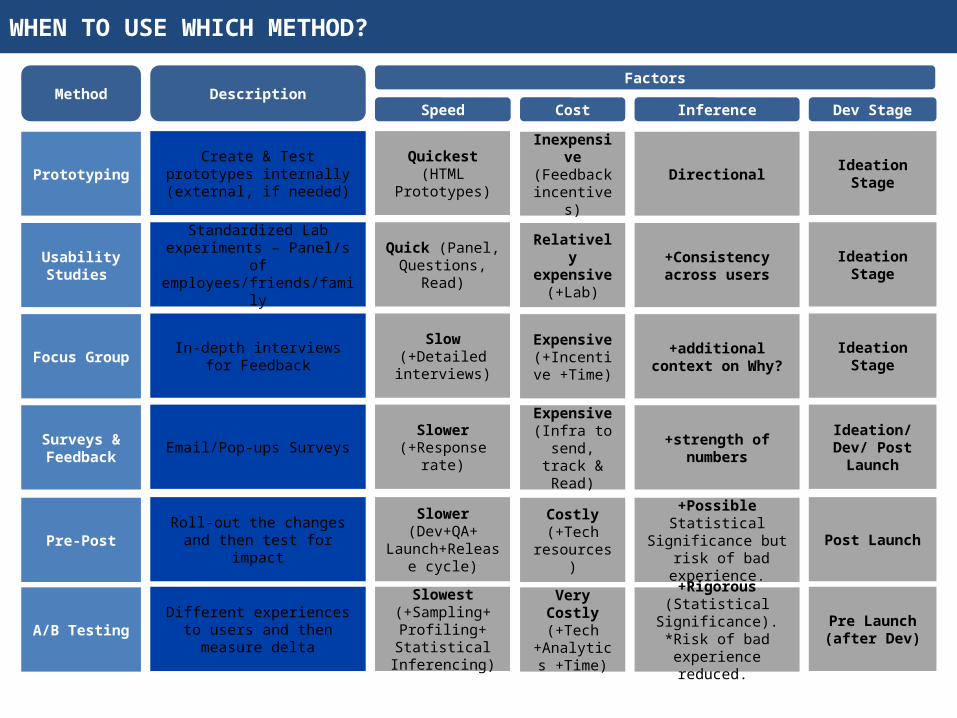
WHEN TO USE WHICH METHOD?
Method DescriptionFactors
Speed Cost Inference Dev Stage
Prototyping
Usability Studies
Focus Group
Surveys & Feedback
Pre-Post
A/B Testing
Create & Test prototypes internally (external, if
needed)
Standardized Lab experiments – Panel/s of employees/friends/family
In-depth interviews for Feedback
Email/Pop-ups Surveys
Roll-out the changes and then test for impact
Different experiences to users and then measure
delta
Quickest (HTML
Prototypes)
Quick (Panel, Questions,
Read)
Slow (+Detailed interviews)
Slower (+Response
rate)
Slower (Dev+QA+
Launch+Release cycle)
Slowest (+Sampling+
Profiling+ Statistical
Inferencing)
Inexpensive
(Feedback incentives)
Relatively expensive
(+Lab)
Expensive (+Incentive
+Time)
Expensive (Infra to
send, track & Read)
Costly (+Tech
resources)
Very Costly (+Tech
+Analytics +Time)
Directional
+Consistency across users
+additional context on Why?
+strength of numbers
+Possible Statistical
Significance but risk of bad experience.+Rigorous (Statistical
Significance). *Risk of bad experience
reduced.
Ideation Stage
Ideation Stage
Ideation Stage
Ideation/Dev/ Post Launch
Post Launch
Pre Launch (after Dev)

Intended for Knowledge Sharing only
Quick recap of what is it?Quick recap of what it is
Intended for Knowledge Sharing only
A/B Testing
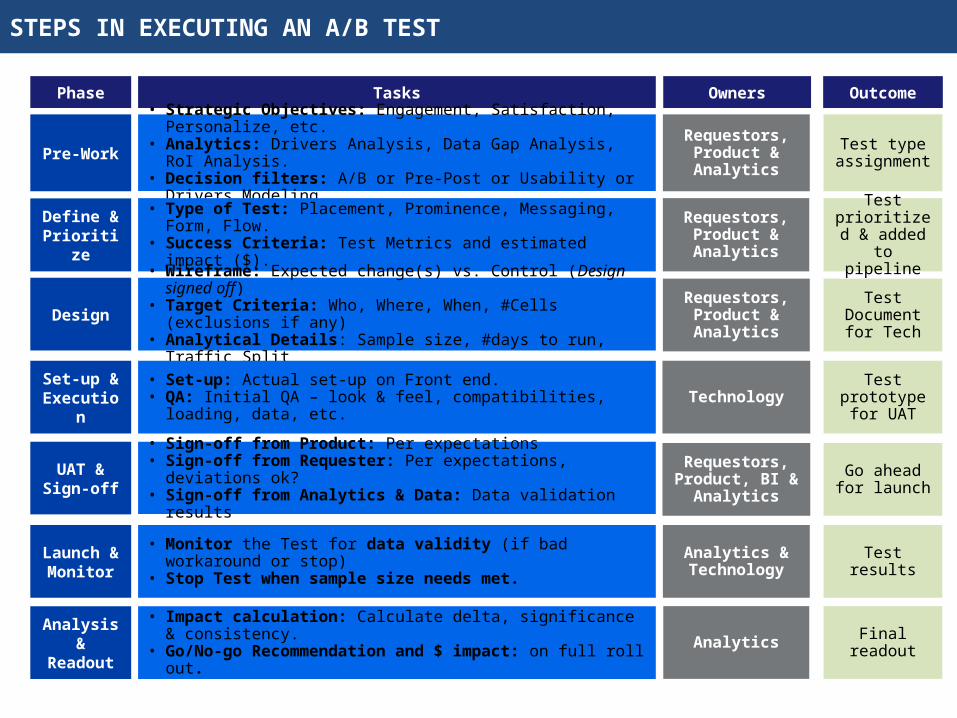
STEPS IN EXECUTING AN A/B TEST
Phase OwnersTasks Outcome
Pre-Work
Define & Prioritiz
e
Design
Set-up & Executio
n
UAT & Sign-off
Launch &
Monitor
Analysis &
Readout
• Strategic Objectives: Engagement, Satisfaction, Personalize, etc.
• Analytics: Drivers Analysis, Data Gap Analysis, RoI Analysis.
• Decision filters: A/B or Pre-Post or Usability or Drivers Modeling.
• Type of Test: Placement, Prominence, Messaging, Form, Flow.
• Success Criteria: Test Metrics and estimated impact ($).
• Wireframe: Expected change(s) vs. Control (Design signed off)
• Target Criteria: Who, Where, When, #Cells (exclusions if any)
• Analytical Details: Sample size, #days to run, Traffic Split
• Set-up: Actual set-up on Front end.• QA: Initial QA – look & feel, compatibilities, loading, data,
etc.
• Sign-off from Product: Per expectations• Sign-off from Requester: Per expectations, deviations
ok?• Sign-off from Analytics & Data: Data validation results
• Monitor the Test for data validity (if bad workaround or stop)
• Stop Test when sample size needs met.
• Impact calculation: Calculate delta, significance & consistency.
• Go/No-go Recommendation and $ impact: on full roll out.
Requestors, Product & Analytics
Requestors, Product & Analytics
Requestors, Product & Analytics
Technology
Requestors, Product, BI &
Analytics
Analytics & Technology
Analytics
Test type assignment
Test prioritized &
added to pipeline
Test Document for Tech
Test prototype for UAT
Go ahead for launch
Test results
Final readout
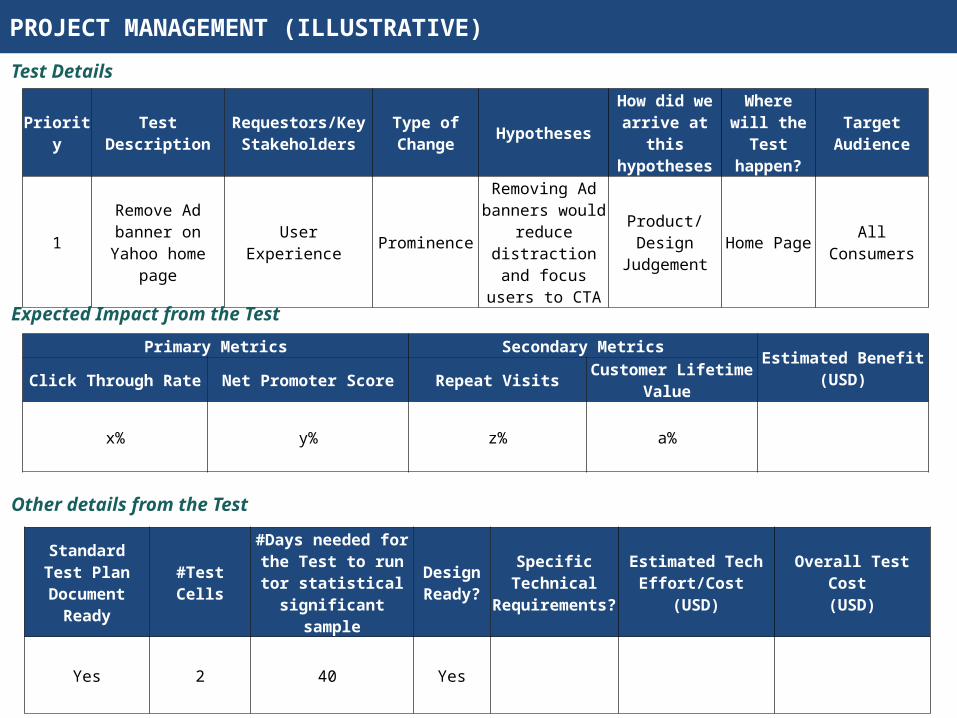
PROJECT MANAGEMENT (ILLUSTRATIVE)
PriorityTest
DescriptionRequestors/Key
StakeholdersType of Change
Hypotheses
How did we arrive at
this hypotheses
Where will the
Test happen?
Target Audience
1
Remove Ad banner on
Yahoo home page
User Experience Prominence
Removing Ad banners would
reduce distraction and focus users to
CTA
Product/Design
JudgementHome Page
All Consumers
Primary Metrics Secondary MetricsEstimated Benefit
(USD)Click Through Rate Net Promoter Score Repeat VisitsCustomer Lifetime
Value
x% y% z% a%
Standard Test Plan Document
Ready
#Test Cells
#Days needed for the Test to run tor statistical
significant sample
Design Ready?
Specific Technical
Requirements?
Estimated Tech Effort/Cost
(USD)
Overall Test Cost (USD)
Yes 2 40 Yes
Test Details
Expected Impact from the Test
Other details from the Test

NECESSARY DETAILS FOR PROJECT MANAGEMENT
Sl. No. Type of Change Example
1 Placement Right top vs. Right bottom
2 Message Do this vs. Do that
3 Prominence Size, Color, etc.
4 Flow 3 step submission to 2 step submission, etc.
5 Targeting Different set of actions to different sets of people
6 Form 5 fields to fill vs. 2 fields
Sl. No. Type of Test
1 One Cell Test (A/B Test)
2 Multiple Test (A/B/C Test)
3 Multivariate Test (A*B*C Test)
Sl. No. How did we arrive at this hypotheses?
1 Analytics
2 Consumer Feedback
3 Product/Design Judgement
4 Competitive Pressures
5 Legal Compliance
6 Partnership Requirements
7 Strategic need
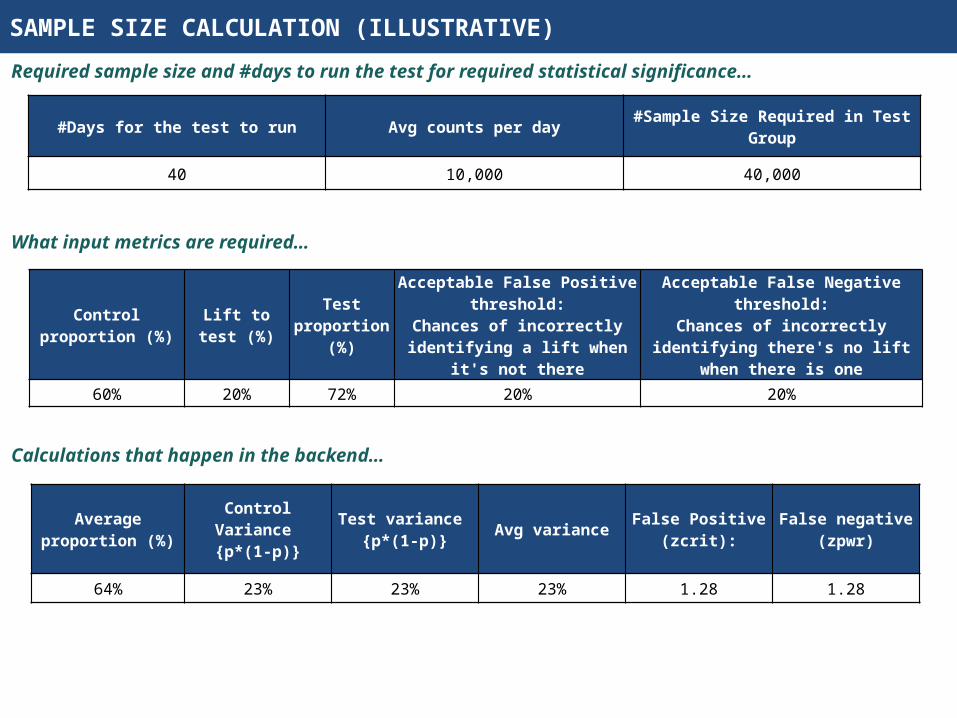
SAMPLE SIZE CALCULATION (ILLUSTRATIVE)
#Days for the test to run Avg counts per day#Sample Size Required in Test
Group
40 10,000 40,000
Control proportion (%)
Lift to test (%)
Test proportion
(%)
Acceptable False Positive threshold:
Chances of incorrectly identifying a lift when it's
not there
Acceptable False Negative threshold:
Chances of incorrectly identifying there's no lift when
there is one
60% 20% 72% 20% 20%
Required sample size and #days to run the test for required statistical significance…
What input metrics are required…
Calculations that happen in the backend…
Average proportion (%)
Control Variance {p*(1-p)}
Test variance {p*(1-p)}
Avg varianceFalse Positive
(zcrit):False negative
(zpwr)
64% 23% 23% 23% 1.28 1.28

SAMPLE READOUT
ObjectiveUnderstand if removing Ad banner on home page improves click through rate on articles and increases consumer satisfaction
1-Apr
-80
2-Apr
-80
3-Apr
-80
4-Apr
-80
5-Apr
-80
6-Apr
-80
7-Apr
-80
8-Apr
-80
9-Apr
-80
10-A
pr-8
0
11-A
pr-8
0
12-A
pr-8
0
13-A
pr-8
0
14-A
pr-8
0
0%2%4%6%8%
10%12%14%16%18%
0%
20%
40%
60%
80%
100%
120%Test metrics - Click through Rate
Delta Test Control
Te
st/
Co
ntr
ol V
alu
es
De
lta
be
twe
en
Te
st
& C
on
tro
l
Key Findings1. Removing the banner increased CTR by '100%' and NPS by 20 points '. It translates to $40 M in Lifetime Value impact. 2. All the above lifts are statistically significant at 90% confidence level. These lifts were also consistent over two weeks time window.
Sl.No.1235
Performance data Time window: Apr 1, 1980 to Apr 14, 1980
Intended for Knowledge Sharing only
Quick recap of what is it?Quick recap of what it is
Intended for Knowledge Sharing only
Other Considerations & Best Practices

THINGS TO WATCH OUT FOR
• Engineering overheads – everytime a new flow needs to be introduced or any major addition to the experience, new development is required. It has to go through Standard engineering prioritization route unless a SWAT team is dedicated to it.
• Tricky QA situations – QA team should be trained to handle A/B Testing scenarios and use cases; Integration with automated QA tools. Security and FE load failure considerations apart from standard checks.
• Operational excellence requirements – Testing of the Tests in Sandbox, Staging and Live Site Testing areas. End to End Dry runs mandatory being launching the tests.
• Analytical nuances – Experiment Design supreme need! External factors can easily invalidate A/B Testing. Sample fragmentation with increasing #tests and complexity; Need for Universal Control; Impact should be checked for significance over time.
• Data needs – Reliable instrumentation, Testing Tool Javascripts put in right place, with minimal overhead performance impact, integration with Web Analytics tool, Data feed with ability to tie with other data sources (for deep dives).
• Branding Guidelines – Don’t overwhelm and confuse users in quest for multiple and complex tests; Standardize but customize experience across various channels and platforms; Soft launches should be as much avoided as possible.
• Proactive internal communication, specifically to client facing teams.
• Strategic Decisions – Some changes have to go in irrespective of A/B Testing findings, the question would be how to make it happen right? This is gradual ramp, progressive learning and iterative improvements – a collection of A/B Tests and not one off big one.
…A/B Testing can never be a failure, by definition it is a learning on whether the change was well received by the user or not that informs the next steps

Intended for Knowledge Sharing only
Quick recap of what is it?Quick recap of what it is
Intended for Knowledge Sharing only
Appendix
Intended for Knowledge Sharing only 2323
THANK YOU!
Intended for Knowledge Sharing only
Would love to hear from you on any of the following forums…
https://twitter.com/decisions_2_0
http://www.slideshare.net/RamkumarRavichandran
https://www.youtube.com/channel/UCODSVC0WQws607clv0k8mQA/videos
http://www.odbms.org/2015/01/ramkumar-ravichandran-visa/
https://www.linkedin.com/pub/ramkumar-ravichandran/10/545/67a
Intended for Knowledge Sharing only 24
RESEARCH/LEARNING RESOURCES
Intended for Knowledge Sharing only
• When to use which Research Methodhttp://www.nngroup.com/articles/which-ux-research-methods/• Building our own Participatory Research Communityhttp://uxmag.com/articles/build-your-own-participant-resource-for-ux-research• Additional details on User Research Methodshttp://www.usability.gov/what-and-why/user-research.html• Practical questions on User Researchhttp://www.slideshare.net/dgcooley/introduction-to-ux-research-methods• A/B Tool comparisonhttp://www.roidna.com/tools/ab-testing-tool/#tool-comparison• Best Practices on A/B Testinghttp://conversionxl.com/12-ab-split-testing-mistakes-i-see-businesses-make-all-the-time/#.• Case Studies on A/B Testinghttp://white.net/noise/30-multivariate-ab-split-testing-tools-tutorials-resources/

A/B TESTING TOOL EVALUATION STEPS
• Step 1: Decide on evaluation criteria & test use cases in discussion with various stakeholder teams - Analytics & Testing, Business Intelligence, Marketing, Product Management & Engineering
• Step 2: First round interview with the Sales teams to understand what tools meet the criteria
• Step 3: Request product capability demo on the test use cases and evaluate the level of investment (resources & time) needed for such use cases
• Step 4: Interview with current Customer references
• Step 5: Conduct specific “engineering/security” focused discussion to evaluate the implementation cost, resources and time and fit with existing infrastructure
• Step 6: Cross functional Panel discussion on the findings from the Evaluation round and decisioning on the vendor

A/B TESTING TOOL EVALUATION CRITERIA
• Type of Testing: A/B Testing, Multiple A/B Testing, Multi-factor testing
• Traffic distribution: Flexibility of Traffic distribution (non 50-50), Segmentation (Region), Universal Control
• What can be tested: Placement, Prominence, Messaging, Funnels, Channels, etc.
• Test Metrics: Clicks, Page Views, Conversion, Time Spent, etc.
• Implementation effort: Time, Resources, What can & cannot be done, Latency, Winner Variation ramp and Version Release dependencies in App Testing
• Channels: Web, Native App, Mobile Website
• Pricing packages: Users, Page Load, Monthly Service Contract (Type), etc.
• Programming experience: GUI vs. Coding (Small Test vs. Complex Test)
• Analysis options: Analysis & Reporting Flexibility, Post (or in-flight) Testing Segmentation
• Current Customer Base:
• Security limitations