abacus property group · abacus property group securityholder review 2017. abacus property group is...
TRANSCRIPT
SECURITYHOLDER REVIEW 2017
A b a c u s P ro p e r t yG ro u p
GLOSSARYAbacus Abacus Funds
Management Limited, the responsible entity of the trusts
AGHL Abacus Group Holdings Limited
AGPL Abacus Group Projects Limited
AIT Abacus Income Trust
APG Abacus Property Group
ASOL Abacus Storage Operations Limited
ASPT Abacus Storage Property Trust
AT Abacus Trust
Group Abacus Property Group
CONTENTS01 About Abacus
04 Financial highlights
06 Chairmam and Managing Director’s report
11 Group performance
12 Group performance – office
13 Group performance – retail
14 Group performance – industrial and other
15 Group performance – self-storage
16 Group performance – developments
19 Investor relations, directory and disclaimers section
20 Contact us
20 Key dates and securities exchange listing
COVER IMAGE: Outlook from THE PRINCE residential development Canberra ACT
A B A C U S P R O P E R T Y G R O U P | S E C U R I T Y H O L D E R R E V I E W 2 0 1 7
Abacus Property Group is a leading diversified Australian real estate investment trust that invests in real estate opportunities across Australia and New Zealand. Abacus was established in 1996. We listed on the ASX in 2002 and are included in the S&P/ASX 200 index.
Abacus’s overarching strategy is to invest our capital in core plus properties. We take advantage of value adding opportunities to drive long term total returns and maximise securityholder value.
We have a successful track record of acquiring property based assets and actively managing those assets to enhance income and capital growth. Our core plus presence and track record has facilitated joint ventures with a number of sophisticated global third party capital providers. We look for assets and projects in major centres, typically on the Eastern seaboard of Australia, that are mispriced by the market and which we believe have the potential for income and capital growth.
A b o u tu s
Our experience has shown that strict adherence to our fundamental investment criteria enables us to buy assets well and provide opportunities for outperformance while minimising downside risk to equity.
Abacus has two integrated property businesses built on our core expertise in accessing properties and projects and actively managing them to realise their full value. Our flat corporate structure and business model supports strong synergies across our businesses and contributes to the overall success of the businesses and the Group.
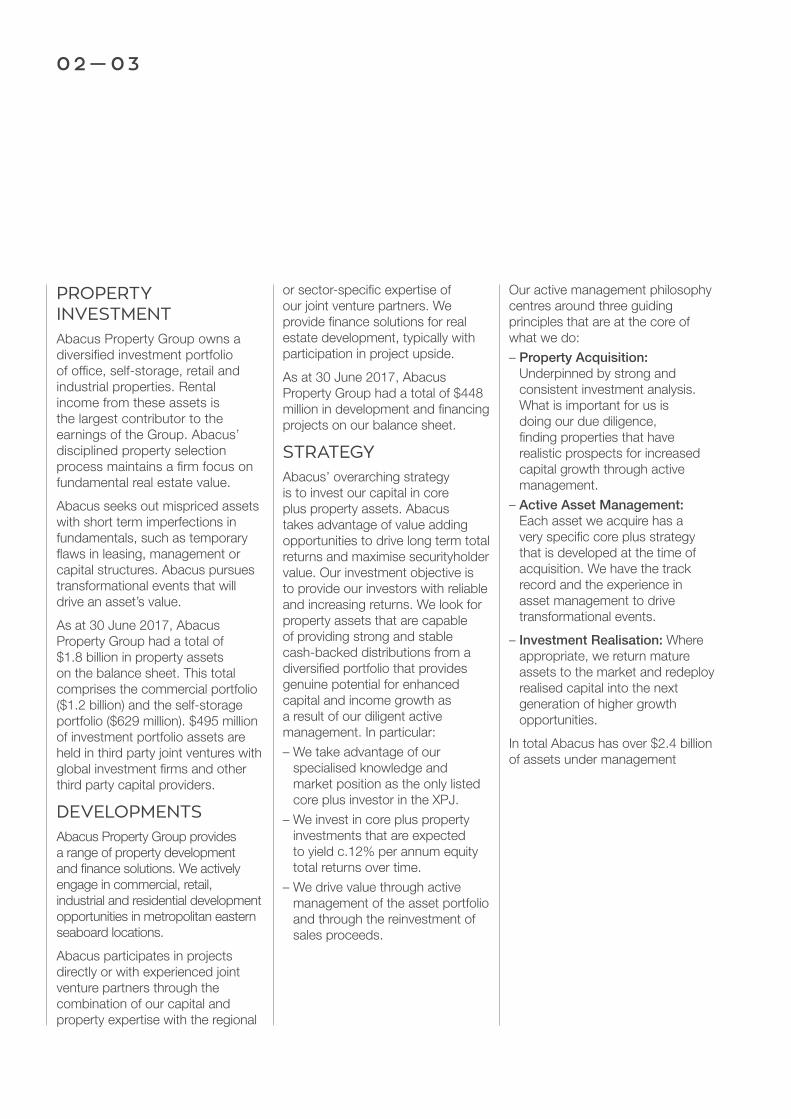
0 2 — 0 3
PROPERTY INVESTMENTAbacus Property Group owns a diversified investment portfolio of office, self-storage, retail and industrial properties. Rental income from these assets is the largest contributor to the earnings of the Group. Abacus’ disciplined property selection process maintains a firm focus on fundamental real estate value.
Abacus seeks out mispriced assets with short term imperfections in fundamentals, such as temporary flaws in leasing, management or capital structures. Abacus pursues transformational events that will drive an asset’s value.
As at 30 June 2017, Abacus Property Group had a total of $1.8 billion in property assets on the balance sheet. This total comprises the commercial portfolio ($1.2 billion) and the self-storage portfolio ($629 million). $495 million of investment portfolio assets are held in third party joint ventures with global investment firms and other third party capital providers.
DEVELOPMENTSAbacus Property Group provides a range of property development and finance solutions. We actively engage in commercial, retail, industrial and residential development opportunities in metropolitan eastern seaboard locations.
Abacus participates in projects directly or with experienced joint venture partners through the combination of our capital and property expertise with the regional
or sector-specific expertise of our joint venture partners. We provide finance solutions for real estate development, typically with participation in project upside.
As at 30 June 2017, Abacus Property Group had a total of $448 million in development and financing projects on our balance sheet.
STRATEGYAbacus’ overarching strategy is to invest our capital in core plus property assets. Abacus takes advantage of value adding opportunities to drive long term total returns and maximise securityholder value. Our investment objective is to provide our investors with reliable and increasing returns. We look for property assets that are capable of providing strong and stable cash-backed distributions from a diversified portfolio that provides genuine potential for enhanced capital and income growth as a result of our diligent active management. In particular:
– We take advantage of our specialised knowledge and market position as the only listed core plus investor in the XPJ.
– We invest in core plus property investments that are expected to yield c.12% per annum equity total returns over time.
– We drive value through active management of the asset portfolio and through the reinvestment of sales proceeds.
Our active management philosophy centres around three guiding principles that are at the core of what we do:
– Property Acquisition: Underpinned by strong and consistent investment analysis. What is important for us is doing our due diligence, finding properties that have realistic prospects for increased capital growth through active management.
– Active Asset Management: Each asset we acquire has a very specific core plus strategy that is developed at the time of acquisition. We have the track record and the experience in asset management to drive transformational events.
– Investment Realisation: Where appropriate, we return mature assets to the market and redeploy realised capital into the next generation of higher growth opportunities.
In total Abacus has over $2.4 billion of assets under management
A B A C U S P R O P E R T Y G R O U P | S E C U R I T Y H O L D E R R E V I E W 2 0 1 7
IMAGE: Westpac House,91 King William Street
Adelaide SA
0 4 — 0 5
2017 financial highlights
2017 Property Highlights
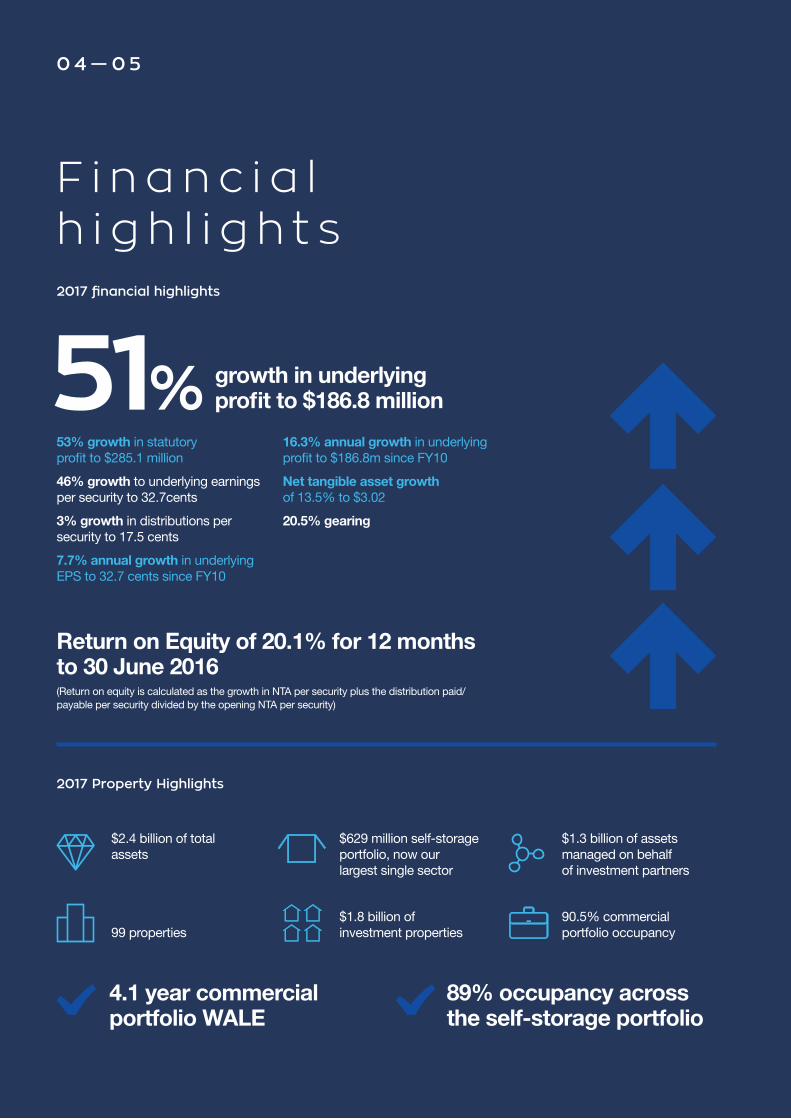
53% growth in statutory profit to $285.1 million
46% growth to underlying earnings per security to 32.7cents
3% growth in distributions per security to 17.5 cents
7.7% annual growth in underlying EPS to 32.7 cents since FY10
growth in underlying profit to $186.8 million51%
16.3% annual growth in underlying profit to $186.8m since FY10
Net tangible asset growth of 13.5% to $3.02
20.5% gearing
(Return on equity is calculated as the growth in NTA per security plus the distribution paid/payable per security divided by the opening NTA per security)
Return on Equity of 20.1% for 12 months to 30 June 2016
89% occupancy across the self-storage portfolio
$2.4 billion of total assets
$1.8 billion of investment properties
$629 million self-storage portfolio, now our largest single sector
$1.3 billion of assets managed on behalf of investment partners
99 properties90.5% commercial portfolio occupancy
4.1 year commercial portfolio WALE
F i n a n c i a l h i g h l i g h t s
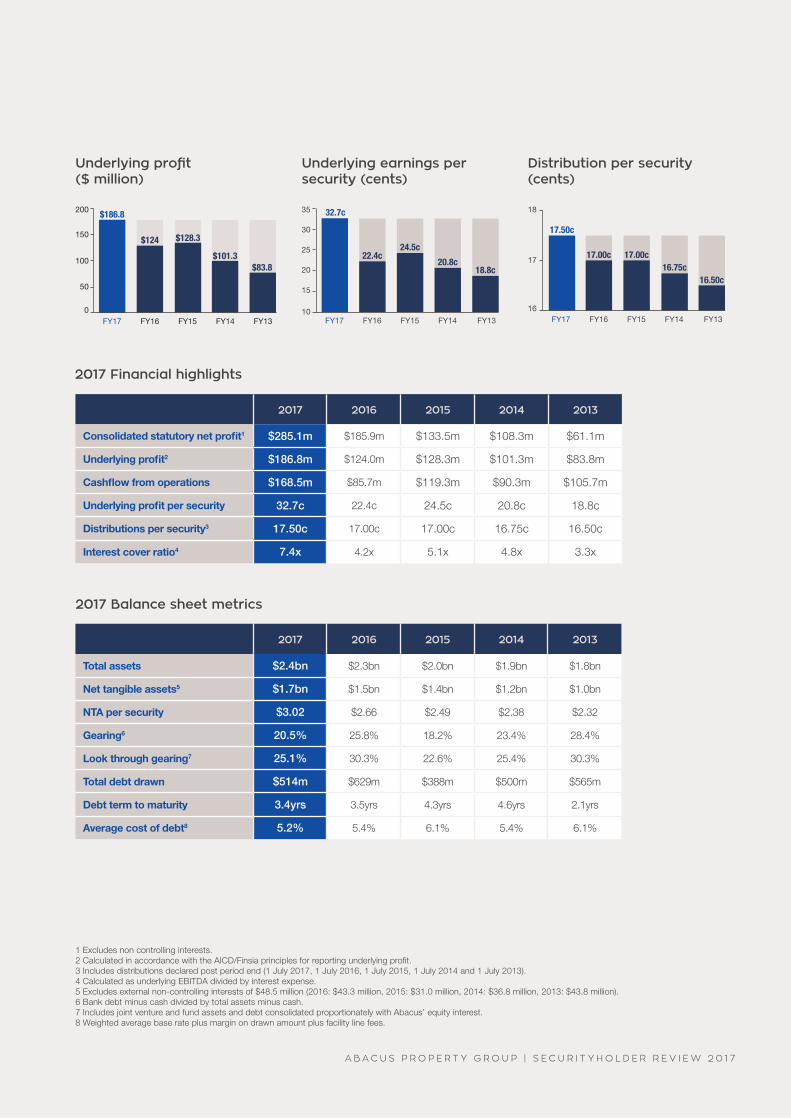
1 Excludes non controlling interests.2 Calculated in accordance with the AICD/Finsia principles for reporting underlying profit.3 Includes distributions declared post period end (1 July 2017, 1 July 2016, 1 July 2015, 1 July 2014 and 1 July 2013).4 Calculated as underlying EBITDA divided by interest expense.5 Excludes external non-controlling interests of $48.5 million (2016: $43.3 million, 2015: $31.0 million, 2014: $36.8 million, 2013: $43.8 million).6 Bank debt minus cash divided by total assets minus cash.7 Includes joint venture and fund assets and debt consolidated proportionately with Abacus’ equity interest.8 Weighted average base rate plus margin on drawn amount plus facility line fees.
2017 2016 2015 2014 2013
Consolidated statutory net profit1 $285.1m $185.9m $133.5m $108.3m $61.1m
Underlying profit2 $186.8m $124.0m $128.3m $101.3m $83.8m
Cashflow from operations $168.5m $85.7m $119.3m $90.3m $105.7m
Underlying profit per security 32.7c 22.4c 24.5c 20.8c 18.8c
Distributions per security3 17.50c 17.00c 17.00c 16.75c 16.50c
Interest cover ratio4 7.4x 4.2x 5.1x 4.8x 3.3x
2017 Financial highlights
2017 2016 2015 2014 2013
Total assets $2.4bn $2.3bn $2.0bn $1.9bn $1.8bn
Net tangible assets5 $1.7bn $1.5bn $1.4bn $1.2bn $1.0bn
NTA per security $3.02 $2.66 $2.49 $2.38 $2.32
Gearing6 20.5% 25.8% 18.2% 23.4% 28.4%
Look through gearing7 25.1% 30.3% 22.6% 25.4% 30.3%
Total debt drawn $514m $629m $388m $500m $565m
Debt term to maturity 3.4yrs 3.5yrs 4.3yrs 4.6yrs 2.1yrs
Average cost of debt8 5.2% 5.4% 6.1% 5.4% 6.1%
2017 Balance sheet metrics
FY17 FY16 FY15 FY14 FY13
17.50c
17.00c 17.00c16.75c
16.50c
16
17
18
FY17 FY16 FY15 FY14 FY130
50
100
150
200
$128.3
$101.3$83.8
$124
$186.8
FY17 FY16 FY15 FY14 FY1310
15
20
25
30
35
24.5c
20.8c18.8c
22.4c
32.7c
Underlying profit ($ million)
Underlying earnings per security (cents)
Distribution per security (cents)
A B A C U S P R O P E R T Y G R O U P | S E C U R I T Y H O L D E R R E V I E W 2 0 1 7
0 6 — 0 7
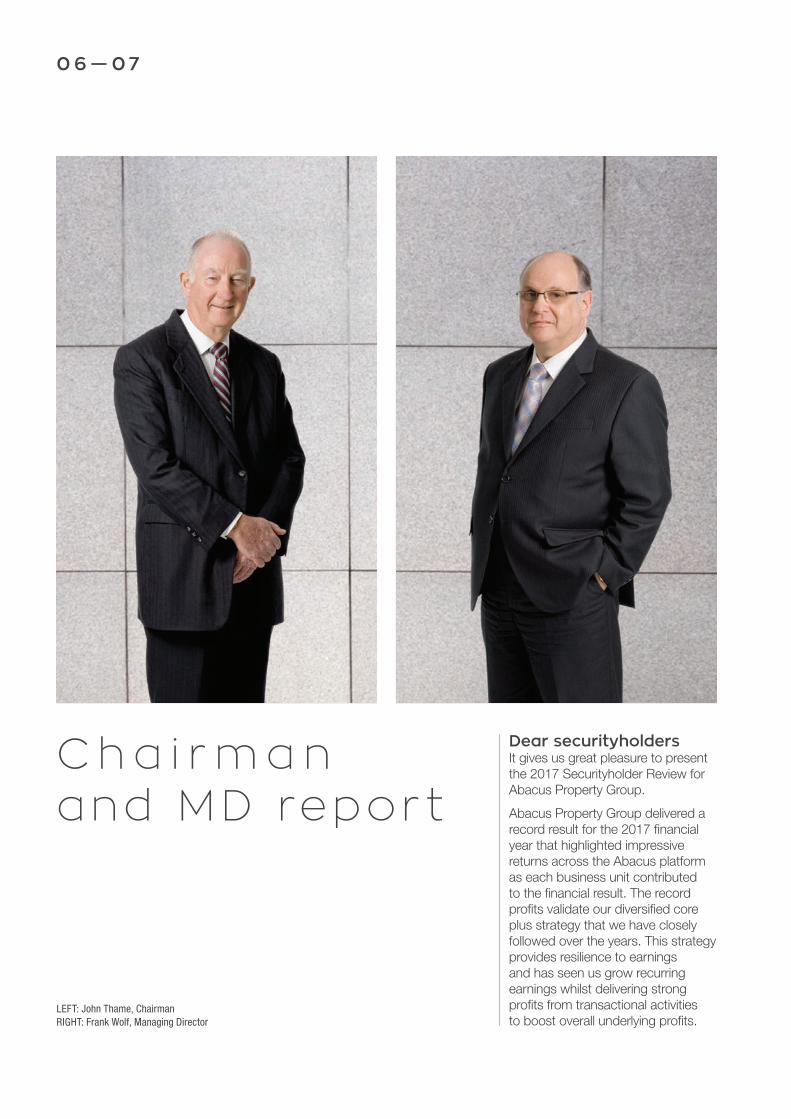
C h a i r m a n and MD repor t
Dear securityholdersIt gives us great pleasure to present the 2017 Securityholder Review for Abacus Property Group.
Abacus Property Group delivered a record result for the 2017 financial year that highlighted impressive returns across the Abacus platform as each business unit contributed to the financial result. The record profits validate our diversified core plus strategy that we have closely followed over the years. This strategy provides resilience to earnings and has seen us grow recurring earnings whilst delivering strong profits from transactional activities to boost overall underlying profits.
LEFT: John Thame, Chairman RIGHT: Frank Wolf, Managing Director
A B A C U S P R O P E R T Y G R O U P | S E C U R I T Y H O L D E R R E V I E W 2 0 1 7
The record result delivered growth of 53% in consolidated statutory profit to $285.1 million. This translated into underlying profit of $186.8 million, growth of 51% on our FY16 underlying profit result of $124 million. The Group has achieved a 16.3% per annum growth in underlying earnings since FY10.
We delivered an underlying earnings per security of 32.7c for the year with the Group now achieving almost an 8% per annum compound growth in underlying earnings per security to securityholders over seven financial periods since FY10. Pleasingly our strong results underwrote our growth in distributions per security of 3% to 17.5 cents to securityholders. Distributions are typically paid out of recurring earnings, which consists of revenue from recurring and passive activities like rental income from our commercial and self-storage properties, funds management fees and interest income from our loans. We continuously seek to grow the revenue from these activities so that we can support our commitment to securityholders to grow distributions per security by 2-3% per annum and that they remain underpinned by recurring earnings. The Group’s recurring earnings per security during FY17 was 18 cents. These surplus earnings are re-invested into new opportunities to grow our recurring earnings to support the growth in distributions to securityholders into the future.
Abacus’ balance sheet continues to maintain prudent levels of liquidity and gearing. Gearing remains low at 20%, well within our target gearing limit of up to 35%. A number of
liquidity events during the year led to strong growth in cashflows. This provided for a reduction in drawn debt at year end and subsequently provides significant balance sheet liquid allowing for up to $500 million of acquisition capacity. While gearing levels are low, we are committed to ensuring we have a productive balance sheet and will endeavour to ensure the Group is adequately invested in income producing assets.
At our AGM in November 2016, the Group articulated our investment strategy for the foreseeable future and we have made strong in-roads towards our objectives. We indicated that we would look to allocate our investment capital on acquisitions across the self-storage and office sectors as we believed they represented the best risk adjusted returns at this stage in the cycle. Funding acquisitions across these sectors would be through the expected realisations of our residential developments over the coming years.
Abacus securities delivered another strong return during the year with a 14.5 percentage point outperformance in its total return for the 12 months to 30 June 2017 against the property benchmark index, the S&P ASX 200 A-REIT index. Pleasingly, Abacus also experienced strong growth in its balance sheet assets during the year, driving net tangible assets (NTA) per security growth of 13.5% from $2.66 to $3.02 at 30 June 2017. This contributed to a return on equity1 for securityholders for the 12 months to 30 June 2017 of 20.1%.
1 Return on Equity is calculated as the growth in NTA per security plus the distribution paid/payable per security divided by the opening NTA per security.
The Group’s annual financial report includes our operating and financial review (OFR). The objectives of the OFR are to provide our securityholders with a narrative and analysis to supplement the financial report and assist in understanding our operations, financial position, business strategies and prospects. It contains information you need to make an informed assessment of the Group. We encourage you to read the OFR.
0 8 — 0 9
stakeholders, for your continuing support. We are pleased with what we have been able to achieve and we are confident that we are positioning Abacus to be able to continue to deliver strong long term total returns. This would not be possible without the dedication and hard work of everyone at Abacus. Therefore, on behalf of the Board, we would like to thank our executive team and all our staff.
John Thame, Chairman
Frank Wolf, Managing Director
SustainabilityWe are very proud of the commitment and improvements to our sustainability protocol and strategies throughout the year. Abacus is pleased to deliver on our commitment to our sustainability reporting journey by producing our inaugural Sustainability report that was prepared in accordance with the Global Reporting Initiative’s G4 reporting guidelines ‘core’ requirements. Our GRI G4 core sustainability report for FY17 illustrates the environmental footprint from the Group’s operations, and management and key performance indicators over time, to help us manage and reduce our consumption of natural resources, all under a global accepted framework for sustainability reporting. We encourage you to read this report.
We do recognise that Abacus is an active core plus manager. We acquire assets that we believe are mispriced by the market and fix that mispricing through active management. We believe this strategy has a positive impact on the environment as we extend and rejuvenate the life cycle of assets that may be on their way to becoming obsolete and ultimately end in demolition and rebuilding. This causes a negative impact on the environment and the use of additional natural resources.
We will continue to improve on our reporting requirements to the community and the sustainability of our property portfolio through active ongoing property management to incorporate more efficient plant and equipment. The environmentally
focused management of our buildings contributes to capital appreciation of these assets over time.
OutlookWe are very proud of our record results for this financial year. While the financial results are strong we are also proud of delivering so successfully via our diversified core plus strategy. This continues to highlight our ability to grow returns across our business as we move through the differing cycles of each business sector.
The business outlook remains positive with expected growth in our recurring earnings base which provides scope to deliver on our stated distribution policy to grow distributions per security at c.2-3%pa for securityholders. We see our distribution growth as sustainable and stable despite any fluctuations in earnings per security due to higher or lower levels of transactional profits.
The balance sheet is on track to grow over the coming years, as our investment strategies increase investment allocated to self-storage and investment properties and we expect the completion and realisation of our residential development projects. We will look to enhance our investment capacity utilising our third party capital platform.
Abacus is targeting a distribution of 18.0 cps for FY18, a 3% increase on FY17 distributions per security and at the higher end of our stated distribution growth target.
Finally we and the other members of our Board would like to thank you, our investors and our other
IMAGE: Artist impression of EVE residential development in South Brisbane QLD
1 Return on Equity is calculated as the growth in NTA per security plus the distribution paid/payable per security divided by the opening NTA per security.

A B A C U S P R O P E R T Y G R O U P | S E C U R I T Y H O L D E R R E V I E W 2 0 1 7
1 0 — 1 1
A B A C U S P R O P E R T Y G R O U P | S E C U R I T Y H O L D E R R E V I E W 2 0 1 7
FY17 FINANCIAL RESULTSWe have delivered a record financial result with contributions from all of Abacus’ businesses delivering impressive returns across all of the Group’s main financial and capital metrics. The record result delivered a 51% increase in Underlying profit to $186.8 million and a 46% increase in underlying earnings per security to 32.7cps. Abacus’ total assets increased to almost $2.4 billion, while net tangible assets increased over 17% to $1.74 billion, at year end. The Group’s net tangible asset backing per security improved to $3.02 driven by strong earnings performance across the Group and growth in asset valuations following capitalisation rate compression across the portfolio.
The Abacus balance sheet was in a robust capital position at balance date with a low gearing level of 20%. This followed strong realisations during the year across the investment property and residential development portfolios. Our low levels of gearing provide significant liquidity levels that provide for $500 million of acquisition capacity.
There are no debt expiries in 2018 and our average debt term to maturity is over 3.4 years. We anticipate Abacus’ weighted average interest rate will remain relatively stable as current capacity is utilised and anticipate it should be no greater than 5.50% over FY18.
The Group’s business is focused on driving recurring earnings while producing strong capital returns. This will underpin the delivery of distribution growth to securityholders.
G ro u p p e r fo r m a n c e
OVERVIEW OF OUR OPERATING DIVISIONS
Investment portfolio
The Group has $1.8 billion of investment properties spread across our commercial and self-storage portfolios. This includes $495 million invested alongside our investment partners in over $1.3 billion of mostly office and retail assets under management through our third party capital platform. Abacus’ third party capital joint ventures remain an integral strategic investment platform for the Group. We are focused on expanding our investment relationships and product offerings to meet the needs of our investment partners.
We have substantial acquisition capacity which we are confident of utilising to grow our investment to larger office, industrial and retail assets while continuing our growth strategy across our self-storage portfolio.
Our investment portfolio delivered $177.5 million EBITDA for the financial year. This result pleasingly highlighted an improvement to earnings from rental and self-storage income on FY16 despite the sale of a number of assets in the portfolio. Profits from the sale of investment assets contributed c.$50 million to this year’s result from the sale of 4 investment properties for $160 million during the year.
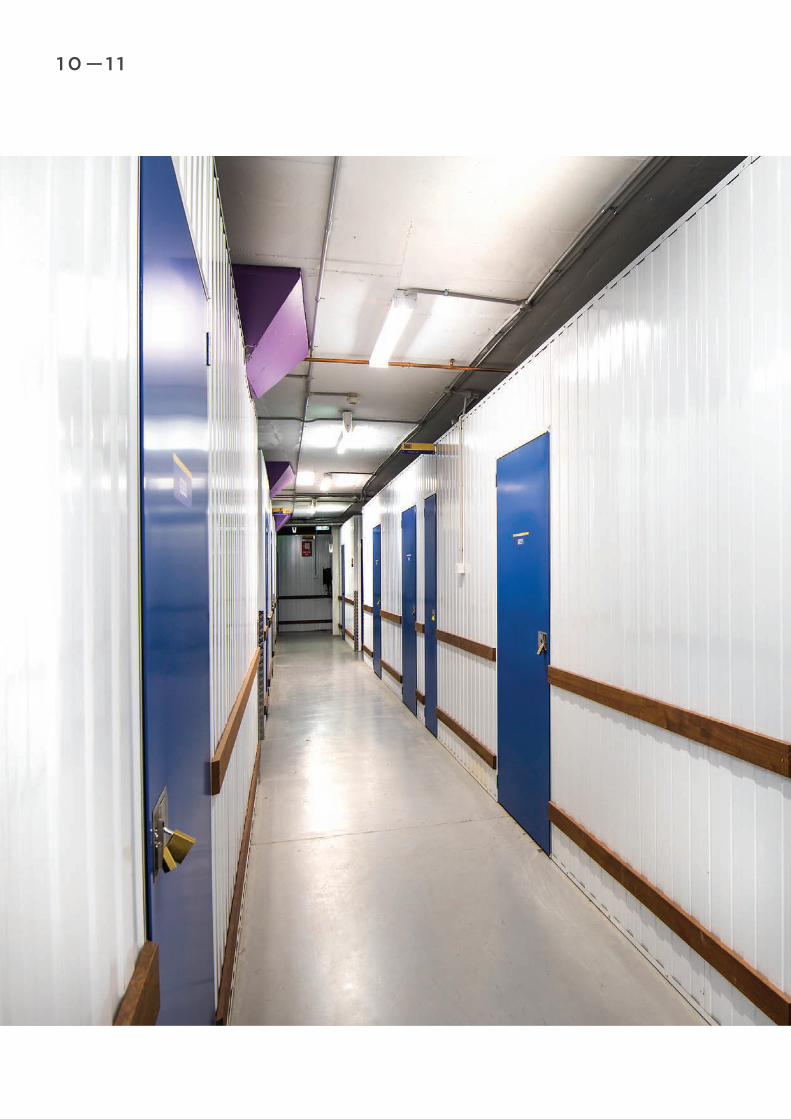
IMAGE: Self-storage facility, St Peters NSW
1 2 — 1 3
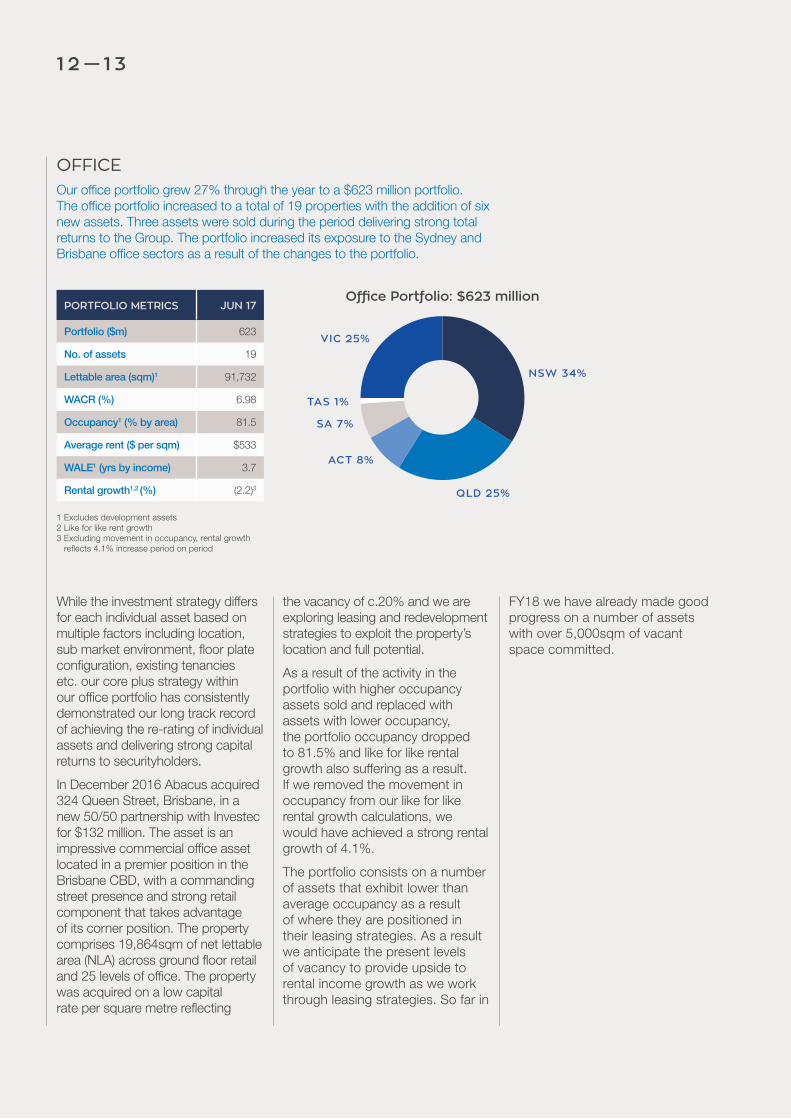
OFFICEOur office portfolio grew 27% through the year to a $623 million portfolio. The office portfolio increased to a total of 19 properties with the addition of six new assets. Three assets were sold during the period delivering strong total returns to the Group. The portfolio increased its exposure to the Sydney and Brisbane office sectors as a result of the changes to the portfolio.
PORTFOLIO METRICS JUN 17
Portfolio ($m) 623
No. of assets 19
Lettable area (sqm)1 91,732
WACR (%) 6.98
Occupancy1 (% by area) 81.5
Average rent ($ per sqm) $533
WALE1 (yrs by income) 3.7
Rental growth1,2 (%) (2.2)3
While the investment strategy differs for each individual asset based on multiple factors including location, sub market environment, floor plate configuration, existing tenancies etc. our core plus strategy within our office portfolio has consistently demonstrated our long track record of achieving the re-rating of individual assets and delivering strong capital returns to securityholders.
In December 2016 Abacus acquired 324 Queen Street, Brisbane, in a new 50/50 partnership with Investec for $132 million. The asset is an impressive commercial office asset located in a premier position in the Brisbane CBD, with a commanding street presence and strong retail component that takes advantage of its corner position. The property comprises 19,864sqm of net lettable area (NLA) across ground floor retail and 25 levels of office. The property was acquired on a low capital rate per square metre reflecting
the vacancy of c.20% and we are exploring leasing and redevelopment strategies to exploit the property’s location and full potential.
As a result of the activity in the portfolio with higher occupancy assets sold and replaced with assets with lower occupancy, the portfolio occupancy dropped to 81.5% and like for like rental growth also suffering as a result. If we removed the movement in occupancy from our like for like rental growth calculations, we would have achieved a strong rental growth of 4.1%.
The portfolio consists on a number of assets that exhibit lower than average occupancy as a result of where they are positioned in their leasing strategies. As a result we anticipate the present levels of vacancy to provide upside to rental income growth as we work through leasing strategies. So far in
FY18 we have already made good progress on a number of assets with over 5,000sqm of vacant space committed.
1 Excludes development assets2 Like for like rent growth3 Excluding movement in occupancy, rental growth
reflects 4.1% increase period on period
Office Portfolio: $623 million
NSW 34%
VIC 25%
TAS 1%
SA 7%
ACT 8%
QLD 25%
A B A C U S P R O P E R T Y G R O U P | S E C U R I T Y H O L D E R R E V I E W 2 0 1 7
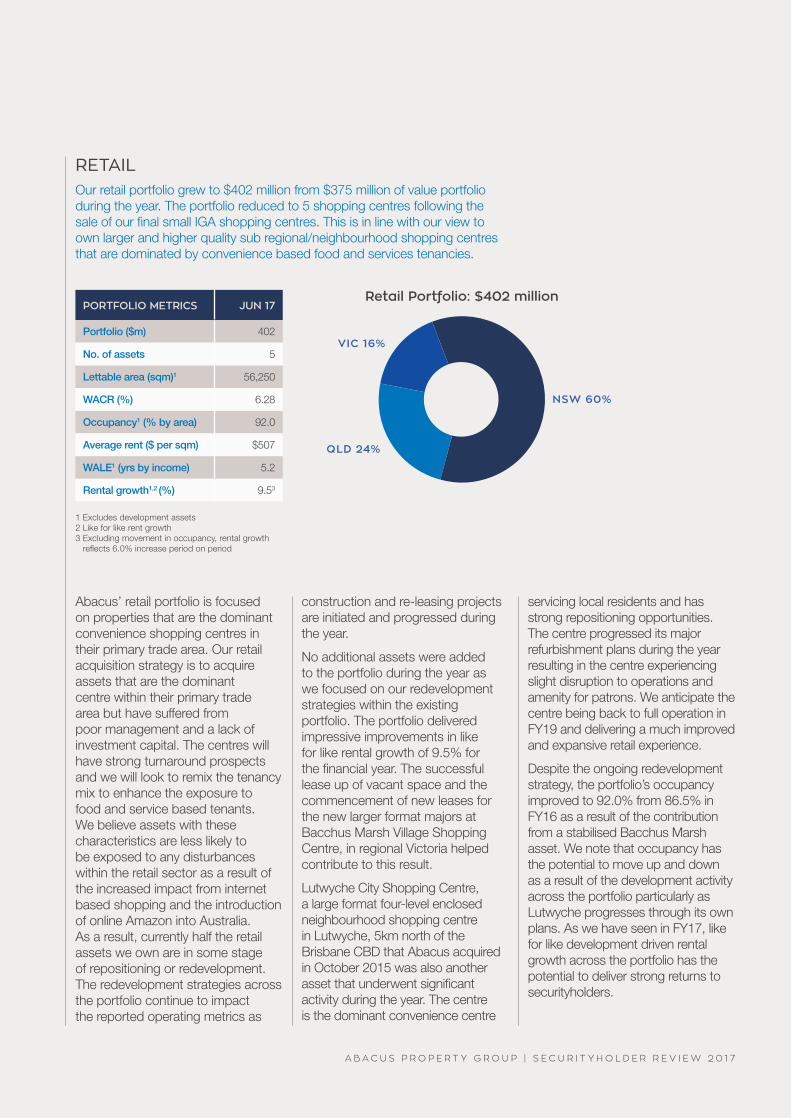
RETAILOur retail portfolio grew to $402 million from $375 million of value portfolio during the year. The portfolio reduced to 5 shopping centres following the sale of our final small IGA shopping centres. This is in line with our view to own larger and higher quality sub regional/neighbourhood shopping centres that are dominated by convenience based food and services tenancies.
PORTFOLIO METRICS JUN 17
Portfolio ($m) 402
No. of assets 5
Lettable area (sqm)1 56,250
WACR (%) 6.28
Occupancy1 (% by area) 92.0
Average rent ($ per sqm) $507
WALE1 (yrs by income) 5.2
Rental growth1,2 (%) 9.53
Abacus’ retail portfolio is focused on properties that are the dominant convenience shopping centres in their primary trade area. Our retail acquisition strategy is to acquire assets that are the dominant centre within their primary trade area but have suffered from poor management and a lack of investment capital. The centres will have strong turnaround prospects and we will look to remix the tenancy mix to enhance the exposure to food and service based tenants. We believe assets with these characteristics are less likely to be exposed to any disturbances within the retail sector as a result of the increased impact from internet based shopping and the introduction of online Amazon into Australia. As a result, currently half the retail assets we own are in some stage of repositioning or redevelopment. The redevelopment strategies across the portfolio continue to impact the reported operating metrics as
construction and re-leasing projects are initiated and progressed during the year.
No additional assets were added to the portfolio during the year as we focused on our redevelopment strategies within the existing portfolio. The portfolio delivered impressive improvements in like for like rental growth of 9.5% for the financial year. The successful lease up of vacant space and the commencement of new leases for the new larger format majors at Bacchus Marsh Village Shopping Centre, in regional Victoria helped contribute to this result.
Lutwyche City Shopping Centre, a large format four-level enclosed neighbourhood shopping centre in Lutwyche, 5km north of the Brisbane CBD that Abacus acquired in October 2015 was also another asset that underwent significant activity during the year. The centre is the dominant convenience centre
servicing local residents and has strong repositioning opportunities. The centre progressed its major refurbishment plans during the year resulting in the centre experiencing slight disruption to operations and amenity for patrons. We anticipate the centre being back to full operation in FY19 and delivering a much improved and expansive retail experience.
Despite the ongoing redevelopment strategy, the portfolio’s occupancy improved to 92.0% from 86.5% in FY16 as a result of the contribution from a stabilised Bacchus Marsh asset. We note that occupancy has the potential to move up and down as a result of the development activity across the portfolio particularly as Lutwyche progresses through its own plans. As we have seen in FY17, like for like development driven rental growth across the portfolio has the potential to deliver strong returns to securityholders.
1 Excludes development assets2 Like for like rent growth3 Excluding movement in occupancy, rental growth
reflects 6.0% increase period on period
Retail Portfolio: $402 million
VIC 16%
QLD 24%
NSW 60%
1 4 — 1 5
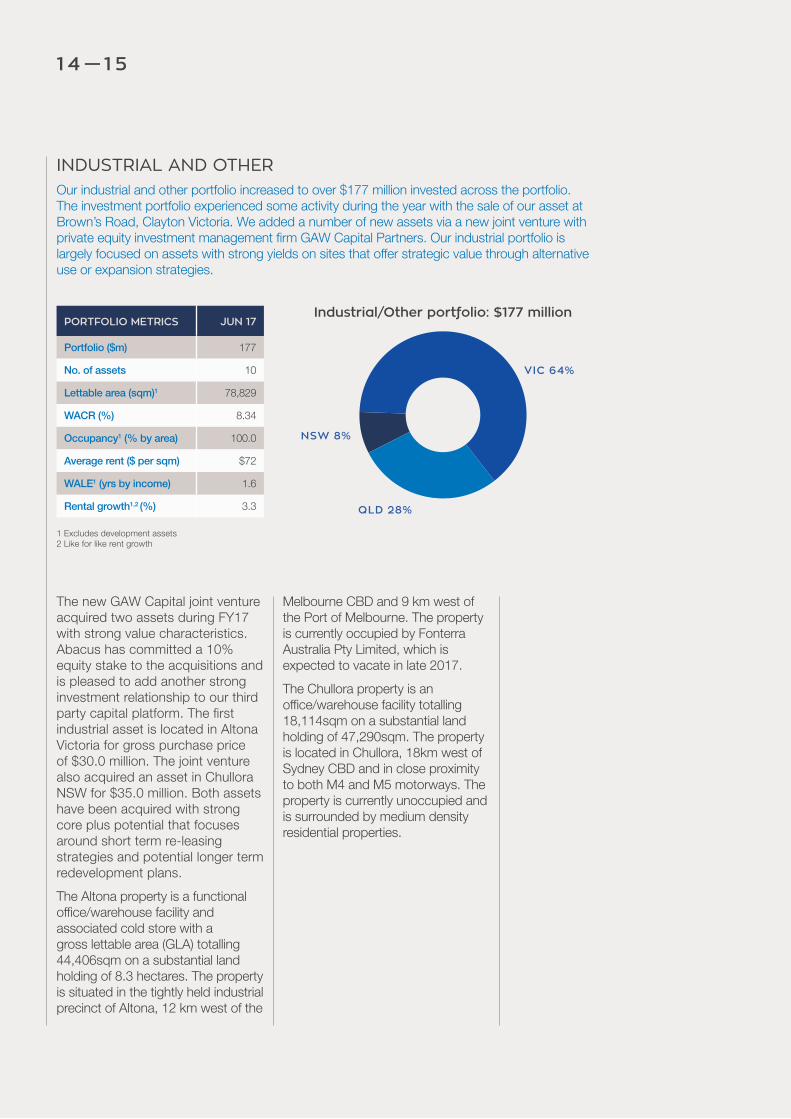
INDUSTRIAL AND OTHEROur industrial and other portfolio increased to over $177 million invested across the portfolio. The investment portfolio experienced some activity during the year with the sale of our asset at Brown’s Road, Clayton Victoria. We added a number of new assets via a new joint venture with private equity investment management firm GAW Capital Partners. Our industrial portfolio is largely focused on assets with strong yields on sites that offer strategic value through alternative use or expansion strategies.
PORTFOLIO METRICS JUN 17
Portfolio ($m) 177
No. of assets 10
Lettable area (sqm)1 78,829
WACR (%) 8.34
Occupancy1 (% by area) 100.0
Average rent ($ per sqm) $72
WALE1 (yrs by income) 1.6
Rental growth1,2 (%) 3.3
The new GAW Capital joint venture acquired two assets during FY17 with strong value characteristics. Abacus has committed a 10% equity stake to the acquisitions and is pleased to add another strong investment relationship to our third party capital platform. The first industrial asset is located in Altona Victoria for gross purchase price of $30.0 million. The joint venture also acquired an asset in Chullora NSW for $35.0 million. Both assets have been acquired with strong core plus potential that focuses around short term re-leasing strategies and potential longer term redevelopment plans.
The Altona property is a functional office/warehouse facility and associated cold store with a gross lettable area (GLA) totalling 44,406sqm on a substantial land holding of 8.3 hectares. The property is situated in the tightly held industrial precinct of Altona, 12 km west of the
Melbourne CBD and 9 km west of the Port of Melbourne. The property is currently occupied by Fonterra Australia Pty Limited, which is expected to vacate in late 2017.
The Chullora property is an office/warehouse facility totalling 18,114sqm on a substantial land holding of 47,290sqm. The property is located in Chullora, 18km west of Sydney CBD and in close proximity to both M4 and M5 motorways. The property is currently unoccupied and is surrounded by medium density residential properties.
1 Excludes development assets2 Like for like rent growth
Industrial/Other portfolio: $177 million
NSW 8%
QLD 28%
VIC 64%
A B A C U S P R O P E R T Y G R O U P | S E C U R I T Y H O L D E R R E V I E W 2 0 1 7
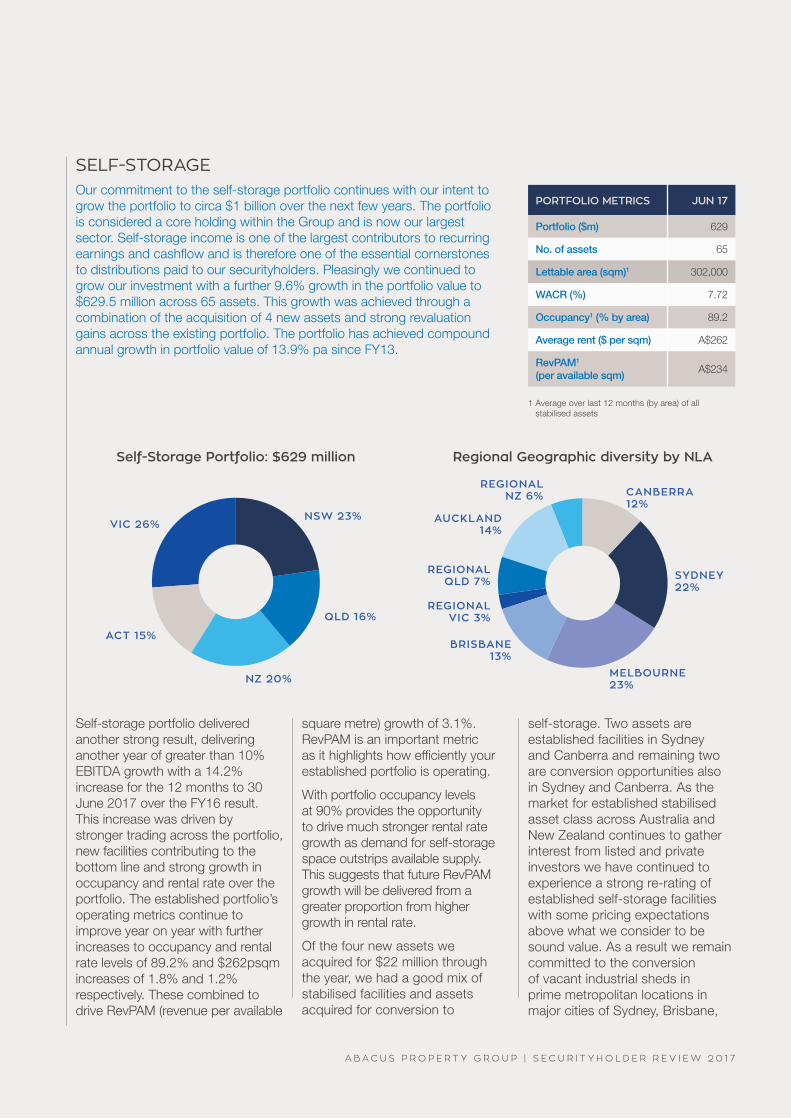
SELF-STORAGEOur commitment to the self-storage portfolio continues with our intent to grow the portfolio to circa $1 billion over the next few years. The portfolio is considered a core holding within the Group and is now our largest sector. Self-storage income is one of the largest contributors to recurring earnings and cashflow and is therefore one of the essential cornerstones to distributions paid to our securityholders. Pleasingly we continued to grow our investment with a further 9.6% growth in the portfolio value to $629.5 million across 65 assets. This growth was achieved through a combination of the acquisition of 4 new assets and strong revaluation gains across the existing portfolio. The portfolio has achieved compound annual growth in portfolio value of 13.9% pa since FY13.
PORTFOLIO METRICS JUN 17
Portfolio ($m) 629
No. of assets 65
Lettable area (sqm)1 302,000
WACR (%) 7.72
Occupancy1 (% by area) 89.2
Average rent ($ per sqm) A$262
RevPAM1 (per available sqm)
A$234
Self-storage portfolio delivered another strong result, delivering another year of greater than 10% EBITDA growth with a 14.2% increase for the 12 months to 30 June 2017 over the FY16 result. This increase was driven by stronger trading across the portfolio, new facilities contributing to the bottom line and strong growth in occupancy and rental rate over the portfolio. The established portfolio’s operating metrics continue to improve year on year with further increases to occupancy and rental rate levels of 89.2% and $262psqm increases of 1.8% and 1.2% respectively. These combined to drive RevPAM (revenue per available
1 Average over last 12 months (by area) of all stabilised assets
Self-Storage Portfolio: $629 million Regional Geographic diversity by NLA
square metre) growth of 3.1%. RevPAM is an important metric as it highlights how efficiently your established portfolio is operating.
With portfolio occupancy levels at 90% provides the opportunity to drive much stronger rental rate growth as demand for self-storage space outstrips available supply. This suggests that future RevPAM growth will be delivered from a greater proportion from higher growth in rental rate.
Of the four new assets we acquired for $22 million through the year, we had a good mix of stabilised facilities and assets acquired for conversion to
self-storage. Two assets are established facilities in Sydney and Canberra and remaining two are conversion opportunities also in Sydney and Canberra. As the market for established stabilised asset class across Australia and New Zealand continues to gather interest from listed and private investors we have continued to experience a strong re-rating of established self-storage facilities with some pricing expectations above what we consider to be sound value. As a result we remain committed to the conversion of vacant industrial sheds in prime metropolitan locations in major cities of Sydney, Brisbane,
SYDNEY22%
MELBOURNE 23%
CANBERRA12%
REGIONAL NZ 6%
REGIONAL QLD 7%
REGIONAL VIC 3%
AUCKLAND 14% VIC 26%
ACT 15% BRISBANE
13%
QLD 16%
NSW 23%
NZ 20%
1 6 — 1 7
Melbourne and Auckland into self-storage facilities. We target assets with natural barriers to entry that deliver higher average rental rates than the current portfolio average.
The contributions from our recently converted facilities that are open and trading have highlighted the success of this strategy. These facilities are now reaching occupancy levels where strong rental rate growth can be achieved driving strong IRRs in line with our investment expectations.
The portfolio now consists of 53 Established self-storage facilities, 7 newly converted facilities (average age 2 years) and 5 non self-storage assets with conversion potential of over 16,000sqm of NLA. A number of our established facilities have expansion potential where it is possible to add additional NLA very cost effectively either on surplus land or to add another level of self-storage units to existing buildings. This level of capital expenditure has a high rate of return due to the low levels of capital requirement.
We believe the outlook for the self-storage sector in Australia remains strong with demand for self-storage units driven from increased urbanisation, the construction of smaller homes and apartments and the increased awareness to the general public of self-storage as a practical and real solution to their storage problems.
As a result we remain focused on growth by acquisition, development, expansion and optimisation of the existing portfolio.
DEVELOPMENTSThe Developments business invests in projects and provides finance solutions that focus on select residential and commercial development opportunities in core locations directly and with experienced local joint venture partners. We look to invest capital in development projects that either offer construction with experienced partners or projects of significant size and density that require a rezoning of the land to residential. We look to crystallise the value uplift through a sale of the site following a significant re-rating of the land once rezoned.
During FY15 and FY16 we increased our investment to residential projects as we viewed these opportunities as the best risk adjusted returns available at that stage in the property cycle. A number of these projects were delivered during FY17 delivering strong returns to the Group and providing a pipeline of projects due for realisation over FY18. The division generated another impressive result with a strong EBITDA result of $55.0 million for the year, following a strong result of $57.0 million in FY16. This result had contributions from interest and fee income and profits on the sale or completion of a number of residential development projects.
As a result of these project completions we have reduced the level of invested capital in the developments business to $448 million as $135 million of capital was received back into the Group. We have committed to reducing
this level of investment in residential development gradually over the next few years as projects are realised so our balance sheet exposure reverts to a more normalised level of circa 10% of assets. We anticipate a further realisation of capital of over $100 million in FY18 to further reduce our exposure.
Abacus controls almost 9,500 unit or land lots which equates to a c$47,000 cost base per unit/land lot. This low average price provides evidence that the property ventures business has prospects for strong returns.
The Group delivered two residential construction projects during the year with Spice Apartments in Brisbane and The Prince project in Canberra. Both these projects were well supported by purchasers and settlements occurred largely without concern delivering strong profits to the Group of approximately $10 million each. We also had success through the joint venture sale of a land site in Campsie, Sydney following the rezoning to residential. This project also delivered a circa $10 million profit to the Group.
The pipeline for FY18 remains strong with almost 800 units being delivered from the following residential construction projects in The Eminence in Melbourne, OneA and Ashfield Central in Sydney and the Ivy and Eve project in Brisbane.
Abacus also has a number of joint ventures that own land sites in Metropolitan Sydney areas undergoing residential rezoning. We continue to work
A B A C U S P R O P E R T Y G R O U P | S E C U R I T Y H O L D E R R E V I E W 2 0 1 7
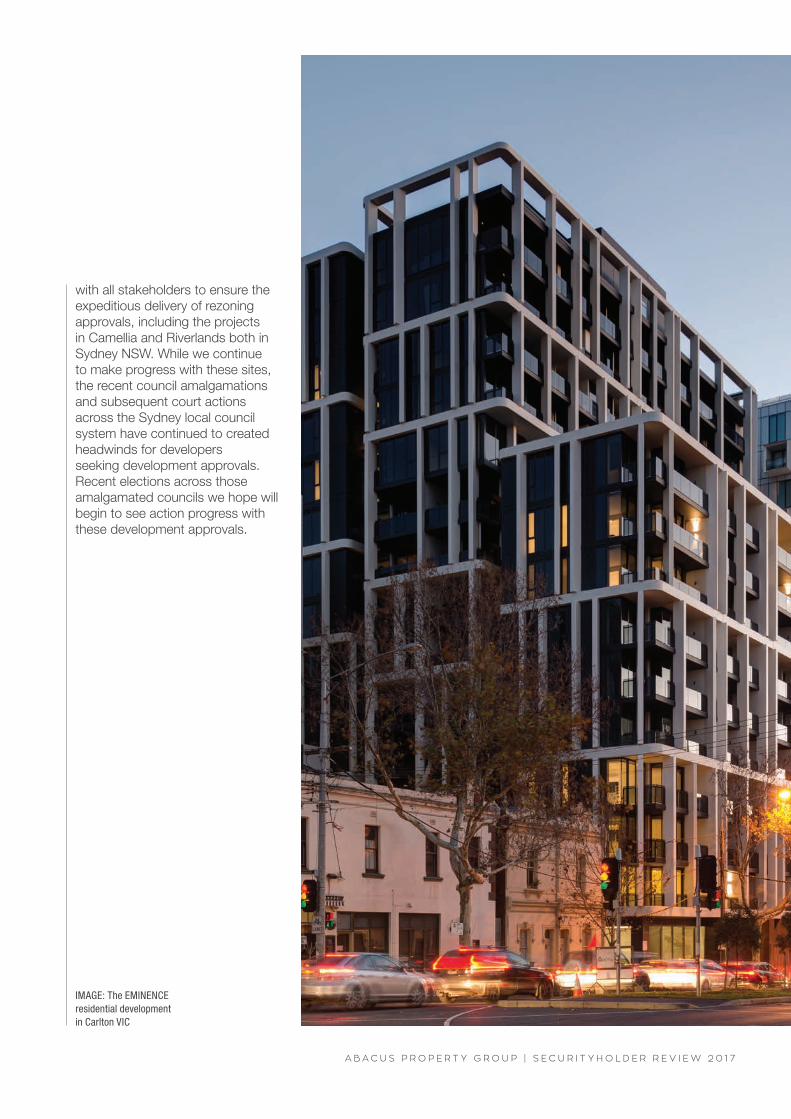
IMAGE: The EMINENCE residential development in Carlton VIC
with all stakeholders to ensure the expeditious delivery of rezoning approvals, including the projects in Camellia and Riverlands both in Sydney NSW. While we continue to make progress with these sites, the recent council amalgamations and subsequent court actions across the Sydney local council system have continued to created headwinds for developers seeking development approvals. Recent elections across those amalgamated councils we hope will begin to see action progress with these development approvals.
1 8 — 1 9
A B A C U S P R O P E R T Y G R O U P | S E C U R I T Y H O L D E R R E V I E W 2 0 1 7
INVESTOR COMMUNICATIONS ONLINEAbacus is committed to long term sustainable practices. As part of our sustainability initiatives we offer investor communications via various electronic methods, including the Abacus website at www.abacusproperty.com.au. We encourage securityholders to visit the website to view online versions of our reports including the 2017 Annual Financial Report and this 2017 Securityholder Review. The website also provides a wide range of information, including ASX announcements, investor information and reports including our sustainability reports.
We encourage securityholders to opt to receive securityholder updates and communications electronically. You will benefit from receiving prompt information and have the convenience and security associated with electronic delivery. There are also significant cost savings associated with this method of communication delivery and above all this is a responsible and environmentally friendly option.
I n ve s to r R e l a t i o n s , D i re c to r y a n d D i s c l a i m e r s s e c t i o n
To receive your investor communications electronically, including the Annual Report, please go to www.investorserve.com.au and register for online services.
MANAGE YOUR SECURITYHOLDING ONLINEIt is possible to access your investment online via access to the Registry’s Investor login facility at www.investorserve.com.au, signing in using your SRN/HIN, Surname and Postcode. Other functions allow you to update your information online, including:
– change of address details;
– update bank account details for direct crediting of your distribution payments;
– provision of tax file numbers;
– Distribution Reinvestment Plan participation;
– Access PDFs of tax and distribution statements;
– or general queries about your securityholding
IMAGE: 180 Queen Street,Brisbane QLD
2 0
CONTACT USIf you require any assistance with altering any of your investment details please contact the Abacus Registry on 1300 139 440 (free call) or via online enquiry at [email protected]. You can also mail correspondence to GPO Box 3993 Sydney NSW 2001.
All other enquiries relating to Abacus Property Group, including any feedback, complaints or suggestions on how we can improve our service, can be directed to Investor Relations:
Investor Relations
Abacus Property GroupLevel 34, Australia Square, 264 – 278 George Street, Sydney NSW 2000
Phone number: 1800 253 860 (free call) or +612 9253 8600 (outside Australia)
KEY EVENTS14 November 2017 2017 Annual General Meeting
17 January 2018 FY18 Half year distribution – Ex-distribution date
18 January 2018 FY18 Half year distribution – Record date
16 February 2018 HY18 results announcement
28 February 2018 Payment of FY18 half year distribution
6 July 2018 FY18 Full year distribution – Ex-distribution date
9 July 2018 FY18 Full year distribution – Record date
17 August 2018 FY18 results announcement
31 August 2018 Payment of FY18 full year distribution
15 November 2018 2018 Annual General Meeting
SECURITIES EXCHANGE LISTINGAbacus is listed on the Australian Securities Exchange under the listing code ABP.

It is recommended that this securityholder review should be read in
conjunction with the Annual Financial Report of Abacus Trust, Abacus
Group Projects Limited, Abacus Income Trust, Abacus Storage
Property Trust and Abacus Storage Operations Limited as at 30 June
2017. It is also recommended that the review be considered together
with any public announcements made by the Abacus Property Group in
accordance with its continuous disclosure obligations arising under the
Corporations Act 2001.
Designed and produced by teamscope.com.au
Abacus Property GroupLevel 34 Australia Square264-278 George StreetSydney NSW 2000T +61 2 9253 8600F +61 2 9253 8616E [email protected]