abano healthcare group annual results presentation … · annual results presentation for financial...
TRANSCRIPT

DISCLAIMER: This annual results presentation dated 26 July 2017 provides additional comment on the 2017 financial year end results media statement and financial materials released by Abano Healthcare Group on 26 July 2017. As such, it should be read in conjunction with, and subject to, the explanations and views provided in that material and subject to the disclaimer set out on slide 29 of this presentation.
ABANO HEALTHCARE GROUPANNUAL RESULTS PRESENTATIONFor financial year ended 31 May 2017

OUR VISIONTo build market-leading brands and healthcare businesses that have the competitive advantage of size, scale and reputation.
OUR LONG TERM INVESTMENT STRATEGYInvest in scalable businesses in the private, fee for service healthcare market where we can add value, build capability and help them to grow.
• Focus on private healthcare sector
• Sustainable demand from private paying customers
• Scale and growth opportunities
• Ability to add value and generate increasing shareholder returns
OUR INVESTMENTS
DENTAL
RADIOLOGY
2
ABANO: ABOUT US

Financial results in top half of guidance Gross revenue: $278.7mEBITDA: $31.4mNPAT: $10.9m
Strong performance with both business groups delivering increasing margins and earnings growth
Underlying EBITDA $32.1m, up 18%Record Underlying NPAT $11.5m, up 43% on continuing businesses
Investment in dental growth Added 27 dental practices which are expected to generate $33.8m in annualised gross revenue; Trans-Tasman dental network of 205 practices as at 31 May 2017
Rollout of Maven Dental Group brand Surpassed FY17 target of 50% of the network being branded
Shareholders rejected hostile partial takeover bid from Healthcare Partners
Less than 4% support from other shareholders for the Healthcare Partners partial offer
Board appointment Election of Australian-based Dr Ginni Mansberg as a Independent Director to the Board
Finalist INFINZ Award 2017 Emerging Leaders Best Corporate Communicator
Post Year End: Announced Pro Rata Rights Offer Raising approximately $35 million through a 1 for 5 fully underwritten, renounceable rights offer
3
FY17 continuing businesses exclude Bay International which was divested May 2016. More information on gross revenue, EBITDA, Underlying EBITDA and Underlying NPAT, which are non-GAAP financial measures, is available at www.abano.co.nz/underlyingearnings. Definitions of financial terms are included in the glossary at the end of this presentation.
FY17 HIGHLIGHTS AND KEY EVENTS

Results were in top half of guidance
Year on year comparison reflects:
• Continuing growth of Abano’s dental networks
• Divestment of audiology business in FY16 means
there were no earning contributions from this
business in FY17
• FY16 NPAT included a $20.2 million gain on the
sale of the audiology business
FY17 results assume full recovery of the receivable of
approx. $566,000 in relation to costs which are
recoverable from Healthcare Partners Holdings
Limited in relation to its failed partial takeover
attempt.
4
$millions FY17 FY16 Continuing Businesses
FY16
Gross Revenue 278.7 256.9 297.1
Revenue 233.5 213.7 213.7
EBITDA 31.4 26.6 26.6
Underlying EBITDA 32.1 27.2 27.2
NPAT 10.9 7.4 28.4
Underlying NPAT 11.5 8.1 8.8
FULL YEAR RESULTS SNAPSHOT
Continuing businesses are dental and radiology only. Discontinued businesses are as follows: Rehabilitation businesses divested in FY13 and FY15; Pathology business divested FY15; Audiology shareholding divested FY16.

Continuing Businesses (Radiology and Dental): Gross Revenue And Revenue Growth Ahead of Previous Year
Gross revenue includes audiology and gross dental revenues before the payment of dentists’ commissionsContinuing businesses are dental and radiology only. Discontinued businesses are as follows: Rehabilitation businesses divested in FY13 and FY15; Pathology business divested FY15; Audiology shareholding divested FY16.
FY17: $278.7mFY17: $233.5m
5
FY17 REVENUE

Gross revenue includes gross dental revenues before the payment of dentists’ commissions
Revenue streams are diversified to reduce risk:• Across a large number of
individual customers• Funded by private payment,
health insurers and other funders
• In two sectors• Across Australia and New
Zealand.
Businesses predominantly funded by private revenue on a fee for service basis
6
FY17 GROSS REVENUE ANALYSIS

See glossary slide for explanation of Underlying EBITDA.Rehabilitation businesses divested in FY13 and FY15; Pathology business divested FY15; Audiology shareholding divested FY16..
$26.6m
7
Long term investment strategy evidenced by growth in dental Underlying EBITDA.
$31.4m
FY17 EBITDA

Record Underlying NPAT result of $11.5 million.31% increase on previous year (FY16 included audiology contribution).
8
Underlying NPAT excludes gains/losses on sale of businesses, and IFRS adjustments and impairments including their tax effect. See glossary slide for full explanation.
NPAT includes the gain/loss on divestment of businesses in FY15 and FY16.
Rehabilitation businesses divested in FY13 and FY15; Pathology business divested FY15; audiology shareholding divested FY16.
FY17: $11.5m
FY17: $10.9m
FY17 PROFIT

Dividend
Subject to relevant factors at the time, including working capital and growth, the current policy is to pay out between 50-70% of Underlying Net Profit After Tax
Increasing future earnings out of Australia will reduce imputation credits available to be attached to dividends
FY17 Final Dividend and Earnings Per Share
Final dividend of 20 cents per share partially imputed
Full year dividend of 36 cents per share, up 20% on previous year; Equal to 67% of Underlying NPAT
29% growth in FY17 Underlying EPS to 53.8 cps
Dividend Reinvestment Plan (DRP)
DRP for FY17 interim dividend suspended as Healthcare Partners refused to allow DRP to be offered
DRP for FY17 final dividend suspended due to capital raising
9Underlying EPS based on Underlying NPAT divided by weighted average number of shares
DIVIDEND AND UNDERLYING EPS

$m FY17 FY16
Cash 7.1 4.3
Other current assets 14.4 43.5
Property, plant and equipment
48.6 46.4
Goodwill 192.8 170.5
Other non current assets 10.8 8.9
TOTAL ASSETS 273.7 273.6
Current liabilities 31.2 27.3
Non current borrowings 110.7 117.8
Other non current liabilities 13.3 13.5
TOTAL LIABILITIES 155.2 158.6
Total equity 118.5 115.0
TOTAL EQUITY AND LIABILITIES
273.7 273.6
10
Strong, long term relationship with banking partner
Combination of available New Zealand and Australian bank facilities totalling approx. NZ$140 million
Undrawn facilities of $28.9 million as at 31 May 2017
Fixed interest rates in place for 44% of drawn debt as at 31 May 2017
Bay Receivable of $32 million from the sale of Abano’s 50% shareholding in Bay International Limited, received on 17 June 2016.
BALANCE SHEET

BUSINESS RESULTS

GROW OURBUSINESSES
INVEST IN OURPEOPLE
DELIVER A WORLD CLASS PATIENTEXPERIENCE
LEVERAGE TECHNOLOGY
OPTIMISE EARNINGS
Network expansion primarily through acquisition
Foster a culture of pride, patient care, and clinical excellence
Engage through a variety of channels and ensure ease of patient interaction
Utilise digital channels to enhance patient interaction and experience
Focus on improving margins and managing costs
Selective greenfield development
Provide access to training, mentoring and career development
Deliver exemplary patient experience
Improved business processes and systems and operating efficiencies
Deliver improving Underlying EBITDA and Underlying NPAT
Organic growth from existing businesses
Attract and retain high performing people
Provide clinical excellence Insightful patient and business data analysis
Deliver improving shareholder returns
Invest in brands and marketing
Create world class work places
Generate high levels of patient satisfaction
Investment in modern clinical technology
Balance growth with dividend payments
12
OUR PATH TO SUCCESS

Grow Our Businesses: Increased demand for new and existing technologies and services; Wider referral base and increased referrals; Planning for new clinic in St Heliers, Auckland which was opened in June 2017; Brand refresh with all five clinics now branded Ascot Radiology
Invest In Our People: Training and management team days
World Class Patient Experience: Building relationships and working more closely with GPs and referrers to deliver a more streamlined referral and reporting process; Continued investment in improved customer service
Leverage Technology: Increased use of tomosynthesis; Expanded use of CT PET scans due to new tracers
Optimise Earnings: Gross revenue FY16: FY17 up 9%Underlying EBITDA FY16: FY17 up 36%Delivered year on year margin growth
13Sale of Pathology business on 1 May 2015. Radiology was the sole diagnostics business from this time.
Auckland, New ZealandFive leading edge clinics71% partnership with 14 radiologist partners holding remaining 29%
ASCOT RADIOLOGYHighlights for FY17

LUMINO THE DENTISTSHighlights for FY17
Grow Our Businesses: Acquired 15 practices; Driving efficiencies through merging closely located practices; Added capacity to existing clinics; Generating increasing benefits of scale
Invest In Our People: Closer collaboration between Australian and New Zealand dental businesses with trans-Tasman leadership team and sharing of resources; 210 clinicians attended All Clinicians Annual Conference
World Class Patient Experience: Increased NPS from 63 in May 2016 to 68 in May 2017, with a high of 70 in June 2017; Piloted new initiatives to improve patient experience; Commenced roll out of the Lumino Dental Plan
Leverage Technology: Invested in new cone beam xray machines; Continued development of digital presence including rollout of online booking; Enhancement of practice management software
Optimise Earnings:• Increased gross revenue and Underlying EBITDA • Fourth year of improved margins as Lumino benefits from economies of scale• Same store revenue growth of -1% for FY17, due to temporary affect in two
quarters resulting from above average amount of leave taken coinciding with higher than usual replacement of retiring senior dentists with new dentists as part of Lumino’s succession and recruitment programme
Slide 14New Zealand111 practices as at 31 May 2017Estimated 13% market share

MAVEN DENTAL GROUPHighlights for FY17
Slide 15
Grow Our Businesses: Acquired 12 practices; 51 practices rebranded, surpassing target of half the network rebranded by financial year end; Driving efficiencies through merging closely located practices; Adding capacity to existing clinics; Generating increasing benefits of scale
Invest In Our People: Closer collaboration between Australian and New Zealand dental businesses with trans-Tasman leadership team and sharing of resources; Practice Management Conference with 80 attendees
World Class Patient Experience: Making it easier for patients to engage and receive treatment - launch of branded marketing initiatives (18 months interest free offer) and increased focus on digital marketing and engagement
Leverage Technology: Increased use of digital marketing and patient communications; Launched new website
Optimise Earnings: • Increased gross revenue and Underlying EBITDA • Corresponding with reports from other dental corporates, Maven is being
affected by challenging market conditions. Same store performance improved from the first half to be -4.4% for the year
• Despite initial costs of rebranding and decline in same store sales, margins have remained steady Australia
94 practices as at 31 May 2017
Estimated 1.4% market share
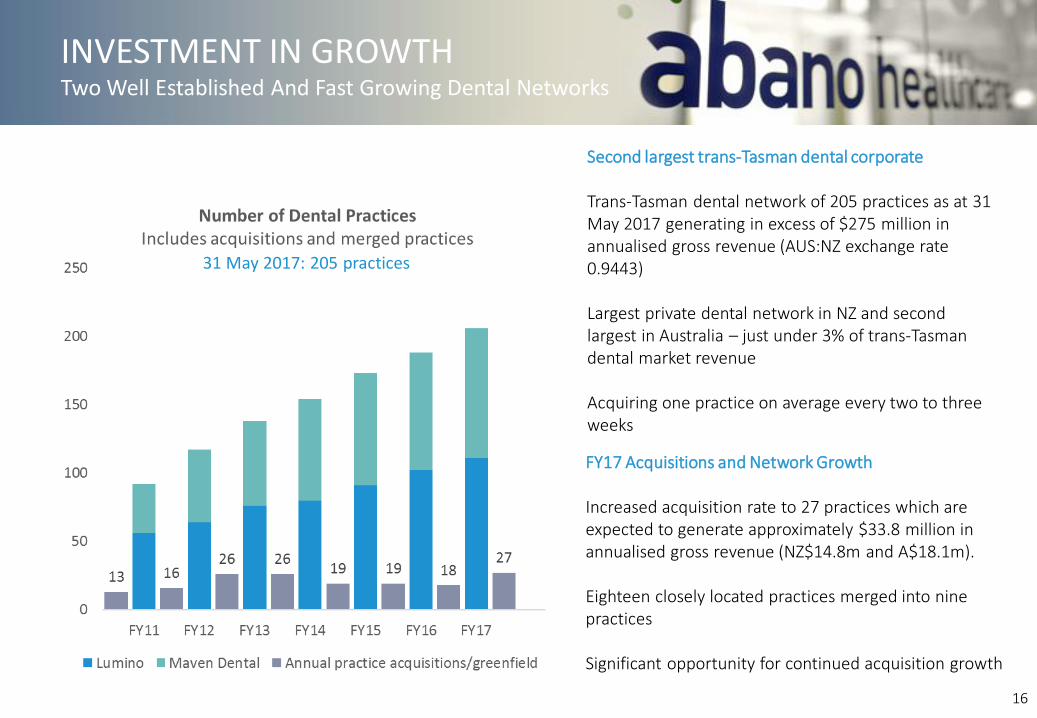
Second largest trans-Tasman dental corporate
Trans-Tasman dental network of 205 practices as at 31 May 2017 generating in excess of $275 million in annualised gross revenue (AUS:NZ exchange rate 0.9443)
Largest private dental network in NZ and second largest in Australia – just under 3% of trans-Tasman dental market revenue
Acquiring one practice on average every two to three weeks
FY17 Acquisitions and Network Growth
Increased acquisition rate to 27 practices which are expected to generate approximately $33.8 million in annualised gross revenue (NZ$14.8m and A$18.1m).
Eighteen closely located practices merged into nine practices
Significant opportunity for continued acquisition growth
31 May 2017: 205 practices
INVESTMENT IN GROWTHTwo Well Established And Fast Growing Dental Networks
16

FY17: Gross Revenue $262.3 million; Underlying EBITDA $31.7 millionProvided 94% of Abano’s gross revenueGross Revenue split: Maven Dental Group A$133.5 million; Lumino $120.8 million
17
DENTAL PERFORMANCE

FY18 BUSINESS PRIORITIESAbano Dental Remains Our Primary Focus
18
Grow Our Businesses Respond to increased acquisition opportunity in trans-Tasman dental marketContinue the Maven brand rollout for existing practices in Australia
Invest In Our People Further investment in Clinical and Practice DevelopmentExpand the training and development programme with further training programsPlanning underway for Joint Lead Dentist conferenceAppointment of new internal communications manager
World Class Patient Experience
Continue to deliver increasing NPS score in New ZealandEstablish NPS measurement process in AustraliaRollout of innovative marketing and finance options –including Dental PlansContinue to focus on value-based careLaunch of new Patient Contact Centre in Australia
Leverage Technology Increased investment in major technology projects including: • Greater use of network data and indepth analysis to drive
improvements and clinical best practice• Improved online booking system across both networks
Continued rollout of CRM system in Australia
Optimise Earnings Optimise workflows in individual practices to deliver improved earningsAchieve financial KPIsLeverage scale benefits across the Group

19
DENTAL
• Growth in dental same store revenue of 6% over the three year period FY18 to FY20
• Growth in dental Underlying EBITDA margin to be greater than 14% by FY20
• Acquisition of more than 25 dental practices or $35 million in annualised gross revenues from acquisitions per year by FY20
GROUP
• Growth in Group Underlying EPS greater than 15% per annum
• Net bank debt to annualised Underlying EBITDA of less than 3.5x
ABANO FINANCIAL KPIsSet November 2016

OUR GROWTH OPPORTUNITY
Slide 20

Trans-Tasman dental market is worth approx. NZ$11 billion
Long Term Growth Trends: • Older people with better oral health and retention of natural teeth
requiring dental care• More services on offer• Increasing demand for cosmetic/restorative services
Predominantly privately funded: Payment from patients or their health insurance; Minimal reliance on Government funded contracts
Changing Workforce: Increase in supply of new graduates; More female dentists, preference for flexible working conditions offered by a dental corporate
Growing Acceptance And Popularity Of The Corporate Dental Model• More dentists are choosing to join a corporate dental group• There are a number of competitors actively building scale in
Australia• Each corporate group has a different growth strategy, business
model and revenue focus
Trans-Tasman Market Ownership~14,000 Dental Practices
Other
Corporate Consolidators Less than 10%
Corporate consolidators are estimated to own less than 5% of practices and have less than 10% of revenues
• Estimated market size ~14,000 practices. • Huge pool of practices provides significant
potential for acquisition and network expansion
21
DENTAL SECTOR OPPORTUNITY

• Largest opportunity is the Australian dental market which is approximately 12x bigger than NZ
• Growing acceptance of the corporate model amongst dentists
• With Abano’s positive reputation and workplace culture, we are benefiting from an increase in the number and size of practices in our acquisition pipeline, above what was previously planned
• Opportunity exists to step up our growth plans in the trans-Tasman market and increase our acquisition rate above previous expectations, mainly in Australia in states where we are under-represented, particularly Victoria and NSW
22
33
6
36
3
4
7
5
Corporate groups in the trans-Tasman dental market own less than 5% of practices and have less than 10% of dental revenue and the opportunity for Abano to continue its acquisition growth strategy is significant
Maven in Australia: 94 PracticesMarket Size: Approx.13,000 Practices
OUR GROWTH OPPORTUNITY

PRO RATA RIGHTS OFFER
Abano is seeking to raise approximately $35 million via a pro-rata renounceable rights offer to eligible shareholders and a shortfall bookbuild
PURPOSE The capital raised will be used to:
• Step up Abano’s growth plans in the trans-Tasman dental market and respond to the increased acquisition opportunity, particularly in Australia.
OFFER STRUCTURE
Renounceable Rights Offer
• 1 for 5 entitlement offer to all eligible shareholders at NZ$8.15 per share• Offer price is at a 11.3% discount to TERP*• Offer is pro rata and renounceable• Offer is fully underwritten by Forsyth Barr Group Limited
Shortfall Bookbuild
• New shares attributable to unexercised rights will be offered to eligible bookbuild investors under a bookbuild process.
New Shares issued on completion of the Offer will rank equally with then existing Shares and will be quoted on the NZX Main Board
*TERP is the theoretical ex rights price of $9.19 which is equal to the average price of 1 New Share at the Issue Price of $8.15 and 5 Existing Shares at $9.40 being the closing price as at 25 July 2017 less $0.20 to adjust for ABA’s final FY17 dividend
24
RIGHTS OFFER OVERVIEW

EVENT TIMING (2017)
Announcement of the Offer 26 July
Shares are quoted “ex-entitlements” on the NZX Main Board – Rights are able to be boughtand sold (subject to supply and demand) on the NZX Main Board
2 August
Record date for determining shareholders who have an entitlement to rights 5.00pm on 3 August
Expected mailing of Offer Document and Entitlement and Acceptance Forms 4 August
Rights trading ceases on the NZX Main Board 17 August
Rights offer closes (and last date for receipt of applications or renunciations) 23 August
Completion of Shortfall bookbuild for new shares attributable to unexercised rights 28 August
Allotment of new shares under the rights offer and the shortfall bookbuild 30 August
New shares expected to commence trading on the NZX Main Board 30 August
Payment of any premium achieved in the shortfall bookbuild to holders of unexercisedrights
1 September
Expected mailing of holding statements for new shares allotted under the rights offer andthe shortfall bookbuild
4 September
25
INDICATIVE TIMETABLE

QUESTIONS

ABANO LEADERSHIP TEAM
Richard Keys(2002)
Chief Executive Officer
Rachel Walsh(2013)
Chief Financial Officer
Peter Radich(2008)
Chief Information Officer
Andy Tapper(2005)
CEO Abano Dental
Dr David Rogers(2005)
Managing Partner Ascot Radiology
DENTAL CLINICAL ADVISORY BOARDS
Lumino Maven
Dr Chris BrooksDr Andrew Brown (Chair)Dr Adam DoudneyDr Werner EichholzDr Ben Harris Dr Sarah KellyDr Catherine LloydDr Garry Rae
Dr Rod AshtonDr Michael BarberDr Fred Calavassy (Chair) Dr Mark CullDr Greg DuguidDr Angie LangDr Martin PynorDr Ruchira SinghiDr Sean Slotar
A number of clinicians are also involved in the management of the dental group
27
MANAGEMENT

GLOSSARY
• Revenue excludes any audiology revenues (prior to its sale in FY16), as this was a joint venture and was therefore equity accounted, and only includes Australian dental revenues after the payment of dentists’ commissions.
• Gross revenue is reported within the segment note in the Financial Statements and includes audiology revenues (prior to its sale in FY16) and Australian dental revenues before payment of dentists’ commissions.
• Earnings Before Interest, Tax, Depreciation and Amortisation (“EBITDA”) is reported within the segment note in the Financial Statements and is Net Profit After Tax (“NPAT”) excluding GAAP compliant net finance expenses, gains/losses arising on sale of businesses, equity accounted investments, non-controlling interests, tax, depreciation and amortisation costs. Particularly, it excludes profit/losses generated by the Bay Group, in which Abano held a 50% shareholding until its sale FY16. Due to this being a joint venture, the results for the Bay Group were equity accounted and therefore not included in the consolidated EBITDA.
• Underlying earnings are reported for both NPAT (a GAAP compliant measure) and EBITDA (a non-GAAP financial measure) and exclude gains/losses arising on sale of businesses, IFRS adjustments and impairments, including their tax effect. These are the measures used within the Company to evaluate performance, establish strategic goals and to allocate resources. A reconciliation is provided on slide 31.
• More information on gross revenue and underlying earnings, which are non-GAAP financial measures and are not prepared in accordance with NZ IFRS, is available on the Abano website at www.abano.co.nz/underlyingearnings.
• Net Promoter Score (NPS) : An index ranging from -100 to 100 that measures the willingness of customers to recommend a company'sproducts or services to others. It is used as a proxy for gauging the customer's overall satisfaction with a company's product or service and the customer's loyalty to the brand.
28

This presentation has been prepared by Abano Healthcare Group Limited (“Abano”) solely to provide interested parties with further information about Abano and its activities as at the date of this presentation. The information in this presentation is of a general nature only. It is not a complete description of Abano and does not constitute a product disclosure statement, prospectus or other disclosure document for the purposes of the Financial Markets Conduct Act 2013 or other applicable law.
No part of this presentation may be reproduced or distributed in any jurisdiction outside New Zealand or used for any other purpose. Any distribution in jurisdictions outside of New Zealand may be restricted by law, and persons into whose possession this presentation comes should observe any such restrictions. Any failure to comply with such restrictions may violate applicable securities laws. In particular, this presentation may not be released or distributed in the United States of America (“US”).
This presentation is not a recommendation or offer of financial products for subscription, purchase or sale, or an invitation or solicitation for such offers, in the US or in any other jurisdiction. Any securities described in this announcement have not been, and will not be, registered under the US Securities Act of 1933 and may not be offered or sold in the US except in transactions exempt from, or not subject to, the registration of the US Securities Act of 1933 and applicable US state securities laws.
This presentation is not intended as investment, financial or other advice and must not be relied on by any prospective investor. It does not take into account any particular prospective investor’s objectives, financial situation, circumstances or needs, and does not purport to contain all the information that a prospective investor may require. Any person who is considering an investment in Abano securities should obtain independent professional advice prior to making an investment decision, and should make any investment decision having regard to that person’s own objectives, financial situation, circumstances and needs.
Past performance information contained in this presentation is given for illustrative purposes only and should not be relied upon (and is not) an indication of future performance. This presentation may also contain forward looking statements with respect to the financial condition, results of operations and business, and business strategy of Abano. Information about the future, by its nature, involves inherent risks and uncertainties. Abano gives no assurance that the assumptions upon which Abano based its forward looking statements on will be correct, or that its business and operations will not be affected in any substantial manner by other factors not currently foreseeable by Abano or beyond its control. Accordingly, Abano can make no assumption that any forward-looking statements will be realised. Nothing in this presentation is a promise or representation as to the future or a promise or representation that a transaction or outcome referred to in this presentation will proceed or occur on the basis described in this presentation. Statements or assumptions in this presentation as to future matters may prove to be incorrect.
A number of financial measures are used in this presentation and should not be considered in isolation from, or as a substitute for, the information provided in Abano’s financial statements available at www.abano.co.nz/latestfinancials. This presentation includes non-GAAP financial measures. This information has been included on the basis that Abano management and directors consider that this non-GAAP information assists readers to understand the key drivers of Abano’s performance which are not disclosed as GAAP measures in Abano’s financial statements. More information on certain non-GAAP financial measures used by Abano is available at: www.abano.co.nz/underlyingearnings.
Certain market and industry data used in connection with this presentation may have been obtained from research, surveys or studies conducted by third parties, including industry or general publications. Neither Abano nor any of its representatives or advisers have independently verified any such market or industry data provided by third parties or industry or general publications.
To the maximum extent permitted by law, none of Abano, Forsyth Barr Limited or Forsyth Barr Group Limited, nor any of their respective related companies, shareholders, directors, officers, employees, partners, agents or advisers, or any other person, makes any representation or warranty, or provides any undertaking, in relation to any information provided in this presentation and they shall have no liability (including for negligence) for:
– any errors or omissions in this presentation; or
– any failure to correct or update this presentation, or any other written or oral communications provided in relation to this presentation; or
– any claim, loss or damage (whether foreseeable or not) arising from the use of any information in this presentation or otherwise arising in connection with this presentation or the information contained in it.
By receiving this presentation, you agree to the above terms and conditions. 29
DISCLAIMER

IFRS REPORTING IMPACT ON THE REPORTED RESULTS
RECONCILIATION OF EBITDA TO UNDERLYING EBITDA ($m)
2013 2014 2015 2016 2017
EBITDA 27.7 27.8 29.6 26.6 31.4
Add back Acquisition & Transaction Costs 0.9 1.3 1.1 0.6 0.7
Underlying EBITDA 28.6 29.1 30.7 27.2 32.1
RECONCILIATION TO UNDERLYING EARNINGS (DUE TO CHANGES IN IFRS IN 2010)
2013 2014 2015 2016 2017
NPAT 2.8 4.9 (1.3) 28.4 10.9
Loss/Gain on sale of subsidiary (1.6) 0.2 9.0 (20.3) -
Impairment tax asset 1.9 - - - -
Fair value movement and amortisation of deferred acquisition consideration
0.5 (0.3) - 0.1 (0.1)
Acquisition and Transaction costs 0.9 1.3 1.1 0.6 0.7
Underlying NPAT 4.5 6.1 8.8 8.8 11.5
More information on underlying earnings, which is a non GAAP financial measure and is not prepared in accordance with NZIFRS, is available at www.abano.co.nz/underlyingearnings 30