abb group annual report 2002 financial · pdf fileabb group annual report 2002 financial...
TRANSCRIPT

ABB Group Annual Report 2002Financial review
automation technologies
power technologies
AB
B G
roup
Annual R
epo
rt 2002 Financial review
e_FR_Umschlag 24.04.2003 7:27 Uhr Seite 1

The complete ABB Group Annual Report 2002 consists of thisFinancial review and an Operational review. For a copy of theOperational review, please use the contact information on the backof this report, or go to www.abb.com and download the entirereport. ABB also publishes an annual Sustainability Report (June)and an annual Technology Report (November). These reports canalso be obtained by using the contact information on this report orthrough ABB’s Web site.
Caution concerning forward-looking statementsThe ABB Group Annual Report 2002 ispublished in English, German, Swedish andFrench, and includes forward-lookingstatements. The English-language version isbinding. In the Operational review, suchstatements are included in “Letter toshareholders,” “Power Technologies,”“Automation Technologies,” “Oil, Gas andPetrochemicals” and “Business improvement”and in the Financial review, such statements areincluded in “Operating and financial review andprospects.” Additionally, the words “believe,”“may,” “will,” “estimate,” “continue,”“anticipate,” “intend,” “expect,” and similarwords are intended to identify forward-lookingstatements. We have based these forward-looking statements largely on currentexpectations and projections about futureevents, financial trends and economicconditions affecting our business. Theseforward-looking statements are subject to risks,uncertainties and assumptions, includingamong other things, the following: (i) thedifficulty of forecasting future market andeconomic conditions; (ii) the effects of, andchanges in, laws, regulations, governmentalpolicies, taxation, or accounting standards andpractices; (iii) our ability to dispose of certain ofour non-core businesses on terms andconditions acceptable to us; (iv) our ability tofurther reduce our indebtedness as planned; (v)
the resolution of asbestos claims on terms andconditions satisfactory to us; (vi) the effects ofcompetition in the product markets andgeographic areas in which we operate; (vii) ourability to anticipate and react to technologicalchange and evolving industry standards in themarkets we operate; (viii) the timelydevelopment of new products, technologies,and services that are useful for our customers;(ix) unanticipated cyclical downturns in some of the industries that we serve; (x) the risksinherent in large, long-term projects served byparts of our business; (xi) the difficultiesencountered in operating in emerging markets;and (xii) other factors described in documentsthat we may furnish from time to time with theU.S. Securities and Exchange Commission,including our Annual Reports on Form 20-F.Although we believe that the expectationsreflected in any such forward-looking state-ment are based on reasonable assumptions,we can give no assurance that they will beachieved.
We undertake no obligation to update publiclyor revise any forward-looking statementsbecause of new information, future events orotherwise. In light of these risks anduncertainties, the forward-looking information,events and circumstances might not occur. Ouractual results and performance could differsubstantially from those anticipated in ourforward-looking statements.
e_FR_Umschlag 24.04.2003 7:26 Uhr Seite 2
ABB Group Financial review 2002 1
Financial review
Operating and financialreview and prospects
2 Overview4 Application of critical
accounting policies8 Accounting for discontinued
operations9 New accounting
pronouncements11 Restructuring expenses12 Acquisitions, investments and
divestitures14 Summary financial data16 Analysis of results
of operations22 Business divisions30 Discontinued operations33 Liquidity and capital
resources36 Financial position40 Contractual obligations and
commercial commitments42 Related and
certain other parties42 Contingencies and
retained liabilities
47 Consolidated Financial StatementsNotes to the Consolidated Financial Statements
51 Note 1 The Company and managementoverview
51 Note 2 Significant accounting policies58 Note 3 Discontinued operations59 Note 4 Business combinations and
other divestments60 Note 5 Marketable securities61 Note 6 Financial instruments62 Note 7 Receivables64 Note 8 Inventories64 Note 9 Prepaid expenses and other64 Note 10 Financing receivables65 Note 11 Property, plant and equipment65 Note 12 Goodwill and other intangible assets66 Note 13 Equity accounted companies67 Note 14 Borrowings69 Note 15 Accrued liabilities and other70 Note 16 Leases71 Note 17 Commitments and contingencies75 Note 18 Taxes76 Note 19 Other liabilities76 Note 20 Employee benefits79 Note 21 Management incentive plan81 Note 22 Stockholders’ equity81 Note 23 Earnings per share82 Note 24 Restructuring charges83 Note 25 Segment and geographic data87 ABB Ltd Group Auditors’ Report
88 Financial Statements of ABB Ltd, ZurichNotes to Financial Statements
89 Note 1 General89 Note 2 Cash and equivalents89 Note 3 Receivables89 Note 4 Loans to subsidiaries89 Note 5 Participations89 Note 6 Current liabilities89 Note 7 Bonds90 Note 8 Stockholders’ equity90 Note 9 Pledge90 Note 10 Contingent liabilities90 Note 11 Credit facility agreement91 Proposed appropriation
of available earnings92 Report of the Statutory Auditors
93 Investor information97 ABB Group statistical data98 Exchange rates

2 ABB Group Financial review 2002
Operating and financial review and prospects
OverviewWe are a global provider of power and automationtechnologies that enable utility and industry customers to improve performance while loweringenvironmental impact.
During 2001, we realigned our worldwide enterprisearound customer groups, replacing our formerbusiness segments with four end-user divisions, twochannel partner divisions, and a financial servicesdivision. The four end-user divisions – Utilities, ProcessIndustries, Manufacturing and Consumer Industries,and Oil, Gas and Petrochemicals – served end-usercustomers with products, systems and services. The two channel partner divisions – Power TechnologyProducts and Automation Technology Products –served external channel partners such as wholesalers,distributors, original equipment manufacturers andsystem integrators directly and end-user customersindirectly through the end-user divisions. The FinancialServices division provided services and project supportfor our internal as well as for our external customers.
The Utilities division served electric, gas and waterutilities – whether state-owned or private, global orlocal, operating in liberalized or regulated markets –with a portfolio of products, services and systems. The division’s principal customers were generators ofpower, owners and operators of power transmissionsystems, energy traders and local distributioncompanies. The Utilities division employed approximately14,800 people as of December 31, 2002.
In April 2002, we merged our Process Industries divisionand our Manufacturing and Consumer Industriesdivision to form a new Industries division. TheIndustries division served the automotive, cement,chemical, distribution, electronics, food and beverage,life sciences, marine, metals, mining, paper, petroleum,printing and telecommunications industries withapplication-specific power and automation technology.The Industries division employed approximately 23,300 people as of December 31, 2002.
The Power Technology Products division covered theentire spectrum of technology for power transmissionand power distribution including transformers,switchgear, breakers, capacitors and cables as well as other products, platforms and technologies forhigh- and medium-voltage applications. Powertechnology products are used in industrial, commercialand utility applications. These products were sold through our end-user divisions as well as throughexternal channel partners, such as distributors,contractors and original equipment manufacturers and
system integrators. The Power Technology Productsdivision employed approximately 26,400 people as ofDecember 31, 2002.
The Automation Technology Products division providedproducts, software and services for the automation and optimization of industrial and commercial processes.Key technologies include measurement and control,instrumentation, process analysis, drives and motors,power electronics, robots and low voltage products.These technologies were sold to customers throughthe end-user divisions as well as through externalchannel partners such as wholesalers, distributors,original equipment manufacturers and systemintegrators. The Automation Technology Productsdivision employed approximately 33,300 people as ofDecember 31, 2002.
The Oil, Gas and Petrochemicals division supplied acomprehensive range of products, systems andservices to the global oil, gas and petrochemicalsindustries, from the development of onshore andoffshore exploration technologies to the design and supply of production facilities, refineries andpetrochemicals plants. The Oil, Gas and Petrochemicalsdivision employed approximately 11,900 people as of December 31, 2002. We announced in 2002 thatwe intend to dispose of this business division. See“Accounting for discontinued operations”.
The Financial Services division supported ourbusinesses and customers with financial solutions instructured finance, leasing, project development andownership (Equity Ventures), financial consulting, the insurance businesses and treasury activities. In2002, a significant part of the division’s structuredfinance and leasing activities were sold to GE Commercial Finance. Proprietary trading activities in Treasury Centers ceased and remaining treasuryactivities were integrated in Corporate.The insuranceand project development and ownership activities weretransferred to Non-Core Activities.
Non-Core Activities, created in the fourth quarter of2002, group the following activities and businesses:
■ our Insurance business area (part of the formerFinancial Services division);
■ our Equity Ventures business area and the remainingStructured Finance business that was not sold to GE Commercial Finance which were part of our former Financial Services division (we intend todivest these businesses);

ABB Group Financial review 2002 3
■ our Building Systems business area, which weintend to divest in 2003;
■ our New Ventures business area;
■ our Air Handling business, which we sold in January 2002; and
■ our Customer Service, Group Processes andLogistic Systems business areas and theSemiconductors business, which, effective January1, 2003, became part of the Power Technologiesdivision.
Corporate includes Headquarters, Central Researchand Development, Real Estate, as well as, beginning2002, Treasury Services.
In order to streamline our structure and further improveoperational performance, we have, effective January 1,2003, established two divisions: AutomationTechnologies, which combines the former AutomationTechnology Products and Industries divisions andemployed approximately 56,600 people as of January 1, 2003; and Power Technologies, whichcombines the former Power Technology Products and Utilities divisions and employed approximately41,200 people as of January 1, 2003.
The discussion that follows reflects how we managedand reported our businesses during 2002.Therefore,we discuss the Utilities, Industries, Power TechnologyProducts and Automation Technology Productsdivisions as well as Non-Core Activities. We haveincluded a separate discussion of DiscontinuedOperations.
Management overviewOur exposure to asbestos claims and our high debtlevels have weighed heavily on us during recent years and have forced management to focus intenselyon ensuring our ability to continue on a going concern basis.
In 2001 and 2002, we incurred significant net losses,partly as a result of a greater-than-anticipated increasein the number of and amounts demanded to settlecertain asbestos-related claims against our subsidiary,Combustion Engineering (see Note 17 to theConsolidated Financial Statements), as well as theweak performance of the businesses that are nowclassified as non-core activities and discontinuedoperations and an overall weakening of global markets.These operating losses, combined with the effect of a repurchase of our own shares in 2001 and otherfactors, have decreased our consolidated stockholders’
equity from US$5.2 billion at December 31, 2000 toUS$1.0 billion at December 31, 2002. Our low equitybase, high debt levels and the uncertainty with respect to the timing of the resolution to the asbestosissue have impacted our ability to finance our core and non-core operations and to repay maturing debt.
With respect to the asbestos issue, based on currentinformation, we expect that the initiated proceedingswill provide an adequate resolution to the issue as discussed in more detail in Note 17 to theConsolidated Financial Statements. However, untilCombustion Engineering’s pre-packaged Chapter 11plan of reorganization is finally approved and injunctiverelief has been provided to bar future claims from being made, the ultimate settlement amount ofasbestos-related claims and the potential exposure toliability for Combustion Engineering’s asbestos-relatedclaims remain uncertain.
In late 2001 and during 2002, the commercial papermarket, on which we had significantly relied in the past,largely diminished as a funding source and our creditratings fell below investment grade. As a consequence,we have faced challenges to replace or repay maturingshort-term debt during 2002. On December 17, 2002,as a replacement of credit facilities obtained inDecember 2001 and during 2002, we entered into a364-day US$1.5 billion credit facility to fund ongoingliquidity requirements. Details of the credit facility as well as the maturing short-term debt in 2003 aremore fully discussed in Note 14 to the ConsolidatedFinancial Statements.
Given our financial position, the weak performance innon-core/discontinued activities and the overall statusof the international financial markets, we had to accepta number of stringent covenants in the new facilityagreement (see Note 14 to the Consolidated FinancialStatements), including requirements to meet assetdivestment proceeds targets, the fulfillment of which isa condition to the continued availability of fundingunder the terms of the facility. We also had to providesecurity for the facility.

4 ABB Group Financial review 2002
Management believes that the important steps taken in 2002, including the divestment of a large portion ofthe Structured Finance business (see Note 3 to theConsolidated Financial Statements), significant debtreduction and refinancing of short-term debt to extendthe maturity profile of our debt (see Note 14 to theConsolidated Financial Statements), introduction of asimplified organizational structure, and continuousstrong performance of core businesses, as well as ourplans for 2003, should ensure continued availability of the credit facility during 2003 (maximum of US$1.5 billion).
However, because of the stringent nature of thecovenants in the credit facility, management believesthat it is prudent to plan for possible adversedevelopments that may jeopardize our ability to rely oncontinued funding under the credit facility.Therefore,our Board of Directors proposes to the annualshareholders’ meeting that the shareholders approvean amendment to the existing provisions in the Articlesof Incorporation on contingent share capital as to (i) a substantial increase of the contingent capital whichwould consequently allow the issuance of new ABBLtd shares, and (ii) an extension of the use of thecontingent capital for new financial instruments (suchas convertible bonds).
Management’s principal plans for 2003 includeintensified operational improvements of the corebusinesses, for example, through the “Step change”program (see Note 24 to the Consolidated FinancialStatements). Management’s plans also includecontinued large divestments that it estimates willcontribute proceeds in excess of US$2 billion (inparticular the Oil, Gas and Petrochemical division, theBuildings Systems business, remaining parts of theStructured Finance business and the Equity Venturesbusiness), the closing of non-core activities and the reduction of total debt by applying the proceedsreceived from these divestments.
Application of critical accounting policies
GeneralWe prepare our Consolidated Financial Statementson the basis of United States generally acceptedaccounting principles (U.S. GAAP).
The preparation of our financial statements requires usto make estimates and judgments that affect thereported amounts of assets, liabilities, revenues andexpenses, and related disclosure of contingent assetsand liabilities. We evaluate our estimates, includingthose related to costs expected to be incurred tocomplete projects, product guarantees and warranties,
bad debts, inventories, investments, intangible assets,income taxes, financing operations, restructuring, long-term service contracts, pensions and other post-retirement benefits, and contingencies andlitigation, on an ongoing basis. We base our estimateson historical experience and on various otherassumptions that we believe to be reasonable underthe circumstances, the results of which form the basisfor making judgments about the carrying values ofassets and liabilities that are not readily apparent fromother sources. Actual results may differ from theseestimates under different assumptions or conditions.
The following critical accounting policies, and therelated judgments, assumptions and estimatesinvolved in the application of these policies couldmaterially affect the amounts reported in ourConsolidated Financial Statements. These policiesshould be considered in reviewing our ConsolidatedFinancial Statements and the discussion below.
Revenue and cost of sales recognitionWe recognize revenues in accordance with the U.S. Securities and Exchange Commission’s StaffAccounting Bulletin No.101 (SAB 101), RevenueRecognition in Financial Statements. We recognizesubstantially all revenues from the sale of manufacturedproducts upon transfer of title including the risks and rewards of ownership to the customer whichgenerally occurs upon shipment of products. Oncontracts for sale of manufactured products requiringinstallation which can only be performed by us,revenues are deferred until installation of the productsis complete. Revenues from short-term fixed-pricecontracts to deliver services are recognized uponcompletion of required services to the customer.Revenues from contracts which contain customeracceptance provisions are deferred until customeracceptance occurs or the contractual acceptanceperiod has lapsed.
These revenue recognition methods assumecollectibility of the revenues recognized. Whenrecording the respective accounts receivable, lossreserves are calculated to estimate those receivablesthat will not be collected. These reserves assume alevel of default based on historical information, as wellas knowledge about specific invoices and customers.There remains the risk that greater defaults will occurthan estimated. As such, the amount of revenuesrecognized might exceed that which will be collected,resulting in a deterioration of earnings in the future. This risk is likely to increase in a period of significantnegative industry or economic trends.

ABB Group Financial review 2002 5
Sales under long-term fixed-price contracts arerecognized using the percentage-of-completionmethod of accounting. We principally use the cost-to-cost or delivery events method to measureprogress towards completion on contracts. Wedetermine the method to be used by type of contractbased on our judgment as to which method bestmeasures actual progress towards completion.
The percentage-of-completion method of accountinginvolves the use of assumptions and projections,relating to future material, construction and overheadcosts. As a consequence, there is a risk that totalcontract costs will exceed those which we originallyestimated. These risks are exacerbated if the durationof the project is long-term, because there is a higherprobability that the circumstances upon which weoriginally developed the estimates will change in amanner that increases our costs. Factors that couldcause costs to increase include:
■ delays caused by unexpected conditions or events;
■ unanticipated technical problems with the equipmentbeing supplied or developed by us which mayrequire that we incur additional costs to remedy the problem;
■ changes in the cost of components, materials or labor;
■ difficulties in obtaining required governmental permitsor approvals;
■ project modifications creating unanticipated costs;
■ suppliers’ or subcontractors’ failure to perform; and
■ penalties incurred as a result of not completingportions of the project in accordance with agreedupon time limits.
Changes in our initial assumptions, which we review ona regular basis between two balance sheet dates, may result in revisions to total estimated costs, currentincome and anticipated income. We recognize thesechanges in the period in which the changes in estimateare determined. We believe that this approach, referred to as the “catch-up approach”, produces moreaccurate information because the cumulative revenue-to-date reflects the current estimates of thestage of completion. Additionally, losses on fixed-pricecontracts are recognized in the period when they areidentified and are based upon the anticipated excess ofcontract costs over the related contract sales.
We accrue anticipated costs for warranties onproducts when we recognize the revenue on therelated contracts. Warranty costs include calculatedcosts arising from imperfections in design, material
and workmanship, performance guarantees (technicalrisks) and delays in contract fulfillment. Although wegenerally make assessments on an overall, statisticalbasis, we make individual assessments on orders with risks resulting from order-specific conditions orguarantees, such as plants or installations.There is a risk that actual warranty costs will exceed theamounts provided for, which would result in adeterioration of earnings in the future when theseactual costs are determined.
Sales under cost-reimbursement contracts arerecognized as costs are incurred. Shipping andhandling costs are recorded as a component of cost of sales.
Goodwill and other intangible assets impairmentOur accounting policies for accounting for goodwill andother intangible assets changed on January 1, 2002. In accordance with Statement of Financial AccountingStandards No.142 (SFAS 142), Goodwill and OtherIntangible Assets, we ceased to amortize goodwillon that date. Consequently, amortization expensesreflected on our Consolidated Income Statementreduced to US$41 million in 2002 from US$195 millionand US$190 million in 2001 and 2000, respectively incontinuing operations. Goodwill amortization expensein discontinued operations was US$36 million andUS$22 million in 2001 and 2000, respectively. We wererequired to perform an initial impairment review of ourgoodwill on January 1, 2002, and an annual impairmentreview on October 1.This impairment review requiredus to apply a fair value estimate to the reporting entities(business areas) to which the goodwill is applicable,as opposed to the individual assets of each acquiredcompany as before. This expanded the impairmentanalysis to include the future cash flows of thebusinesses owned before an acquisition that hasbenefited from an acquisition. Estimating future cashflows requires us to make significant estimates andjudgments involving variables such as sales volumes,sales prices, sales growth, production and operatingcosts, capital expenditures, market conditions andother economic factors. As in the previously applicableimpairment analysis, if we determine through theimpairment review process that goodwill has beenimpaired, we record the impairment charge in otherincome (expense), net, on our Consolidated IncomeStatement.

6 ABB Group Financial review 2002
Prior to January 1, 2002, we assessed the impairmentof goodwill and other identifiable intangible assetswhenever events or changes in circumstances indicatedthat the carrying value may not be recoverable. Some factors we considered important in conductingan impairment review included the following:
■ significant underperformance relative to historical orprojected future operating results;
■ significant changes in the manner of our use of the acquired assets or the strategy for our overallbusiness; and
■ significant negative industry or economic trends.
When we determined that the carrying value ofgoodwill and other identified intangible assets mightnot be recoverable based upon the existence of one or more of the above indicators of impairment, wemeasured any impairment based on a projecteddiscounted cash flow method using a discount ratecommensurate with the risk inherent in our currentbusiness model. In assessing the recoverability of ourgoodwill and other intangible assets, we were requiredto make assumptions regarding estimated future cashflows, discount rates and other factors to determinethe fair value of the assets. If our experience resulted indecreases to our forecasted cash flows or increases to the discount rate used, we were required to recordimpairment charges for these assets.
RestructuringWe recorded significant provisions in connection withour restructuring programs. These provisions includeestimates pertaining to employee termination costs andthe settlements of contractual obligations resulting fromour actions. Although we do not anticipate significantchanges, the actual costs may differ from theseestimates.These costs are recorded primarily in otherincome (expense), net, on the Consolidated IncomeStatement. See “Restructuring expenses” below.
TaxesIn preparing our Consolidated Financial Statements we are required to estimate income taxes in each ofthe jurisdictions in which we operate. We account fordeferred taxes by using the asset and liability method.Under this method, we determine deferred tax assetsand liabilities based on temporary differences betweenthe financial reporting and the tax bases of assets and liabilities.The differences are measured using theenacted tax rates and laws that are expected to be in effect when the differences are expected to reverse.We recognize a deferred tax asset when we determinethat it is more likely than not that the asset will be
realized. We regularly review our deferred tax assets forrecoverability and establish a valuation allowancebased upon historical losses, projected future taxableincome and the expected timing of the reversals ofexisting temporary differences.To the extent we increasethis allowance in a period, we expense the allowancewithin the tax provision in the Consolidated IncomeStatement. Unforeseen changes in tax rates and taxlaws as well as differences in the projected taxableincome versus the actual taxable income may affectthese estimates.
ContingenciesWe are subject to proceedings, lawsuits and otherclaims related to environmental, labor, product andother matters. We are required to assess the likelihoodof any adverse judgments or outcomes to thesematters as well as potential ranges of probable losses.A determination of the amount of reserves required, if any, for these contingencies is made after carefulanalysis of each individual issue often with assistancefrom both internal and external counsel and technicalexperts. The required amount of reserves with respect to any matter may change in the future due to new developments in that matter, including a change in approach to the matter, such as a change in settlement strategy.
Pension and post-retirement benefitsAs more fully described in Note 20 to our ConsolidatedFinancial Statements, we operate several pensionplans which cover the majority of our employees. Weuse actuarial valuations to determine our pension and postretirement benefit costs and credits. Theamounts calculated depend on a variety of keyassumptions, including discount rates and expectedreturn on plan assets. We are required to considercurrent market conditions, including changes in interest rates, in selecting these assumptions. Thediscount rate is adjusted annually based on changes in long-term, highly rated corporate bond yields.Decreases in the discount rate result in an increase inthe projected benefit obligation and to pension costs

ABB Group Financial review 2002 7
(as shown in Note 20 to our Consolidated FinancialStatements). The expected return on plan assets isadjusted annually based on current and expectedasset allocations and represents the long-term returnexpected to be achieved. Decreases in the expectedreturn on plan assets result in an increase to pensioncosts. If the expected rate of return on assets of 6.15 percent was to decrease by 0.5 percent to 5.65 percent then the 2003 pension costs wouldincrease by approximately US$26 million.
Under U.S. GAAP, we accumulate and amortize overfuture periods actual results that differ from theassumptions used.Therefore, actual results generallyaffect our recognized expense and recorded liabilitiesfor pension and other postretirement benefit obligationsin future periods.
The “unfunded” balance of a pension plan is thedifference between the projected obligation toemployees and the fair value of the plan assets. AtDecember 31, 2002, the unfunded balance of thepension benefits was US$1,879 million. In accordancewith Statement of Financial Accounting Standards No. 87 (SFAS 87), Employers’ Accounting for Pensions,we have recorded on the Consolidated Balance Sheeta net liability of US$653 million.The difference isprimarily due to an unrecognized actuarial loss of US$1,168 million, which is amortized using the “minimum corridor” approach as defined by SFAS 87.The unfunded balance, which can increase or decrease based on the performance of the financialmarkets or changes in our assumption rates, does notrepresent a mandatory short-term cash obligation. We comply with all appropriate statutory fundingrequirements.
We have multiple non-pension post-retirement benefitplans. Our health care plans are generally contributorywith participants’ contributions adjusted annually. Forpurposes of estimating our health care costs, we haveassumed health care cost increases to be 12.92 percentfor 2002, then gradually declining to 6.46 percent in2012, and to remain at that level thereafter.
Assumed health care cost trends have a significanteffect on the amounts reported for the health careplans. A one-percentage-point change in assumedhealth care cost increases would have had thefollowing effects at December 31, 2002:
One-percentage- One-percentage-point increase point decrease
(US$ in millions)
Effect on total of service andinterest cost components 2 (2)Effect on accumulated post-retirementbenefit obligation 26 (22)
InsuranceWe generally recognize premiums in earnings on a pro rata basis over the period coverage is provided.Premiums earned include estimates of certainpremiums not yet paid.These premium receivablesinclude premiums relating to retrospectively ratedcontracts. For such contracts, a provisional premium ispaid that will eventually be adjusted.We include anestimated value of the actual premium in receivables.Unearned premiums represent the portion of premiumswritten that is applicable to the unexpired terms ofreinsurance contracts or certificates in force. Theseunearned premiums are calculated by the monthly prorata method or are based on reports from cedingcompanies that we reinsure.
Insurance liabilities are reflected in accrued liabilitiesand other, on our Consolidated Balance Sheet and are determined on the basis of reports from primaryinsurers that we reinsure and underwritingassociations, as well as on management’s, including in-house actuaries’, estimates. These estimates includeincurred but not reported losses, salvage andsubrogation recoveries. Changes to these estimatedliabilities are recognized as an increase or decrease tocost of sales in the period in which they are identified.Inherent in the estimates of losses are expected trendsof frequency, severity and other factors that could vary significantly as claims are settled. Accordingly,ultimate losses could vary significantly from theamounts currently provided for.
We seek to reduce the loss from our underwritingliabilities by reinsuring certain levels of risks with otherinsurance enterprises or reinsurers. We usedrecoverable amounts for both paid and unpaid losses.We estimate these recoverable amounts in a mannerconsistent with the claim liability associated with thereinsurance policy. The risk of collectibility of thesereinsurance receivables arises from disputes relating tothe policy terms and the ability of the reinsurer to pay.

8 ABB Group Financial review 2002
Accounting for discontinued operationsWe have adopted, with effect from January 1, 2002,Statement of Financial Accounting Standards No.144(SFAS 144), Accounting for the Impairment or Disposalof Long-Lived Assets. SFAS 144 broadened thepresentation of discontinued operations to includedisposal transactions involving less than an entirereporting segment, if certain criteria are met. Thepurpose of SFAS 144 was to allow for historicallycomparable data to be available to investors withoutthe distortions created by divestments or operationabandonments, thereby improving the predictive valueof financial statements. SFAS 144 requires theaccumulated earnings and associated costs, net oftaxes, of divestments and certain restructuringprograms to be grouped in discontinued operationsbelow income from continuing operations and therelated assets and liabilities to be grouped in thespecific lines of assets and liabilities in discontinuedoperations in the Consolidated Balance Sheet. In theConsolidated Statement of Cash Flows we haveincluded these businesses in the individual line itemswithin cash from operating, investing and financingactivities.
Income (loss) from discontinued operations, net of tax,in our Consolidated Income Statement includes the following items:
■ Practically all of our Oil, Gas and Petrochemicalsdivision which supplies a comprehensive range ofproducts, systems and services to the global oil, gas and petrochemicals industries, from thedevelopment of onshore and offshore explorationtechnologies to the design and supply of productionfacilities, refineries and petrochemicals plants.
■ The majority of our Structured Finance business,which we sold to GE Commercial Finance inNovember 2002. This business provided debt capitalfor projects and equipment, and asset-basedfinancing (such as leasing).
■ Our Metering business, which we sold to RuhrgasIndustries GmbH in December 2002. This businessproduced electricity, water, energy and gas meters,metering systems and load control systems.
■ A charge of US$420 million taken in 2002 as part of the Pre-Packaged Plan of Reorganization forCombustion Engineering, under Chapter 11 of theUnited States Bankruptcy Code. The status ofCombustion Engineering is contained inContingencies and retained liabilities below, as wellas Note 17 to the Consolidated Financial Statements.
■ A number of other businesses sold in 2002 including:the components business of ABB Trasmissione eDistribuzione S.p.A (Italy), which was sold to EBRebosio S.r.l.; Energy Information Systems Ltd of theUnited Kingdom, which was sold to Alstom SA; and the ABB Drying Business (a division of ABB Inc.comprising a number of legal entities), which wassold to Andritz AB and Andritz Ltd.
■ Various abandoned businesses for which a buyercould not be found.
■ Legal and professional fees related to the above disposals.
Income (loss) from discontinued operations was a lossof US$880 million, net of tax, for the year ended 2002,a loss of US$501 million for 2001 and income ofUS$677 million in 2000. The income (loss) fromdiscontinued operations, net of tax, for the above itemsis detailed below.
Discontinued operations 2002 2001 2000
Year ended December 31, (US$ in millions)
Oil, Gas and Petrochemicals (121) 8 105Structured Finance (190) 8 (7)Metering (54) 14 19Combustion Engineering (420) (470) (70)Power Generation – – 638Other divested businesses (20) (7) (4)Abandoned businesses/Other (75) (54) (4)Income (loss) from discontinued operations,net of tax (880) (501) 677
The above includes the businesses’ operational results,currency translation adjustments, capital gains andlosses on sale, goodwill write-offs and other costs.
A review of the operating results of the principaldiscontinued operations can be found below under“Business divisions – Discontinued operations”. For a further discussion of discontinued operations and the related accounting treatment, see Note 3 tothe Consolidated Financial Statements.
ABB Group Financial review 2002 9
We expect to continue to identify non-core businessesfor disposal. As a business meets the criteria of SFAS 144, we will reflect the results of operations fromthe business as income (loss) from discontinuedoperations, net of tax, in our Consolidated IncomeStatement and as assets and liabilities in discontinuedoperations in our Consolidated Balance Sheet.We willreclassify the prior years’ presentation to reflect theseplanned disposals on a comparable basis.
New accounting pronouncementsIn June 2001, the Financial Accounting StandardsBoard issued Statement of Financial AccountingStandards No.141 (SFAS 141), Business Combinations,and SFAS 142, which modified the accounting forbusiness combinations, goodwill and identifiableintangible assets. SFAS 141 requires that the purchasemethod of accounting be used for all businesscombinations initiated after June 30, 2001. Goodwillfrom acquisitions completed after that date is notamortized, but is charged to operations when specifiedtests indicate that the goodwill is impaired, that is,when the goodwill’s fair value is lower than its carryingvalue. SFAS 141 also specifies types of acquiredintangible assets that must be recognized and reportedseparately from goodwill, and that will be amortizedover their useful lives.
SFAS 142 required us to evaluate our existing intangibleassets and goodwill and to make any necessaryreclassifications in order to conform with the newseparation requirements at the date of adoption. Were-assessed the estimated useful lives and residualvalues of all intangible assets other than goodwill anddetermined that no adjustments regarding amortizationperiods were necessary.
SFAS 142 required us to perform an assessment ofwhether there is an indication that goodwill is impairedas of January 1, 2002. To accomplish this, we (1)identified our reporting units, (2) determined thecarrying value of each reporting unit by assigning theassets and liabilities, including the existing goodwill and intangible assets, to those reporting units, and (3) determined the fair value of each reporting unit. Wedetermined that no impairment of goodwill existed atJanuary 1, 2002. All goodwill amortization also ceasedat that date. We recognized goodwill amortizationexpense of US$155 million and US$152 million andgoodwill amortization expense in discontinuedoperations of US$36 million and US$22 million in 2001and 2000, respectively. Accordingly, loss fromcontinuing operations in 2001 and income from
continuing operations in 2000 would have been US$10 million (US$0.01 per share) and US$918 million(US$0.77 per share), respectively, and net loss in 2001 and net income in 2000 would have been US$538 million (US$0.48 per share) and US$1,617 million (US$1.36 per share), respectively, if we had not recognized amortization expense for goodwill that is no longer being amortized inaccordance with SFAS 142.
In June 2001, the Financial Accounting StandardsBoard issued Statement of Financial AccountingStandards No.143 (SFAS 143), Accounting for AssetRetirement Obligations, which is effective for fiscalyears beginning after June 15, 2002. SFAS 143 appliesto legal obligations associated with the retirement of long-lived assets that result from the acquisition,construction, development and normal operation oflong-lived assets. It requires that the fair value of aliability for an asset retirement obligation be recognizedin the period in which it is incurred. The associatedasset retirement costs are capitalized as part of thecarrying amount of the long-lived asset and allocatedto expense over its useful life. We adopted SFAS 143effective January 1, 2003. We do not expect SFAS 143to have a material impact on our results of operations.
In August 2001, the Financial Accounting StandardsBoard issued SFAS 144, which supersedes Statementof Financial Accounting Standards No. 121, Accountingfor the Impairment of Long-Lived Assets and for Long-Lived Assets to Be Disposed Of, while retainingmany of its requirements regarding impairment lossrecognition and measurement. In addition, SFAS 144broadens the presentation of discontinued operationsto include more sold and abandoned businesses.We adopted this statement effective January 1, 2002,and, as a result, reflected the assets, liabilities andresults of operations of several businesses and groupof assets as discontinued operations for all periodspresented to the extent these businesses and groupsof assets met the new criteria during 2002. Disposals and abandonments in previous years werenot re-evaluated or reclassified. See “Discontinuedoperations” above.
10 ABB Group Financial review 2002
In April 2002, the Financial Accounting StandardsBoard issued Statement of Financial AccountingStandards No. 145, Rescission of FASB StatementsNo. 4, 44 and 64, Amendment of FASB Statement No.13, and Technical Corrections, which rescindedprevious requirements to reflect all gains and lossesfrom debt extinguishment as extraordinary. We electedto early adopt the new standard effective April 1, 2002,and, as a result, the gains from extinguishment of debt of US$12 million recorded as extraordinary itemsin 2001, are no longer reflected in extraordinary items.
In June 2002, the Financial Accounting StandardsBoard issued Statement of Financial AccountingStandards No. 146 (SFAS 146), Accounting for CostsAssociated with Exit or Disposal Activities, whichrequires that a liability for a cost associated with an exitor disposal activity be recognized when the liability is incurred. The standard is effective January 1, 2003and is to be applied to restructuring plans initiated after that date.
In November 2002, the Financial AccountingStandards Board issued Interpretation No. 45 (FIN 45),Guarantor’s Accounting and Disclosure Requirementsfor Guarantees, Including Indirect Guarantees ofIndebtedness of Others. FIN 45 requires the guarantorto recognize a liability for the non-contingentcomponent of a guarantee; that is, the obligation tostand ready to perform in the event that specifiedtriggering events or conditions occur.The initialmeasurement of this liability is the fair value of theguarantee at its inception.The recognition of the liability is required even if it is not probable thatpayments will be required under the guarantee or if theguarantee was issued with a premium payment or aspart of a transaction with multiple elements. FIN 45also requires additional disclosures related toguarantees in our financial statements.The recognitionmeasurement provisions of FIN 45 are effective forall guarantees entered into or modified after December31, 2002. We have adopted the disclosurerequirements of FIN 45 as of December 31, 2002.
In December 2002, the Financial Accounting StandardsBoard issued Statement of Financial AccountingStandards No.148 (SFAS 148), Accounting for Stock-Based Compensation – Transition andDisclosure – An Amendment of Financial AccountingStandards Board Statement No.123. SFAS 148amends SFAS 123, Accounting for Stock-BasedCompensation, to provide alternative methods oftransition for a voluntary change to the fair value basedmethod of accounting for stock-based employeecompensation. In addition, SFAS 148 requires moreprominent disclosures in our financial statements
about the method of accounting used for stock-basedemployee compensation and the effect of the methodused on reported results. We have elected to continuewith our current practice of applying the recognitionand measurement principles of APB No. 25,Accounting for Stock Issued to Employees, whichrequires us to recognize, except in specialcircumstances, compensation expense for warrantsissued under our management incentive plan only if theshare price exceeds the exercise price of the warrantson date of grant, which is not generally the case.Wehave adopted the disclosure requirements of SFAS 148as of December 31, 2002.
In January 2003, the Financial Accounting StandardsBoard issued Interpretation No. 46 (FIN 46),Consolidation of Variable Interest Entities. FIN 46requires existing unconsolidated variable interestentities (VIEs) to be consolidated by their primarybeneficiaries if the entities do not effectively disperserisks among the parties involved. FIN 46 appliesimmediately to VIEs created after January 31, 2003and to VIEs in which an enterprise obtains an interestafter that date. For VIEs in which an enterprise holds a variable interest that was acquired before February 1,2003, FIN 46 applies for periods beginning after June 15, 2003.
In November 2002, the Emerging Issues Task Force(EITF) of the Financial Accounting Standards Boardissued EITF 00-21 (EITF 00-21) Accounting for RevenueArrangements with Multiple Deliverables, which wasamended in January 2003 and requires that (a) revenueshould be recognized separately for separate units of accounting in multiple deliverables arrangement, (b) revenue for a separate unit of accounting should berecognized only when the arrangement consideration is reliably measurable and the earnings process issubstantially complete and, (c) consideration should be allocated among the separate units of accountingbased on their relative fair value. EITF 00-21 isapplicable to transactions entered into after January 1,2004.We believe that EITF 00-21 will not result in a significant change in our practice of accounting forarrangements involving delivery or performance ofmultiple products and services.

ABB Group Financial review 2002 11
Restructuring expenses
Elsag Bailey restructuring programDuring the first quarter of 1999 in connection with ourpurchase of Elsag Bailey, we implemented arestructuring plan intended to consolidate operationsand gain operational efficiencies.The plan called forworkforce reductions of approximately 1,500 salariedemployees primarily in Germany and the United States.Restructuring charges and related write downs ofUS$192 million were included in other income(expense), net, during 2000, of which approximatelyUS$90 million related to the continued integration of Elsag Bailey.The restructuring was substantiallycomplete at the end of 2000.
July 2001 restructuring programIn July 2001, we announced a restructuring program(2001 program) anticipated to extend over 18 months.The 2001 program was initiated in an effortto improve productivity, reduce our cost base, simplifyproduct lines, reduce multiple location activities andperform other downsizing in response to weakeningmarkets and consolidation of major customers in certain industries.
In 2001, we recognized restructuring charges of US$109 million relating to workforce reductions andUS$71 million related to lease terminations and otherexit costs associated with the 2001 program. Thesecosts are included in other income (expense), net.Termination benefits of US$32 million were paid toapproximately 2,150 employees and US$31 million waspaid to cover costs associated with lease terminationsand other exit costs.Workforce reductions includeproduction, managerial and administrative employees.At December 31, 2001, accrued liabilities included US$78 million for termination benefits and US$39 million for lease terminations and other exit costs.
As a result of the 2001 program, certain assets,inventories and property, plant and equipment havebeen identified as impaired or will no longer be used in continuing operations. We recorded US$41 million to write down these assets to fair value.These costs are included in cost of sales and other income(expense), net.
In 2002, we recognized charges of US$166 millionrelated to workforce reductions and charges of US$38 million related to lease terminations and otherexit costs associated with the 2001 program.These costs are included in other income (expense),net. Based on changes in our original estimate, aUS$21 million reduction in the amounts accrued for
workforce reductions, lease terminations and other exit costs have been included in other income (expense),net.The effect of translating local currencies into U.S. dollars for reporting purposes resulted in a US$24 million increase in the liabilities accrued forworkforce reductions, lease terminations and other exitcosts. Termination benefits of US$149 million were paid toapproximately 4,000 employees and US$29 million waspaid to cover costs associated with lease terminationsand other exit costs. Workforce reductions includeproduction, managerial and administrative employees. At December 31, 2002, accrued liabilities included US$94 million for termination benefits and US$52 millionfor lease terminations and other exit costs. The 2001program was substantially completed during 2002 and the remaining liability will be paid through 2003.
As a result of the 2001 program, certain assets,inventories and property, plant and equipment have beenidentified as impaired or will no longer be used in continuing operations. We recorded US$18 million in2002 to write down these assets to fair value.These costs are included in cost of sales and other income(expense), net.
Step change programIn October 2002, we announced the Step changeprogram. We estimate that the restructuring cost underthe program will be approximately US$300 million andUS$200 million, in 2003 and 2004, respectively. The goalsof the program are to increase competitiveness of ourcore businesses, reduce overhead costs and streamlineoperations by approximately US$800 million on an annualbasis by 2005. The Step change program is expected tobe completed by mid-2004.
In 2002, related to the Step change program, werecognized restructuring charges of US$51 million relatedto workforce reductions and US$26 million related tolease terminations and other exit costs associated with the restructuring program.These costs are included inother income (expense), net.Termination benefits ofUS$13 million were paid to approximately 200 employeesand US$1 million was paid to cover costs associated with lease terminations and other exit costs. Workforcereductions include production, managerial andadministrative employees. At December 31, 2002,accrued liabilities included US$38 million for terminationbenefits and US$25 million for lease terminations andother exit costs.

12 ABB Group Financial review 2002
As a result of the Step change program, certain assetshave been identified as impaired or will no longer be used in continuing operations. We recorded US$2 million to write down these assets to fair value.These costs are included in other income (expense), net.
2001 Stepprogram change Other Total
Year ended December 31, 2002 (US$ in millions)
Restructuring charge for workforce reduction 166 51 – 217Restructuring charge forlease terminations and other 38 26 – 64Write-down cost 18 2 – 20Change in estimate (21) – (9) (30)
Total restructuring charges andrelated asset write-downs 201 79 (9) 271Total cash paymentsduring the year 178 14 – 192Total accrued liabilitiesat the end of the year 146 63 – 209
Year ended December 31, 2001 (US$ in millions)
Restructuring charge forworkforce reduction 109 – – 109Restructuring charge forlease terminations and other 71 – – 71Write-down cost 41 – – 41Change in estimate – – – –
Total restructuring charges andrelated asset write-downs 221 – – 221Total cash paymentsduring the year 63 – – 63Total accrued liabilitiesat the end of the year 117 – – 117
Acquisitions, investments and divestitures
Acquisitions and investmentsIn 2002, 2001 and 2000, we paid aggregateconsideration of US$154 million, US$597 million andUS$896 million, respectively, related to acquisitions andinvestments in joint ventures and affiliated companiescompleted in those years. Payments made net of cashacquired were US$144 million, US$578 million andUS$893 million in 2002, 2001 and 2000, respectively.
In 2002, we made no significant acquisitions. We in-creased our investment in a small number of companiesin which we had a controlling interest, and we acquiredan Italian small-ticket leasing business from Xerox(which was later sold as part of Structured Finance).
In June 2001, we completed the acquisition of EntrelecGroup, a France-based supplier of automation andcontrol products, for total aggregate consideration ofUS$284 million.The acquisition of Entrelec, which had operations in 17 countries, diversified our productrange and expanded our customer base in high growth markets.
In June 2000, we acquired for aggregate considerationof US$130 million the oil and gas service activities ofUmoe ASA, a Norwegian service company in the oil and gas industry, to support our further growth in that market.
In June 2000, we entered into a share subscriptionagreement to acquire a 42 percent interest in b-businesspartners B.V. Pursuant to the terms of the agreement,we committed to invest a total of US$278 million, of which US$69 million was paid in 2000 and US$134 million was paid during the first half of 2001. In December 2001, Investor AB acquired 90 percent ofour investment and capital commitments forapproximately book value, or the equivalent of US$166 million in cash. After this initial transaction, b-business partners B.V. repurchased 50 percent of itsoutstanding shares, which resulted in a return of capitalto us of US$10 million. After these transactions, weretain a 4 percent investment in b-business partnersB.V. and we are committed to provide additional capital to b-business partners B.V. of approximatelyUS$4 million (a euro-denominated commitment thatmay fluctuate with exchange rates). Further, b-businesspartners B.V. retains a put right to cause us torepurchase 150,000 shares of b-business partners B.V.at a cost of approximately US$16 million (a euro-denominated commitment that may fluctuate withexchange rates). The 2001 transactions are reflected inour Consolidated Statements of Cash Flows andincluded in the aggregate total amounts of investments(US$578 million net of cash acquired) and divestment(US$283 million net of cash disposed).

ABB Group Financial review 2002 13
DivestituresIn 2002, 2001 and 2000, we received aggregate cashconsideration of US$2,545 million, US$283 million andUS$1,963 million, respectively, from dispositions and recognized net gains (losses) of US$(96) million,US$34 million and US$931 million, respectively. The material dispositions are described below. Cashreceived from sales of businesses, net of cashdisposed, was US$2,509 million, US$283 million andUS$1,499 million in 2002, 2001 and 2000, respectively.
In November 2002, we sold to GE Commercial Financemost of our Structured Finance business, whichincluded our global infrastructure financing, equipmentleasing and financing businesses. We received cashproceeds of US$2,000 million (including a contingentpayment of US$ 20 million to be released to us in the future based on amounts ultimately collected by GE Commercial Finance) and transferred US$578 million of debt to GE Commercial Finance.GE Commercial Finance has the option to require us to repurchase certain designated assets upon theoccurrence of certain events. We recognized a loss ofapproximately US$190 million within the income (loss)from discontinued operations, net of tax, of whichapproximately US$146 million relates to the loss ondisposal (the difference of US$44 million is attributableto the operational result, amounts for interest expense,taxes, minority interest and other items).
In December 2002, we completed the sale of ourMetering business, consisting of water and electricitymetering, to Ruhrgas Industries GmbH for cashproceeds of US$223 million. We recognized a loss ondisposal of US$48 million (including a goodwill write-off of US$65 million) which is included in the total lossof US$54 million within the income (loss) fromdiscontinued operations, net of tax (the difference ofUS$6 million is attributable to the operational result,amounts for interest expense, taxes, minority interestand other items). Also, we disposed of a number ofsmaller businesses for cash proceeds of US$209million and recognized an aggregate net gain of US$24million.
In January 2002, we disposed of our Air Handlingbusiness for cash proceeds of US$113 million (thesales price of US$147 million included a vendor note ofUS$34 million issued by the purchaser) to Global AirMovement (Luxembourg) SARL and recognized a gainin other income (expense), net of US$74 million.
In 2000, we disposed of our Power Generationsegment, which included our investment in the ABB ALSTOM POWER joint venture and our Nucleartechnology business. We received cash proceeds of US$1,197 million from ALSTOM in exchange forour joint venture interest and recognized a gain ofUS$734 million (US$713 million, net of tax). We alsoreceived proceeds of US$485 million from the sale of the Nuclear technology business andrecognized a gain of US$55 million (US$17 million, net of tax). The net gain from the sale of the Nucleartechnology business reflects a US$300 millionprovision for environmental remediation. The gainswere also offset by operating losses associated withthese businesses. Our Consolidated FinancialStatements reflect our former Power Generationsegment as discontinued operations.
For a discussion of our commitments and retained liabilities relating to the above divestedbusiness, see “Contractual obligations and commercial commitments” and “Contingencies and retained liabilities”.
We have announced our intention to divest a numberof businesses, including nearly all of the Oil, Gas andPetrochemicals division, Building Systems, the aircraftleasing business (which was sold as of March 31,2003), ABB Export Bank, our 35 percent stake inSwedish Export Credit Corporation and other equityventures participations.

14 ABB Group Financial review 2002
Summary financial dataThe following table shows the amount and percentage of ABB Group revenues derived from each of our businessdivisions (see Note 25 to our Consolidated Financial Statements):
Revenues Percentage of revenuesYear ended December 31, Year ended December 31,
2002 2001 2000 2002 2001 2000
(US$ in millions) (in %)
Utilities 4,826 5,634 5,460 20.6 22.5 22.0Industries 4,412 4,995 5,443 18.9 19.9 22.0Power Technology Products 4,355 3,961 3,587 18.7 15.8 14.5Automation Technology Products 5,035 4,756 4,671 21.6 19.0 18.9Non-Core Activities
Insurance 657 956 805 n/a n/a n/aEquity Ventures 21 35 41 n/a n/a n/aStructured Finance 92 133 126 n/a n/a n/aBuilding Systems 2,372 2,568 2,506 n/a n/a n/aNew Ventures 132 113 108 n/a n/a n/aOther Non-Core Activities 912 1,325 1,236 n/a n/a n/a
Non-Core Activities Subtotal 4,186 5,130 4,822 17.9 20.4 19.5Corporate/Other 527 612 780 2.3 2.4 3.1Subtotal 23,341 25,088 24,763 100.0 100.0 100.0Consolidation effect and eliminations (5,046) (5,706) (5,408)Consolidated revenues 18,295 19,382 19,355
We conduct business in approximately 100 countries around the world. The following table shows the amount and percentage of our consolidated revenues derived from each geographic region (based on the location of thecustomer) in which we operate:
Revenues Percentage of revenuesYear ended December 31, Year ended December 31,
2002 2001 2000 2002 2001 2000
(US$ in millions) (in %)
Europe 10,265 10,852 12,104 56.2 55.9 62.6The Americas 4,101 4,863 4,673 22.4 25.1 24.1Asia 2,603 2,435 1,741 14.2 12.6 9.0Middle East and Africa 1,326 1,232 837 7.2 6.4 4.3Total 18,295 19,382 19,355 100.0 100.0 100.0
Factors affecting comparability
Exchange ratesWe report our financial results in U.S. dollars. A significant amount of our revenues, expenses, assets and liabilities are denominated in other currencies due to our global operations. As a consequence, movements in exchange rates affect:
■ our profitability,
■ the comparability of our results between periods,and
■ the carrying value of our assets and liabilities.
When we incur expenses that are not denominated in the same currency as the related revenues, foreignexchange rate fluctuations could adversely affect our profitability.
We must translate non-U.S. dollar denominated resultsof operations, assets and liabilities to U.S. dollars in ourConsolidated Financial Statements. Balance sheet itemsare translated to U.S. dollars using year-end exchangerates and income statement and cash flow itemsare translated using average exchange rates during therelevant period. As a consequence, increases anddecreases in the value of the U.S. dollar versus othercurrencies will affect our reported results of operationsand the value of our assets and liabilities in ourConsolidated Balance Sheet, even if our results ofoperations or the value of those assets and

ABB Group Financial review 2002 15
liabilities have not changed when denominated in theiroriginal currency. These translations could significantlyaffect the comparability of our results between financial periods and/or result in significant changes to the carrying value of our assets, liabilities andstockholders’ equity.
The cash flow is calculated using the average exchangerates and the balance sheet items are calculated using the year-end exchange rates. The effect of theseexchange differences resulted in an increase of US$141 million, and decreases of US$72 million andUS$84 million, in 2002, 2001 and 2000, respectively, to our total cash flow.
Because fluctuations in exchange rates affect thecomparability of our results between periods, thediscussion of our results of operations below provides,when relevant, information with respect to orders,revenues and earnings before interest and taxes asreported in local currencies.
In 2002, the Euro reversed the development of 2001and strengthened against the U.S. dollar, reaching an exchange rate of 1.05 at the end of 2002, with adeterioration in the first quarter being offset by asecond quarter recovery and then a period of stabilityprior to further appreciation in December 2002.The average exchange rate for the year was 0.94.TheSwiss franc also appreciated versus the U.S. dollar,reaching 0.72 at the end of 2002, it had a similardevelopment to the Euro with deterioration in the firstquarter being offset by a second quarter recovery andthen a period of stability prior to further appreciation in December 2002.The average Swiss franc exchangerate for 2002 was 0.64.
In 2001, the Euro weakened against the U.S. dollar,reaching an exchange rate of 0.88 at the end of 2001,with the deterioration in the first half recovering in partin the second half of 2001.The average exchange ratefor the year was 0.89. The Swiss franc also declinedversus the U.S. dollar in the first half of 2001, reachinga low of 0.55 in May and June 2001, with a recovery in the fourth quarter of 2001 to reach an exchange rateof 0.62. However, the Swiss franc declined slightly,closing the year at 0.59. The average Swiss francexchange rate for 2001 was 0.59. In 2000, the Euroweakened against the U.S. dollar from its opening levelof 1.00 to a closing exchange rate of 0.93.The averageexchange rate for 2000 was also 0.93.The Swiss francalso declined versus the U.S. dollar in 2000, from anopening level of 0.63 to a year-end closing exchangerate of 0.61.
“Pull-through products”We evaluate the performance of our divisions basedupon earnings before interest and taxes (EBIT), which excludes interest and dividend income, interestexpense, provision for taxes, minority interest andincome (loss) from discontinued operations, net of tax.We also measure each division’s revenues consideringboth third-party customer sales as well as inter-divisional sales.
In mid-2001 we replaced our former businesssegments with business divisions structured alongcustomer groups. Our product divisions (PowerTechnology Products and Automation TechnologyProducts divisions) served our end-user divisions(Utilities and Industries) as well as wholesalers,distributors, original equipment manufacturers andsystem integrators that are referred to as “externalchannel partners”. Under this new divisional structure,sales made by the end-user divisions of productsmanufactured by the product divisions (which we call“pull-through sales”) were attributed to the end-userdivisions. The internal sales made by a product divisionto an end-user division were reflected in the results of each product division and were eliminated in ourconsolidated results.
In order to present divisional information on acomparable basis for all years presented, we estimatedthe amount of pull-through sales and the related EBITthat would have resulted from sales by the productdivisions to the end-user divisions under the newdivisional structure in 2000 and 2001. Our divisionalresults reflect actual pull-through sales and EBIT during 2002. Because our estimates of total year pull-through sales in 2001 were higher than the actualamount of pull-through sales reported in 2002, thereare several instances in which a division’s orders and revenues will appear to have decreased in 2002 as compared to 2001. There is no impact on ourreported consolidated third-party revenues or EBITrelated to these pull-through sales, as these pull-through sales and related EBIT are eliminated in theconsolidation process.
OrdersWe book an order when a binding contractualagreement has been concluded with the customercovering, at a minimum, the price and the scope of products or services to be supplied. Approximately 6 percent of our total orders booked in 2002 were“large orders”, which we define as orders from thirdparties involving at least US$15 million worth ofproducts or systems. Portions of our business,particularly in our Utilities and Industries divisions,

16 ABB Group Financial review 2002
involve orders related to long-term projects which can take many months or even years to complete.Revenues related to these large orders are typicallyrecognized on a percentage of completion basis over aperiod, ranging from several months to several years.
The level of orders can fluctuate from year to year.Arrangements included in particular orders can becomplex and non-recurring. Although large orders aremore likely to result in revenues in future periods, thelevel of large orders, and orders generally, cannot beused to predict accurately future revenues or operating performance. Orders that are placed can becancelled, delayed or modified by the customer.These actions can have the effect of reducing oreliminating the level of expected revenues or delayingthe realization of revenues. The Utilities and the Industries divisions’ total orders containedapproximately 12 percent and 9 percent, respectively,of large orders in 2002.
Percentage of completion accountingWhen we undertake a long-term, fixed price project,we recognize costs, revenues and profit margin fromthat project in each period based on the percentage of the project completed. Profit margin is based on our estimate of the amount by which total contractrevenues will exceed total contract costs atcompletion. The nature of this accounting method issuch that refinements of the estimating process forchanging conditions and new developments arecontinuous. Accordingly, as work progresses or aschange orders are approved and estimates are revised,contract margins may be increased or reduced.Expected losses on loss contracts are recognized in full immediately.
In an effort to reduce the amount of risk associated with fixed price contracts we have shifted our focus toreimbursable contracts, in which we charge ourcustomers the sum of our materials, production,logistics, administrative and financial costs, togetherwith a negotiated operating profit margin. Additionally,we expect the planned disposal of the Oil, Gas andPetrochemicals division to further reduce our exposureto risk from long-term fixed price contracts.
Analysis of results of operations
Consolidated
Year ended December 31, 2002 compared with year ended December 31, 2001
OrdersOrders for the ABB Group (excluding discontinuedoperations) decreased US$1,560 million, or 8 percent,to US$18,112 million in 2002 from US$19,672 millionin 2001. As reported in local currencies, ordersdeclined by 10 percent in 2002 compared to 2001.The level of orders in 2002 compared to 2001increased in the Automation Technologies division,Power Technologies division and Industries division(after excluding the “pull-through effect”), but thisincrease was more than offset by reductions within the Utilities division and Non-Core Activities.
RevenuesRevenues for the ABB Group decreased by US$1,087 million, or 6 percent, to US$18,295 million in2002 from US$19,382 million in 2001. As reported in local currencies, revenues decreased 8 percent in2002 compared to 2001. This reflects the effect oftranslating revenues generated in local currencies intothe U.S. dollar, which weakened against most of our local currencies. This decrease in revenues on a consolidated basis was primarily within Non-Core Activities.
Utilities division revenues decreased by US$808 million,or 14 percent, in 2002 compared to 2001 (a 15 percentdecrease as reported in local currencies). The decrease in revenues was primarily due to a reductionin revenues from “pull-through” sales, or sales of pull-through volumes; excluding this effect, revenueswere flat.
Industries division revenues decreased by US$583 million, or 12 percent, in 2002 compared to2001 (a 14 percent decrease as reported in localcurrencies). The decrease in revenues was alsoprimarily due to a reduction in pull-through volumes;excluding this effect, revenues were flat.
Power Technology Products division revenues increasedby US$394 million, or 10 percent, in 2002 comparedto 2001 (a 9 percent increase as reported in localcurrencies), primarily due to increases in the High-Voltage Technology and Power Transformers businessareas and a modest increase in the Medium-Voltagebusiness area.
ABB Group Financial review 2002 17
Automation Technology Products division revenuesincreased by US$279 million, or 6 percent, in 2002compared to 2001 (a 3 percent increase as reported in local currencies), primarily reflecting growth in theRobotics business area.
Non-Core Activities revenues decreased by US$944 million, or 18 percent, in 2002 compared to2001 (a 22 percent decrease as reported in localcurrencies). This decrease resulted from the cessationof certain reinsurance activities within the Insurancebusiness area, the sale of the Air Handling business inJanuary 2002, market downturns within the BuildingSystems business area and the strategic reduction ofour presence in some of the markets of the LogisticSystems and Customer Service business areas.
A more detailed discussion of the results of our individual divisions follows in the “BusinessDivisions” section.
Cost of salesCost of sales for the ABB Group decreased byUS$1,108 million, or 7 percent, to US$13,769 million in 2002 from US$14,877 million in 2001. As a percentage of revenues, cost of sales decreased from77 percent in 2001 to 75 percent in 2002. Thedecrease was primarily attributable to improvementswithin Power Technology Products and AutomationTechnology Products divisions and the non-recurrenceof a number of costs from 2001 within Non-CoreActivities. In 2001 within Non-Core Activities, as a resultof a change in the accounting estimate for reinsurancereserves, a US$295 million non-cash charge wasbooked, along with a charge for US$138 million inunderwriting losses, to the Insurance business area.Additionally, we recorded costs and provisions relatedto alternative energy projects of US$55 million in theNew Ventures business area in 2001. The non-recurrence of these costs in 2002 in Non-CoreActivities has been partly offset by project write-downs,closure and restructuring costs within the BuildingSystems business area. The Utilities division cost ofsales deteriorated due to the execution of low-marginsystems projects taken before 2001 in the PowerSystems business area. We have adopted a selectivebidding approach within the Utilities division aimed atreducing project risks and securing better margins.
Our cost of sales consists primarily of labor, rawmaterials and related components. Cost of sales alsoincludes provisions for warranty claims, contract losses and project penalties, as well as order-relateddevelopment expenses related to projects for which we have recognized corresponding revenues. Order-related development expenditures amounted to
US$249 million and US$405 million in 2002 and 2001,respectively. Order-related development amounts areinitially recorded in inventories as part of the work in progress of a contract, and then reflected in cost ofsales at the time revenue is recognized.
Selling, general and administrative expensesSelling, general and administrative expenses increasedby US$40 million, or 1 percent, to US$4,033 million in2002 from US$3,993 million in 2001. As reported inlocal currencies, selling, general and administrativeexpenses decreased 2 percent in 2002 compared to2001. Improvements in selling, general andadministrative expenses were the result of thecontinuing group-wide cost reduction and efficiencyimprovement initiatives from 2001 and the recovery of payments from two former chief executive officers.These improvements were slightly offset by the group-wide integration costs of group processes alongwith a reduction in the rate of capitalization of internallydeveloped software. As a percentage of revenues,selling, general and administrative expenses increasedto 22 percent in 2002 from 21 percent in 2001. Non-order related research and development costs,which are included in selling, general and administrativeexpenses, were US$550 million and US$593 million in 2002 and 2001, respectively. For the year 2002, theAutomation Technology Products and PowerTechnology Products divisions incurred non-orderrelated research and development costs of US$219 million and US$119 million, respectively. The remaining costs were shared among the other divisions.
Amortization expenseAmortization expense decreased by US$154 million, or 79 percent, to US$41 million in 2002 from US$195 million in 2001. This decrease reflects theimplementation of SFAS142, pursuant to which weceased to amortize goodwill arising from acquisitions,with effect from January 1, 2002. The expense in2002 primarily reflects the amortization of intellectualproperty related to the 1999 acquisition of ElsagBailey Process Automation N.V.
Other income (expense), netOther income (expense), net, typically consists of: our share of income or loss on investments, principallyfrom our Equity Ventures business area; gains or lossesfrom sales of businesses, investments and property,plant and equipment; license income; and restructuringcharges. Other income (expense), net, improved by US$102 million, or 64 percent, to an expense of

18 ABB Group Financial review 2002
US$58 million in 2002 from an expense of US$160 million in 2001.The increase in capital gains to US$119 million in 2002 from US$56 million in 2001primarily reflected the gain on the sale of our AirHandling business in January 2002. In addition incomefrom equity accounted companies, license income and other increased to US$177 million in 2002 fromUS$95 million in 2001 (primarily related to ourinvestment in the Swedish Export Credit Corporation).Amounts in 2001 from our investment in the SwedishExport Credit Corporation were restated as describedin Note 13 to the Consolidated Financial Statements.These increases were partly offset by the combinedeffects of the increase in restructuring expenses toUS$261 million in 2002 from US$220 million in 2001and the increase in asset write-downs of both tangibleand intangible assets to US$93 million in 2002 fromUS$91 million in 2001.
Earnings before interest and taxesEarnings before interest and taxes, or operatingincome, increased US$237 million, or 151 percent, toUS$394 million in 2002 from US$157 million in 2001.As reported in local currencies, earnings before interestand taxes improved by 143 percent in 2002 whencompared to 2001. The increase is primarily attributableto the lower cost of sales percentage, the cessation ofgoodwill amortization in 2002 and higher income fromequity accounted companies. As a percentage ofrevenues, earnings before interest and taxes increasedfrom 1 percent in 2001 to 2 percent in 2002.
Net interest and other finance expenseNet interest and other finance expense consists ofinterest and dividend income offset by interest andother finance expense. In 2002 the benefit from thegain on the convertible bond and lower market interestrates were partially offset by higher financing costsand the unfavorable impact of our lower credit ratings.Net interest and other finance expense decreased byUS$80 million, or 36 percent, to an expense ofUS$143 million in 2002 from an expense of US$223million in 2001.
Interest and dividend income decreased by US$188million, or 49 percent, to US$193 million in 2002 fromUS$381 million in 2001, among other things, due to the sale of trading securities following thecessation of proprietary trading in Treasury Centers and the reduction in market interest rates.
Interest and other finance expense decreased byUS$268 million, or 44 percent, to US$336 million in2002 from US$604 million in 2001, primarily the resultof a reduction in total borrowings and the recognition of
income of US$215 million related to the recognition ofthe fair value of an embedded derivative contained inthe convertible bonds that we issued in May 2002. Thisunrealized gain resulted from the application ofStatement of Financial Accounting Standards No.133(SFAS 133), Accounting for Derivative Instruments and Hedging Activities, which required us to mark tomarket the value of the equity conversion option in thebonds.The value of this option will fluctuate inversely to our share price and will be reflected in future annualearnings. See “Financial position” for a more detaileddiscussion of the application of SFAS 133 to ourbonds. These gains within interest and other financeexpense were partially offset by costs of US$99 millionassociated with our debt refinancing.
Provision for taxesProvision for taxes increased by US$20 million, or 32 percent, to US$83 million in 2002 from US$63 million in 2001. The increase in the provisionreflects primarily the increase in income from continuingoperations before taxes and minority interest. As apercentage of income from continuing operationsbefore taxes and minority interest, the effective tax ratewas 33.1 percent in 2002 compared to 95.5 percent in 2001. The higher effective rate in 2001 reflects theinclusion of the US$295 million provision for ourreinsurance business located in a low tax jurisdiction.The tax rate applicable for income from continuingoperations without the insurance provision would havebeen 29.2 percent in 2001. We generally conduct our tax planning activities to achieve a tax structure for ABB that provides for an effective tax rate ofapproximately 30 percent on our operations.
Income (loss) from continuing operationsIncome (loss) from continuing operations increased byUS$262 million to an income of US$97 million in 2002from a loss of US$165 million in 2001. The increasereflects the impact of the items discussed above.
Income (loss) from discontinued operations, net of taxLoss from discontinued operations, net of tax,increased by US$379 million to US$880 million in2002 from US$501 million in 2001. Taxes ondiscontinued operations increased by US$33 million toan expense of US$72 million in 2002 from an expenseof US$39 million in 2001. This net loss reflects losseson the following divestments, planned divestments and discontinuations.

ABB Group Financial review 2002 19
Discontinued operations 2002 2001 2000
Year ended December 31, ($ in millions)
Oil, Gas and Petrochemicals (121) 8 105Structured Finance (190) 8 (7)Metering (54) 14 19Combustion Engineering (420) (470) (70)Power Generation – – 638Other divested businesses (20) (7) (4)Abandoned businesses/Other (75) (54) (4)Income (loss) from discontinued operations, net of tax (880) (501) 677
A detailed discussion of the results of the significantdiscontinued businesses follows in the “Businessdivisions” section.
Net income (loss)As a result of the loss from discontinued operations,net of tax, discussed above, net loss increased byUS$54 million, or 7 percent, to US$783 million in 2002from US$729 million in 2001.
Earnings (loss) per shareBasic earnings (loss) per share was a loss per share ofUS$0.70 in 2002 compared to a loss per share ofUS$0.64 in 2001, largely resulting from the factorsmentioned above which negatively impacted netincome. Basic loss per share from discontinuedoperations was US$0.79 in 2002 compared to a lossper share of US$0.43 in 2001. Basic earnings (loss) per share from continuing operations was earnings pershare of US$0.09 in 2002 compared to a loss pershare of US$0.15 in 2001, primarily as a result of theimprovement in cost of sales and the cessation ofgoodwill amortization.
In the full year 2002 period, the potential commonshares from the convertible bonds were included in thecomputation of diluted earnings (loss) per share. Thediluted earnings (loss) per share was a loss per share ofUS$0.83 in 2002 compared to a loss per share ofUS$0.64 in 2001, largely resulting from the factorsmentioned above which negatively impacted netincome. Diluted loss per share from discontinuedoperations was US$0.75 in 2002 compared to dilutedloss per share from discontinued operations ofUS$0.43 in 2001, reflecting the increase in the lossfrom discontinued operations discussed above. Diluted earnings (loss) per share from continuingoperations improved to a loss of US$0.08 per share in2002 from a loss per share of US$0.15 in 2001,primarily a result of the improvement in cost of salesand the cessation of goodwill amortization.
Year ended December 31, 2001 compared with year ended December 31, 2000
OrdersOrders for the ABB Group (excluding discontinuedoperations) decreased US$1,236 million, or 6 percent,to US$19,672 million in 2001 from US$20,908 millionin 2000. As reported in local currencies, ordersdeclined by 1 percent in 2001 compared to 2000. Thelevel of orders in 2001 compared to 2000 increased in the Power Technologies division and Utilities divisionwith decreases in the other divisions.
RevenuesRevenues for the ABB Group increased by US$27 million to US$19,382 million in 2001 fromUS$19,355 million in 2000. As reported in localcurrencies, revenues increased 5 percent in 2001compared to 2000. This reflects the significant effect oftranslating revenues generated in local currencies intothe U.S. dollar, which strengthened against most of ourlocal currencies.
Utilities division revenues increased by US$174 million, or 3 percent, in 2001 compared to 2000 (a 7 percentincrease as reported in local currencies). Revenuesincreased in all business areas except Utility Services.
Industries division revenues decreased by US$448 million, or 8 percent, in 2001 compared to2000 (a 4 percent decrease as reported in localcurrencies). The reduction in the Automotive andManufacturing business area as a result of the globaleconomic slowdown in the automotive industry waspartly offset by an increase in the Marine andTurbocharging and Petroleum, Chemical and LifeSciences business areas.
Power Technology Products division revenues increasedby US$374 million, or 10 percent, in 2001 comparedto 2000 (a 16 percent increase as reported in local currencies). Revenues increased in most of thebusiness areas, with our High-Voltage Productsbusiness area being the main contributor to therevenue increase.
Automation Technology Products division revenuesincreased by US$85 million, or 2 percent, in 2001compared to 2000 (a 7 percent increase as reported inlocal currencies). Revenue growth was strongest in ourDrives and Power Electronics business area, offset inpart by a decline in our Robotics business area.

20 ABB Group Financial review 2002
Non-Core Activities revenues increased by US$308 million, or 6 percent, in 2001 compared to2000 (a 12 percent increase as reported in localcurrencies). This increase primarily reflected improvedrevenues from our Insurance business area.
A more detailed discussion of the individual divisionsfollows in the “Business divisions” section.
Cost of salesCost of sales for the ABB Group increased by US$679 million, or 5 percent, to US$14,877 million in2001 from US$14,198 million in 2000. As a percentageof revenues, cost of sales increased from 73 percent in 2000 to 77 percent in 2001. The increase in the cost of sales as a percentage of revenues was primarilyattributable to Non-Core Activities, in particular aUS$295 million non-cash charge from a change inaccounting estimate for reinsurance reserves withinbusiness area Insurance. Prior to 2001, we presented a portion of our insurance reserves on a discountedbasis, which estimated the present value of fundsrequired to pay losses at future dates. During 2001, thetiming and amount of claims payments being ceded to us in respect of prior years’ finite risk reinsurancecontracts changed and could no longer be reliablydetermined at December 31, 2001.Therefore, we havenot discounted our loss reserves, resulting in a chargeto losses and loss adjustment expenses in 2001 ofUS$295 million. In addition, our Insurance businessarea also recorded provisions for US$138 million inunderwriting losses, including US$48 million inprovisions for expected claims arising from the eventsof September 11, 2001. Additionally, there were costsand provisions for alternative energy projects of US$55 million in the New Ventures business area.Order-related development expenditures amounted toUS$405 million and US$555 million, in 2001 and2000, respectively.
Selling, general and administrative expensesSelling, general and administrative expenses decreasedby US$62 million, or 2 percent, to US$3,993 million in 2001 from US$4,055 million in 2000. The decreasereflects group-wide cost reduction and efficiencyimprovement initiatives. As a percentage of revenues,selling, general and administrative expenses remainedflat at 21 percent. Non-order related research and development costs are mostly included in selling,general and administrative expenses, and wereUS$593 million in 2001 and US$660 million in 2000.
Amortization expenseAmortization expense increased by US$5 million, or 3 percent, to US$195 million in 2001 from US$190 million in 2000, attributable to slightly higheramortization of purchased goodwill and intangibles, inparticular from the acquisition of Entrelec Group inJune 2001. In accordance with SFAS 142 goodwill isno longer amortized as of January 1, 2002.
Other income (expense), netOther income (expense), net, deteriorated by US$421 million, to an expense of US$160 million in2001 from an income of US$261 million in 2000. The change was primarily related to the benefit in 2000of US$434 million from capital gains, which was not repeated, as against US$56 million in 2001. Thesignificant capital gains in 2000 primarily resulted from the sale of non-core property and businesses.Restructuring expenses increased by US$28 million to US$220 million in 2001 from US$192 million in2000. Also included were asset write-downs of bothtangible and intangible assets (US$91 million in 2001,US$17 million in 2000), and income from equityaccounted companies, license income and other ofUS$95 million in 2001 and US$36 million in 2000 (the income from equity accounted companies wasaffected by the restatement of an equity investment as referred to in Note 13 to the Consolidated Financial Statements).
Earnings before interest and taxesEarnings before interest and taxes, or operating income,decreased US$1,016 million, or 87 percent, to US$157 million in 2001 from US$1,173 million in 2000.As reported in local currencies, earnings before interestand taxes declined by 83 percent in 2001 compared to2000. The decrease is primarily attributable to thehigher cost of sales in 2001, and the significantly lowercapital gains recorded in 2001 compared to 2000.When adjusted for capital gains of US$56 million in2001 and US$434 million in 2000, operating incomedecreased by 86 percent in 2001 compared to 2000.As a percentage of revenues, reported operatingincome decreased from 6 percent in 2000 to 1 percentin 2001.

ABB Group Financial review 2002 21
Net interest and other finance expenseNet interest and other finance expense consists ofinterest and dividend income, and interest and otherfinance expense. Net interest and other financeexpense increased by US$156 million to an expense of US$223 million in 2001 from an expense of US$67 million in 2000. Interest and dividend incomedecreased by US$6 million, or 2 percent, to US$381 million in 2001 from US$387 million in 2000due to a nominal reduction in interest earningmarketable securities. Interest and other financeexpense increased by US$150 million, or 33 percent,to US$604 million in 2001 from US$454 million in2000. This increase was primarily affected by a highernet debt position, which arose to fund our sharerepurchases in 2001, as well as costs associated withthe listing of our shares in the United States and coststo hedge our management incentive plan. See Note 21to the Consolidated Financial Statements. Interestexpense reflects fluctuations, which may be substantial,in the level of borrowings throughout the year asrequired by the operating needs of our business.
Provision for taxesProvision for taxes decreased by US$237 million, or 79 percent, to US$63 million in 2001 from US$300 million in 2000. The decrease in the provisionreflects primarily the reduction in income fromcontinuing operations before taxes and minorityinterests, which declined from an income of US$1,106 million in 2000 to a loss of US$66 million in2001. As a percentage of income from continuingoperations before taxes and minority interest, thedevelopment to a tax rate of (95.5) percent in 2001compared to 27.1 percent in 2000. The higher effective rate reflects the inclusion of the provision forour reinsurance business located in a low taxjurisdiction. The tax rate applicable for income fromcontinuing operations without the insurance provisionwould have been 29.2 percent. We generally conductour tax planning activities to achieve a tax structure for ABB that provides for an effective tax rate ofapproximately 30 percent on our operations. Forfurther information see Note 18 to the ConsolidatedFinancial Statements.
Income (loss) from continuing operationsIncome (loss) from continuing operations decreased byUS$931 million to a loss of US$165 million in 2001 froman income of US$766 million in 2000. The decreasereflects the impact of the items discussed above.
Income (loss) from discontinued operations, net of taxLoss from discontinued operations, net of tax, wasUS$501 million in 2001, compared to an income, net of tax, of US$677 million in 2000. Taxes ondiscontinued operations decreased by US$89 millionto an expense of US$39 million in 2001 from anexpense of US$128 million in 2000. The net loss fromdiscontinued operations reflects the significantreduction in gains from the sale of discontinuedoperations and an additional provision taken for theasbestos liabilities relating to our discontinued PowerGeneration segment. In 2000, we recorded gains of US$730 million on the sale of our interest in the ABB ALSTOM POWER joint venture and our Nucleartechnology business, which were not repeated in 2001. During 2001, we experienced a substantialincrease in the level of new asbestos claims as well asan increase in settlement costs per claim. In light ofthis, we recorded a charge of US$470 million. See“Contingencies and retained liabilities.”
Net income (loss)As a result of the factors discussed above, net incomedecreased to a loss of US$729 million in 2001 from anincome of US$1,443 million in 2000. The net loss in2001 primarily reflects the significantly lower level ofgains from sales of businesses, including discontinuedbusiness, and higher cost of sales, which includes the non-cash charge related to our reinsurancebusiness. We also recorded a one-time after taxcharge of US$63 million, due to the cumulative effectof the change in accounting principles upon adoptionof the Statement of Financial Accounting StandardsNo.133, Accounting for Derivative Instruments andHedging Activities.
Earnings (loss) per shareBasic and diluted earnings (loss) per share was a lossper share of US$0.64 in 2001 compared to an incomeper share of US$1.22 in 2000, largely resulting from the factors mentioned above which negativelyimpacted net income. Basic and diluted loss per sharefrom discontinued operations were US$0.43 in 2001compared to earnings per share of US$0.57 in 2000,reflecting the loss from discontinued operationsdiscussed above as opposed to a gain in 2000. Basicand diluted earnings (loss) per share from continuingoperations decreased to a loss of US$0.15 in 2001from earnings of US$0.65 per share in 2000, primarilyas a result of the decreases in the gross margin andcapital gains and a higher interest expense in 2001.

22 ABB Group Financial review 2002
Business divisions
OverviewIn April 2002, we merged our Process Industries division and our Manufacturing and Consumer Industries division to form a new Industries division. Segment data are presented below to reflect this change and prior period data havebeen restated accordingly.
In order to streamline our structure and improve operational performance, we have, as of January 1, 2003, put in place two divisions: Power Technologies, which combines the Power Technology Products and Utilities divisions;and Automation Technologies, which combines the Automation Technology Products and Industries divisions. The discussion of our results of operations by business division set forth below is based on our reporting structure infiscal year 2002 and does not reflect this new division reporting.
Revenues, earnings before interest and taxes (or operating income) and operating margins from continuing operations by division for the fiscal years 2002, 2001 and 2000 and net operating assets as of December 31, 2002,2001 and 2000 are as follows (see Note 25 to the Consolidated Financial Statements):
Revenues Net operating assetsYear ended December 31, December 31,
2002 2001 2000 2002 2001 2000
(US$ in millions) (US$ in millions)
Utilities 4,826 5,634 5,460 992 790 755Industries 4,412 4,995 5,443 1,129 924 829Power Technology Products 4,355 3,961 3,587 1,389 1,283 1,302Automation Technology Products 5,035 4,756 4,671 2,278 2,287 2,436Non-Core Activities
Insurance 657 956 805 1,397 1,093 912Equity Ventures 21 35 41 1,096 1,160 556Structured Finance 92 133 126 1,346 1,789 1,309Building Systems 2,372 2,568 2,506 68 (23) 57New Ventures 132 113 108 308 262 60Other Non-Core Activities 912 1,325 1,236 (456) (795) 583
Non-Core Activities subtotal 4,186 5,130 4,822 3,759 3,486 3,477Corporate/Other 527 612 780 9,344 7,320 5,335Consolidation effect and eliminations (5,046) (5,706) (5,408) (7,633) (5,346) (2,567)Consolidated figures 18,295 19,382 19,355 11,258 10,744 11,567
Earnings before interest and taxes Operating marginsYear ended December 31, Year ended December 31,
2002 2001 2000 2002 2001 2000
(US$ in millions) (in %)
Utilities 75 158 251 1.6 2.8 4.6Industries 145 151 197 3.3 3.0 3.6Power Technology Products 353 234 244 8.1 5.9 6.8Automation Technology Products 373 364 445 7.4 7.7 9.5Non-Core Activities
Insurance 40 (342) 98 n/a n/a n/aEquity Ventures 38 76 70 n/a n/a n/aStructured Finance 116 27 47 n/a n/a n/aBuilding Systems (114) 20 57 n/a n/a n/aNew Ventures (68) (167) (12) n/a n/a n/aOther Non-Core Activities (171) (66) (43) n/a n/a n/a
Non-Core Activities subtotal (159) (452) 217 (3.8) (8.8) 4.5Corporate/Other (317) (165) (135) n/a n/a n/aConsolidation effect and eliminations (76) (133) (46) n/a n/a n/aConsolidated operating income/margins 394 157 1,173 2.2 0.8 6.1

ABB Group Financial review 2002 23
Division costsCost of sales and selling, general and administrativeexpenses comprise the most significant part ofoperating expenses for all divisions. Cost of salesincludes costs related to the sale of products andservices, which comprise, among other things, the cost of raw materials, components, order-relatedresearch and development and procurement costs.Selling, general and administrative expenses includethe overhead related to the sales force and all costsrelated to general management, human resources,financial control, corporate finance and non-orderrelated research and development.
Selling, general and administrative expenses as apercentage of revenues are typically higher in theAutomation Technology Products division compared toour other industrial divisions, due to relatively highervolumes attributable to smaller units of sales.
Further details of the divisional performances follow.
UtilitiesIn the utilities sector, our main customers are powerutilities whom we serve with power transmission anddistribution products, systems and services.We alsoserve gas and water utilities. Demand in the powerutilities markets has been driven in recent yearsprimarily by deregulation and privatization, which resultin a more competitive environment for our customers.In particular, utilities continue to look for ways tooptimize existing assets.This trend is well advanced –but ongoing – in the United States, Western Europeand parts of Latin America. It is spreading into otherparts of Europe and many emerging markets.
In North America, utilities continue to reduce theinvestment in new power generation capacity and, as aresult, also in power transmission systems.This trendhas been partially offset by grid interconnections andupgrading projects to improve existing systems.Demand in Latin America has been impacted by thepolitical and economic uncertainties. As a result, anumber of projects were delayed into 2003. Europeanutilities invested cautiously in 2002 as they waited forthe regulatory environment to stabilize. Development inMiddle East, Africa and Asia was positive.
Year ended December 31, 2002 compared with year ended December 31, 2001Orders decreased by US$1,978 million, or 31 percent,to US$4,458 million in 2002 from US$6,436 million in2001. Currency fluctuations did not impact the ordercomparison. Excluding the pull-through effect, ordersdecreased by 26 percent.This decrease was primarily
related to the Power Systems business area, whichexperienced significant reduction in large orderscompared to 2001, when we took two large ordersfrom China and Brazil with a combined value of more than US$500 million. In addition, a selectivebidding approach aimed at reducing project risks and securing better margins, reduced the number ofbids and consequently, the order intake.
Revenues decreased by US$808 million, or 14 percent,to US$4,826 million in 2002 from US$5,634 million in 2001. As reported in local currencies, revenuesdecreased 15 percent. Excluding the impact of pull-through sales, which fell in 2002 compared to 2001,revenues remained flat. Revenues were sustained bythe high order backlog at the end of 2001.
Earnings before interest and taxes, or operatingincome, decreased by US$83 million, or 53 percent, toUS$75 million in 2002 from US$158 million in 2001.As reported in local currencies, earnings before interestand taxes decreased 49 percent. Excluding the capitalgains of US$11 million (US$15 million in 2001), theimpact of pull-through sales, the restructuring chargesand related asset write-downs of US$31 million(US$24 million in 2001) and the goodwill amortizationexpense of US$24 million in 2001, earnings beforeinterest and taxes decreased by 37 percent. Operatingincome in the Power Systems business areadecreased mainly due to the execution of low-marginprojects taken before 2001.This decrease was partly offset by higher earnings in business area UtilityAutomation which benefited from an improved cost base.
Year ended December 31, 2001 compared with year ended December 31, 2000Orders increased by US$201 million, or 3 percent, toUS$6,436 million in 2001 from US$6,235 million in2000. As reported in local currencies, orders increased7 percent in 2001 compared to 2000. This orderimprovement included a US$360 million order in Chinafor the Power Systems business area, announced inthe fourth quarter of 2001. This order related to aproject involving the construction of a HVDC powertransmission system linking hydropower plants incentral China to the Guangdong province. In addition,large orders in the Power Systems business areaduring 2001 included a US$182 million project orderfrom Brazil. In 2001, large orders representedapproximately 17 percent of the division’s total orders.

24 ABB Group Financial review 2002
Revenues increased by US$174 million, or 3 percent,to US$5,634 million in 2001 from US$5,460 million in 2000. As reported in local currencies, revenuesincreased 7 percent in 2001 compared to 2000. Allbusiness areas reported higher revenues in 2001compared to 2000 due to strong order intake in 2000,with the exception of the Utility Services business area,where the 2000 results included higher revenues from the invoicing of the large Commonwealth Edisonpower transmission and distribution system upgradeproject in Chicago.
Earnings before interest and taxes, or operatingincome, decreased by US$93 million, or 37 percent, to US$158 million in 2001 from US$251 million in 2000.There was no significant effect from translating localcurrency earnings into U.S. dollars. Operating incomeincluded capital gains of US$15 million in 2001(US$54 million in 2000). When adjusted for capitalgains, earnings before interest and taxes decreased by27 percent.The reduction primarily related to thePower Systems business area, where competition-driven price deterioration reduced margins, and fixedcosts related to projects that were deferred negativelyimpacted profitability.
IndustriesCustomers of our Industries division span a broadrange of sectors and regions. Consequently, demand is influenced by many factors and can vary significantlyamong customer groups within a given time period.Demand influences are similar to those seen in theAutomation Technology Products markets, althoughIndustries’ offering goes beyond products to systemsand services.
In 2002, the consolidation trend in the paper industrycontinued, resulting in flat demand. Petrochemical and chemical markets were weak (except in India andChina) due to high oil prices. However, demand for oil and gas production projects continued. Demand inthe metals and mining industry was stable. Overall, theautomotive market was down in 2002 driven largely byreduced spending by original equipment manufacturers.
Year ended December 31, 2002 compared with year ended December 31, 2001Orders decreased by US$251 million or 5 percent, toUS$4,614 million from US$4,865 million in 2001. As reported in local currencies, orders decreased 7 percent in 2002. Excluding the pull-through effect,orders increased 9 percent. Strong demand in Indiaand China led to the increased order intake in thebusiness areas Petroleum, Chemical and Life Sciencesas well as Paper, Printing, Metals and Minerals, which partially offset decreased orders in Marine and Turbocharging business area.
Revenues decreased by US$583 million or 12 percent,to US$4,412 million from US$4,995 million in 2001. As reported in local currencies, revenues decreased 14 percent in 2002. Excluding the pull-through effect,revenues remained flat. Revenues mainly increased in the Petroleum, Chemical and Life Sciences businessarea due to strong order backlog at the end of 2001and improved market conditions in the Middle East,Africa and Asia.This increase was offset by a reductionin revenues in the Automotive and Manufacturingbusiness area.
Earnings before interest and taxes, or operatingincome, decreased by US$6 million or 4 percent, toUS$145 million from US$151 million in 2001. Asreported in local currencies, earnings before interestand taxes decreased 6 percent in 2002 compared to2001. Excluding the pull-through effect, restructuringcharges and related asset write-downs of US$59 million (US$38 million in 2001) and goodwill amortization expense of US$41 million in2001, earnings before interest and taxes decreased by 6 percent. All business areas contributed to thisreduction with the exception of the Marine andTurbocharging business area, which maintained itsearnings at 2001 levels. Earnings in 2002 were alsoaffected by a non-recurring charge of US$20 million.
Year ended December 31, 2001 compared with year ended December 31, 2000Orders decreased by US$879 million, or 15 percent, to US$4,865 million in 2001 from US$5,744 million in2000. As reported in local currencies, ordersdecreased 12 percent. Orders increased significantly inthe Petroleum, Chemical and Life Sciences businessarea offsetting decreases in Paper, Printing, Metals andMinerals and Marine and Turbocharging businessareas. Orders decreased significantly in our Automotiveand Manufacturing business area, particularly in theUnited States, Germany and Sweden. Additionally,large order intake decreased, as well as orders forstandard products, particularly robots supplied by theAutomation Technology Products division.

ABB Group Financial review 2002 25
Revenues decreased by US$448 million, or 8 percent,to US$4,995 million in 2001 from US$5,443 million in 2000. As reported in local currencies, revenuesdecreased 4 percent in 2001 compared to 2000. Thedecrease in revenues mainly arose from the impact ofthe global economic slowdown in our Automotive andManufacturing business area. This was partly offset by increases in our Marine and Turbocharging businessarea because of the high order backlog from 2000 and in Petroleum, Chemical and Life Sciences businessarea due to improved market conditions.
Earnings before interest and taxes, or operating income, decreased by US$46 million, or 23 percent, toUS$151 million in 2001 from US$197 million in 2000.As reported in local currencies, earnings before interestand taxes declined 22 percent in 2001 compared to2000. Automotive and Manufacturing business area inGermany was impacted by a number of project lossesand initiated restructuring to improve the efficiency ofproject execution. In the United States, repositioning of selected activities within the Telecom and ProductManufacturing Industries business area led to loweroperating margins. These were partly offset byimprovements in cost controls and project managementin the Petroleum, Chemical and Life Sciences business area, as well as revenue growth in the Marineand Turbocharging business area.
Power Technology ProductsThe market for Power Technology Products comprisesmainly power utilities around the world, in particular,their power transmission and distribution activities, andsome industrial customers. Ongoing deregulation andprivatization in these markets are driving demand byincreasing competition in the market.This has led toindustry consolidation and pressures on the utilities tomake existing plants more competitive by modernizingequipment and outsourcing activities such as serviceand maintenance.The trend is advanced butcontinuing in the United States, Western Europe, andparts of Latin America. It is beginning to take hold in most other markets as well.
Industrial demand weakened towards the end of 2002.Additionally utility orders were dropping in the secondhalf of the year mainly due to a lower demand in NorthAmerica.The political and economic climate in LatinAmerica resulted in a drop of market volumes causedby a delay of order placement rather than a structuraldemand weakness.The Asia and the Middle East andAfrican markets, particularly China, continued showingstrong demand in all business areas. Markets in Europewere mixed.
Year ended December 31, 2002 compared with year ended December 31, 2001Orders increased by US$166 million, or 4 percent, toUS$4,387 million in 2002 from US$4,221 million in2001. As reported in local currencies, orders increased3 percent in 2002. Orders remained flat in all businessareas except the Medium-Voltage Technology businessarea, which increased orders, primarily from improvingdemand in Asia.
Revenues increased by US$394 million, or 10 percent,to US$4,355 million in 2002 from US$3,961 million in2001. As reported in local currencies, revenuesincreased 9 percent in 2002. The business area High-Voltage Technology and Power Transformers increasedrevenues significantly while business area Medium-Voltage Technology showed a modest increase andDistribution Transformers business area revenues wereflat. A higher order backlog at the end of 2001 andstrong demand in Asia Pacific markets during 2002contributed to this development.
Earnings before interest and taxes, or operating income,increased by US$119 million, or 51 percent, to US$353 million in 2002 from US$234 million in 2001.As reported in local currencies, earnings before interestand taxes increased by 50 percent in 2002. Whenadjusted for restructuring charges and related assetwrite-downs of US$29 million (US$52 million in 2001)and goodwill amortization expense of US$6 million in 2001, earnings before interest and taxes showed anincrease of 31 percent in 2002 compared to 2001. This improvement was driven by a 9 percent workforce reduction, a 30 percent reduction inoverlapping product lines and a 17 percent reduction in production lines.

26 ABB Group Financial review 2002
Year ended December 31, 2001 compared with year ended December 31, 2000Orders increased by US$150 million, or 4 percent, toUS$4,221 million in 2001 from US$4,071 million in2000. As reported in local currencies, orders increased9 percent in 2001 compared to 2000. Our PowerTransformers business area recorded strong ordergrowth mainly due to a large order booked for theChinese power link project. Our High-VoltageTechnology business area increased orderssubstantially in the United States, Brazil, China andRussia. Orders in our Distribution Transformers and Medium-Voltage Technology business areasshowed more modest growth as a result of theeconomic slowdown in North America, which affectedthe building and infrastructure markets.
Revenues increased by US$374 million, or 10 percent,to US$3,961 million in 2001 from US$3,587 million in 2000. As reported in local currencies, revenuesincreased 16 percent in 2001 compared to 2000. OurHigh-Voltage Technology business area showed asubstantial revenue increase, generated in theAmericas and Europe through increased volumes in high-voltage breakers and systems activities. Other distribution and transmission products recorded high single-digit or low double-digit growth in local currencies.
Earnings before interest and taxes, or operatingincome, decreased by US$10 million, or 4 percent, toUS$234 million in 2001 from US$244 million in 2000.As reported in local currencies, earnings before interest and taxes remained unchanged in 2001compared to 2000. Excluding the effect of increasedrestructuring charges of US$52 million in 2001 (US$38 million in 2000), earnings before interest andtaxes improved slightly as a result of revenue growthand operational improvements. However these gains were offset in part by lower product prices andthe postponement of certain orders.
Automation Technology ProductsWe serve a wide variety of industrial sectors andcountries with our automation products, and thusdemand can vary significantly by region and industry,and is subject to changes in the business cycle. While the overall global market demand for processautomation products and systems stabilized at areduced level in most markets in 2002 compared to2001, there were areas of increased demand as well asthose with continued weakness. Demand in Asia was strong, with good growth maintained particularly inChina, where economic growth continued at a goodpace. Market demand in the Americas remained weak
with reduced investments especially from theautomotive and pulp and paper sectors. Markets inEurope were mixed, with good demand in Finland,France, Spain, and Sweden but continued weakness inGermany and some other countries. Demand remainedstrong in the Middle East and Africa.
Year ended December 31, 2002 compared with year ended December 31, 2001Orders increased by US$405 million or 9 percent, to US$5,074 million from US$4,669 million in 2001. Asreported in local currencies, orders increased 5 percentin 2002 compared to 2001. Higher demand for robotics products in several industries led to higherorders in the Robotics business area. Overall, demandfrom industrial customers in the strong Chinese marketfueled a significant order increase for both the Low-Voltage Products and Drives and Power Electronicsbusiness areas.
Revenues increased by US$279 million or 6 percent,to US$5,035 million from US$4,756 million in 2001. As reported in local currencies, revenues increased 3 percent in 2002 compared to 2001. Increaseddemand in the Robotics and Low Voltage Productsbusiness areas lifted revenues. Revenues were lower in Control and Force Measurement and Electrical Machines business areas, mainly due toweaker demand.
Earnings before interest and taxes, or operatingincome, increased by US$9 million or 2 percent, to US$373 million in 2002 from US$364 million in 2001.As reported in local currencies, earnings before interestand taxes decreased 1 percent in 2002 compared to 2001. Improved volumes resulted in a significantincrease in earnings before interest and taxes in theRobotics business area and a moderate increase in the Low-Voltage Products business area. The ElectricalMachines business area increased earnings beforeinterest and taxes due to cost improvements fromstreamlining a number of production facilities.Thesepositive developments were partly offset by a reductionin earnings in the Control and Force Measurementbusiness area due to continued low demand in theprocess automation market, particularly in the UnitedStates. When adjusted for the restructuring chargesand related asset write-downs of US$80 million in 2002 (US$43 million in 2001) and goodwillamortization expense of US$54 million in 2001,earnings decreased by 2 percent.

ABB Group Financial review 2002 27
Africa. We anticipate an increase in demand in theautomotive, general industry and chemicals and lifesciences sectors. Demand is expected to decrease inthe marine, minerals and paper industries.
For the Power Technologies division, we expect themixed economic environment to continue in theEuropean markets, with further growth in EasternEurope. Demand in the U.S. market is expected tostabilize while Latin America is expected to improve,driven by large infrastructure projects. In the Asianmarkets, we expect continued growth in China andIndia. On a global basis, we expect the market toremain relatively flat in 2003. We expect the cautiousinvestment pattern in the utility industry to continue and mixed levels of demand in the other industries we serve.
Non-Core ActivitiesAt the end of 2002, we decided to group a number of business activities together that were not directlylinked to the core divisions.The results of theseactivities are reported separately under the heading ofNon-Core Activities.These comprise primarily the Equity Ventures business area, the remaining parts ofthe Structured Finance business area not sold to GE Commercial Finance, the Building Systemsbusiness area, and a number of other activities,including the semiconductor business, CustomerService, Air Handling and Logistic Systems, GroupProcesses and the New Ventures business areas.The Insurance business area was also included in thisgroup although we intend to continue this as aseparate business.
The Financial Services division was dissolved in 2002following the divestment of the majority of theStructured Finance business area, the cessation ofnew reinsurance activity in Scandinavian ReinsuranceCompany Limited, Bermuda (part of which is in theInsurance business area), and the cessation ofproprietary trading in June 2002 in the former TreasuryCenters business area (which was subsequentlymoved to Corporate as Treasury Services). We intendto divest Equity Ventures business area and the remaining Structured Finance businesses.
Year ended December 31, 2001 compared with year ended December 31, 2000Orders decreased by US$218 million, or 4 percent, to US$4,669 million in 2001 from US$4,887 million in2000. As reported in local currencies, orders were flat in 2001 compared to 2000. Our Drives and PowerElectronics business area increased orders in 2001 andimproved market share, while our Robotics businessarea was negatively affected by the decline in theautomotive industry. Order levels in all other businessareas decreased as they were impacted by increasinglydifficult market conditions. Despite difficult conditions,our Instrumentation and Low-Voltage Productsbusiness areas maintained their market shares.
Revenues increased by US$85 million, or 2 percent, to US$4,756 million in 2001 from US$4,671 million in2000. As reported in local currencies, revenuesincreased by 7 percent in 2001 compared to 2000.Revenue growth was especially strong in our Drivesand Power Electronics business area. Supported bythe strong order backlog at the end of 2000, ourElectrical Machines and Low-Voltage Products businessareas increased revenues. Offsetting in part therevenue increase was a significant decline in ourRobotics and Control and Force Measurementbusiness areas due to the downturn in the automotiveindustry and ongoing consolidation in the pulp, paperand metals industries, respectively.
Earnings before interest and taxes, or operatingincome, decreased by US$81 million, or 18 percent, to US$364 million in 2001 from US$445 million in 2000.As reported in local currencies, earnings before interestand taxes decreased 14 percent in 2001 compared to2000. In our Robotics business area, reduced revenuesresulted in significantly reduced operating income.Operating income in our Low-Voltage Productsbusiness area declined in 2001 reflecting the divestitureof certain profitable, but non-core, businesses.Earnings before interest and taxes in our Drives andPower Electronics business area increased due toincreased volume development; however, thisdevelopment did not fully offset reduction in earnings in other business areas.
OutlookThe market outlook for both of our core divisions in2003 is influenced by uncertainties in the Middle Eastand the global economic situation.
For the Automation Technologies division, we expectflat demand in Europe (our primary market), a slightimprovement in the Americas, continued growth in Asiaand continued uncertainties in the Middle East and
28 ABB Group Financial review 2002
Of the remaining business areas: in April 2002 weannounced the planned divestment of the BuildingSystems business area. In October 2002 the GroupProcesses division, which was formed in 2001 toestablish common working processes and commoninfrastructure for our group, was dissolved with most ofthe activities terminated and the remainder transferredto the core divisions; our presence in some of themarkets of Logistic Systems and Customer Servicebusiness areas is being strategically reduced; and inOctober 2002 we announced a restructuring programin New Ventures business area to cease or transfer outa number of activities to other business areas. Our AirHandling business was sold in January 2002.
Year ended December 31, 2002 compared with year ended December 31, 2001Orders decreased by US$911 million, or 18 percent, to US$4,161 million in 2002 from US$5,072 million in2001. As reported in local currencies, orders decreased by 22 percent in 2002 compared to2001.The reduction in orders was primarily attributable to the cessation of new reinsurance activityin Scandinavian Reinsurance Company Limited,Bermuda (part of the Insurance business area),Building Systems business area resulting from marketdownturns across Europe, the sale of Air Handlingbusiness and the planned reduction of our presence insome of the markets of the Logistic Systems andCustomer Service business areas.
Revenues decreased by US$944 million, or 18 percent,to US$4,186 million in 2002 from US$5,130 million in 2001. As reported in local currencies, revenuesdeclined 22 percent in 2002 compared to 2001. Thedecrease in revenues is for the reasons outlined below.
Insurance revenues decreased by US$299 million, or 31 percent, to US$657 million in 2002 fromUS$956 million in 2001. The decrease in revenues was primarily due to the cessation of new re-insurance activity in Scandinavian ReinsuranceCompany Limited, Bermuda.
Equity Ventures revenues decreased by US$14 million,or 40 percent, to US$21 million in 2002 from US$35 million in 2001. Fee revenues and charge-outsdropped as development projects have been canceledleading to no further actual or potential future revenuesfrom such projects. This business has mainly equityaccounted investments, which do not result in therecognition of orders and revenues.
Remaining Structured Finance revenues decreased by US$41 million, or 31 percent, to US$92 million in 2002 from US$133 million in 2001. The decrease inrevenues was due to higher refinancing costs leading to no new significant business investmentsbeing made.
Building Systems revenues decreased by US$196 million, or 8 percent, to US$2,372 million in2002 from US$2,568 million in 2001. The decrease inrevenues was due to market downturns across Europe,particularly Germany.
New Ventures revenues increased by US$19 million, or 17 percent, to US$132 million in 2002 from US$113 million in 2001. The increase in revenues wasdue to the delivery of a significant renewable energyproject for which the order was received in 2001.
Of the remaining businesses, revenues decreased byUS$413 million, or 31 percent, to US$912 million in2002 from US$1,325 million in 2001. The decrease was due to the sale of Air Handling and the deliberate reduction of our presence in some of the markets of the Logistic Systems and Customer Servicebusiness areas.
Earnings before interest and taxes, or operatingincome, improved by US$293 million to a loss of US$159 million in 2002 from a loss of US$452 millionin 2001. The improvement was primarily attributable to the non-recurrence of a number of costs from 2001.The decrease in operating income is for the reasonsoutlined below.
Insurance operating income increased by US$382 million, to an income of US$40 million in 2002from a loss of US$342 million in 2001. The increasewas the result of the non-recurrence of a number ofcosts from 2001. Prior to 2001, we presented a portionof our insurance reserves on a discounted basis, whichestimated the present value of funds required to paylosses at future dates. During 2001, the timing andamount of claims payments being ceded to us inrespect of prior years’ finite risk reinsurance contractschanged and could not be reliably determined atDecember 31, 2001. Therefore, we did not discountour loss reserves resulting in a charge to losses andloss adjustment expenses in 2001 of US$295 million.In addition, the Insurance business area also recordedprovisions for US$138 million in underwriting losses,including provisions totaling US$48 million relating tothe events of September 11, 2001, leading tosubstantial additional negative insurance results. Thebenefit of the non-recurrence of these costs waspartially offset by lower revenues.

ABB Group Financial review 2002 29
Insurance revenues increased by US$151 million, or 19 percent, to US$956 million in 2001 from US$805 million in 2000. The increase was due tohigher insurance premiums resulting from an increase in demand for reinsurance and a reduction incapacity as a result of the September 11 events.
Equity Ventures revenues decreased by US$6 million,or 15 percent, to US$35 million in 2001 from US$41 million in 2000. This business has mainly equityaccounted investments, which do not result in therecognition of orders and revenues.
Remaining Structured Finance revenues increased by US$7 million, or 6 percent, to US$133 million in2001 from US$126 million in 2000.
Building Systems revenues increased by US$62 million, or 2 percent, to US$2,568 million in2001 from US$2,506 million in 2000.
New Ventures revenues increased by US$5 million, or 5 percent, to US$113 million in 2001 from US$108 million in 2000.
Of the remaining businesses revenues increased by US$89 million, or 7 percent, to US$1,325 million in2001 from US$1,236 million in 2001.
Earnings before interest and taxes, or operatingincome, decreased by US$669 million to a loss of US$452 million in 2001 from an income of US$217 million in 2000. The reasons for the decreasein operating income are outlined below.
Insurance operating income decreased by US$440 million, to a loss of $342 million in 2001 from an income of US$98 million in 2000. The reduction in operating income is principally the result of a US$295 million non-cash charge in 2001 relating toour reinsurance business. Prior to 2001, we presented a portion of our insurance reserves on a discountedbasis, which estimated the present value of fundsrequired to pay losses at future dates. During 2001, thetiming and amount of claims payments being ceded to us in respect of prior years’ finite risk reinsurancecontracts changed and could not be reliablydetermined at December 31, 2001. Therefore, we did not discount our loss reserves resulting in a chargeto losses and loss adjustment expenses in 2001 of US$295 million. In addition, the Insurance businessarea also recorded provisions for US$138 million inunderwriting losses, including provisions totaling US$48 million relating to the events of September 11,2001, leading to substantial additional negativeinsurance results. The benefit of the non-recurrence ofthese costs was partially offset by lower revenues.
Equity Ventures operating income decreased by US$38 million, or 50 percent, to US$38 million in 2002from US$76 million in 2001. The decrease was theresult of reduced returns from investments and theeffects of closing down development and office activities.
Remaining Structured Finance operating incomeincreased by US$89 million, or 330 percent, toUS$116 million in 2002 from US$27 million in 2001.This increase primarily came from our 35 percent stakein the Swedish Export Credit Corporation in Sweden.Amounts in 2001 from our investment in the SwedishExport Credit Corporation were restated as describedin Note 13 to the Consolidated Financial Statements.
Building Systems operating income decreased byUS$134 million to a loss of US$114 million in 2002from an income of US$20 million in 2001. Thedecrease is due to: project write-downs in Germany,Sweden, United Kingdom and Denmark; closure costsin Italy and Poland; and restructuring costs in Germany.
New Ventures operating income increased by US$99 million to a loss of US$68 million in 2002 froma loss of US$167 million in 2001. The improvement was due to the non-recurrence of costs and provisionsfor alternative energy projects of US$55 million andUS$44 million of asset write-downs in 2001.
Of the remaining businesses, operating incomedecreased by US$105 million to a loss of US$171 million in 2002 from a loss of US$66 million in 2001.The decrease was due to the reduction inrevenues mentioned above and higher costs withinGroup Processes.
Year ended December 31, 2001 compared with year ended December 31, 2000Orders decreased by US$77 million, or 1 percent, toUS$5,072 million in 2001 from US$5,149 million in2000. As reported in local currencies, orders increasedby 4 percent in 2001 compared to 2000. The reduction in orders was due to a 9 percent, orUS$237 million, decrease within Building Systems,partly offset by a 19 percent, or US$151 million,increase within Insurance.
Revenues increased by US$308 million, or 6 percent,to US$5,130 million in 2001 from US$4,822 million in 2000. As reported in local currencies, revenuesincreased 12 percent in 2001 compared to 2000.Theincrease in revenues is for the reasons outlined below.

30 ABB Group Financial review 2002
Equity Ventures operating income increased by US$6 million, or 9 percent, to US$76 million in 2001from US$70 million in 2000. The increase was the result of successful refinancing, improvedperformance and achievements of milestones ininfrastructure projects.
Remaining Structured Finance operating incomedecreased by US$20 million, or 43 percent, to US$27 million in 2001 from US$47 million in 2000. The decrease was primarily due to the reduced level ofincome from our 35 percent stake in Swedish ExportCredit Corporation in Sweden. Amounts in 2001 fromour investment in the Swedish Export CreditCorporation were restated as described in Note 13 to the Consolidated Financial Statements.
Building Systems operating income decreased by US$37 million, or 65 percent, to US$20 million in2001 from US$57 million in 2000. The decrease wasdue to project losses and higher costs related to over-capacity in the United Kingdom, Australia, Poland and Germany.
New Ventures operating income decreased byUS$155 million to a loss of US$167 million in 2001from a loss of US$12 million in 2000. The decreasewas due to costs and provisions incurred in 2001 for alternative energy projects of US$55 million andUS$44 million for asset write-downs.
Of the remaining businesses, operating incomedecreased by US$23 million to a loss of US$66 millionin 2001 from a loss of US$43 million in 2000.
Corporate and eliminationCorporate consists of Treasury Services, CorporateResearch and Development, Group Real Estate, and Headquarters/Stewardship costs. Following thecessation of proprietary trading, in 2002 in the formerTreasury Centers business area, all of the remainingfunctions were transferred to Corporate as Treasury Services.
The elimination of inter-division transactions, such as pull-through sales and intra-company interest, areincluded in the elimination line.
Year ended December 31, 2002 compared with year ended December 31, 2001Total operating cost from corporate and eliminationincreased by US$95 million, to US$393 million in 2002 from US$298 million in 2001. Headquarters/Stewardship operating costs decreased by US$47 million to US$156 million in 2002 from US$203 million in 2001, mainly due to one-time events
(including the recovery of payments from two formerchief executive officers). Corporate Research andDevelopment costs decreased by US$10 million toUS$93 million in 2002 from US$103 million in 2001 asa result of the reorganization in our global research and development centers and the related headcountreductions. Other (including Treasury Services, RealEstate and intra-company eliminations) operating costsincreased by US$152 million to US$144 million in2002 from a income of US$8 million in 2001, mainlydue to a reduction in rental income as a result of assetsales, increased lease obligations in Real Estate, thereduced trading result of Treasury Services followingthe cessation of proprietary trading and a higherelimination of intra-group profit in ending inventorycompared to 2001.
Year ended December 31, 2001 compared with year ended December 31, 2000Total operating cost from corporate and eliminationincreased by US$117 million to US$298 million in 2001 from US$181 million in 2000. Headquarters/Stewardship operating costs decreased by US$47 million to US$203 million in 2001 from US$250 million in 2000. Corporate Research andDevelopment expenses increased by US$7 million to US$103 million in 2001 from US$96 million in 2000due to higher non-order related research activitiesduring 2001, mainly in the area of Industrial IT. Other(including Treasury Services, Real Estate and intra-company eliminations) operating income decreased byUS$157 million to US$8 million in 2001 from anincome of US$165 million in 2000 (an increase inoperating costs of US$157 million), mainly due to areduction in rental income as a result of asset salesand increased lease obligations within Real Estate.
Discontinued operationsOur Oil, Gas and Petrochemicals division, significantcomponents of our Structured Finance activities sold toGE Commercial Finance, our Metering business and a number of other businesses have been included indiscontinued operations in accordance with SFAS 144.For further information on discontinued operations, seeNote 3 to the Consolidated Financial Statements.
An operational overview of the significant componentsof discontinued operations follows.

ABB Group Financial review 2002 31
contracts that allow a more balanced sharing of risks and opportunities during execution between customer and contractor. The increase in thedownstream business offset a general reduction in the upstream business.
Revenues increased by US$380 million, or 11 percent,to US$3,869 million in 2002 from US$3,489 million in 2001. As reported in local currencies, revenuesincreased 7 percent in 2002.The improvements camefrom increases in the upstream and downstreambusinesses, reflecting a high order backlog going into2002 and a relatively high level of order intake in 2002.Revenues include US$15 million in 2002 sold to ourother divisions compared to US$11 million in 2001.
Earnings before interest and taxes, or operatingincome, decreased by US$96 million to a loss ofUS$17 million in 2002 from an income of US$79 million in 2001 (these values differ from anincome of the loss on discontinued operations byamounts for interest expense, taxes, minority interestand other items). Currency fluctuations did not affectthe comparison between 2002 and 2001.The impact in earnings from the increased revenues was more than offset by cost overruns and project delays, whichresulted in a charge of US$224 million in 2002,primarily in four large downstream fixed price projects,booked several years ago.
Year ended December 31, 2001 compared with year ended December 31, 2000Orders decreased by US$520 million, or 13 percent, toUS$3,403 million in 2001 from US$3,923 million in2000. As reported in local currencies, orders decreased12 percent in 2001 compared to 2000. Orders include US$15 million in 2001 received from our otherdivisions compared to US$9 million in 2000. In 2001,approximately half of the total order volume in thedivision comprised large orders. From the particularlyhigh level of large orders in 2000, the upstreambusiness continued to grow, but was offset byreductions in the downstream business. Weexperienced high tendering activity in the division in 2001.
Oil, Gas and PetrochemicalsCapital expenditures by customers of the Oil, Gas andPetrochemicals division are influenced by oil companyexpectations about the oil price, which is determinedby supply and demand for crude oil and natural gas products, the energy price environment that results from supply and demand imbalances andconsolidation of the oil and gas markets. Key factorsthat may influence the worldwide oil and gas marketinclude production restraint of OPEC nations and otheroil-producing countries, global economic growth,technological progress in oil exploration and productionand the maturity of the resource base. The downstreammarkets are in the short term influenced by capacityutilization and in the longer term by factors such as economic growth, substitution of products anddemand for more environmentally friendly products.
OPEC oil price management combined with reducedoil production in Latin America and speculativepurchases due to issues in the Middle East led the oilprice towards the high end of the OPEC target band of US$22 to US$28 per barrel during 2002. Theseincreased prices were not driven by increasedconsumption, as underlying growth in demand is weakdue to the current global environment with theexception of Northwest Europe. Investments inexploration and production in the upstream market(from the well or bore hole to the refinery), increased inall regions, particularly West Africa and Russia. Theupstream modification and maintenance market isgrowing as a result of larger installed capacity andmore mature fields with changed field characteristics.Most downstream markets remained at a reduced levelin 2002, with the exception of investment in refineriesdriven by clean fuel regulations, particularly in Russia.We expect upstream markets in 2003 to increaseslightly, with downstream activity remaining at a lowlevel throughout 2003.
Year ended December 31, 2002 compared with year ended December 31, 2001Orders increased by US$222 million, or 7 percent, toUS$3,625 million in 2002 from US$3,403 million in2001. As reported in local currencies, orders increased3 percent in 2002. Orders include US$23 million in2002 received from our other divisions compared toUS$15 million in 2001.The increase in large orders of22 percent, mostly driven by the award of theExxonMobil Sakhalin order within downstream, offset ageneral reduction resulting from a shift in the marketfrom fixed price contracts to lower risk reimbursable

32 ABB Group Financial review 2002
Revenues increased by US$693 million, or 25 percent,to US$3,489 million in 2001 from US$2,796 million for 2000. As reported in local currencies, revenuesincreased 28 percent in 2001 compared to 2000. Thisgrowth was primarily generated by the large orderintake in 2000 and also by a full year of revenues fromUmoe, the oil and gas company acquired in thesecond half of 2000. Revenues include US$11 millionin 2001 sold to our other Divisions compared toUS$22 million in 2000. Revenues improved in ourUpstream business area, but the Downstream businessarea remained flat in 2001 compared to 2000.
Earnings before interest and taxes, or operatingincome, decreased by US$78 million, or 50 percent, to US$79 million in 2001 from US$157 million in 2000 (these values differ from the loss on discontinuedoperations by amounts for interest expense, taxes,minority interest and other items). As reported in localcurrencies, earnings before interest and taxesdecreased 49 percent in 2001 compared to 2000.Earnings before interest and taxes were adverselyaffected by cost overruns and project delays, the majority of which related to two large projects. The remaining underlying business developed positively, benefiting from the higher revenues.
Structured FinanceDemand continued in major European markets and in the United States for lease financing products –including small, standardized leases for office equipmentsuch as copy machines and printers – as companiesfocused on balance sheet management due toincreased funding rates. In light of its own higherrefinancing rates, Structured Finance amended its strategy and did not pursue further significantinvestments in financial leases or lending to infrastructureprojects during 2002.
Period from January 1 to November 30, 2002 compared with year ended December 31, 2001Revenues increased by US$42 million, or 19 percent,to US$262 million in 2002 from US$220 million in2001. The 2002 figure is for eleven months trading asthe structured finance business was sold to GeneralElectric Commercial Finance at the end of November2002.The revenue increase reflects the acquisition of a portfolio of small, mainly standardized leases as well as growth in the businesses existing portfolio of such small leases.
Earnings before interest and taxes, or operatingincome, decreased by US$26 million, or 51 percent, to US$25 million in 2002 from US$51 million in 2001(these values differ from the loss on discontinuedoperations by amounts for the loss on disposal, interestexpense, taxes, minority interest and other items).The2002 figure is also for eleven months of trading.Thelower operating income in general reflected the changein strategy to refrain from new lease and financingtransactions, leading to a corresponding reduction inbusiness activity during 2002. Earnings from theincreased sale of small leases could not compensatefor lower earnings in other units.
Year ended December 31, 2001 compared with year ended December 31, 2000Revenues increased by US$64 million, or 41 percent,to US$220 million in 2001 from US$156 million in 2000. The increased revenues resulted from theacquisition of a portfolio of small, mainly standardizedleases and from its growing financial receivablesportfolio, including financial leases, and lending toinfrastructure projects.
Earnings before interest and taxes, or operatingincome, increased by US$4 million, or 9 percent, to US$51 million in 2001 from US$47 million in 2000(these values differ from the loss on discontinuedoperations by amounts for interest expense, taxes,minority interest and other items). The increase was as a consequence of higher income from theexpanded financial receivables portfolio. StructuredFinance also successfully sold various leasetransactions during 2001.
MeteringDemand in the electricity and water meter markets wasweak in North America as a result of reduced capitalexpenditures by large energy utilities. The economicinstability in Latin America led to a downturn in demandin both Argentina and Brazil. Operations in Germanywere affected by the slowdown in the domestic building industry.
Period from January 1 to December 4, 2002 compared with year ended December 31, 2001Revenues decreased by US$76 million, or 17 percent,to US$372 million in 2002 from US$448 million in2001. The 2002 figure is for eleven months trading asthe business was sold to Ruhrgas Industries GmbH atthe beginning of December 2002. The revenues during the eleven months decreased as a result of the weakmarket conditions in North America, Latin America and Germany.

ABB Group Financial review 2002 33
Earnings before interest and taxes, or operatingincome, decreased by US$11 million, or 38 percent, toUS$18 million in 2002 from US$29 million in 2001(these values differ from the loss on discontinuedoperations by amounts for the loss on disposal, interestexpense, taxes, minority interest and other items).The2002 earnings figure is also for eleven months oftrading. The decrease for the eleven months was aresult of decreased revenues in North America, LatinAmerica and Germany, partially offset by new product introductions, the impact of restructuringactions in a number of units and a reduction in goodwill amortization.
Year ended December 31, 2001 compared with year ended December 31, 2000Revenues decreased by US$9 million, or 2 percent, toUS$448 million in 2001 from US$457 million in 2000.The decrease was primarily in the United Kingdom due to reduced investment by the water companies, a fall in export business due to the loss of previouslyheld contracts in Hong Kong and Sri Lanka, and lowcost imports from China and Eastern Europe.
Earnings before interest and taxes, or operatingincome, decreased by US$9 million or 24 percent, toUS$29 million in 2001 from US$38 million in 2000 (these values differ from the loss on discontinuedoperations by amounts for interest expense, taxes,minority interest and other items).The decrease wasdue to weak economic conditions in North America,leading to a significant drop off in demand for highperformance meters and systems in electricity, and theimpact of lower volumes and pricing pressure in theUnited Kingdom.
Liquidity and capital resources
Principal sources of fundingIn 2002, as in 2001 and 2000, we managed ourliquidity using cash from operations, bank borrowings,the proceeds from the issuance of debt securities,divestment proceeds, as well as the sales ofreceivables under our securitization programs.Thereductions in our credit rating during 2002 describedbelow have restricted our access to the debt marketsand, as a result, we have relied increasingly onproceeds from divestments, bank borrowings, cashfrom operations and additionally in 2003, from the sale of treasury shares (raising approximately US$156 million from the sale of 80 million treasuryshares in two transactions).
Due to the nature of our operations, our cash flow fromoperations generally tends to be weaker in the first halfof the year than in the second half of the year.
We believe that our ability to obtain funding from the sources described above will continue to providethe cash flows necessary to satisfy our working capital requirements, capital expenditure requirementsas well as meet our financial commitments for the next 12 months.This, however, is dependent on thecontinued availability of the sources of fundingdiscussed below. See “Management overview” above.
Credit ratingsDebt ratings are an assessment by the rating agenciesof the credit risk associated with our company and arebased on information provided by us or other sourcesthat the rating agencies consider reliable. Lower ratingsgenerally result in higher borrowing costs and reducedaccess to capital markets.
At December 31, 2001, our long-term ratings were A2 and AA– from Moody’s Investors Service andStandard & Poor’s Rating Services, respectively. ByMarch 31, 2002, these ratings had been lowered toBaa2 and A, respectively. In the fourth quarter of 2002, there were further rating downgrades, and atDecember 31, 2002 our long-term company ratingswere Ba3 and BBB– (our long-term unsecured debtwas rated B1 and BB+) from Moody’s and Standard & Poor’s, respectively. On January 13, 2003,Standard & Poor’s further lowered our long-term ratingto BB+ and our unsecured long-term debt to BB–. The Moody’s ratings have remained unchanged sinceDecember 31, 2002.
Commercial paperWe significantly relied on the commercial paper marketin 2001 and 2000. At December 31, 2001, theoutstanding commercial paper balance amounted toUS$3,297 million (representing 34 percent of totalborrowings).The downgrades of our ratings in 2002,combined with the increased negative sentiment ofinvestors towards corporate borrowers in thecommercial paper market, and the uncertainties relatedto the asbestos issue (see “Contingencies and retainedliabilities” below), meant that it was increasingly difficultfor us to rely upon the commercial paper markets.During the first three months of 2002, the commercialpaper market largely diminished as a funding source and we drew on our credit facility (discussedbelow under “Credit facilities”) to ensure that we would be able to satisfy our commercial paperobligations maturing mainly during the first half of 2002. At December 31, 2002, the outstanding
34 ABB Group Financial review 2002
commercial paper balance amounted to US$478 million(representing 6 percent of total borrowings)and maturing during the first four months of 2003.
Interest ratesWe have obtained financing in a range of currenciesand maturities and on various interest rate terms. Weuse derivatives to reduce the exposures created bysuch debt issuances. For example, to reduce ourexposure to interest rates, we use interest rate swapsto effectively convert fixed rate borrowings into floatingrate liabilities and we use cross currency swaps toeffectively convert foreign currency denominated bondsinto U.S. dollar liabilities. After considering the effects ofinterest rate swaps, the effective average interest rateon our floating rate long-term borrowings (includingcurrent maturities) of US$5,252 million and our fixedrate long-term borrowings (including current maturities)of US$1,035 million was 3.0 percent and 5.0 percent,respectively. This compares with an effective rate of 2.7 percent for floating rate long-term borrowingsand 5.3 percent for fixed rate long-term borrowings as of December 31, 2001. A discussion of our use ofderivatives to modify the characteristics of our long-term borrowings is contained in Note 14 to ourConsolidated Financial Statements.
Convertible bonds and notesIn 2002, we had several note issuances, as well as the issuance of bonds convertible into our shares assources of funding.
In May 2002, we issued US$968 million aggregateprincipal amount of convertible unsubordinated bondsdue 2007. The bonds pay interest semi-annually in arrears at a fixed annual rate of 4.625 percent andeach US$1,000 principal amount of bonds isconvertible into 87.7489 fully paid ABB ordinary sharesat an initial conversion price of 18.48 Swiss francs(converted into U.S. dollars at a fixed conversion rate of1.6216 Swiss francs per U.S. dollar).The conversionprice is subject to adjustment provisions to protectagainst dilution or change in control.The bonds areconvertible at the option of the bondholder at any timefrom June 26, 2002 up to and including May 2, 2007.We may, at any time on or after May 16, 2005, redeemthe outstanding bonds at par plus accrued interest if,(1) for a certain number of days during a specifiedperiod of time, the official closing price of ABB shareson virt-x exceeds 130 percent of the conversion price,or (2) if at least 85 percent in aggregate principalamount of bonds originally issued have beenexchanged, redeemed or purchased and cancelled.We have the option to redeem the bonds when due in
cash, ordinary shares or any combination thereof,provided that the total number of ordinary shares useddoes not exceed 84,940,935.
Also in May 2002, we issued bonds due in 2009 withan aggregate principal amount of 200 million poundssterling, or approximately US$292 million, which payinterest semi-annually in arrears at 10 percent perannum. We also issued in May 2002 bonds due 2008with an aggregate principal amount of 500 million euro,or approximately US$466 million, which pay interestannually in arrears at 9.5 percent per annum.
The 200 million pounds sterling bonds and the 500 million euro bonds contain certain clauses linkingthe interest paid on the bonds to the credit ratingassigned to the bonds. If the rating assigned to thesebonds by both Moody’s and Standard & Poor’sremains at or above Baa3 and BBB–, respectively, thenthe interest rate on the bonds remains at the level atissuance, that is 10 percent and 9.5 percent, for thesterling and euro bonds, respectively. If the ratingassigned by either Moody’s or Standard & Poor’sdecreases below Baa3 or BBB–, respectively, then theannual interest rate on the bonds increases by 1.5 percent per annum to 11.5 percent and 11 percent,for the sterling and euro bonds, respectively. If aftersuch a rating decrease, the rating assigned by bothMoody’s and Standard & Poor’s returns to a level at orabove Baa3 and BBB–, respectively, then the interestrates on the bonds return to their original levels. As aresult of the downgrade of our long-term credit ratingby Moody’s to Ba2 on October 31, 2002, this step-upclause in interest was triggered on both bonds. Theincrease in interest costs is effective for interest periodsbeginning after the payment of the coupon accruing at the date of the downgrade. This increase in interestrates had no significant impact on 2002 interestexpense but will affect our interest costs in 2003 andfuture years if our credit ratings do not return to at least both Baa3 and BBB– from Moody’s and Standard& Poor’s, respectively.
A cross currency swap has been used to modify thecharacteristics of the 200 million pounds sterling bondsand an interest rate swap to modify the 500 millioneuro bonds. See Note 14 to our Consolidated FinancialStatements.
Almost all of our publicly traded bonds contain cross-default clauses which would allow the bondholders todemand repayment if we were to default on anyborrowing at or above a specified threshold amount.

ABB Group Financial review 2002 35
Credit facilitiesAs a result of our difficulty in accessing the commercialpaper market, we drew US$2,845 million of theUS$3,000 million 364-day revolving credit facility put inplace in December 2001 to support our commercialpaper issuance and for general corporate purposes.However, the facility contained a clause whereby if ourlong-term debt rating fell below either A3 or A– fromMoody’s and Standard & Poor’s, respectively, the termsof the facility were to be renegotiated. On March 25,2002, Moody’s downgraded our long-term debt toBaa2, thereby triggering the minimum rating clause inthe facility and requiring the facility to be renegotiated. In April 2002, we amended the credit facility to removethe terms requiring renegotiation of the facility if our ratings fell below specified levels and to introducecertain covenants.
Pursuant to the terms of the amended US$3,000 millionrevolving credit facility, the proceeds from the issuanceof the convertible bonds, the sterling-denominatedbonds and the euro-denominated bonds discussedabove were used to repay and reduce the amountavailable under the facility to US$1,315 million at June 30, 2002. In accordance with the terms of thefacility, the proceeds from the sale/leaseback of realestate located in Sweden, announced in the secondquarter of 2002, were also used to repay and furtherreduce the amount available and outstanding under the facility to US$1,000 million by September 30,2002. This amount was repaid in December 2002 andthe facility closed.
In December 2002, we established a new US$1,500 million 364-day revolving credit facility.Thisfacility includes a 364-day term-out option whereby up to a maximum amount of US$750 million may beextended for up to a further 364 days in the form ofterm loans. The availability of the term-out option issubject to certain conditions, including our ability todemonstrate, at the time of exercising the option, thatincluding the proceeds of the term-out option, we willhave at least US$300 million of available cash (asdefined in the facility agreement) throughout 2004.Assuming the term-out option is fully drawn, theamounts converted into term loans will be reduced byUS$150 million on July 1, 2004, US$250 million onOctober 1, 2004, and US$350 million on December15, 2004, being the final maturity date of the facility.
As of December 31, 2002, nothing had been drawnunder this new facility. Subsequent to the year-end2002, amounts have been drawn under the facilitywithin the facility’s monthly drawing limits. Themaximum amount available under the facility will
reduce from US$1,500 million (available throughOctober 2003) to US$1,200 million and US$1,000 million at the beginning of November 2003and December 2003, respectively.
The amount available under the facility will be furtherreduced by all, or a portion, of the net proceeds from thedisposal of certain significant businesses and assets.The agreement provides that proceeds from specifieddisposals will not reduce the amount available underthe facility until such proceeds exceed certainthresholds. Amounts available under the facility will also be reduced by the proceeds from the issuance of certain long-term debt, equity or equity-linkedinstruments.
The new facility is secured by a package of assets witha net carrying value of US$3,500 million, including theshares of the Oil, Gas and Petrochemicals division(which is earmarked for divestment and is included inassets and liabilities in discontinued operations),specific stand alone businesses and certain regionalholding companies.The facility is also secured bycertain intra-group loans.
The facility also contains certain financial covenants inrespect of minimum interest coverage (EBITDA togross interest expense), total gross debt, a maximumlevel of debt in subsidiaries other than those specifiedas borrowers under the facility, a minimum level ofconsolidated net worth during 2003 as well as specificnegative pledges. We must meet the requirements of the financial covenants at each quarter-endcommencing December 31, 2002. In addition, in orderto ensure the continued availability of the credit facility,we must obtain minimum levels of proceeds from thedisposal of specified assets and businesses and/orequity issuances during 2003. Our compliance with thiscovenant is measured at intervals during 2003. In theevent that, at any measurement date, our proceedsfrom the scheduled disposals and/or equity issuancesare less than the required amount, we may elect toinclude for the purposes of the covenant calculationthe proceeds from other defined discretionary sources.The extent to which these other discretionary sourcesof proceeds may be included in the calculation iscapped by the facility.
The facility prohibits the voluntary prepayment of anybanking facility, the prepayment or early redemption of any bonds or capital market instruments, therepurchase of any shares of ABB as well as thedeclaration or payment of dividends as long as thefacility is outstanding.

36 ABB Group Financial review 2002
Securitization programsIn addition to the aforementioned primary sources of liquidity and capital resources, we also sell certaintrade receivables to Qualifying Special Purpose Entities (QSPEs), unrelated to us, primarily through tworevolving-period securitization programs.
Solely for the purpose of credit enhancement from theperspective of the QSPEs, we retain an interest in the sold receivables. Pursuant to the requirements ofthe revolving-period securitizations, we effectively bearthe risk of potential delinquency or default associatedwith trade receivables sold or interests retained. The fair value of the retained interests at December 31,2002 and 2001, was approximately US$497 millionand US$264 million, respectively.
We retain servicing responsibility relating to the soldreceivables. Cash settlement with the QSPEs in 2001 and through the third quarter of 2002 took placemonthly on a net basis.
One of the securitization programs contained a creditrating trigger whereby if our company rating wentbelow both BBB (Standard & Poor’s) and Baa2(Moody’s), we would no longer benefit from the intra-month funding. The second securitization program also contained a credit rating trigger and similarconsequences but the rating trigger point occurredwhen our company rating went below either BBB(Standard & Poor’s) or Baa2 (Moody’s).
In the case of the first program, the credit triggeroccurred in early November 2002. In November 2002,a number of structural changes to the program wereagreed and implemented for credit enhancementpurposes of the QSPE. These changes included twice-monthly settlements, the sale of additional receivablesas security, changes in the eligibility criteria forreceivables to be sold, and the establishment of certainbanking and collection procedures in respect ofthe sold receivables.
In the case of the second securitization program, thecredit rating trigger occurred in October 2002.Changes to the program were made and included netcash settlement twice per month, daily transfers ofcollections of sold receivables, as well as a fixedpercentage of retained interest on the sale of newreceivables. Subsequent to 2002, further amendmentsto the program have been agreed and implemented,including the return to a dynamic calculation of theretained interest on the receivables sold rather than a
fixed percentage. In addition, under the amendedterms, if our company rating is below BB+ (Standard &Poor’s) or Ba3 (Moody’s), then the QSPE would havethe right to require the collection of the sold receivablesto be made directly to the accounts of the QSPE ratherthan via our company.
The net cash paid to QSPEs during 2002 was US$384 million, while in 2001 the net cash receivedfrom QSPEs was US$86 million. The sale of additionalreceivables as security, the increased frequency oftransfers of collections to the QSPEs and the increasein the retained interest required by the QSPEs allcontributed to the cash flows with the QSPEsrepresenting a net cash outflow for the year 2002rather than a net cash inflow as in 2001.
The total cost of US$37 million and US$33 million in 2002 and 2001, respectively, related to thesecuritization of trade receivables, is included in thedetermination of current earnings.
At December 31, 2002 and 2001, of the gross tradereceivables sold, the total trade receivables for whichcash has not been collected at those dates amountedto US$1,026 million and US$1,058 million, respectively.
For a discussion of our accounting policies with respectto the securitization of trade receivables, see Note 2 toour Consolidated Financial Statements.
Financial position
Balance sheetDuring 2002, the divestments and discontinuations ofcertain businesses were treated as discontinuedoperations pursuant to SFAS 144, as discussed indetail under “Accounting for discontinued operations”above. Accordingly, the balance sheet data for allperiods presented have been restated to present thefinancial position and results of operations of thebusinesses meeting the criteria of SFAS 144 as assetsand liabilities in discontinued operations. In theStatement of Cash Flows, the effects of the discontinuedoperations are not segregated, as permitted byStatement of Financial Accounting Standards No.95,Statement of Cash Flows.
Our operating assets, excluding cash and equivalentsand assets in discontinued operations, increased byUS$76 million to US$14,382 million at December 31,2002, from US$14,306 million at December 31, 2001.Operating assets include marketable securities,receivables, inventories and prepaid expenses. Theincrease reflects a US$483 million increase in

ABB Group Financial review 2002 37
receivables, a US$573 million increase in prepaid expenses and other including a US$384 million increase in the fair value of derivatives as required bySFAS 133 (which requires derivative assets and liabilities to be reported on the balance sheet). The increase also reflects the impact of translating balancesheet amounts from local currencies to U.S. dollars for reporting purposes. These increases were offset bya decrease in marketable securities of US$789 milliondriven by the cessation of our reinsurance businessand the sale of the portfolio of marketable securitiesheld by the Treasury Centers business area inconnection with the discontinuation of its proprietarytrading activities. In addition, inventories, net decreased by US$191 million.
Current operating liabilities excluding liabilities indiscontinued operations, include accounts payable,short-term borrowings including current maturities oflong-term borrowings, accrued liabilities and insurancereserves (which form part of the normal operations of our insurance business), among other items. Currentoperating liabilities decreased by US$794 million to US$16,030 million at December 31, 2002 from US$16,824 million at December 31, 2001 reflecting ourstrategy to reduce our overall debt position andlengthen our maturity profile.The decrease was largelydriven by the reduction of short-term borrowings byUS$2,125 million. Offsetting this decrease in part wasthe US$1,219 million increase in accrued liabilities and other, mainly due to the reclassification of US$806 million from other liabilities in 2002 as well asan additional provision in 2002 and a US$310 millionincrease in the fair value of derivatives as required bySFAS 133.
Financing receivables, which includes receivables fromleases and loans receivable, decreased by US$284million to US$1,802 million at December 31, 2002 fromUS$2,086 million at December 31, 2001. The decreasewas principally due to the reduced lending activities inthe Treasury Centers business area during 2002.
Investments and other assets decreased by US$129 million to US$1,515 million at December 31,2002 from US$1,644 million at December 31, 2001.The decrease was due to a reduction of securitiescontributed to the Swedish pension fund which waspartially offset by the increase from improved returns oninvestments in projects with ABB equity participation,particularly with respect to our investment in SwedishExport Credit Corporation, in Sweden.
Property, plant and equipment increased nominally byUS$39 million to US$2,792 million at December 31,2002 from US$2,753 million at December 31, 2001.Reductions in property, plant and equipment from thesale of real estate properties, and normal levels ofdepreciation and disposition of non-core property, plantand equipment were more than offset, primarily by theeffect of translating balance sheet amounts into U.S. dollars.
Intangible assets increased nominally by US$137 millionto US$2,912 million at December 31, 2002 from US$2,775 million at December 31, 2001, mainly due tothe translation of balance sheet items into U.S. dollars.In accordance with SFAS 142, goodwill is no longeramortized as of January 1, 2002.
Our net debt position (defined as borrowings minuscash and equivalents and marketable securities),excluding assets and liabilities in discontinuedoperations, amounted to US$3,339 million at December 31, 2002, compared to US$4,338 million atDecember 31, 2001.This decrease is due to theplanned reduction of our borrowings through the saleof non-core businesses, particularly, the sales of theStructured Finance and Metering businesses, as wellas the sale of real estate.
Total borrowings decreased by US$1,752 million toUS$7,952 million at December 31, 2002 fromUS$9,704 million at December 31, 2001. Short-termborrowings, including current maturities of long-termdebt, decreased by US$2,125 million, or 45 percent,to US$2,576 million outstanding at December 31, 2002from US$4,701 million outstanding at December 31,2001. Long-term borrowings increased by US$373million, or 7 percent, to US$5,376 million at December31, 2002 from US$5,003 million at December 31,2001. The increase in 2002 mainly reflected the impactof translating balance sheet amounts from localcurrencies to U.S. dollars for reporting purposes.Thisincrease was partly offset by US$215 million relating toour convertible bonds issued during 2002. The shares ofABB Ltd that will be issued if the bonds are converted,are denominated in Swiss francs, while the bonds aredenominated in U.S. dollars. Under SFAS 133, and asclarified by us in discussions with the Securities andExchange Commission, a component of the bondsmust be accounted for as a derivative. A portion of theissuance is deemed to relate to the value of thederivative upon issuance and subsequent changes invalue of the derivative are recorded through earningsand as an adjustment to the carrying value of the bond.This allocation of a portion of the proceeds to the deriv-ative creates a discount which is amortized to earningsover the life of the bond. The value of the derivative
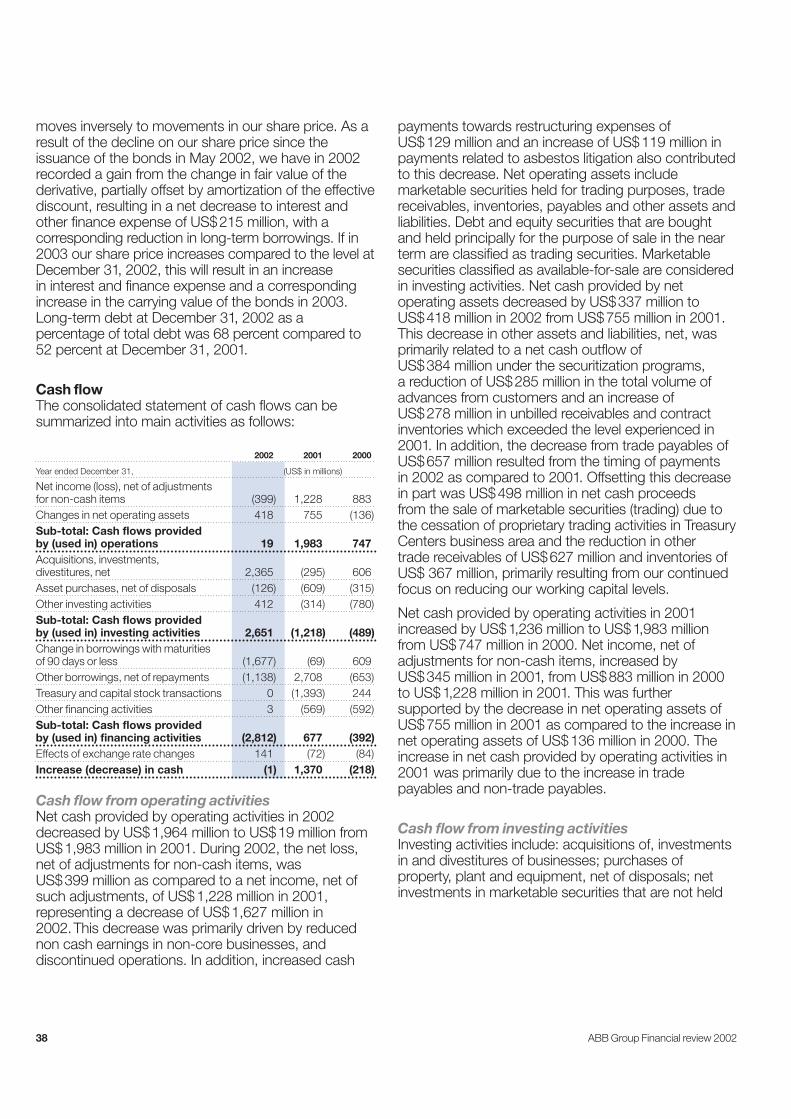
38 ABB Group Financial review 2002
moves inversely to movements in our share price. As aresult of the decline on our share price since theissuance of the bonds in May 2002, we have in 2002recorded a gain from the change in fair value of thederivative, partially offset by amortization of the effectivediscount, resulting in a net decrease to interest andother finance expense of US$215 million, with acorresponding reduction in long-term borrowings. If in2003 our share price increases compared to the level atDecember 31, 2002, this will result in an increase in interest and finance expense and a correspondingincrease in the carrying value of the bonds in 2003.Long-term debt at December 31, 2002 as apercentage of total debt was 68 percent compared to52 percent at December 31, 2001.
Cash flowThe consolidated statement of cash flows can besummarized into main activities as follows:
2002 2001 2000
Year ended December 31, (US$ in millions)
Net income (loss), net of adjustmentsfor non-cash items (399) 1,228 883Changes in net operating assets 418 755 (136)Sub-total: Cash flows providedby (used in) operations 19 1,983 747Acquisitions, investments,divestitures, net 2,365 (295) 606Asset purchases, net of disposals (126) (609) (315)Other investing activities 412 (314) (780)Sub-total: Cash flows providedby (used in) investing activities 2,651 (1,218) (489)Change in borrowings with maturitiesof 90 days or less (1,677) (69) 609Other borrowings, net of repayments (1,138) 2,708 (653)Treasury and capital stock transactions 0 (1,393) 244Other financing activities 3 (569) (592)Sub-total: Cash flows provided by (used in) financing activities (2,812) 677 (392)Effects of exchange rate changes 141 (72) (84)Increase (decrease) in cash (1) 1,370 (218)
Cash flow from operating activitiesNet cash provided by operating activities in 2002decreased by US$1,964 million to US$19 million fromUS$1,983 million in 2001. During 2002, the net loss,net of adjustments for non-cash items, was US$399 million as compared to a net income, net ofsuch adjustments, of US$1,228 million in 2001,representing a decrease of US$1,627 million in2002.This decrease was primarily driven by reducednon cash earnings in non-core businesses, anddiscontinued operations. In addition, increased cash
payments towards restructuring expenses of US$129 million and an increase of US$119 million inpayments related to asbestos litigation also contributedto this decrease. Net operating assets includemarketable securities held for trading purposes, tradereceivables, inventories, payables and other assets andliabilities. Debt and equity securities that are boughtand held principally for the purpose of sale in the nearterm are classified as trading securities. Marketablesecurities classified as available-for-sale are consideredin investing activities. Net cash provided by netoperating assets decreased by US$337 million toUS$418 million in 2002 from US$755 million in 2001.This decrease in other assets and liabilities, net, wasprimarily related to a net cash outflow of US$384 million under the securitization programs, a reduction of US$285 million in the total volume ofadvances from customers and an increase of US$278 million in unbilled receivables and contractinventories which exceeded the level experienced in2001. In addition, the decrease from trade payables of US$657 million resulted from the timing of payments in 2002 as compared to 2001. Offsetting this decreasein part was US$498 million in net cash proceeds from the sale of marketable securities (trading) due tothe cessation of proprietary trading activities in TreasuryCenters business area and the reduction in other trade receivables of US$627 million and inventories ofUS$ 367 million, primarily resulting from our continuedfocus on reducing our working capital levels.
Net cash provided by operating activities in 2001increased by US$1,236 million to US$1,983 millionfrom US$747 million in 2000. Net income, net ofadjustments for non-cash items, increased by US$345 million in 2001, from US$883 million in 2000to US$1,228 million in 2001. This was furthersupported by the decrease in net operating assets ofUS$755 million in 2001 as compared to the increase innet operating assets of US$136 million in 2000. Theincrease in net cash provided by operating activities in2001 was primarily due to the increase in tradepayables and non-trade payables.
Cash flow from investing activitiesInvesting activities include: acquisitions of, investmentsin and divestitures of businesses; purchases ofproperty, plant and equipment, net of disposals; netinvestments in marketable securities that are not held

ABB Group Financial review 2002 39
for trading purposes; and accounts receivable fromleases and third-party loans (financing receivables). Net investments in available-for-sale marketablesecurities and financing receivables are summarized inthe table above as “other investing activities”. Net cashprovided by investing activities increased by US$3,869million to US$2,651 million in 2002 from a net cashused in investing activities of US$1,218 million in 2001.
Net cash flow resulting from purchases of, investmentsin, and divestitures of businesses increased to US$2,365 million provided in 2002 from US$295 million used in 2001. In 2002, cash used foracquisitions of new businesses totalled US$144 millioncompared to US$578 million in 2001. These cash outflows in 2002 were more than offset by disposals ofbusinesses for an amount of US$2,509 million. Majordisposals during 2002 include the sale of our AirHandling, Structured Finance and Metering businesses.
Cash used for purchases of property, plant andequipment, net of disposals, decreased by US$483million to US$126 million in 2002 from US$609 millionin 2001. This decrease resulted from increased proceedsfrom the disposal of property, plant and equipment.
Cash provided by other investing activities increased to US$412 million in 2002 as compared to US$314 million used in 2001. This increase primarilyresulted from a substantial reduction in investments infinancing receivables, particularly from the reducedlending activities in the Treasury Centers business areadue to the cessation of proprietary trading activities.The increase was offset in part by a decrease in netcash flow from the purchase and sale of marketablesecurities that are not held for trading purposes, fromUS$593 million in 2001 to US$148 million in 2002.
Net cash used in investing activities increased toUS$1,218 million in 2001 from US$489 million in 2000.Net cash flow resulting from purchases of, investmentsin, and divestitures of businesses decreased to US$295 million used in 2001 from US$606 millionprovided in 2000. In 2001, cash used for acquisitionsof new businesses totalled US$578 million (including US$284 million, related to the acquisition of Entrelec).These cash outflows were only partially offset by cashproceeds from disposals of businesses for an amountof US$283 million. In 2000, cash used for acquisitionstotalling US$893 million was more than offset bycash from sale of businesses, which amounted toUS$1,499 million and primarily related to the divestitureof our remaining interest in ABB ALSTOM POWER and the Nuclear technology business.
Cash flow from financing activitiesOur financing activities primarily include net borrowings,both from the issuance of debt securities and directlyfrom banks, treasury and capital stock transactions,and payment of dividends. Net cash used in financingactivities increased by US$3,489 million to US$2,812 million from US$677 million provided in2001. Cash used in total borrowings, net, increased by US$5,454 million to US$2,815 million in 2002 as compared to US$2,639 million provided in 2001.Cash used in long-term borrowings increased by US$3,846 million to US$1,138 million in 2002 fromUS$2,708 million provided in 2001. In addition, cashused in borrowings with maturities of 90 days or lessincreased by US$1,608 million to US$1,677 million in2002 from US$69 million cash used in 2001.These arein line with our strategy to reduce the overall debtsituation and lengthen our debt maturity profile.Therewere no treasury and capital stock transactions and dividends payouts in 2002 compared to US$1,393 million used in treasury and capital stocktransactions and US$502 million used in dividendspayouts during 2001.
Net cash provided by financing activities increased by US$1,069 million to US$677 million provided in2001 as compared to US$392 million used in 2000.Cash provided by long-term borrowings, net ofrepayments, increased by US$3,361 million toUS$2,708 million provided in 2001 as compared toUS$653 million repaid in 2000.This was partially offsetby a decrease of US$678 million in cash flow fromborrowings with maturities of 90 days or less fromUS$609 million cash provided in 2000 to US$69 millionof cash used in 2001. Our level of borrowingsincreased significantly during the first nine months of2001 mainly due to the financing of the repurchase ofour own shares as well as a higher level of activity inproject financing. Towards year-end 2001, we de-creased our borrowings significantly through a strongincrease in our cash from operations. During 2001, weused US$1,393 million of cash for the purchase of ourshares for treasury, offset by proceeds of options topurchase our shares. In April 2001, we paid dividendsof US$502 million as compared to US$ 531 millionwith respect to 2000.

40 ABB Group Financial review 2002
Contractual obligations and commercial commitments
Contractual obligationsThe following table summarizes our contractualobligations and principal payments under our debtinstruments, leases and certain other agreements as of December 31, 2002:
Lessthan 2–3 4–5 After
Total 1 year years years 5 years
Payments due by period
(US$ in millions)
Long-term debt obligations 7,040 1,664 2,348 1,359 1,669Commercial paper obligations 478 478 – – –Other short-termdebt obligations 434 434 – – –Operating lease obligations 1,754 329 482 326 617
Commercial commitmentsAll guarantees issued before January 1, 2003, areaccounted for in accordance with Statement ofFinancial Accounting Standards No. 5 (SFAS 5),Accounting for Contingencies. Provisions are recordedin the Consolidated Financial Statements at the time it becomes probable we will incur losses pursuantto a guarantee.
In November 2002, the Financial AccountingStandards Board issued FIN 45, the disclosurerequirements of which are effective for financialstatements relating to periods ending after December 15, 2002. FIN 45 requires that we disclosethe “maximum potential exposure” of certainguarantees as well as possible recourse provisions thatmay allow us to recover from third parties amountspaid out under such guarantees.The “maximumpotential exposure” as defined by FIN 45 does not allowany discounting of our assessment of actual exposureunder the guarantees. The information below reflectsour maximum potential exposure under theguarantees, which is higher than our assessment of the expected exposure.
Certain guarantees issued or modified after December 31, 2002 will be accounted for in accordancewith FIN 45. Upon issuance of certain guarantees, a liability, equal to the fair value of the guarantee, will be recorded. For further discussion of FIN 45, see“New accounting pronouncements” above.
Performance guarantees represent obligations wherewe guarantee the performance of a third party’s productor service according to the terms of the contract.Such guarantees may include guarantees that a project
will be completed within a specified time. If the thirdparty does not fulfill the obligation, we will compensatethe guaranteed party in cash or in kind. Performanceguarantees include surety bonds, advance paymentguarantees, and performance standby letters of credit.
Commitments relating to disposed businessesWe retained obligations for guarantees related to thepower generation business contributed to the ABB ALSTOM POWER NV joint venture. The guaranteesprimarily consist of performance guarantees, advancepayment guarantees, product warranty guarantees,and other miscellaneous guarantees under certaincontracts such as indemnification for personal andproperty injuries, taxes, and compliance with laborlaws, environmental laws and patents.The guaranteeshave maturity dates ranging from one to ten years andin some cases have no definite expiry. ALSTOM and itssubsidiaries have primary responsibility for performingthe obligations that are the subject of the guarantees.In connection with the sale to ALSTOM of our interestin the joint venture in May 2000, ALSTOM, the parentcompany, and ALSTOM POWER have undertakenjointly and severally to fully indemnify us and hold usharmless against any claims arising under suchguarantees. Due to the nature of product warrantyguarantees and the miscellaneous guarantees, we areunable to develop an estimate of the maximumpotential amount of future payments for these guaranteesissued on behalf of the former Power Generationbusiness. Our best estimate of the total maximumpotential exposure of all quantifiable guarantees weissued on behalf of our former Power Generationbusiness was approximately US$2,200 million as ofDecember 31, 2002.The maximum potential exposureis based on the original guarantee or contract amountand does not reflect the completion status of theproject. As of December 31, 2002, no losses havebeen recognized relating to guarantees issued onbehalf of the former power generation business. Webelieve that it is not probable that we will incur a lossunder these guarantees and therefore, in accordancewith SFAS 5, a provision has not been recorded asof December 31, 2002.
In connection with the sale of our Nuclear technologybusiness to British Nuclear Fuels (BNFL) in 2000, oneof our subsidiaries retained obligations under suretybonds relating to the performance by the Nuclear

ABB Group Financial review 2002 41
technology business under certain contracts enteredinto prior to the sale to BNFL.The surety bonds havematurity dates ranging from one to nine years. Pursuantto the purchase agreement under which the Nucleartechnology business was sold, BNFL is required toindemnify us and hold us harmless against any claimsarising under such bonds. Our maximum potentialexposure under these bonds at December 31, 2002was approximately US$640 million. The maximumpotential exposure is based on the original guaranteeor contract amount and does not reflect the completionstatus of the project. As of December 31, 2002, nolosses have been recognized relating to the suretybonds. We believe that it is not probable that we willincur a loss under these guarantees and therefore, inaccordance with SFAS 5, a provision has not beenrecorded as of December 31, 2002.
In connection with the sale of most of our StructuredFinance business to GE Commercial Finance inNovember 2002, we provided to GE CommercialFinance several cash collateralized letters of credit for a total amount of US$ 202 million as security for certain performance-related obligations we retained inconnection with the sale.
Commitments relating to our remainingStructured Finance businessIn the course of its commercial lending activities, ourremaining Structured Finance business has guaranteedthe obligations of certain third parties in return for acommission.These financial guarantees representirrevocable assurances that we will make payment inthe event that the third party fails to fulfill its obligationsunder the relevant loan agreement and the beneficiaryunder the guarantee records a loss under the terms ofthe guarantee agreement. We generally benefit fromthe collateral and security arrangements under theguaranteed loan. We recognize the commissionscollected as income over the life of the guarantee andwe record a provision when we become aware of anevent of default, or a potential event of default occurs.
At December 31, 2002, we had issued approximatelyUS$207 million of financial guarantees with maturitydates ranging from one to eighteen years.The issuedguarantees have the same maturity dates as therelated debt.The maximum potential amount of futurepayments we could be required to make under suchguarantees at December 31, 2002 is US$207 million,of which US$8 million is included in other liabilities in our Consolidated Balance Sheet at December 31,2002. We do not expect to incur significant lossesunder these contracts.
Also in the normal course of its commercial lendingactivities, our remaining Structured Finance businesshas outstanding credit commitments which have notyet been drawn down by customers. The unusedamount at December 31, 2002 was US$41 million.
Other commitmentsAt December 31, 2002, we had US$211 million offinancial guarantees outstanding that were unrelated tothe remaining Structured Finance business. Of thatamount, US$206 million were issued on behalf ofcompanies in which we currently have or formerly hadan equity position. The guarantees have maturity datesranging from one to fourteen years. We believe that it is not probable that we will incur a loss under theseguarantees and therefore, in accordance with SFAS 5, a provision has not been recorded as ofDecember 31, 2002.
On behalf of companies in which we have an equityposition, we have granted lines of credit and have committed to provide additional capital. AtDecember 31, 2002, the total unused lines of credit amounted to US$22 million and the capitalcommitments amounted to US$64 million.
Guarantees relating to ABB performanceIn accordance with industry practice we also issueletters of credit, surety bonds and other performanceguarantees on major projects, including long-termoperation and maintenance contracts, which guaranteeour own performance. Such guarantees may includeguarantees that a project will be completed or thata project or particular equipment will achieve definedperformance criteria. If we fail to attain the definedcriteria, we must make payments in cash or in kind. We record provisions in the Consolidated FinancialStatements at the time it becomes probable that wewill incur losses pursuant to a performanceguarantee.We do not expect to incur significant lossesunder these guarantees in excess of our provisions.However, such losses, if incurred, could have a materialimpact on our consolidated financial position, liquidityor results of operations.

42 ABB Group Financial review 2002
When we guarantee our own performance, somecustomers will require that the guarantee be issued bya financial institution. If we cannot obtain the guaranteefrom a financial institution, we could be prevented from bidding on or obtaining the contract. Financialinstitutions will consider our credit ratings in theguarantee approval process. Our current credit ratingdoes not prevent us from obtaining guarantees fromfinancial institutions, but can make the process moredifficult or expensive. If we cannot obtain guaranteesfrom financial institutions in the future, there could be amaterial impact on our consolidated financial position,liquidity or results of operations.
Related and certain other partiesWe have participations in joint ventures and affiliatedcompanies, which are accounted for using the equitymethod. Many of these entities have been establishedto perform specific functions, such as constructing,operating and maintaining a power plant. In addition toour investment, we may provide products to theproject, may act as contractor of the project and mayoperate the finished product.We may also grant lines of credit to these entities and guarantee theirobligations, as discussed above under “Commercialcommitments”.The entity created generally wouldreceive revenues either from the sale of the finalproduct or from selling the output generated by theproduct.The revenue usually is defined by a long-termcontract with the end user of the output.
Our risk with respect to these entities is substantiallylimited to the carrying value of the companies on ourConsolidated Balance Sheet.The carrying value for theequity accounted companies at December 31, 2002and 2001 was US$730 million and US$615 million,respectively.
Our 2002 Consolidated Financial Statements includethe following aggregate amounts related to transactionswith related and certain other parties:
(US$ in millions)
Revenues 77Receivables 81Other current assets 58Financing receivable (non-current) 110Payables 74Borrowings (current) 40Other current liabilities 22
Contingencies and retained liabilities
EnvironmentalAll of our operations, but particularly our manufacturingoperations, are subject to comprehensiveenvironmental laws and regulations. Violations of theselaws could result in fines, injunctions (including ordersto cease the violating operations and to improve thecondition of the environment in the affected area or topay for such improvements) or other penalties. Inaddition, environmental permits are required for ourmanufacturing facilities (for example, with respect to airemissions and wastewater discharges). In mostcountries in which we operate, environmental permitsmust be renewed on a regular basis and we mustsubmit reports to environmental authorities. Thesepermits may be revoked, renewed or modified by theissuing authorities at their discretion and in compliancewith applicable laws. We have implemented formalenvironmental management systems at nearly all of our manufacturing sites in accordance with theinternational environmental management standard ISO 14001, and we believe that we are in substantialcompliance with environmental laws, regulations andpermits in the various jurisdictions in which we operate,except for such instances of non-compliance that, inthe aggregate, are not reasonably likely to be material.
In a number of jurisdictions, including the United States,we may be liable for environmental contamination atour present or former facilities, or at other sites wherewastes generated from our present or former facilitieswere disposed of. In the United States, theEnvironmental Protection Agency and various stateagencies are responsible for regulating environmentalmatters. These agencies have identified various currentand former U.S. based ABB Group companies aspotentially responsible parties in respect to a number ofsuch sites under the Comprehensive EnvironmentalResponse, Compensation, and Liability Act, theResource Conservation and Recovery Act and otherfederal and state environmental laws. As a potentiallyresponsible party we may be liable for a share of thecosts associated with cleaning up these sites. As ofDecember 31, 2002, there were approximately 25 sites, at which, ABB Group companies have, ormay be potentially responsible for, environmental cleanup costs.These 25 sites include several of our current

ABB Group Financial review 2002 43
or former facilities where we have undertaken voluntarycorrective actions.The clean up of these sites involves primarily soil and groundwater contamination.We do not believe that our aggregate liability inconnection with these sites will be material.
Generally, our liability with regard to any specific site will depend on the number of potentially responsibleparties, their relative contributions of hazardoussubstances or wastes to the site and their financialviability, as well as on the nature and extent of thecontamination. Nevertheless, such laws commonlyimpose liability that is strict, joint and several, so thatany one party may be liable for the entire cost ofcleaning up a contaminated site.
In addition, we retained liability for certain specificenvironmental remediation costs at two sites in theU.S. that were operated by our Nuclear technologybusiness, which we sold to British Nuclear Fuels(“BNFL”) in 2000. Pursuant to the purchase agreementwith BNFL, we retained all of the environmentalliabilities associated with our Combustion Engineeringsubsidiary’s Windsor, Connecticut facility and a portionof the environmental liabilities associated with our ABBC-E Nuclear Power, Inc. subsidiary’s Hematite,Missouri facility. The primary environmental liabilitiesassociated with these sites relate to the costs ofremediating radiological and chemical contamination atthese facilities. Such costs are not payable until afacility is taken out of use and generally are incurredover a number of years. Although it is difficult to predictwith accuracy the amount of time it may take toremediate radiological contamination upon decommis-sioning, based on information that BNFL has madepublicly available, we believe that it may take until 2013to remediate the Hematite site. With respect to theWindsor site, we believe the remediation may take until2008. At the Windsor site, we believe that a significantportion of such remediation costs will be the responsi-bility of the U.S. government pursuant to the AtomicEnergy Act and the Formerly Used Site EnvironmentalRemediation Action Program because such costsrelate to materials used by Combustion Engineering inits research and development work on, and fabricationof, nuclear fuel for the United States Navy. As a resultof the sale of the Nuclear technology business, in April2000 we established a reserve of US$300 million inconnection with estimated remediation costs related tothese facilities. Expenditures charged to the remedia-tion reserve were US$12 million and US$6 millionduring 2002 and 2001, respectively. In connection withthe pre-packaged Chapter 11 filing by CombustionEngineering discussed below, we will retain allenvironmental liabilities associated with the Windsorsite.
Estimates of the future costs of environmentalcompliance and liabilities are imprecise due tonumerous uncertainties. Such costs are affected by the enactment of new laws and regulations, the development and application of new technologies,the identification of new sites for which we may haveremediation responsibility and the apportionment of remediation costs among, and the financial viabilityof, responsible parties. In particular, the exact amountof the responsibility of the U.S. government for theWindsor site cannot reasonably be estimated. It ispossible that final resolution of environmental mattersmay require us to make expenditures in excess of ourexpectations, over an extended period of time and in a range of amounts that cannot be reasonablyestimated. Although final resolution of such matterscould have a material effect on our consolidated resultsof operations in a particular reporting period in whichthe expenditure is incurred, we believe that theseexpenditures should not have a material adverse effecton our consolidated financial position.
Product and order related contingenciesIn 1998, we entered into an engineering, procurementand project management contract with a customer for an oil and petrochemical refinery in India with acontract value of approximately US$860 million.The project, which is subject to a reimbursable costagreement, is approximately 60 percent complete and has been stalled for the past few years due tocomplications encountered by the customer inobtaining additional necessary financing. As ofDecember 31, 2002, we had accounts and notesreceivable of US$68 million, sales in excess ofinvoicing of US$159 million, and off balance sheetexposure of US$43 million relating to the project.Thecustomer and the banks have informed us that theyare committed to restarting this project in the first halfof 2003. We have recorded provisions of US$140 million which we believe adequately providefor its exposure related to this project. If the customercannot obtain the required financing and the project is not restarted, we will not be able to recover ourremaining investment in the project and will be subjectto contingent liabilities to third parties, resulting in awrite-off for our remaining investment in 2003.

44 ABB Group Financial review 2002
Asbestos claims
OverviewWhen we sold our 50 percent interest in ABB ALSTOMPOWER NV to ALSTOM in May 2000, we retainedownership of Combustion Engineering Inc.(Combustion Engineering), a subsidiary that hadconducted part of our power generation business andthat now owns commercial real estate that it leasesto third parties. Combustion Engineering was namedas a co-defendant, together with third parties, innumerous lawsuits in the United States in which theplaintiffs claimed damages for personal injury arisingfrom exposure to or use of equipment that containedasbestos that Combustion Engineering supplied,primarily during the early 1970s and before. Other ABBGroup entities were sometimes named as defendantsin asbestos claims. These entities include ABBLummus Global Inc. (Lummus) (which is part of our Oil,Gas and Petrochemicals business) and BasicIncorporated (Basic) (which is currently a subsidiary ofAsea Brown Boveri Inc. and was formerly a subsidiaryof Combustion Engineering).These claims, however,were insignificant compared to the CombustionEngineering claims and have not had a material impacton our Consolidated Balance Sheet or ConsolidatedIncome Statement.
As of December 31, 2002, 2001 and 2000, provisions of US$1,118 million, US$940 million andUS$590 million, respectively, were recorded in respectof asbestos claims and related defense costs. Wedetermined the amounts to be provided in 2001 and2000 by estimating the expected cost of future claimsettlements over a period of several years. In 2002,the provision is based on our obligations underCombustion Engineering’s Chapter 11 plan ofreorganization, as described below, and assumes theconfirmation of the plan.These provisions do not reflectprobable insurance recoveries on those claims.We also recorded receivables of approximatelyUS$241 million, US$263 million and US$251 million atDecember 31, 2002, 2001 and 2000, respectively, forprobable insurance recoveries, which were establishedwith respect to the claims reserved against. During2002 and 2001, Combustion Engineering experienced a significant increase in the level of new claims andhigher total and per-claim settlement costs ascompared to prior years. Cash payments, beforeinsurance recoveries, to resolve CombustionEngineering’s asbestos claims were US$236 million(including US$30 million contributed into the CE Settlement Trust), US$136 million and US$125million in 2002, 2001 and 2000. Administration anddefense costs were US$32 million, US$13 million andUS$7 million in 2002, 2001 and 2000.
Negotiations with representatives of asbestosclaimants and pre-packaged Chapter 11 filingIn October 2002, we determined that it was likely thatthe expected asbestos-related costs of CombustionEngineering would exceed the value of its assets(US$812 million at September 30, 2002), if its historicalsettlement policies continued into the future. We andCombustion Engineering determined to resolve theasbestos liability of Combustion Engineering and itsaffiliates, including ABB Ltd, by reorganizingCombustion Engineering under Chapter 11, theprincipal business reorganization chapter of the U.S. Bankruptcy Code. Under Chapter 11, a debtor isauthorized to reorganize its business for the benefit ofits creditors and shareholders. In addition to permittingrehabilitation of the debtor, Chapter 11 promotesequality of treatment of creditors and equity securityholders who hold substantially similar claims against orinterests in the debtor and its assets. Section 524(g) of the Bankruptcy Code, which is designed forcompanies with large numbers of asbestos-relatedclaims, provides mechanisms for efficiently channelingasbestos-related personal injury claims through a trust and increases the likelihood that the value of anoperating business can be preserved. We andCombustion Engineering determined to structure the Chapter 11 reorganization as a “pre-packagedplan,” in which acceptances of the plan would besolicited prior to the filing of the Chapter 11 case, thus reducing the duration and expense of thebankruptcy proceedings.
Beginning in October 2002, we and CombustionEngineering conducted extensive negotiations withrepresentatives of asbestos claimants with respect to a pre-packaged plan. On November 22, 2002,Combustion Engineering and the asbestos claimants’representatives entered into a Master SettlementAgreement for settling open asbestos-related personalinjury claims that had been lodged against CombustionEngineering prior to November 15, 2002. At the same time, Combustion Engineering entered into a CE Settlement Trust Agreement, which provided themanner in which a trust (the “CE Settlement Trust”)would be funded and administered with respect to thepayment of asbestos-related personal injury claimssettled under the Master Settlement Agreement. Underthe terms of the Master Settlement Agreement, eligible

ABB Group Financial review 2002 45
claimants who met all criteria to qualify for paymentwere entitled to receive a percentage of the value oftheir claim from the CE Settlement Trust and retain aclaim against Combustion Engineering for the unpaidbalance. The Master Settlement Agreement dividesclaims into three categories, based on the status of theclaim at November 14, 2002, the status of thedocumentation relating to the claim, and whether ornot the documentation establishes a valid claim eligible for settlement and payment by CombustionEngineering. The Master Settlement Agreement wassupplemented in January 2003 to clarify the rights of certain claimants whose right to participate in aparticular payment category was disputed.
Pursuant to the Master Settlement Agreement the CE Settlement Trust was funded by:
■ cash contributions from Combustion Engineering inthe amount of US$5 at inception;
■ cash contributions from ABB Inc., a subsidiary ofABB Ltd, on December 31, 2003 in the amount ofUS$30 million;
■ a promissory note from Combustion Engineering in the principal amount of approximately US$101 million (guaranteed by Asea Brown Boveri Inc.); and
■ an assignment by Combustion Engineering of theUS$311 million unpaid balance of principal andinterest due to Combustion Engineering from Asea Brown Boveri Inc. under a loan agreementdated May 12, 2000 (guaranteed by ABB Ltd).
On January 17, 2003, we announced that we andCombustion Engineering had reached an agreementon a proposed Pre-Packaged Plan of Reorganizationfor Combustion Engineering under Chapter 11 of the Bankruptcy Code (the “Plan”). The agreement wasreached both with representatives of asbestosclaimants with existing asbestos-related personal injury claims against Combustion Engineering(encompassing claimants who had lodged claims priorto November 15, 2002 and were eligible to participatein the Master Settlement Agreement and claimantswho had lodged claims after that date and were noteligible to participate in the Master SettlementAgreement) and with the proposed representative ofpersons who may be entitled to bring asbestos-relatedpersonal injury claims in the future.
The Plan provides for the creation of an independenttrust (the “Asbestos PI Trust”) in addition to the CE Settlement Trust. Under the Plan, all present and
future asbestos-related personal injury claims, includingthe unpaid portion of previously settled claims, thatarise directly or indirectly from any act, omission,products or operations of Combustion Engineering,Lummus or Basic will be channeled to the Asbestos PITrust.The Plan contemplates that the BankruptcyCourt will issue an injunction under Section 524(g) ofthe Bankruptcy Code in connection with theconfirmation of the Plan, pursuant to which ABBaffiliated companies (including ABB Ltd, CombustionEngineering, Lummus and Basic) and certain partiesunrelated to ABB will be protected from those futureasbestos-related personal injury claims.The channellinginjunction is an essential element of the Plan. Issuanceof the channelling injunction requires that at least 75 percent of the votes cast by asbestos claimantsentitled to vote on the Plan must have been cast infavor of the Plan.
The Plan sets forth distribution procedures for theallocation of funds to the claimants. The Plan providesthat, in addition to the Asbestos PI Trust claims, theunpaid portion of claims that were settled pursuant to the Master Settlement Agreement will be entitled todistributions from the Asbestos PI Trust.
On the effective date of the Plan, the Asbestos PI Trustwill be funded as follows:
■ a US$20 million 5 percent term note with a maximumterm of 10 years from the effective date of the Plan, secured by Combustion Engineering’s Windsor,Connecticut real estate and real estate leases (undercertain specified contingencies, the Asbestos PI Trustmay have the right to convert the term note intoownership of 80 percent of the voting securities ofthe reorganized Combustion Engineering);
■ excess cash held by Combustion Engineering on theeffective date of the Plan;
■ a promissory note, guaranteed by ABB Ltd and/orcertain of its subsidiaries, in aggregate amount ofUS$250 million payable in equal quarterly installmentscommencing in 2004, with US$50 million to be paidduring 2004, US$100 million to be paid during 2005 and US$100 million to be paid during 2006,and further providing for contingent payments of an additional aggregate amount of US$100 million in equal installments between 2006 and 2010 if ABB Ltd meets certain financial performance

46 ABB Group Financial review 2002
standards (EBIT margin of 8 percent for the first two installments and 12 percent for the last two installments);
■ a non-interest bearing promissory note on behalf of Lummus in the amount of US$28 million payable in relatively equal annual installments over12 years;
■ a non-interest bearing promissory note on behalf of Basic in the aggregate amount of US$10 millionpayable in relatively equal annual installments over12 years;
■ 30,298,913 ABB Ltd shares, which had a fair valueat December 31, 2002 of US$86 million. Ourobligation to deliver these shares will continue to bemarked-to-market, with changes in the fair value of the shares reflected in earnings until such sharesare contributed to the Asbestos PI Trust;
■ Combustion Engineering, Lummus and Basic willassign to the Asbestos PI Trust their rights undercertain insurance policies and insurance settlementagreements. Aggregate unexhausted product liability limits are US$198 million for CombustionEngineering, US$43 million for Lummus and US$28 million for Basic, although amounts ultimatelyrecovered under these policies may be substantiallyless than the policy limits. In addition, CombustionEngineering will assign to the Asbestos PI Trustscheduled payments under certain of its insurancesettlement agreements (US$ 95 million as ofDecember 31, 2002);
■ If Lummus is sold within 18 months after the effective date of the Plan, ABB Inc. will contributeUS$5 million to the CE Settlement Trust and US$5 million to the Asbestos PI Trust. If the CE Settlement Trust has ceased to exist at that time,both US$5 million payments will be made to the Asbestos PI Trust, but in no event will thiscontribution exceed the net proceeds of the sale of Lummus;
■ Upon dissolution of the CE Settlement Trust, allfunds, assets and properties held by the CESettlement Trust will be transferred automatically to the Asbestos PI Trust.
Next steps in the Chapter 11 processThe solicitation of votes to approve the Plan began onJanuary 19, 2003, and Combustion Engineering filedfor Chapter 11 in the U.S. Bankruptcy Court inDelaware on February 17, 2003 based on thepreviously negotiated Plan.The voting period closed onFebruary 19, 2003, and, according to the preliminary
results, approximately 80 percent of those votingapproved the Plan. The final voting results are subjectto verification and confirmation by the bankruptcycourt, and a confirmation hearing has been scheduledfor April 24, 2003. If the Plan is confirmed, in order tosecure the benefits of the full injunction and discharge,Combustion Engineering will seek affirmation of theconfirmation order from the U.S. District Court.ThePlan will become effective at the conclusion of allappeals unless Combustion Engineering and otherparties to the case agree on an earlier effective date.It is not assured that the Bankruptcy Court will confirmthe Plan, and if the Plan is confirmed, we cannot becertain how long the appeals process will last.
Effect of the Plan on our financial positionWe recorded a charge of US$420 million in income(loss) from discontinued operations, net of tax, for2002, which amount was determined based upon theproposed settlement amounts contained in the Plan. In prior years, the Consolidated Financial Statementsreflected charges to earnings based on CombustionEngineering’s forecasts of the expected cost of futureclaim settlements over a period of several years andestimates of the amounts recoverable from insurancewhen the claims were settled.This resulted in a chargeto earnings of US$470 million and US$70 million in2001 and 2000, respectively, which is included inincome (loss) from discontinued operations, net of tax.
Based on expected implementation of the Plan, the expected ultimate liability for the resolution ofasbestos-related personal injury asbestos claimsagainst Combustion Engineering, Lummus and Basicas of December 31, 2002 is estimated to be US$1,118 million and is included in accrued liabilitiesand other in the Consolidated Balance Sheet. If thePlan is confirmed, certain amounts will be reclassifiedas of the effective date to other long-term liabilitiesbased on the scheduled cash payments. Futureearnings will be affected by mark-to-market adjustmentsfor changes in the fair value of ABB Ltd stock as wellas contingent payments when they becomedeterminable. In the event the Plan is not approved bythe Bankruptcy Court, the ultimate liability for theresolution of asbestos-related personal injury claimscould be substantially revised. Such a revision couldhave a material impact on our financial position, results of operations and liquidity.

ABB Group Financial review 2002 47
Consolidated Income Statements
Year ended December 31 (in millions, except per share data) 2002 2001 (restated) 2000
Revenues $ 18,295 $ 19,382 $ 19,355Cost of sales (13,769) (14,877) (14,198)Gross profit 4,526 4,505 5,157
Selling, general and administrative expenses (4,033) (3,993) (4,055)Amortization expense (41) (195) (190)Other income (expense), net (58) (160) 261Earnings before interest and taxes 394 157 1,173
Interest and dividend income 193 381 387Interest and other finance expense (336) (604) (454)Income (loss) from continuing operations before taxes and minority interest 251 (66) 1,106
Provision for taxes (83) (63) (300)Minority interest (71) (36) (40)Income (loss) from continuing operations 97 (165) 766
Income (loss) from discontinued operations, net of tax (880) (501) 677Cumulative effect of change in accounting principles (SFAS133), net of tax – (63) –Net income (loss) $ (783) $ (729) $ 1,443
Basic earnings (loss) per share:Income (loss) from continuing operations $ 0.09 $ (0.15) $ 0.65Net income (loss) $ (0.70) $ (0.64) $ 1.22
Diluted earnings (loss) per share:Income (loss) from continuing operations $ (0.08) $ (0.15) $ 0.65Net income (loss) $ (0.83) $ (0.64) $ 1.22
See accompanying Notes to the Consolidated Financial Statements.
Consolidated Financial Statements

48 ABB Group Financial review 2002
Consolidated Balance Sheets
December 31(in millions, except share data) 2002 2001 (restated)
Cash and equivalents $ 2,478 $ 2,442Marketable securities 2,135 2,924Receivables, net 7,175 6,692Inventories, net 2,377 2,568Prepaid expenses and other 2,695 2,122Assets in discontinued operations 3,095 5,912Total current assets 19,955 22,660
Financing receivables, non-current 1,802 2,086Property, plant and equipment, net 2,792 2,753Goodwill 2,321 2,188Other intangible assets, net 591 587Prepaid pension and other related benefits 557 387Investments and other 1,515 1,644Total assets $ 29,533 $ 32,305
Accounts payable, trade $ 2,961 $ 2,506Accounts payable, other 2,174 2,517Short-term borrowings and current maturities of long-term borrowings 2,576 4,701Accrued liabilities and other 8,319 7,100Liabilities in discontinued operations 2,384 3,342Total current liabilities 18,414 20,166
Long-term borrowings 5,376 5,003Pension and other related benefits 1,659 1,617Deferred taxes 1,166 1,049Other liabilities 1,647 2,280Total liabilities 28,262 30,115
Minority interest 258 215Stockholders’ equity:
Capital stock and additional paid-in capital, par value CHF 2.50,1,280,009,432 shares authorized, 1,200,009,432 shares issued 2,027 2,028Retained earnings 2,614 3,397Accumulated other comprehensive loss (1,878) (1,700)Less:Treasury stock, at cost (86,830,312 and 86,875,616 shares at December 31, 2002 and 2001, respectively) (1,750) (1,750)
Total stockholders’ equity 1,013 1,975Total liabilities and stockholders’ equity $ 29,533 $ 32,305
See accompanying Notes to the Consolidated Financial Statements.
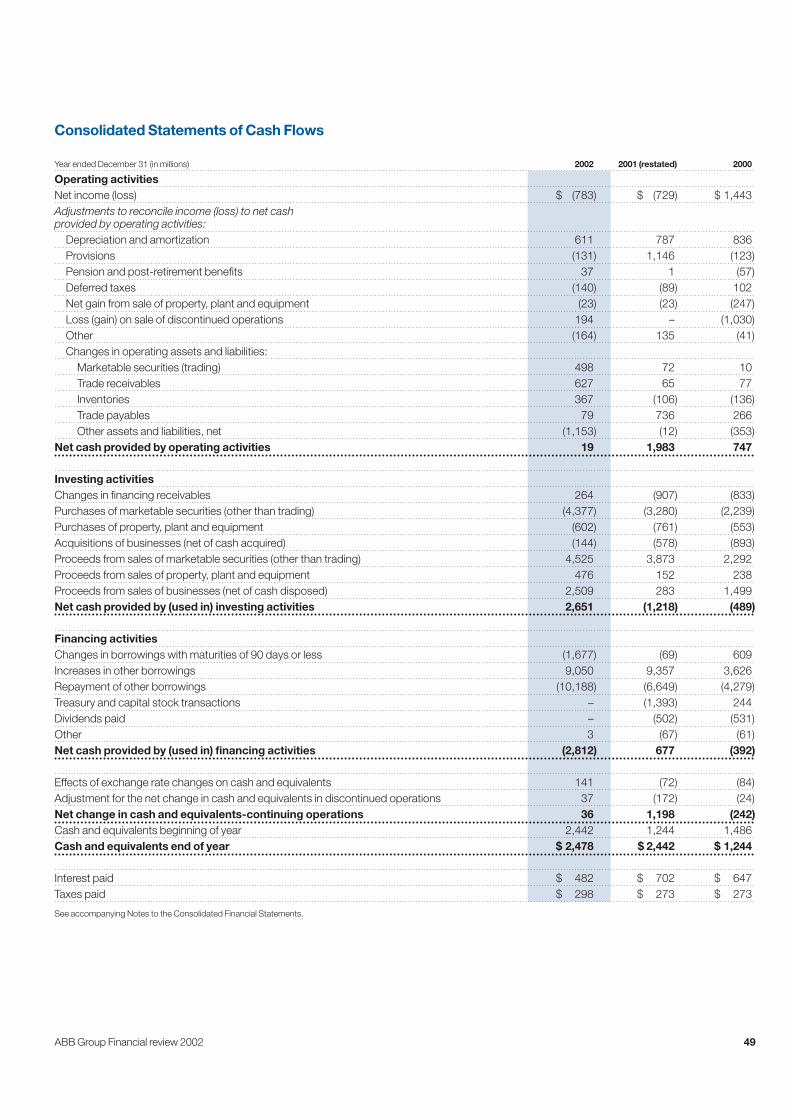
ABB Group Financial review 2002 49
Consolidated Statements of Cash Flows
Year ended December 31 (in millions) 2002 2001 (restated) 2000
Operating activitiesNet income (loss) $ (783) $ (729) $ 1,443Adjustments to reconcile income (loss) to net cash provided by operating activities:
Depreciation and amortization 611 787 836Provisions (131) 1,146 (123)Pension and post-retirement benefits 37 1 (57)Deferred taxes (140) (89) 102Net gain from sale of property, plant and equipment (23) (23) (247)Loss (gain) on sale of discontinued operations 194 – (1,030)Other (164) 135 (41)Changes in operating assets and liabilities:
Marketable securities (trading) 498 72 10Trade receivables 627 65 77Inventories 367 (106) (136)Trade payables 79 736 266Other assets and liabilities, net (1,153) (12) (353)
Net cash provided by operating activities 19 1,983 747
Investing activitiesChanges in financing receivables 264 (907) (833)Purchases of marketable securities (other than trading) (4,377) (3,280) (2,239)Purchases of property, plant and equipment (602) (761) (553)Acquisitions of businesses (net of cash acquired) (144) (578) (893)Proceeds from sales of marketable securities (other than trading) 4,525 3,873 2,292Proceeds from sales of property, plant and equipment 476 152 238Proceeds from sales of businesses (net of cash disposed) 2,509 283 1,499Net cash provided by (used in) investing activities 2,651 (1,218) (489)
Financing activitiesChanges in borrowings with maturities of 90 days or less (1,677) (69) 609Increases in other borrowings 9,050 9,357 3,626Repayment of other borrowings (10,188) (6,649) (4,279)Treasury and capital stock transactions – (1,393) 244Dividends paid – (502) (531)Other 3 (67) (61)Net cash provided by (used in) financing activities (2,812) 677 (392)
Effects of exchange rate changes on cash and equivalents 141 (72) (84)Adjustment for the net change in cash and equivalents in discontinued operations 37 (172) (24)Net change in cash and equivalents-continuing operations 36 1,198 (242)Cash and equivalents beginning of year 2,442 1,244 1,486Cash and equivalents end of year $ 2,478 $ 2,442 $ 1,244
Interest paid $ 482 $ 702 $ 647Taxes paid $ 298 $ 273 $ 273
See accompanying Notes to the Consolidated Financial Statements.
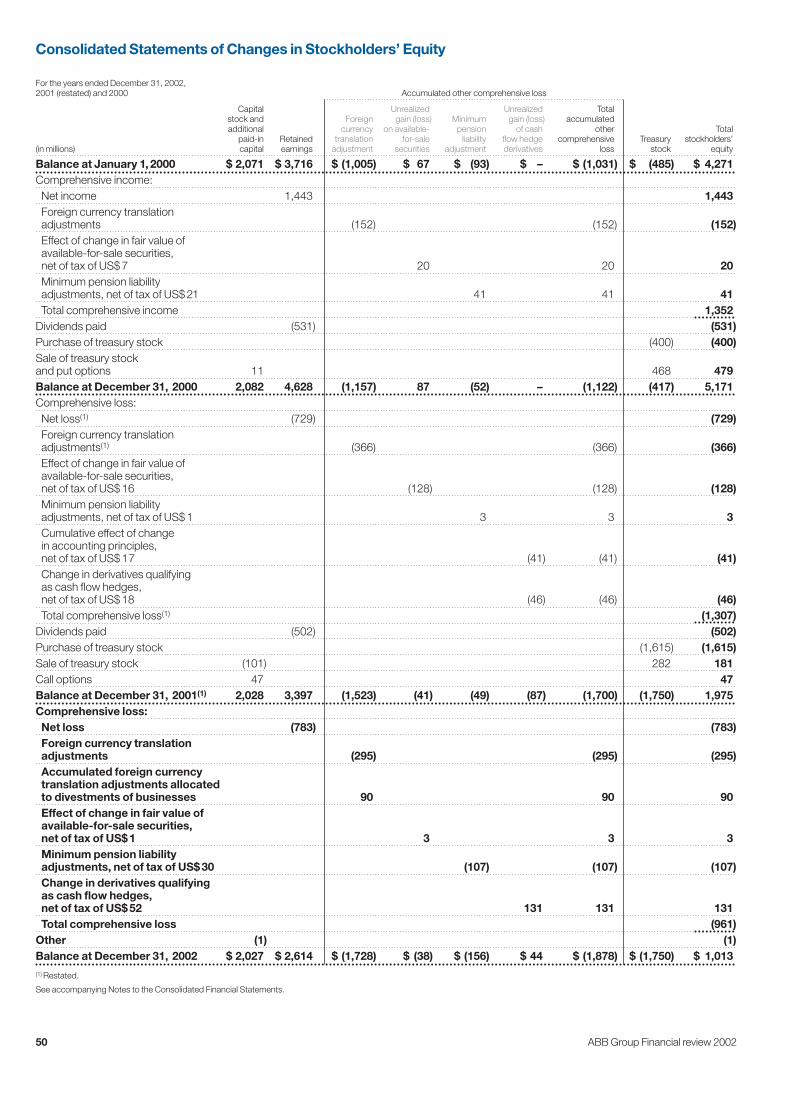
50 ABB Group Financial review 2002
Consolidated Statements of Changes in Stockholders’ Equity
For the years ended December 31, 2002,2001 (restated) and 2000 Accumulated other comprehensive loss
Capital Unrealized Unrealized Totalstock and Foreign gain (loss) Minimum gain (loss) accumulatedadditional currency on available- pension of cash other Total
paid-in Retained translation for-sale liability flow hedge comprehensive Treasury stockholders’(in millions) capital earnings adjustment securities adjustment derivatives loss stock equity
Balance at January 1, 2000 $ 2,071 $ 3,716 $ (1,005) $ 67 $ (93) $ – $ (1,031) $ (485) $ 4,271Comprehensive income:Net income 1,443 1,443Foreign currency translationadjustments (152) (152) (152)Effect of change in fair value ofavailable-for-sale securities,net of tax of US$7 20 20 20Minimum pension liabilityadjustments, net of tax of US$21 41 41 41Total comprehensive income 1,352
Dividends paid (531) (531)Purchase of treasury stock (400) (400)Sale of treasury stockand put options 11 468 479Balance at December 31, 2000 2,082 4,628 (1,157) 87 (52) – (1,122) (417) 5,171Comprehensive loss:Net loss(1) (729) (729)Foreign currency translationadjustments(1) (366) (366) (366)Effect of change in fair value ofavailable-for-sale securities,net of tax of US$16 (128) (128) (128)Minimum pension liabilityadjustments, net of tax of US$1 3 3 3Cumulative effect of changein accounting principles,net of tax of US$17 (41) (41) (41)Change in derivatives qualifyingas cash flow hedges,net of tax of US$18 (46) (46) (46)Total comprehensive loss(1) (1,307)
Dividends paid (502) (502)Purchase of treasury stock (1,615) (1,615)Sale of treasury stock (101) 282 181Call options 47 47Balance at December 31, 2001(1) 2,028 3,397 (1,523) (41) (49) (87) (1,700) (1,750) 1,975Comprehensive loss:Net loss (783) (783)Foreign currency translationadjustments (295) (295) (295)Accumulated foreign currency translation adjustments allocatedto divestments of businesses 90 90 90Effect of change in fair value ofavailable-for-sale securities,net of tax of US$1 3 3 3Minimum pension liabilityadjustments, net of tax of US$30 (107) (107) (107)Change in derivatives qualifyingas cash flow hedges,net of tax of US$52 131 131 131Total comprehensive loss (961)
Other (1) (1)Balance at December 31, 2002 $ 2,027 $ 2,614 $ (1,728) $ (38) $ (156) $ 44 $ (1,878) $ (1,750) $ 1,013(1) Restated.
See accompanying Notes to the Consolidated Financial Statements.

ABB Group Financial review 2002 51
Notes to the Consolidated Financial Statements(U.S. dollar amounts in millions, except per share amounts)
Note 1 The company and management overviewABB Ltd is a leading global company in power and automation technologies organized in four core business divisions: Utilities, Industries, PowerTechnology Products and Automation Technology Products. In addition, ABB Ltd has grouped certain of its other businesses into Non-Core Activities.In October 2002, to further sharpen its focus on power and automation technologies for utility and industry customers, ABB Ltd announced a simplified structure, effective January 1, 2003, consisting of two new core divisions: Power Technologies and Automation Technologies (see Note 25to the Consolidated Financial Statements).
Management overviewABB Ltd’s exposure to asbestos claims and its high debt levels have weighed heavily on ABB Ltd during recent years and have forced management tofocus intensely on ensuring ABB Ltd’s ability to continue on a going concern basis.
In 2001 and 2002, ABB Ltd incurred significant net losses, partly as a result of a greater-than-anticipated increase in the number of and amountsdemanded to settle certain asbestos-related claims against its subsidiary, Combustion Engineering (see Note 17), as well as the weak performance ofthe businesses that are now classified as non-core activities and discontinued operations and an overall weakening of global markets. These operatinglosses, combined with the effect of a repurchase of ABB Ltd shares in 2001 and other factors, have decreased ABB Ltd’s consolidated stockholders’equity from $ 5.2 billion at December 31, 2000 to $1.0 billion at December 31, 2002. ABB Ltd’s low equity base, high debt levels and the uncertaintywith respect to the timing of the resolution to the asbestos issue have impacted ABB Ltd’s ability to finance its core and non-core operations andto repay maturing debt.
With respect to the asbestos issue, based on current information, ABB Ltd expects that the initiated proceedings will provide an adequate resolution tothe issue as discussed in more detail in Note 17. However, until Combustion Engineering’s pre-packaged Chapter 11 plan of reorganization is finallyapproved and injunctive relief has been provided to bar future claims from being made, the ultimate settlement amount of asbestos-related claims andthe potential exposure to liability for Combustion Engineering’s asbestos-related claims remain uncertain.
In late 2001 and during 2002, the commercial paper market, on which ABB Ltd had significantly relied in the past, largely diminished as a funding sourceand ABB Ltd’s credit rating fell below investment grade. As a consequence, ABB Ltd has faced challenges to replace or repay maturing short-term debtduring 2002. On December 17, 2002, as a replacement of credit facilities obtained in December 2001 and during 2002, ABB Ltd entered into a 364-day$1.5 billion credit facility to fund ongoing liquidity requirements. Details of the credit facility as well as the maturing short-term debt in 2003 are more fully discussed in Note 14.
Given ABB Ltd’s financial position, the weak performance in non-core/discontinued activities and the overall status of the international financial markets,ABB Ltd had to accept a number of stringent covenants in the new facility agreement (see Note 14), including requirements to meet asset divestmentproceeds targets, the fulfillment of which is a condition to the continued availability of funding under the terms of the facility. ABB Ltd also had to providesecurity for the facility.
Management believes that the important steps taken in 2002, including the divestment of a large portion of the Structured Finance business (see Note3), significant debt reduction and refinancing of short-term debt to extend the maturity profile of ABB Ltd’s debt (see Note 14), introduction of a simplifiedorganizational structure, and continuous strong performance of core businesses, as well as its plans for 2003, should ensure continued availability ofthe credit facility during 2003 (maximum of $ 1.5 billion).
However, because of the stringent nature of the covenants in the credit facility, management believes that it is prudent to plan for possible adversedevelopments that may jeopardize ABB Ltd’s ability to rely on continued funding under the credit facility. Therefore, ABB Ltd’s Board of Directorsproposes to the annual shareholders’ meeting that the shareholders approve an amendment to the existing provisions in the Articles of Incorporation oncontingent share capital as to (i) a substantial increase of the contingent capital which would consequently allow the issuance of new ABB Ltd shares,and (ii) an extension of the use of the contingent capital for new financial instruments (such as convertible bonds).
Management’s principal plans for 2003 include intensified operational improvements of the core businesses, for example, through the “Step change”program (see Note 24). Management’s plans also include continued large divestments that it estimates will contribute proceeds in excess of $2 billion (in particular ABB Ltd’s Oil, Gas and Petrochemical division, Buildings Systems business, remaining parts of the Structured Finance business and theEquity Ventures business), the closing of non-core activities and the reduction of total debt by applying the proceeds received from these divestments.
Note 2 Significant accounting policiesThe following is a summary of significant accounting policies followed in the preparation of these Consolidated Financial Statements.
Basis of presentationThe Consolidated Financial Statements are prepared on the basis of United States (U.S.) generally accepted accounting principles (GAAP) and arepresented in U.S. dollars ($) unless otherwise stated. Par value of capital stock is denominated in Swiss francs (CHF).
The number of shares and earnings per share data in the Consolidated Financial Statements have been presented as if the four-for-one split of ABB Ltdshares in May 2001 had occurred as of the earliest period presented.
Scope of consolidationThe Consolidated Financial Statements include 100 percent of the assets, liabilities, revenues, expenses, income, loss and cash flows of ABB Ltd andcompanies in which ABB Ltd has a controlling interest (subsidiaries), as if ABB Ltd and its subsidiaries (collectively, the “Company”) were a singlecompany. Significant intercompany accounts and transactions have been eliminated. Minority interest is calculated for entities fully consolidated but notwholly owned. The components of net income and equity attributable to the minority shareholders are presented in the minority interest line itemsincluded in the Consolidated Income Statement and Consolidated Balance Sheet.

52 ABB Group Financial review 2002
Note 2 Significant accounting policies, continuedInvestments in joint ventures and affiliated companies in which the Company has significant influence, but less than a controlling voting interest, areaccounted for using the equity method. This is generally presumed to exist when the Company owns between 20 percent and 50 percent of theinvestee. In certain circumstances, the Company’s ownership of an investee exceeds 50 percent but it accounts for the investment using the equitymethod because it does not have a controlling interest due to certain rights of minority shareholders which allow them to participate in significant day-to-day operating and financial decisions of the investee.
Under the equity method, the Company’s investment in and amounts due to and from an equity investee are included in the Consolidated BalanceSheet; the Company’s share of an investee’s earnings is included in the Consolidated Income Statement; and the dividends, cash distributions, loansor other cash received from the investee, additional cash investments, loan repayments or other cash paid to the investee, are included in theConsolidated Balance Sheet and the Consolidated Statement of Cash Flows. Additionally, the carrying value of investments accounted for using theequity method of accounting are adjusted downward to reflect any other-than-temporary declines in value.
Investments in non-public companies in which the Company does not have a controlling interest, or an ownership and voting interest sufficiently largeto exert significant influence, are accounted for at cost. Dividends and other distributions of earnings from these investments are included in incomewhen received.
Use of estimatesThe preparation of financial statements in conformity with U.S. GAAP requires management to make estimates and assumptions that affect reportedamounts and related disclosures. Actual results could differ from those estimates.
Reclassifications and restatementsAmounts reported for prior years in these Consolidated Financial Statements and Notes have been reclassified to conform to the current year’spresentation.
As more fully described in Note 13 to the Consolidated Financial Statements, the Company has restated its 2001 Consolidated Financial Statementsand Notes thereto to reflect changes in the Company’s share of the earnings (losses) of an equity-accounted investee that restated its 2001 earnings to correct an error in accounting for the fair value of certain financial instruments.
Concentrations of credit riskThe Company sells a broad range of products, systems and services to a wide range of industrial and commercial customers throughout the world.Concentrations of credit risk with respect to trade receivables are limited due to a large number of customers comprising the Company’s customerbase. Ongoing credit evaluations of customers’ financial position are performed and, generally, no collateral is required.
Subsequent to the sale of a significant portion of the Structured Finance business during 2002, the Financial Services activities of the Company aresubstantially reduced. As a consequence of this divestment, the concentration of credit risk in the Company’s remaining lease and loan portfolio hasincreased. To control the remaining credit risks, the Company continues to apply specific policies and procedures, including those for the identification,evaluation and mitigation of credit risks. Such policies and procedures include measurements to develop and ensure the maintenance of a diversifiedportfolio through the active monitoring of counterparty, country and industry exposure.
The Company maintains reserves for potential credit losses and such losses, in the aggregate, have not exceeded management’s expectations.
It is Company policy to invest cash in deposits with banks throughout the world and in other high quality, liquid marketable securities (such ascommercial paper, government agency notes and asset-backed securities). The Company actively monitors its credit risk by routinely reviewing thecredit worthiness of the investments held and by maintaining such investments in deposits or liquid securities. The Company has not incurred significantcredit losses related to such investments.
The Company’s exposure to credit risk on derivative financial instruments is the risk that a counterparty will fail to meet its obligations. To reduce this risk,the Company has credit policies which require the establishment and review of credit limits for individual counterparties. In addition, close-out nettingagreements have been entered into with most counterparties. Close-out netting agreements are agreements which provide for the termination, valuationand net settlement of some or all outstanding transactions between two counterparties on the occurrence of one or more pre-defined trigger events.
Cash and equivalentsCash and equivalents include highly liquid investments with original maturities of three months or less.
Marketable securitiesDebt and equity securities are classified as either trading or available-for-sale at the time of purchase and are carried at fair value. Debt and equitysecurities that are bought and held principally for the purpose of sale in the near term are classified as trading securities and unrealized gains and lossesare included in the determination of net income. Unrealized gains and losses on available-for-sale securities are excluded from the determination of net income and are accumulated as a component of other comprehensive loss until realized. Realized gains and losses on available-for-sale securitiesare computed based upon historical cost of these securities applied using the specific identification method. Declines in fair values of available-for-saleinvestments that are other-than-temporary are included in the determination of net income.
The Company analyzes its available-for-sale securities for impairment when the fair values of individual securities have been below their cost basis for aperiod exceeding nine months or when other events indicate the need for assessment. The Company records an impairment charge through currentperiod earnings and adjusts the cost basis for such other-than-temporary declines in fair value when the fair value is not anticipated to recover abovecost within a three-month period after the measurement date unless there are mitigating factors that indicate an impairment charge through earningsmay not be required. If an impairment charge is recorded, subsequent recoveries in fair value are not reflected in earnings until sale of the security.
(U.S. dollar amounts in millions, except per share amounts)

ABB Group Financial review 2002 53
Note 2 Significant accounting policies, continuedRevenue recognitionThe Company recognizes revenues in accordance with the United States Securities and Exchange Commission’s Staff Accounting Bulletin No.101(SAB 101), Revenue Recognition in Financial Statements. The Company recognizes substantially all revenues from the sale of manufactured productsupon transfer of title including the risks and rewards of ownership to the customer which generally occurs upon shipment of products. On contracts forsale of manufactured products requiring installation which can only be performed by the Company, revenues are deferred until installation of theproducts is complete. Revenues from short-term fixed-price contracts to deliver services are recognized upon completion of required services to thecustomer. Revenues from contracts which contain customer acceptance provisions are deferred until customer acceptance occurs or the contractualacceptance period has lapsed.
Sales under long-term fixed-price contracts are recognized using the percentage-of-completion method of accounting. The Company principally usesthe cost-to-cost or delivery events method to measure progress towards completion on contracts. Management determines the method to be used foreach contract based on its judgment as to which method best measures actual progress towards completion.
Anticipated costs for warranties on products are accrued upon sales recognition on the related contracts. Losses on fixed-price contracts arerecognized in the period when they are identified and are based upon the anticipated excess of contract costs over the related contract sales.
Sales under cost-reimbursement contracts are recognized as costs are incurred. Shipping and handling costs are recorded as a component of cost ofsales.
ReceivablesThe Company accounts for the securitization of trade receivables in accordance with Statement of Financial Accounting Standards No. 140 (SFAS 140),Accounting for Transfers and Servicing of Financial Assets and Extinguishments of Liabilities. SFAS 140 requires an entity to recognize the financial andservicing assets it controls and the liabilities it has incurred and to derecognize financial assets when control has been surrendered as evaluated inaccordance with the criteria provided in SFAS 140.
The Company accounts for the transfer of its receivables to Qualifying Special Purpose Entities (QSPEs) as a sale of those receivables to the extent thatconsideration other than beneficial interests in the transferred accounts receivable is received. The Company does not recognize the transfer as a sale unless the receivables have been put presumptively beyond the reach of the Company and its creditors, even in bankruptcy or other receivership. In addition, the QSPEs must obtain the right to pledge or exchange the transferred receivables, and the Company cannot retain the ability or obligationto repurchase or redeem the transferred receivables.
At the time the receivables are sold, the balances are removed from trade receivables and a retained interest or deferred purchase price component is recorded in other receivables. The retained interest is recorded at its estimated fair value. Costs associated with the sale of receivables are included in the determination of current earnings.
From time to time, the Company may, in its normal course of business, sell receivables outside the securitization programs with or without recourse.Sales and transfers that do not meet the requirements of SFAS 140 are accounted for as secured borrowings.
InventoriesInventories are stated at the lower of cost (determined using either the first-in, first-out or the weighted average cost method) or market. Inventoriedcosts relating to percentage-of-completion contracts are stated at actual production costs, including overhead incurred to date, reduced by amountsidentified with sales recognized.
Impairment of long-lived assets and accounting for discontinued operationsEffective January 1, 2002, the Company adopted Statement of Financial Accounting Standards No. 144 (SFAS 144), Accounting for the Impairment orDisposal of Long-Lived Assets, which superceded Statement of Financial Accounting Standards No. 121 (SFAS 121), Accounting for the Impairment ofLong-Lived Assets and for Long-Lived Assets to Be Disposed Of, yet retained the fundamental provisions of SFAS 121 related to the recognition andmeasurement of the impairment of long-lived assets (i.e., property, plant, and equipment and identifiable intangibles) to be “held and used”. Whenevents or circumstances indicate the carrying amount of a long-lived asset that is being held and used may not be recoverable, the Company assessesimpairment by comparing an asset’s net undiscounted cash flows expected to be generated over its remaining useful life to the asset’s net carryingvalue. If impairment is indicated, the carrying amount of the asset is reduced to its estimated fair value.
In accordance with SFAS 144, the Company segregates on its Consolidated Balance Sheet the assets (or groups of assets and related liabilities) thatduring 2002 met certain restrictive criteria regarding the Company’s commitment to plans for disposal. Depreciation and amortization cease when theasset meets the criteria to be classified as held for sale. If (1) a planned or completed disposal involves a component of the Company whose operationsand cash flows can be distinguished operationally and for financial reporting purposes; (2) such operations and cash flows will be (or have been)eliminated from the Company’s ongoing operations; and (3) the Company will not have any significant continuing involvement in the component, thenthe component’s results of operations are presented as discontinued operations for all periods. Operating losses from discontinued operations arerecognized in the period in which they occur. Interest expense is allocated to discontinued operations in accordance with Emerging Issues Task ForceNo. 87-24, Allocation of Interest to Discontinued Operations. Long-lived assets (or groups of assets and related liabilities) classified as held for sale or as discontinued operations are measured at the lower of carrying amount or fair value less cost to sell.
In connection with the adoption of SFAS 144, the Company elected to cease presenting cash flows from discontinued operations as a single line andinstead present the relevant amounts within cash flows from operating and investing activities. Accordingly, the cash flows associated with disposals in2000 have been reclassified to conform to the current year’s presentation.
(U.S. dollar amounts in millions, except per share amounts)

54 ABB Group Financial review 2002
Note 2 Significant accounting policies, continuedPrior to adoption of SFAS 144, the Company accounted for discontinued operations in accordance with APB Opinion No. 30, Reporting the Results of Operations – Reporting the Effects of Disposal of a Segment of a Business, and Extraordinary, Unusual and Infrequently Occurring Events andTransactions, in which only the results of operations of a segment or major line of business that has been sold, abandoned, or otherwise disposed of, or is the subject of a formal plan for disposal, could be classified as discontinued operations. Segments or major lines of business classified as discontinued operations were measured at the lower of carrying amount or net realizable value, including an estimate of future operating lossesexpected to be incurred.
Goodwill and other intangible assetsThe excess of cost over the fair value of net assets of acquired businesses is recorded as goodwill. The Company accounts for its goodwill inaccordance with Statement of Financial Accounting Standards No. 142 (SFAS 142), Goodwill and Other Intangible Assets. Under SFAS 142 goodwillfrom acquisitions completed after June 30, 2001, has not been amortized. The total amount of goodwill recognized on acquisitions completed afterJune 30, 2001, was not significant. Beginning from January 1, 2002, goodwill has not been amortized. For years prior to January 1, 2002, the goodwillhad been amortized on a straight-line basis over periods ranging from 3 to 20 years. In accordance with SFAS 142, goodwill is tested annually forimpairment on October 1st and also upon the occurrence of significant events. The Company uses a discounted cash flow model to determine the fairvalue of reporting units containing goodwill to measure the potential impairment of such goodwill.
The cost of acquired intangibles is amortized on a straight-line basis over their estimated useful lives, typically ranging from 3 to 10 years. Intangibleassets are tested for impairment upon the occurrence of certain triggering events.
Capitalized software costsThe Company expenses costs incurred in the preliminary project stage, and thereafter capitalizes costs incurred in developing or obtaining software.Capitalized costs of software for internal use are accounted for in accordance with Statement of Position 98-1, Accounting for the Costs of ComputerSoftware Developed or Obtained for Internal Use, and are amortized on a straight-line basis over the estimated useful life of the software, typicallyranging from 3 to 5 years. Capitalized costs of a software product to be sold are accounted for in accordance with Statement of Financial AccountingStandards No. 86, Accounting for the Costs of Computer Software to Be Sold, Leased, or Otherwise Marketed, and are carried at the lower ofunamortized cost or net realizable value until the product is released to customers, at which time capitalization ceases and costs are amortized on astraight-line basis over the estimated life of the product.
Property, plant and equipmentProperty, plant and equipment is stated at cost, less accumulated depreciation, using the straight-line method over the estimated useful lives of theassets as follows: 10 to 50 years for buildings and leasehold improvements and 3 to 15 years for machinery and equipment.
Derivative financial instrumentsThe Company uses derivative financial instruments to manage interest rate and currency exposures, and to a lesser extent commodity exposures,arising from its global operating, financing and investing activities. The Company’s policies require that the industrial entities economically hedge all contracted foreign exposures, as well as at least fifty percent of the anticipated sales volume of standard products over the next twelve months. In addition, derivative financial instruments were also used for proprietary trading purposes within the Company’s former Financial Services division andwithin limits determined by the Company’s Board of Directors until June 2002, when the Company ceased entering into new positions.
Change in accounting principlesOn January 1, 2001, the Company adopted Statement of Financial Accounting Standards No. 133, Accounting for Derivative Instruments and HedgingActivities, as subsequently amended (SFAS 133). SFAS 133 requires the Company to recognize all derivatives, other than certain derivatives indexed tothe Company’s own stock, on the Consolidated Balance Sheet at fair value. Derivatives that are not designated as hedges must be adjusted to fair valuethrough income. If the derivatives are designated as a hedge, depending on the nature of the hedge, changes in the fair value of the derivatives will eitherbe offset against the change in fair value of the hedged assets, liabilities, or firm commitments through earnings or recognized in accumulated othercomprehensive loss until the hedged item is recognized in earnings. The ineffective portion of a derivative’s change in fair value is immediatelyrecognized in earnings.
The Company accounted for the adoption of SFAS 133 as a change in accounting principle. Based on the Company’s outstanding derivatives atJanuary 1, 2001, the Company recognized the cumulative effect of the accounting change as a loss in the Consolidated Income Statement ofapproximately $ 63 million, net of tax (basic and diluted loss per share of $ 0.06), and a reduction to equity of $ 41 million, net of tax, in accumulated other comprehensive loss.
Forward foreign exchange contracts are the primary instrument used to manage foreign exchange risk. Where forward foreign exchange contracts aredesignated as cash flow hedges under SFAS 133, changes in their fair value are recorded in the accumulated other comprehensive loss component of stockholders’ equity, net of tax, until the hedged item is recognized in earnings. The Company also enters into forward foreign exchange contractsthat serve as economic hedges of existing assets and liabilities. These are not designated as accounting hedges under SFAS 133 and, consequently,changes in their fair value are reported in earnings where they offset the gain or loss on the foreign currency denominated asset or liability.
To reduce its interest rate and currency exposure arising from its funding activities and to hedge specific assets, the Company uses interest rate andcurrency swaps. Where interest rate swaps are designated as fair value hedges, the changes in value of the swaps are recognized in earnings, as are the changes in the value of the underlying assets or liabilities. Where such interest rate swaps do not qualify for the short cut method as definedunder SFAS 133, any ineffectiveness is included in earnings. Where interest rate swaps are designated as cash flow hedges, their change in value is recognized in the accumulated other comprehensive loss component of stockholders’ equity, net of tax, until the hedged item is recognized in earnings.
(U.S. dollar amounts in millions, except per share amounts)

ABB Group Financial review 2002 55
Note 2 Significant accounting policies, continuedAll other swaps, futures, options and forwards which are designated as effective hedges of specific assets, liabilities or committed or forecastedtransactions are recognized in earnings consistent with the effects of hedged transactions.
If an underlying hedged transaction is terminated early, the hedging derivative financial instrument is treated as if terminated simultaneously, with anygain or loss on termination of the derivative immediately recognized in earnings. Where derivative financial instruments have been designated as hedgesof forecasted transactions, and such forecasted transactions no longer become probable of occurring, hedge accounting ceases and any derivativegain or loss previously included in the accumulated other comprehensive loss component of stockholders’ equity is reclassified into earnings.
Certain commercial contracts may grant rights to the Company or other counterparties, or contain other provisions considered to be derivatives underSFAS 133. Such embedded derivatives are assessed at inception of the contract and depending on their characteristics accounted for as separatederivative instruments pursuant to SFAS 133.
Prior to implementation of SFAS 133 – year 2000Prior to January 1, 2001, instruments which were used as hedges had to be effective at reducing the risk associated with the exposure being hedgedand had to be designated as a hedge at the inception of the contract. Accordingly, changes in market values of hedge instruments had to be highlycorrelated with changes in the market values of the underlying hedged items, both at inception of the hedge and over the life of the hedge contract. Anyderivative that was not designated as a hedge, or was so designated but was ineffective, or was in connection with anticipated transactions, wasmarked to market and recognized in earnings.
Gains and losses on foreign currency hedges of existing assets or liabilities were recognized in income consistent with the hedged item. Gains and losses on foreign currency hedges of firm commitments were deferred and recognized in income as part of the hedged transaction. Other foreignexchange contracts were marked to market and recognized in earnings.
Interest rate and currency swaps that were designated as hedges of borrowings or specific assets were accounted for on an accrual basis and wererecorded as an adjustment to the interest income or expense of the underlying asset or liability over its life.
All other swaps, futures, options and forwards which were designated as effective hedges of specific assets, liabilities, or committed transactions, wererecognized consistent with the effects of hedged transactions.
If the underlying hedged transaction was terminated early, the hedging derivative financial instrument was terminated simultaneously, with any gains orlosses recognized immediately. Gains or losses arising from early termination of a derivative financial instrument of an effective hedge were accountedfor as adjustments to the basis of the hedged transaction.
Derivative financial instruments used in the Company’s trading activities were marked to market and recognized in earnings.
Insurance The following accounting policies apply specifically to the Insurance business area.
Premiums and acquisition costsPremiums are generally earned pro rata over the period coverage is provided and are reflected in revenues in the Consolidated Income Statement.Premiums earned include estimates of certain premiums due, including adjustments on retrospectively rated contracts. Premium receivables includepremiums relating to retrospectively rated contracts that represent the estimate of the difference between provisional premiums received and theultimate premiums due. Unearned premiums represent the portion of premiums written that is applicable to the unexpired terms of reinsurancecontracts or certificates in force. These unearned premiums are calculated by the monthly pro rata method or are based on reports from cedingcompanies. Acquisition costs are costs related to the acquisition of new business and renewals. These costs are deferred and charged against earningsratably over the terms of the related policy.
Profit commissionCertain contracts carry terms and conditions that result in the payment of profit commissions. Estimates of profit commissions are reviewed based onunderwriting experience to date and, as adjustments become necessary, such adjustments are reflected in current operations.
Loss and loss adjustment expensesLoss and loss adjustment expenses are charged to operations as incurred and are reflected in cost of sales in the Consolidated Income Statement. Theliabilities for unpaid loss and loss adjustment expenses, reflected in accrued liabilities, other, are determined on the basis of reports from cedingcompanies and underwriting associations, as well as estimates by management and in-house actuaries, including those for incurred but not reportedlosses, salvage and subrogation recoveries. Inherent in the estimates of losses are expected trends of frequency, severity and other factors that couldvary significantly as claims are settled. Accordingly, ultimate losses could vary from the amounts provided for in these Consolidated FinancialStatements.
FeesContracts that neither result in the transfer of insurance risk nor the reasonable possibility of significant loss to the reinsurer are accounted for asfinancing arrangements rather than reinsurance. Consideration received for such contracts is reflected as accounts payable, other, and are amortizedon a pro rata basis over the life of the contract.
(U.S. dollar amounts in millions, except per share amounts)

56 ABB Group Financial review 2002
Note 2 Significant accounting policies, continuedFunds withheldUnder the terms of certain reinsurance agreements, the ceding reinsurer retains a portion of the premium to provide security for expected losspayments. The funds withheld are generally invested by the ceding reinsurer and earn an investment return that becomes additional funds withheld.
ReinsuranceThe Company seeks to reduce the loss that may arise from catastrophes and other events that may cause unfavorable underwriting results byreinsuring certain levels of risks with other insurance enterprises or reinsurers. Reinsurance contracts are accounted for by reducing premiums earnedby amounts paid to the reinsurers. Recoverable amounts are established for paid and unpaid losses and loss adjustment expense ceded to thereinsurer. Amounts recoverable from the reinsurer are estimated in a manner consistent with the claim liability associated with the reinsurance policy.Contracts where it is not reasonably possible that the reinsurer may realize a significant loss from the insurance risk generally do not meet the conditionsfor reinsurance accounting and are recorded as deposits.
Translation of foreign currencies and foreign exchange transactionsThe functional currency for most of the Company’s operations is the applicable local currency. The translation from the applicable functional currenciesinto the Company’s reporting currency is performed for balance sheet accounts using exchange rates in effect at the balance sheet date, and forincome statement accounts using average rates of exchange prevailing during the year. The resulting translation adjustments are excluded from thedetermination of net income and are accumulated as a component of other comprehensive loss until the entity is sold or substantially liquidated.
Foreign currency transactions, such as those resulting from the settlement of foreign currency denominated receivables or payables, are included in thedetermination of net income, except as they relate to intra-Company loans that are equity-like in nature with no reasonable expectation of repaymentwhich are accumulated as a component of other comprehensive loss.
In highly inflationary countries, monetary balance sheet positions in local currencies are converted into U.S. dollars at the year-end rate. Fixed assets arekept at historical U.S. dollar values from acquisition dates. Sales and expenses are converted at the exchange rates prevailing upon the date of thetransaction. All translation gains and losses from restatement of balance sheet positions are included in the determination of net income.
TaxesThe Company uses the asset and liability method to account for deferred taxes. Under this method, deferred tax assets and liabilities are determinedbased on temporary differences between the financial reporting and the tax bases of assets and liabilities. Deferred taxes and liabilities are measuredusing enacted tax rates and laws that will be in effect when the differences are expected to reverse. In assessing the realizability of deferred tax assets,management considers whether it is more likely than not that the deferred tax assets will be realizable.
Generally, deferred taxes are not provided on the unremitted earnings of subsidiaries as it is expected that these earnings are permanently reinvested.Such earnings may become taxable upon the sale or liquidation of these subsidiaries or upon the remittance of dividends. Deferred taxes are provided insituations where the Company’s subsidiaries plan to make future dividend distributions.
Research and developmentResearch and development expense was $ 550 million, $ 593 million and $ 660 million in 2002, 2001 and 2000, respectively. These costs are includedin selling, general and administrative expenses.
Earnings per shareBasic earnings per share is calculated by dividing income by the weighted-average number of shares outstanding during the year. Diluted earnings pershare is calculated by dividing income by the weighted-average number of shares outstanding during the year, assuming that all potentially dilutivesecurities were exercised and that any proceeds from such exercises were used to acquire shares of the Company’s stock at the average market priceduring the year or the period the securities were outstanding, if shorter. Potentially dilutive securities comprise: outstanding written call options, if dilutive;the securities issued under the Company’s management incentive plan, to the extent the average market price of the Company’s stock exceeded theexercise prices of such instruments; shares issuable in relation to outstanding convertible bonds, if dilutive; and outstanding written put options, forwhich net share settlement at average market price of the Company’s stock was assumed, if dilutive (see Notes 21 and 23).
Stock-based compensationThe Company has a management incentive plan under which it offers stock warrants to key employees, for no consideration. The plan is describedmore fully in Note 21. The Company accounts for the warrants using the intrinsic value method of APB Opinion No. 25 (APB 25), Accounting for StockIssued to Employees, as permitted by Statement of Financial Accounting Standards No. 123 (SFAS 123), Accounting for Stock Based Compensation.All warrants were issued with exercise prices greater than the market prices of the stock on the dates of grant. Accordingly, the Company has recordedno compensation expense related to the warrants, except in circumstances when a participant ceases to be employed by a consolidated subsidiary,such as after a divestment by the Company. The following table illustrates the effect on net income and earnings per share (see Note 23) if the Companyhad applied the fair value recognition provisions of SFAS 123 to stock-based employee compensation. Fair value of the warrants was determined on thedate of grant by using the Binomial option model (see Note 21).
(U.S. dollar amounts in millions, except per share amounts)

ABB Group Financial review 2002 57
Note 2 Significant accounting policies, continuedYear ended December 31, 2002 2001 2000
Net income (loss), as reported $ (783) $ (729) $ 1,443Less: Total stock-based employee compensation expense determined under fair value based method for all awards, net of related tax effects (22) (22) (20)Pro forma net income (loss) $ (805) $ (751) $ 1,423
Earnings per share:Basic – as reported $ (0.70) $ (0.64) $ 1.22Basic – pro forma $ (0.72) $ (0.66) $ 1.21
Diluted – as reported $ (0.83) $ (0.64) $ 1.22Diluted – pro forma $ (0.85) $ (0.66) $ 1.20
New accounting standardsIn June 2001, the Financial Accounting Standards Board issued Statement of Financial Accounting Standards No.141, Business Combinations, andStatement of Financial Accounting Standards No.142 (SFAS 142), Goodwill and Other Intangible Assets, which modified the accounting for businesscombinations, goodwill and identifiable intangible assets. All business combinations initiated after June 30, 2001, must be accounted for by thepurchase method. Goodwill from acquisitions completed after that date is not amortized, but charged to operations when specified tests indicate thatthe goodwill is impaired, that is, when the goodwill’s fair value is lower than its carrying value. Certain intangible assets are recognized separately fromgoodwill, and are amortized over their useful lives. During 2002, all goodwill was required to be tested for impairment as of January 1, 2002, with atransition adjustment recognized for any impairment found. The Company determined that no impairment of goodwill existed at January 1, 2002. Allgoodwill amortization also ceased at that date. The Company recognized goodwill amortization expense in continuing operations of $ 155 millionand $ 152 million in 2001 and 2000, respectively, and goodwill amortization expense in discontinued operations of $ 36 million and $ 22 million in 2001and 2000, respectively. Accordingly, loss from continuing operations in 2001 and income from continuing operations in 2000 would have been $ 10million ($ 0.01 per share) and $ 918 million ($ 0.77 per share), respectively, and net loss in 2001 and net income in 2000 would have been $ 538 million($ 0.48 per share) and $ 1,617 million ($ 1.36 per share), respectively, if the Company had not recognized amortization expense for goodwill that is nolonger being amortized in accordance with SFAS 142.
In June 2001, the Financial Accounting Standards Board issued Statement of Financial Accounting Standards 143 (SFAS 143), Accounting for AssetRetirement Obligations, which is effective for fiscal years beginning after June 15, 2002, and requires that the fair value of a legal obligation associatedwith the retirement of tangible long-lived assets be recognized in the period in which it is incurred. The associated asset retirement costs are capitalizedas part of the carrying amount of the asset and allocated to expense over its useful life. The Company adopted SFAS 143 effective January 1, 2003.The Company does not expect SFAS 143 to have a material impact on its results of operations.
In August 2001, the Financial Accounting Standards Board issued Statement of Financial Accounting Standards No. 144 (SFAS 144), Accounting forthe Impairment or Disposal of Long-Lived Assets. This Statement supersedes Statement of Financial Accounting Standards No. 121, Accounting forthe Impairment of Long-Lived Assets and for Long-lived Assets to Be Disposed Of, while retaining many of its requirements regarding impairment lossrecognition and measurement. In addition, the new Statement broadens the presentation of discontinued operations to include more sold andabandoned businesses. The Company adopted this statement effective January 1, 2002, and, as a result, reflected the assets, liabilities and results ofoperations of several businesses and groups of assets as discontinued operations for all periods presented to the extent these businesses and groupsof assets met the new criteria during 2002. Disposals and abandonments in previous years were not re-evaluated or reclassified.
In April 2002, the Financial Accounting Standards Board issued Statement of Financial Accounting Standards No. 145, Rescission of FASBStatements No. 4, 44 and 64, Amendment of FASB Statement No. 13, and Technical Corrections, which rescinds previous requirements to reflect allgains and losses from debt extinguishment as extraordinary. The Company elected to early adopt the new standard effective April 1, 2002, and, as aresult, the gains from extinguishment of debt of $ 12 million recorded as extraordinary items in 2001, are no longer reflected in extraordinary items.
In June 2002, the Financial Accounting Standards Board issued Statement of Financial Accounting Standards No. 146, Accounting for CostsAssociated with Exit or Disposal Activities, which requires that a liability for a cost associated with an exit or disposal activity be recognized when theliability is incurred. The standard is effective January 1, 2003 and is to be applied to restructuring plans initiated after that date.
In November 2002, the Financial Accounting Standards Board issued Interpretation No. 45 (FIN 45), Guarantor’s Accounting and Disclosure Requirementsfor Guarantees, Including Indirect Guarantees of Indebtedness of Others. FIN 45 requires the guarantor to recognize a liability for the non-contingentcomponent of a guarantee; that is, the obligation to stand ready to perform in the event that specified triggering events or conditions occur. The initialmeasurement of this liability is the fair value of the guarantee at its inception. The recognition of the liability is required even if it is not probable thatpayments will occur under the guarantee or if the guarantee was issued with a premium payment or as part of a transaction with multiple elements. FIN 45 also requires additional disclosures related to guarantees. The recognition measurement provisions of FIN 45 are effective for all guaranteesentered into or modified after December 31, 2002. The Company has adopted the disclosure requirements of FIN 45 as of December 31, 2002.
In December 2002, the Financial Accounting Standards Board issued Statement of Financial Accounting Standards No. 148 (SFAS 148), Accountingfor Stock-Based Compensation – Transition and Disclosure. An Amendment of FASB Statement No. 123. The Company has elected to continue withits current practice of applying the recognition and measurement principles of APB No. 25, Accounting for Stock Issued to Employees. The Companyhas adopted the disclosure requirements of SFAS 148 as of December 31, 2002.
InJanuary2003, theFinancialAccountingStandardsBoard issued InterpretationNo.46 (FIN46),ConsolidationofVariable InterestEntities. FIN46 requiresexistingunconsolidatedvariable interest entities (VIEs) tobeconsolidatedby their primarybeneficiaries if the entities do not effectively disperse risks amongtheparties involved. FIN46applies immediately toVIEscreatedafter January31,2003and toVIEs inwhichan enterprise obtains an interest after that date.ForVIEs inwhichanenterpriseholdsavariable interest thatwas acquired before February1,2003,FIN46applies forperiodsbeginningafter June15,2003.
(U.S. dollar amounts in millions, except per share amounts)

58 ABB Group Financial review 2002
Note 2 Significant accounting policies, continuedIn November 2002, the Emerging Issues Task Force of the Financial Accounting Standards Board issued Emerging Issues Task Force No. 00-21(EITF 00-21), Accounting for Revenue Arrangements with Multiple Deliverables, which was amended in January 2003 and requires that (a) revenueshould be recognized separately for separate units of accounting in multiple deliverables arrangement, (b) revenue for a separate unit of accountingshould be recognized only when the arrangement consideration is reliably measurable and the earnings process is substantially complete, and (c) consideration should be allocated among the separate units of accounting based on their relative fair value. EITF 00-21 is applicable to transactionsentered into after January 1, 2004. The Company believes that EITF 00-21 will not result in a significant change in its practice of accounting forarrangements involving delivery or performance of multiple products and services.
Note 3 Discontinued operationsDuring 2000, the Company disposed of its Power Generation segment, which included its investment in ABB ALSTOM POWER NV (the “Joint Venture”)and its nuclear technology business. The Company sold its nuclear technology business to British Nuclear Fuels PLC in April 2000 and its 50 percentinterest in the Joint Venture to ALSTOM SA (ALSTOM) in May 2000.
In connection with the sale of its 50 percent interest in the Joint Venture to ALSTOM in May 2000, the Company received cash proceeds of $ 1,197million and recognized a gain of $ 734 million ($ 713 million, net of tax), which includes $ 136 million of accumulated foreign currency translation losses. In connection with the sale of the nuclear technology business to British Nuclear Fuels PLC in April 2000, the Company received cash proceeds of $ 485 million and recognized a gain of $ 55 million ($ 17 million, net of tax). The net gain from the sale of the nuclear technology business reflects a $ 300 million provision for estimated environmental remediation. These gains were also offset by operating losses associated with these businesses.
In November 2002, the Company sold most of its Structured Finance business to GE Commercial Finance and received cash proceeds ofapproximately $ 2,000 million, including a contingent payment of $ 20 million to be released to ABB Ltd in the future based on amounts ultimatelycollected by GE Commercial Finance. The sale and purchase agreement provides GE Commercial Finance the option to require the Company torepurchase certain designated assets transferred to GE Commercial Finance upon the occurrence of certain events, but in any event no later thanFebruary 1, 2004. The Company provided to GE Commercial Finance several cash collateralized letters of credit for a total amount of $202 million assecurity for certain performance-related obligations retained by the Company in connection with the sale. The net loss from the sale of the StructuredFinance business amounted to $ 146 million including accumulated foreign currency translation losses of $ 54 million, and the fair value of $ 38 million forGE Commercial Finance’s right to require the Company to repurchase certain designated assets. The net loss is included in income (loss) fromdiscontinued operations, net of tax.
In December 2002, the Company sold its metering business to Ruhrgas Industries GmbH of Essen, Germany, for $ 223 million, including payment of $ 15 million into an escrow account until final completion of the transaction. Water and electricity metering was no longer a core business and itsdivestment was part of the Company’s divestment strategy. The net loss from the disposal of the metering business was $ 48 million including currencytranslation losses of $ 35 million and goodwill write-off of $ 65 million. The net loss is included in income (loss) from discontinued operations, net of tax.
In December 2002, the Company’s Board of Directors approved management’s plans to sell the Oil, Gas and Petrochemical business. The planneddisposal is in line with the Company’s strategy to focus on power and automation technologies for utility and industry customers. Managementanticipates divesting the business in a series of stock and asset sales in 2003. Accordingly, the results of the business are presented as discontinuedoperations for all periods presented. Revenues of $ 3,854 million, $ 3,478 million and $ 2,774 million in 2002, 2001 and 2000, respectively, in thesummary, below, is attributable to the Oil, Gas and Petrochemical business. Income (loss) from discontinued operations, net of tax, attributable to theOil, Gas and Petrochemical business includes $ (121) million, $ 8 million and $ 105 million in 2002, 2001 and 2000, respectively.
Income (loss) from discontinued operations, net of tax, also includes other abandoned and sold assets, with net losses of $101 million, $ 21 million and$ 2 million in 2002, 2001 and 2000, respectively.
Income (loss) from discontinued operations, net of tax, also includes losses related to the Company’s U.S. subsidiary, Combustion Engineering Inc.(Combustion Engineering), of approximately $ 420 million, $ 470 million and $ 70 million in asbestos-related provisions in 2002, 2001 and 2000,respectively (see Note 17).
Operating results of the discontinued businesses are summarized as follows:
Year ended December 31, 2002 2001 2000
Revenues $ 4,560 $ 4,344 $ 3,732Costs and expenses, finance loss (5,164) (4,772) (3,670)Income (loss) before taxes (604) (428) 62Tax expense (41) (39) (84)Minority interest (41) (34) (8)Net loss from discontinued operations (686) (501) (30)Net loss from equity accounted investments, net of tax of $15 million – – (23)Gain (loss) from dispositions(1), net of tax of $ 31 million in 2002 and $ 59 million in 2000 (194) – 730Income (loss) from discontinued operations, net of tax $ (880) $ (501) $ 677Basic earnings (loss) per share:
Income (loss) from discontinued operations, net of tax $ (0.79) $ (0.43) $ 0.57Diluted earnings (loss) per share:
Income (loss) from discontinued operations, net of tax $ (0.75) $ (0.43) $ 0.57(1) The 2000 amount is net of a $ 300 million provision for environmental remediation.
(U.S. dollar amounts in millions, except per share amounts)

ABB Group Financial review 2002 59
Note 3 Discontinued operations, continuedThe portion of the Company’s interest expense reclassified to income (loss) from discontinued operations, net of tax, in accordance with EmergingIssues Task Force No. 87-24, Allocation of Interest to Discontinued Operations, was $ 33 million, $ 34 million and $ 42 million in 2002, 2001 and 2000, respectively. These amounts were calculated based upon the ratio of net assets of the discontinued business divided by the sum of total netassets and total debt (but only that portion of debt not directly attributable to other operations of the Company). This ratio was multiplied by the portionof total interest expense not directly attributable to other operations of the Company to arrive at the interest reclassified to income (loss) fromdiscontinued operations, net of tax.
The components of assets and liabilities in discontinued operations are summarized as follows:
December 31, 2002 2001
Cash and marketable securities $ 300 $ 347Receivables, net 1,285 1,676Inventories, net 397 507Prepaid expenses and other 152 236Financing receivables, non-current 41 2,177Intangible assets 561 524Property, plant and equipment, net 121 250Other assets 238 195Assets in discontinued operations $ 3,095 $ 5,912Accounts payable $ 1,677 $ 1,678Short-term borrowings 44 46Accrued liabilities 404 487Long-term borrowings – 40Other liabilities 259 1,091Liabilities in discontinued operations $ 2,384 $ 3,342
Note 4 Business combinations and other divestments
Entrelec GroupIn June 2001, the Company completed the acquisition, through an open-market tender, of Entrelec Group, a France-based supplier of industrialautomation and control products operating in 17 countries. The Company’s Consolidated Financial Statements include Entrelec’s result of operationssince June 20, 2001, the transaction closing date.
The cash purchase price of the acquisition was approximately $ 284 million. The excess of the purchase price over the fair value of the assets acquiredtotaled to $ 294 million and has been recorded as goodwill. The transaction has been accounted for as a purchase. Included in the purchase priceallocation was an amount of $ 21 million for a restructuring of the business.
b-business partners B.V.In June 2000, the Company entered into a share subscription agreement to acquire 42 percent interest in b-business partners B.V. Pursuant to theterms of the agreement, the Company committed to invest a total of $ 278 million, of which $ 69 million was paid in 2000 and $134 million was paidduring the first half of 2001. In December 2001, Investor AB (a Swedish investment company that also owns shares of ABB Ltd) acquired 90 percent ofthe Company’s investment in b-business partners B.V. for approximately book value, or $166 million in cash. Immediately after this transaction, b-business partners B.V. repurchased 50 percent of its outstanding shares from all investors, which resulted in a return of capital to the Company of$10 million. As of December 31, 2002, the Company retains a 4 percent investment in b-business partners B.V. and is committed to provide additional capital to b-business partners B.V. of $ 4 million. Further, b-business partners B.V. retains a put right to compel the Company to repurchase150,000 shares of b-business partners B.V. at a cost of approximately $16 million.
Other acquisitions and investmentsDuring 2002, 2001, and 2000, the Company invested $154 million, $179 million and $ 896 million, respectively, in 32, 60 and 61 new businesses, jointventures and affiliated companies. Of these transactions, 6, 10 and 24, respectively, represented acquisitions accounted for as purchases andaccordingly, the results of operations of the acquired businesses have been included in the Company’s Consolidated Financial Statements from therespective acquisition dates. The aggregate purchase price of these acquisitions during 2002, 2001 and 2000 was $ 84 million, $ 45 million and $ 416 million, respectively. The aggregate excess of the purchase price over the fair value of the net assets acquired totaled $ 93 million, $ 29 million and$ 447 million, in 2002, 2001 and 2000, respectively, and has been recorded as goodwill except for the aggregate of purchase price over the fair value ofnet assets acquired that were part of businesses whose assets and liabilities, including goodwill, are reflected as assets and liabilities in discontinuedoperations for all periods presented. Assuming these acquisitions had occurred on the first day of the year prior to their purchase, the pro formaConsolidated Income Statement for those years would not have materially differed from reported amounts either on an individual or an aggregate basis.
(U.S. dollar amounts in millions, except per share amounts)
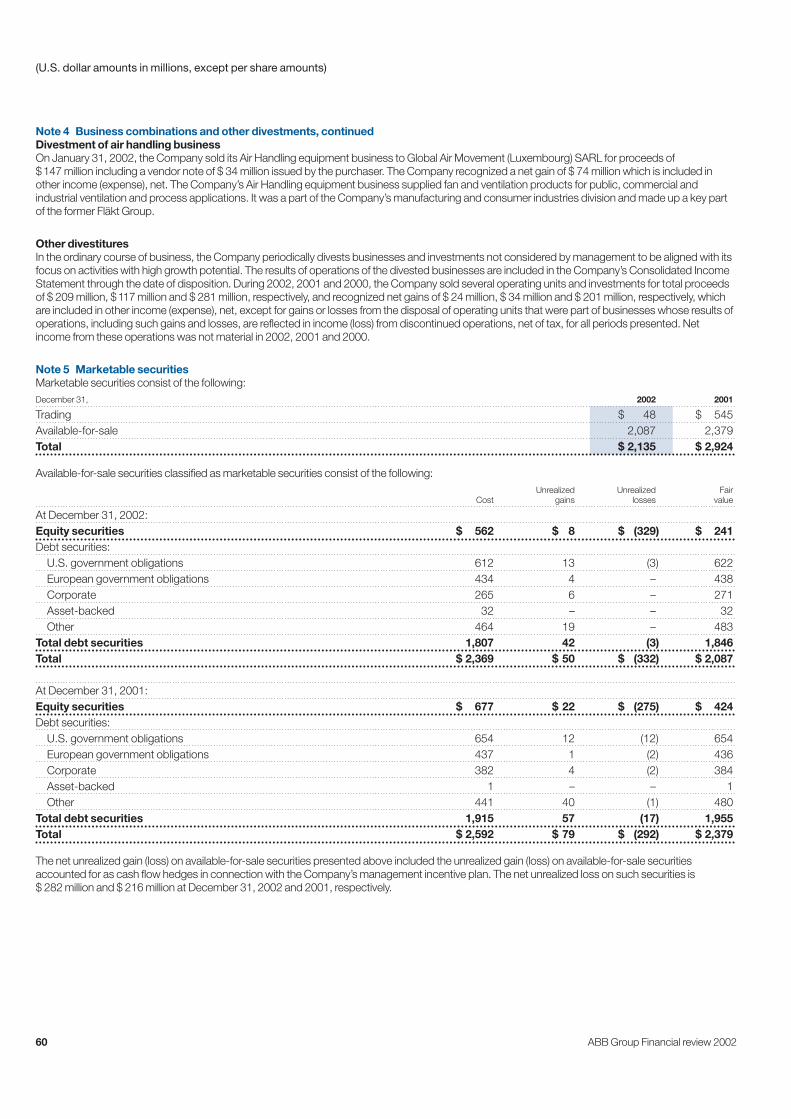
60 ABB Group Financial review 2002
Note 4 Business combinations and other divestments, continuedDivestment of air handling businessOn January 31, 2002, the Company sold its Air Handling equipment business to Global Air Movement (Luxembourg) SARL for proceeds of $147 million including a vendor note of $ 34 million issued by the purchaser. The Company recognized a net gain of $ 74 million which is included inother income (expense), net. The Company’s Air Handling equipment business supplied fan and ventilation products for public, commercial andindustrial ventilation and process applications. It was a part of the Company’s manufacturing and consumer industries division and made up a key partof the former Fläkt Group.
Other divestituresIn the ordinary course of business, the Company periodically divests businesses and investments not considered by management to be aligned with itsfocus on activities with high growth potential. The results of operations of the divested businesses are included in the Company’s Consolidated IncomeStatement through the date of disposition. During 2002, 2001 and 2000, the Company sold several operating units and investments for total proceedsof $ 209 million, $117 million and $ 281 million, respectively, and recognized net gains of $ 24 million, $ 34 million and $ 201 million, respectively, whichare included in other income (expense), net, except for gains or losses from the disposal of operating units that were part of businesses whose results ofoperations, including such gains and losses, are reflected in income (loss) from discontinued operations, net of tax, for all periods presented. Net income from these operations was not material in 2002, 2001 and 2000.
Note 5 Marketable securitiesMarketable securities consist of the following:December 31, 2002 2001
Trading $ 48 $ 545Available-for-sale 2,087 2,379Total $ 2,135 $ 2,924
Available-for-sale securities classified as marketable securities consist of the following:Unrealized Unrealized Fair
Cost gains losses value
At December 31, 2002:Equity securities $ 562 $ 8 $ (329) $ 241Debt securities:
U.S. government obligations 612 13 (3) 622European government obligations 434 4 – 438Corporate 265 6 – 271Asset-backed 32 – – 32Other 464 19 – 483
Total debt securities 1,807 42 (3) 1,846Total $ 2,369 $ 50 $ (332) $ 2,087
At December 31, 2001:Equity securities $ 677 $ 22 $ (275) $ 424Debt securities:
U.S. government obligations 654 12 (12) 654European government obligations 437 1 (2) 436Corporate 382 4 (2) 384Asset-backed 1 – – 1Other 441 40 (1) 480
Total debt securities 1,915 57 (17) 1,955Total $ 2,592 $ 79 $ (292) $ 2,379
The net unrealized gain (loss) on available-for-sale securities presented above included the unrealized gain (loss) on available-for-sale securitiesaccounted for as cash flow hedges in connection with the Company’s management incentive plan. The net unrealized loss on such securities is $ 282 million and $ 216 million at December 31, 2002 and 2001, respectively.
(U.S. dollar amounts in millions, except per share amounts)
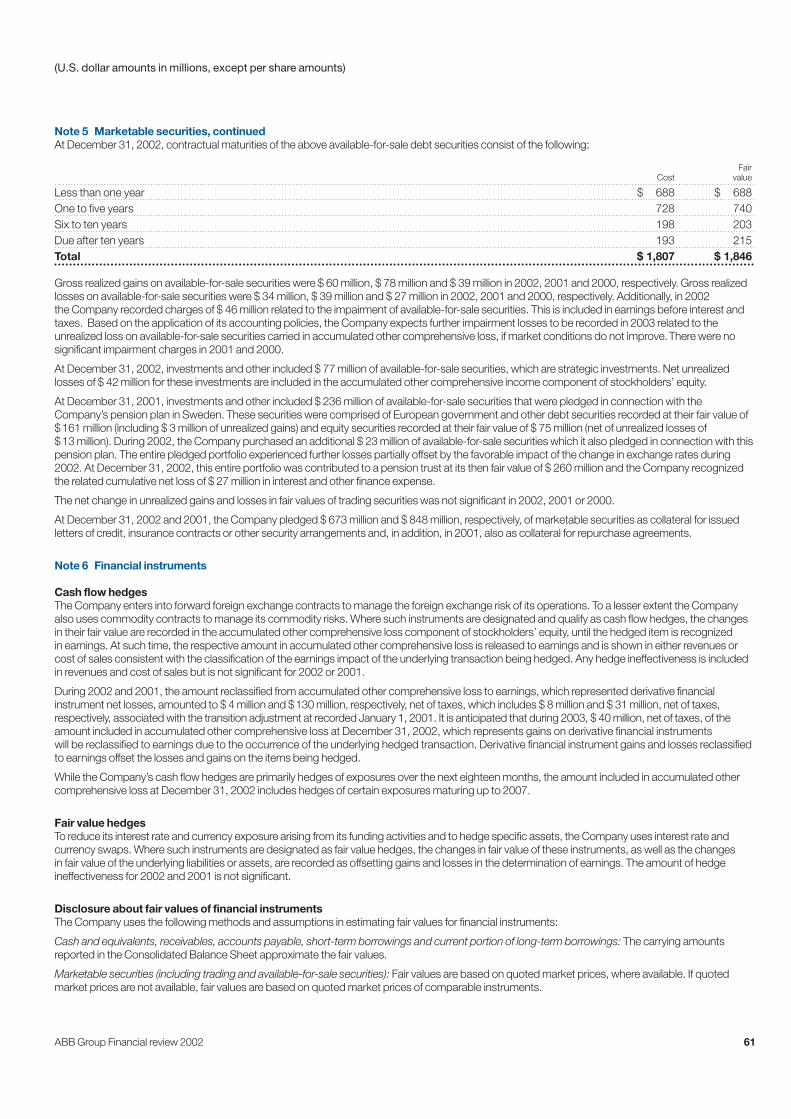
ABB Group Financial review 2002 61
Note 5 Marketable securities, continuedAt December 31, 2002, contractual maturities of the above available-for-sale debt securities consist of the following:
FairCost value
Less than one year $ 688 $ 688One to five years 728 740Six to ten years 198 203Due after ten years 193 215Total $ 1,807 $ 1,846
Gross realized gains on available-for-sale securities were $ 60 million, $ 78 million and $ 39 million in 2002, 2001 and 2000, respectively. Gross realizedlosses on available-for-sale securities were $ 34 million, $ 39 million and $ 27 million in 2002, 2001 and 2000, respectively. Additionally, in 2002 the Company recorded charges of $ 46 million related to the impairment of available-for-sale securities. This is included in earnings before interest andtaxes. Based on the application of its accounting policies, the Company expects further impairment losses to be recorded in 2003 related to theunrealized loss on available-for-sale securities carried in accumulated other comprehensive loss, if market conditions do not improve.There were nosignificant impairment charges in 2001 and 2000.
At December 31, 2002, investments and other included $ 77 million of available-for-sale securities, which are strategic investments. Net unrealizedlosses of $ 42 million for these investments are included in the accumulated other comprehensive income component of stockholders’ equity.
At December 31, 2001, investments and other included $ 236 million of available-for-sale securities that were pledged in connection with theCompany’s pension plan in Sweden. These securities were comprised of European government and other debt securities recorded at their fair value of$161 million (including $ 3 million of unrealized gains) and equity securities recorded at their fair value of $ 75 million (net of unrealized losses of $13 million). During 2002, the Company purchased an additional $ 23 million of available-for-sale securities which it also pledged in connection with thispension plan. The entire pledged portfolio experienced further losses partially offset by the favorable impact of the change in exchange rates during2002. At December 31, 2002, this entire portfolio was contributed to a pension trust at its then fair value of $ 260 million and the Company recognizedthe related cumulative net loss of $ 27 million in interest and other finance expense.
The net change in unrealized gains and losses in fair values of trading securities was not significant in 2002, 2001 or 2000.
At December 31, 2002 and 2001, the Company pledged $ 673 million and $ 848 million, respectively, of marketable securities as collateral for issuedletters of credit, insurance contracts or other security arrangements and, in addition, in 2001, also as collateral for repurchase agreements.
Note 6 Financial instruments
Cash flow hedgesThe Company enters into forward foreign exchange contracts to manage the foreign exchange risk of its operations. To a lesser extent the Companyalso uses commodity contracts to manage its commodity risks. Where such instruments are designated and qualify as cash flow hedges, the changesin their fair value are recorded in the accumulated other comprehensive loss component of stockholders’ equity, until the hedged item is recognized in earnings. At such time, the respective amount in accumulated other comprehensive loss is released to earnings and is shown in either revenues orcost of sales consistent with the classification of the earnings impact of the underlying transaction being hedged. Any hedge ineffectiveness is includedin revenues and cost of sales but is not significant for 2002 or 2001.
During 2002 and 2001, the amount reclassified from accumulated other comprehensive loss to earnings, which represented derivative financialinstrument net losses, amounted to $ 4 million and $130 million, respectively, net of taxes, which includes $ 8 million and $ 31 million, net of taxes,respectively, associated with the transition adjustment at recorded January 1, 2001. It is anticipated that during 2003, $ 40 million, net of taxes, of theamount included in accumulated other comprehensive loss at December 31, 2002, which represents gains on derivative financial instruments will be reclassified to earnings due to the occurrence of the underlying hedged transaction. Derivative financial instrument gains and losses reclassifiedto earnings offset the losses and gains on the items being hedged.
While the Company’s cash flow hedges are primarily hedges of exposures over the next eighteen months, the amount included in accumulated othercomprehensive loss at December 31, 2002 includes hedges of certain exposures maturing up to 2007.
Fair value hedgesTo reduce its interest rate and currency exposure arising from its funding activities and to hedge specific assets, the Company uses interest rate andcurrency swaps. Where such instruments are designated as fair value hedges, the changes in fair value of these instruments, as well as the changes in fair value of the underlying liabilities or assets, are recorded as offsetting gains and losses in the determination of earnings. The amount of hedgeineffectiveness for 2002 and 2001 is not significant.
Disclosure about fair values of financial instrumentsThe Company uses the following methods and assumptions in estimating fair values for financial instruments:
Cash and equivalents, receivables, accounts payable, short-term borrowings and current portion of long-term borrowings: The carrying amountsreported in the Consolidated Balance Sheet approximate the fair values.
Marketable securities (including trading and available-for-sale securities): Fair values are based on quoted market prices, where available. If quotedmarket prices are not available, fair values are based on quoted market prices of comparable instruments.
(U.S. dollar amounts in millions, except per share amounts)
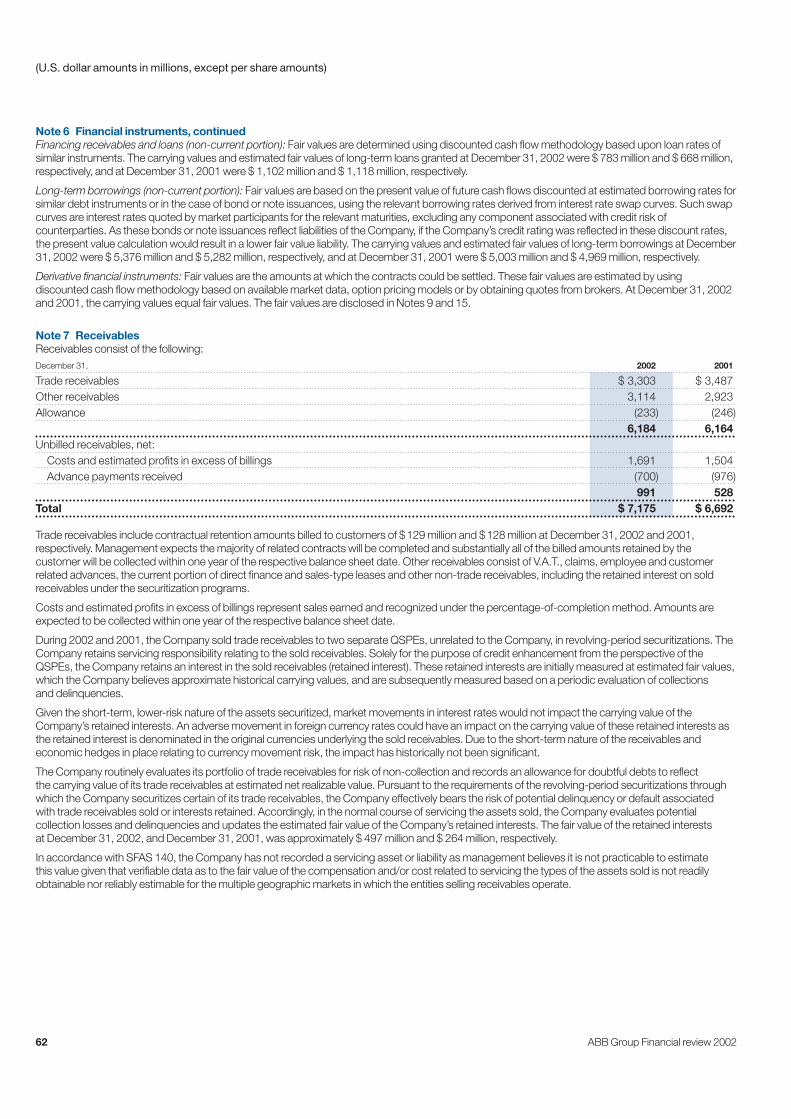
62 ABB Group Financial review 2002
Note 6 Financial instruments, continuedFinancing receivables and loans (non-current portion): Fair values are determined using discounted cash flow methodology based upon loan rates ofsimilar instruments. The carrying values and estimated fair values of long-term loans granted at December 31, 2002 were $ 783 million and $ 668 million,respectively, and at December 31, 2001 were $ 1,102 million and $ 1,118 million, respectively.
Long-term borrowings (non-current portion): Fair values are based on the present value of future cash flows discounted at estimated borrowing rates forsimilar debt instruments or in the case of bond or note issuances, using the relevant borrowing rates derived from interest rate swap curves. Such swapcurves are interest rates quoted by market participants for the relevant maturities, excluding any component associated with credit risk ofcounterparties. As these bonds or note issuances reflect liabilities of the Company, if the Company’s credit rating was reflected in these discount rates,the present value calculation would result in a lower fair value liability. The carrying values and estimated fair values of long-term borrowings at December31, 2002 were $ 5,376 million and $ 5,282 million, respectively, and at December 31, 2001 were $ 5,003 million and $ 4,969 million, respectively.
Derivative financial instruments: Fair values are the amounts at which the contracts could be settled. These fair values are estimated by usingdiscounted cash flow methodology based on available market data, option pricing models or by obtaining quotes from brokers. At December 31, 2002and 2001, the carrying values equal fair values. The fair values are disclosed in Notes 9 and 15.
Note 7 ReceivablesReceivables consist of the following:December 31, 2002 2001
Trade receivables $ 3,303 $ 3,487Other receivables 3,114 2,923Allowance (233) (246)
6,184 6,164Unbilled receivables, net:
Costs and estimated profits in excess of billings 1,691 1,504Advance payments received (700) (976)
991 528Total $ 7,175 $ 6,692
Trade receivables include contractual retention amounts billed to customers of $129 million and $128 million at December 31, 2002 and 2001,respectively. Management expects the majority of related contracts will be completed and substantially all of the billed amounts retained by thecustomer will be collected within one year of the respective balance sheet date. Other receivables consist of V.A.T., claims, employee and customerrelated advances, the current portion of direct finance and sales-type leases and other non-trade receivables, including the retained interest on soldreceivables under the securitization programs.
Costs and estimated profits in excess of billings represent sales earned and recognized under the percentage-of-completion method. Amounts areexpected to be collected within one year of the respective balance sheet date.
During 2002 and 2001, the Company sold trade receivables to two separate QSPEs, unrelated to the Company, in revolving-period securitizations. TheCompany retains servicing responsibility relating to the sold receivables. Solely for the purpose of credit enhancement from the perspective of theQSPEs, the Company retains an interest in the sold receivables (retained interest). These retained interests are initially measured at estimated fair values,which the Company believes approximate historical carrying values, and are subsequently measured based on a periodic evaluation of collections and delinquencies.
Given the short-term, lower-risk nature of the assets securitized, market movements in interest rates would not impact the carrying value of theCompany’s retained interests. An adverse movement in foreign currency rates could have an impact on the carrying value of these retained interests asthe retained interest is denominated in the original currencies underlying the sold receivables. Due to the short-term nature of the receivables andeconomic hedges in place relating to currency movement risk, the impact has historically not been significant.
The Company routinely evaluates its portfolio of trade receivables for risk of non-collection and records an allowance for doubtful debts to reflect the carrying value of its trade receivables at estimated net realizable value. Pursuant to the requirements of the revolving-period securitizations throughwhich the Company securitizes certain of its trade receivables, the Company effectively bears the risk of potential delinquency or default associated with trade receivables sold or interests retained. Accordingly, in the normal course of servicing the assets sold, the Company evaluates potentialcollection losses and delinquencies and updates the estimated fair value of the Company’s retained interests. The fair value of the retained interests at December 31, 2002, and December 31, 2001, was approximately $ 497 million and $ 264 million, respectively.
In accordance with SFAS 140, the Company has not recorded a servicing asset or liability as management believes it is not practicable to estimate this value given that verifiable data as to the fair value of the compensation and/or cost related to servicing the types of the assets sold is not readilyobtainable nor reliably estimable for the multiple geographic markets in which the entities selling receivables operate.
(U.S. dollar amounts in millions, except per share amounts)

ABB Group Financial review 2002 63
Note 7 Receivables, continuedDuring 2002 and 2001, the following cash flows were received from and paid to QSPEs:December 31, 2002 2001
Gross trade receivables sold to QSPEs ($ 524 and $ 347 related to discontinued operations) $ 5,972 $ 5,515Collections made on behalf of and paid to QSPEs (($ 449) and ($ 304) related to discontinued operations) (6,074) (5,343)Purchaser’s, liquidity and program fees (($ 4) and ($ 2) related to discontinued operations) (37) (33)Increase in retained interests (($ 80) and ($ 9) related to discontinued operations) (245) (53)Net cash (paid to)/received from QSPEs during the year (($ 9) and $ 32 related to discontinued operations) $ (384) $ 86
Cash settlement with the QSPEs in 2001, took place monthly on a net basis.
One of the securitization programs contained a credit rating trigger whereby if the Company’s rating went below both BBB (Standard & Poor’s) andBaa2 (Moody’s), the Company would no longer benefit from the intra-month funding. The second securitization program also contained a credit ratingtrigger and similar consequences but the rating trigger point occurred when the Company’s rating went below either BBB (Standard & Poor’s) or Baa2(Moody’s).
In the case of the first program, the credit trigger occurred in early November 2002. At the beginning of November 2002, a number of structural changesto the program were agreed and implemented during November 2002 for credit enhancement purposes of the QSPE. These changes included twicemonthly settlements, the sale of additional receivables as security, changes in the eligibility criteria for receivables to be sold, and the establishment ofcertain banking and collection procedures in respect of the sold receivables.
In the case of the second securitization program, the credit rating trigger occurred in October 2002. Changes to the program were made and includednet cash settlement twice per month, daily transfers of collections of sold receivables, as well as a fixed percentage of retained interest on the sale of new receivables. Subsequent to 2002, further amendments to the program have been agreed and implemented, including the return to a dynamiccalculation of the retained interest on the receivables sold rather than a fixed percentage. In addition, under the amended terms, if the Company’s ratingis below BB+ (Standard & Poor’s) or Ba3 (Moody’s) then the QSPE would have the right to require the collection of the sold receivables to be madedirectly to the accounts of the QSPE rather than via the Company.
The sale of additional receivables as security, the increased frequency of transfers of collections to the QSPEs and the increase in the retained interestrequired by the QSPEs contributed to the cash flows with the QSPEs representing a net cash outflow for the year 2002 rather than a net cash inflow as in 2001.
Gross trade receivables sold represent the face value of all invoices sold during the year to the QSPEs. As the Company services the receivables,collection of the receivables previously sold is made on behalf of the QSPEs. The Company records a loss on sale at the point of sale of the receivablesto the QSPEs. The Company also records the purchaser's, liquidity and program fees at the point of sale to the QSPEs. The total cost of $ 37 million and$ 33 million in 2002 and 2001, respectively, related to the securitization of trade receivables is included in the determination of current earnings.Changes in retained interests of $ 245 million and $ 53 million in 2002 and 2001, respectively, primarily result during 2002 from the additional creditenhancement measures taken by the QSPEs as described above and during 2001 from increases in the volume of receivables sold during the year, aswell as changes in default and delinquency rates, offset by collections of the underlying receivables.
The following table reconciles total gross receivables to the amounts in the Consolidated Balance Sheet after the effects of securitization at December 31, 2002 and 2001:December 31, 2002 2001
Total trade receivables $ 4,667 $ 5,178Portion derecognized (512) (789)Retained interests included in other receivables (514) (269)Trade receivables 3,641 4,120Less: Trade receivables included in assets in discontinued operations (338) (633)Trade receivables-continuing operations $ 3,303 $ 3,487
At December 31, 2002 and 2001, of the gross trade receivables sold, the total trade receivables for which cash has not been collected at those dates amounted to $1,026 million ($148 million related to discontinued operations) and $1,058 million ($ 72 million related to discontinued operations),respectively. At December 31, 2002 and 2001, an amount of $ 96 million ($18 million related to discontinued operations) and $ 65 million ($ 3 million related to discontinued operations), respectively, was more than 90 days past due which is considered delinquent pursuant to the terms of the programs.
In addition, during 2002 and 2001, the Company transferred receivables that were appropriately accounted for under SFAS 140 that were not transferredas part of the above described securitization programs.These transfers were sales directly to banks and/or sales pursuant to other revolving-periodprograms.Total sold receivables included in these transactions during 2002 and 2001 were approximately $ 534 million ($ 22 million related todiscontinued operations) and $ 71 million, respectively. The related costs, including the associated gains and losses, were not significant in either year.
(U.S. dollar amounts in millions, except per share amounts)

64 ABB Group Financial review 2002
Note 8 InventoriesInventories, including inventories related to long-term contracts, consist of the following:December 31, 2002 2001
Commercial inventories, net:Raw materials $ 1,027 $ 993Work in process 1,048 1,233Finished goods 323 306
2,398 2,532Contract inventories, net:
Inventoried costs 379 273Contract costs subject to future negotiation 23 16Advance payments received related to contracts (423) (253)
(21) 36Total $ 2,377 $ 2,568
Contract costs subject to future negotiation represent pending claims for additional contract costs that management believes will be collectible.
Note 9 Prepaid expenses and otherPrepaid expenses and other current assets consist of the following:December 31, 2002 2001
Prepaid expenses $ 484 $ 444Deferred taxes 558 495Advances to suppliers and contractors 227 183Derivatives 1,248 864Other 178 136Total $ 2,695 $ 2,122
Note 10 Financing receivables Financing receivables consist of the following:December 31, 2002 2001
Third-party loans receivable $ 673 $ 870Finance leases (see Note 16) 560 550Other 569 666Total $ 1,802 $ 2,086
Third-party loans receivable primarily represent financing arrangements provided to customers under long-term construction contracts as well asexport financing and other activities.
Included in finance leases at December 31, 2002 and 2001 are $ 7 million and $ 9 million, respectively, of assets pledged as security for other liabilities.Additionally, $212 million and $ 98 million of assets were pledged as security for long-term borrowings at December 31, 2002 and 2001, respectively.
Other financing receivables at December 31, 2002 and 2001 include $ 349 million and $ 355 million, respectively, of assets pledged as security for otherliabilities. Of these amounts, $ 58 million and $ 53 million, respectively, are marketable securities. In addition, other financing receivables include notesreceivable from affiliates of $110 million and $ 232 million at December 31, 2002 and 2001, respectively.
During 2002 and 2001, the Company sold or transferred to financial institutions financing receivables. These transfers included sales of finance leasereceivables and sales of loan receivables. Financing receivables sold or transferred and derecognized from the Consolidated Balance Sheet inaccordance with SFAS 140 totaled $ 419 million and $ 329 million in 2002 and 2001, respectively. The 2001 transfers included $ 70 million of assetstransferred to an affiliated company, while no transfers occurred between affiliates in 2002. Related costs of these transactions, including the associated gains and losses, were approximately $13 million in 2002 and were not significant in 2001.
The Company, in the normal course of its commercial lending business, has outstanding credit commitments which have not yet been drawn down bycustomers. The unused amount at December 31, 2002, and 2001 was approximately $ 41 million and $ 62 million, respectively.
(U.S. dollar amounts in millions, except per share amounts)

ABB Group Financial review 2002 65
(U.S. dollar amounts in millions, except per share amounts)
Note 11 Property, plant and equipmentProperty, plant and equipment consist of the following:December 31, 2002 2001
Land and buildings $ 2,215 $ 2,231Machinery and equipment 4,364 3,984Construction in progress 257 178
6,836 6,393Accumulated depreciation (4,044) (3,640)Total $ 2,792 $ 2,753
Note 12 Goodwill and other intangible assetsGoodwill and other intangible assets consist of the following:December 31, 2002 2001
Gross carrying Accumulated Net carrying Gross carrying Accumulated Net carryingamount amortization amount amount amortization amount
Intangible assets:Capitalized software $ 590 $ (278) $ 312 $ 431 $ (161) $ 270Other 551 (272) 279 536 (219) 317Total $ 1,141 $ (550) $ 591 $ 967 $ (380) $ 587
Aggregate amortization expense:For year ended 2001 $ 111For year ended 2002 $ 145
Estimated amortization expense:For year ended 2003 $ 169For year ended 2004 $ 157For year ended 2005 $ 143For year ended 2006 $ 51For year ended 2007 $ 47
The estimated amortization expense is calculated as if no future expenditures will be made.
In 2002 and 2001, the Company did not identify any intangible assets as not being subject to amortization with the exception of $ 24 million and $ 14 million, respectively, related to an intangible pension asset (see Note 20).
Other intangible assets primarily include intangibles created through acquisitions, such as trademarks and patents.
For the years ended December 31, 2002 and 2001, the Company acquired $ 91 million of intangible assets ($ 86 million of software and $ 5 million ofother intangible assets) and $154 million ($135 million of software and $19 million of other intangible assets), respectively. For items capitalized in 2002and 2001, the weighted average amortization period for software is four years and for other intangible assets is six years.
The Company recorded write-downs of intangible assets of $ 25 million, and $ 26 million, in 2002 and 2001, respectively, related to software developedfor internal use. The fair value of the assets was estimated using an undiscounted cash flow model. The write-downs are included in other income(expense), net in the Consolidated Income Statement.
The changes in the carrying amount of goodwill for the year ended December 31, 2002, are as follows:
Power AutomationTechnology Technology Non-Core Corporate/
Utilities Industries Products Products Activities Other Total
Balance as of January 1, 2002 $ 357 $ 523 $ 44 $ 1,050 $ 176 $ 38 $ 2,188Goodwill acquired during the year 2 25 17 – 33 16 93Impairment losses – – – – (7) (2) (9)Goodwill written off related to sale of business unit – – – (65) – (2) (67)Other – (19) (1) 11 15 1 7Foreign currency translation 3 14 5 64 16 7 109Balance as of December 31, 2002 $ 362 $ 543 $ 65 $ 1,060 $ 233 $ 58 $ 2,321

66 ABB Group Financial review 2002
Note 12 Goodwill and other intangible assets, continuedThe changes in the carrying amount of goodwill for the year ended December 31, 2001, are as follows:
Power AutomationTechnology Technology Non-Core Corporate/
Utilities Industries Products Products Activities Other Total
Balance as of January 1, 2001 $ 384 $ 545 $ 50 $ 818 $ 225 $ 62 $ 2,084Goodwill acquired during the year – 23 – 300 – – 323Impairment losses – – – – (40) – (40)Amortization expense (24) (41) (6) (54) (6) (24) (155)Foreign currency translation (3) (4) – (14) (3) – (24)Balance as of December 31, 2001 $ 357 $ 523 $ 44 $ 1,050 $ 176 $ 38 $ 2,188
As of December 31, 2002 and 2001, the goodwill in Non-Core Activities was comprised of: Insurance ($ 67 million and $ 56 million); Building Systems ($ 34 million and $ 21 million); New Ventures ($129 million and $ 96 million); and other Non-Core Activities ($ 3 million and $ 3 million), respectively.
Of the $ 93 million goodwill acquired in 2002, $ 48 million related to the purchase of the minority interest in certain consolidated subsidiaries of theCompany for cash consideration of $ 40 million. The remaining $ 45 million relates to the purchase of six entities for a cost of $ 52 million.
The Company increased goodwill $ 7 million during 2002 due to adjustments of the purchase price for certain 2001 acquisitions.
Consistent with the Company’s policy of reassessing the carrying value of acquired intangible assets, a write-down of $ 40 million was recorded during2001 in relation to goodwill of one of the Company’s investments.
Note 13 Equity accounted companiesThe Company recorded $ 211 million, $ 79 million and $ 92 million in 2002, 2001 and 2000, respectively, of earnings reflected in other income (expense), net, representing the Company’s share of the pre-tax earnings (losses) of the investees, accounted for under the equity method of accounting.The Company has recorded at December 31, 2002 and 2001, $ 730 million and $ 615 million, respectively, in investments and other, representing theCompany’s investment in these equity investees. This is consistent with the Company’s policy for investments accounted for using the equity method,as described in Note 2. Significant companies accounted for using the equity method of accounting and the ownership percentage held by theCompany included: Jorf Lasfar Energy Company S.C.A., Morocco (owned 50 percent) and Swedish Export Credit Corporation, Sweden (owned 35.4 percent).
The Company’s share of the pre-tax earnings (losses)Investment Investment of equity-accounted investees
balance 2002 balance 2001 2002 2001 2000
Jorf Lasfar Energy Company S.C.A. $ 336 $ 310 $ 73 $ 85 $ 61Swedish Export Credit Corporation 206 100 125 (16) 18Other(1) 188 205 13 10 13Total $ 730 $ 615 211 79 92Less: Current income tax expense (49) (7) (11)The Company’s share of earnings ofequity-accounted investees $ 162 $ 72 $ 81(1) encompasses additional investments, none of which are individually significant
The following table represents selected financial information for Jorf Lasfar Energy Company S.C.A. and Swedish Export Credit Corporation and not the Company’s share in these two equity accounted companies.
Jorf Lasfar Energy Company S.C.A.2002 2001 2000
Total current assets $ 174 $ 190 $ 159Total non-current assets $ 2,356 $ 2,466 $ 2,768Total current liabilities $ 249 $ 188 $ 134Total non-current liabilities $ 1,802 $ 1,904 $ 2,109Total shareholders’ equity $ 479 $ 564 $ 684Revenues $ 364 $ 357 $ 247Income before taxes $ 143 $ 168 $ 126Net income $ 132 $ 161 $ 118
Swedish Export Credit Corporation (1)
2002 2001 2000
Total shareholders’ equity $ 441 $ 526 $ 361Net income (loss) $ 254 $ (32) $ 56(1) Swedish Export Credit Corporation’s financial statements are prepared on the basis of Swedish GAAP and only shareholders’ equity and net income are reconciled to U.S. GAAP.
(U.S. dollar amounts in millions, except per share amounts)

ABB Group Financial review 2002 67
Note 13 Equity accounted companies, continuedOn April 7, 2003, Swedish Export Credit Corporation filed an amendment to its annual report on Form 20-F for the fiscal year ended December 31,2001, to correct an error in its accounting for the fair value of certain financial instruments. Amounts presented in these Consolidated FinancialStatements include the effect of adjustments recorded by Swedish Export Credit Corporation in 2002 and 2001 to properly account for suchinstruments in accordance with U.S. GAAP. Accordingly, the Company has restated its 2001 Consolidated Financial Statements to reflect a $55 million($ 0.05 per share) reduction in the Company’s share of Swedish Export Credit Corporation’s pre-tax earnings, partially offset by current income taxes of$17 million ($ 0.02 per share), and a reduction in the Company’s investment balance of $ 38 million.
On behalf of companies in which the Company has an equity position, the Company has granted lines of credit and has committed to provide additionalcapital. As of December 31, 2002, the total unused lines of credit amounted to $ 22 million and the capital commitments amounted to $ 64 million.
The Company’s 2002 Consolidated Financial Statements include the following aggregate amounts related to transactions with equity accountedinvestees and other related parties:
Revenues $ 77Receivables $ 81Other current assets $ 58Financing receivable (non-current) $ 110Payables $ 74Borrowings (current) $ 40Other current liabilities $ 22
Note 14 BorrowingsThe Company’s total borrowings at December 31, 2002 and 2001 were $ 7,952 million and $ 9,704 million, respectively.
Short-term borrowingsThe Company’s commercial paper and short-term debt financing consist of the following:
December 31, 2002 2001
Commercial paper(weighted-average interest rate of 4.8% and 2.7%) $ 478 $ 3,297Other short-term debt(weighted-average interest rate of 5.3% and 4.5%) 434 941Current portion of long-term borrowings(weighted-average interest rate of 3.7% and 4.5%) 1,664 463Total $ 2,576 $ 4,701
Other short-term debt primarily represents short-term loans from various banks and, at December 31, 2001, includes repurchase agreements.Commercial paper outstanding at December 31, 2002 has maturities of less than 3 months. Of the commercial paper outstanding at December 31,2001, $ 2,050 million had maturities of less than 3 months, $ 913 million had maturities of 3 to 6 months and $ 334 million had maturities over 6 months.
In mid December 2001, the Company entered into a syndicated $ 3,000 million 364-day revolving credit facility, with the option to convert up to $1,000 million of any amounts outstanding at the end of the period into one year term borrowings. The facility contained a clause that in the event theCompany’s long-term debt rating fell below either A3 or A– from Moody’s and Standard & Poor’s, respectively, the terms of the facility were to berenegotiated. Commitment fees were paid on the unutilized portion of the facility and their level was dependent on the credit rating of the Company’slong-term debt. At December 31, 2001, no amounts were outstanding under the facility.
In March 2002, the Company drew down $ 2,845 million of the $ 3,000 million facility. A portion of these proceeds was used to repay commercial paperborrowings. On March 25, 2002, the Company’s long-term debt rating was reduced to Baa2 by Moody’s. This event triggered the minimum-ratingclause in the facility and required the terms of the facility to be renegotiated. In April 2002, the $ 3,000 million revolving credit facility was amended.
Pursuant to the terms of the amended $ 3,000 million revolving credit facility, the proceeds from the issuance of the convertible bonds, the sterling-denominated bonds and the euro-denominated bonds, described under long-term borrowings, below, as well as proceeds from a sale-leasebacktransaction were used to repay and reduce the amount available under the facility to $1,000 million. This amount was repaid in December 2002 and thefacility closed.
In December 2002, the Company established a new $1,500 million 364-day revolving credit facility. This facility includes a 364-day term-out optionwhereby up to a maximum amount of $ 750 million may be extended for up to a further 364 days in the form of term loans. The availability of the term-out option is subject to certain conditions, including the Company’s ability to demonstrate, at the time of exercising the option, that including theproceeds of the term-out option, the Company will have at least $ 300 million of available cash (as defined in the facility agreement) throughout 2004.Assuming the term-out option is fully drawn, the amounts converted into term loans will be reduced by $150 million on July 1, 2004, $ 250 million on October 1, 2004, and $ 350 million on December 15, 2004, being the final maturity date of the facility.
As of December 31, 2002, nothing had been drawn under this new facility. Subsequent to year-end 2002, amounts have been drawn under thefacility within the facility’s monthly drawing limits. The maximum amount available under the facility will reduce from $1,500 million (available to be drawnthrough October 2003) to $1,200 million and $1,000 million at the beginning of November 2003 and December 2003, respectively.
(U.S. dollar amounts in millions, except per share amounts)

68 ABB Group Financial review 2002
(U.S. dollar amounts in millions, except per share amounts)
Note 14 Borrowings, continuedThe amount available under the facility will be further reduced by all, or a portion, of the net proceeds from the disposal of certain significant businessesand assets. The agreement provides that proceeds from specified disposals will not reduce the amount available under the facility until such proceedsexceed certain thresholds. Amounts available under the facility will also be reduced by the proceeds from the issuance of certain long-term debt, equityor equity-linked instruments.
The new facility is secured by a package of assets with a net carrying value of $ 3,500 million, including the shares of the Oil, Gas and Petrochemicalsdivision (which is earmarked for divestment and is included in assets and liabilities in discontinued operations), specific stand alone businesses andcertain regional holding companies. The facility is also secured by certain intra-group loans.
The facility also contains certain financial covenants in respect of minimum interest coverage (the ratio of earnings before interest, taxes, depreciationand amortization to gross interest expense), total gross debt, a maximum level of debt in subsidiaries other than those specified as borrowers under the facility, a minimum level of consolidated net worth, as well as specific negative pledges. The Company must meet the requirements of the financialcovenants at each quarter-end commencing December 31, 2002. In addition, in order to ensure the continued availability of the credit facility, theCompany must obtain minimum levels of proceeds from the disposal of specified assets and businesses and/or equity issuances during 2003. TheCompany’s compliance with this covenant is measured at intervals during 2003. In the event that, at any measurement date, the proceeds from thescheduled disposals and/or equity issuances are less than the required amount, the Company may elect to include for the purposes of the covenantcalculation the proceeds from other defined discretionary sources. The extent to which these other discretionary sources of proceeds may be includedin the calculation is capped by the facility.
The facility prohibits the voluntary prepayment of any banking facility, the prepayment or early redemption of any bonds or capital market instruments,the repurchase of any shares of ABB Ltd, as well as the declaration or payment of dividends as long as the facility is outstanding.
Commitment fees are paid on the unused portion of the facility. The interest costs on borrowings under the 364-day facility are LIBOR plus 3.5 percent,or, for any borrowing in euro, EURIBOR plus 3.5 percent. For any term loans under the term-out option, the applicable interest rate is LIBOR plus 4 percent, or, for any such borrowing in euro, EURIBOR plus 4 percent.
Long-term borrowingsThe Company utilizes a variety of derivative products to modify the characteristics of its long-term borrowings. The Company uses interest rate swapsto effectively convert certain fixed-rate long-term borrowings into floating rate obligations. For certain non-U.S. dollar denominated borrowings, theCompany utilizes cross-currency swaps to effectively convert the borrowings into U.S. dollar obligations. As required by SFAS 133, borrowings, whichhave been designated as being hedged by fair value hedges, are stated at their respective fair values.
The following table summarizes the Company’s long-term borrowings considering the effect of interest rate, currency and equity swaps:
December 31, 2002 December 31, 2001
Nominal Effective Nominal EffectiveBalance rate rate Balance rate rate
Floating rate $ 5,252 5.1% 3.0% $ 4,465 3.9% 2.7%Fixed rate 1,035 5.0% 5.0% 1,001 5.3% 5.3%Convertible bonds 753 4.6% 4.6% – – –
7,040 5,466Current portion of long-term borrowings (1,664) 3.7% 1.9% (463) 4.5% 2.8%Total $ 5,376 $ 5,003
At December 31, 2002, maturities of long-term borrowings were as follows:
Due in 2003 $ 1,664Due in 2004 1,330Due in 2005 1,018Due in 2006 545Due in 2007 814Thereafter 1,669Total $ 7,040

ABB Group Financial review 2002 69
Note 14 Borrowings, continuedIn May 2002, the Company issued $ 968 million aggregate principal amount of convertible unsubordinated bonds due 2007. The bonds pay interest semi-annually in arrears at a fixed annual rate of 4.625 percent and each $1,000 principal amount of bonds is convertible into 87.7489 fully paid ordinaryshares of the Company at an initial conversion price of 18.48 Swiss francs (converted into U.S. dollars at a fixed conversion rate of 1.6216 Swiss francsper U.S. dollar). The conversion price is subject to adjustment provisions to protect against dilution or change in control. The bonds are convertible atthe option of the bondholder at any time from June 26, 2002 up to and including May 2, 2007. The Company may, at any time on or after May 16, 2005,redeem the outstanding bonds at par plus accrued interest if, (1) for a certain number of days during a specified period of time, the official closing price ofthe Company’s ordinary shares on the virt-x exceeds 130 percent of the conversion price, or (2) if at least 85 percent in aggregate principal amount ofbonds originally issued have been exchanged, redeemed or purchased and cancelled. The Company has the option to redeem the bonds when due incash, ordinary shares or any combination thereof, provided that the total number of ordinary shares used does not exceed 84,940,935. The Company’sshares to be issued if the bonds are converted are denominated in Swiss francs, while the bonds are denominated in U.S. dollars. Under SFAS 133,as clarified in discussions between the Company and the Securities and Exchange Commission, a component of the convertible bonds must beaccounted for as a derivative. A portion of the issuance proceeds is deemed to relate to the value of the derivative on issuance and subsequent changesin value of the derivative are recorded through earnings and as an adjustment to the carrying value of the bond. The allocation of a portion of theproceeds to the derivative creates a discount on issuance which is amortized to earnings over the life of the bond. As a result of the decline in theCompany’s share price since issuance of the bonds, the Company has recorded a gain from the change in fair value of the derivative, partially offset byamortization of the effective discount, resulting in a net decrease to interest and other finance expense of $ 215 million, with a corresponding reductionin long-term borrowings.
Also in May 2002, the Company issued bonds due in 2009 with an aggregate principal amount of 200 million pounds sterling, or approximately $ 292million which pay interest semi-annually in arrears at 10 percent per annum. In addition, the Company issued in May 2002, bonds due 2008 with anaggregate principal amount of 500 million euro, or approximately $ 466 million, which pay interest annually in arrears at 9.5 percent per annum.
The 200 million pounds sterling bonds and the 500 million euro bonds contain certain clauses linking the interest paid on the bonds to the credit ratingassigned to the bonds. If the rating assigned to these bonds by both Moody’s and Standard & Poor’s remains at or above Baa3 and BBB–, respectively,then the interest rate on the bonds remains at the level at issuance, that is 10 percent and 9.5 percent for the sterling and euro bonds, respectively. If therating assigned by either Moody’s or Standard & Poor’s decreases below Baa3 or BBB–, respectively, then the annual interest rate on the bondsincreases by 1.5 percent per annum to 11.5 percent and 11 percent for the sterling and euro bonds, respectively. If after such a rating decrease, therating assigned by both Moody’s and Standard & Poor’s returns to a level at or above Baa3 and BBB–, respectively, then the interest rates on the bondsreturn to the interest level at issuance. As a result of the downgrade of the Company’s long-term credit rating by Moody’s to Ba2 on October 31, 2002,this step-up clause in interest was triggered on both bonds. The increase in interest costs is effective for interest periods beginning after the payment ofthe coupon accruing at the date of the downgrade.
In line with the Company’s policy of reducing its interest and currency exposure, a cross currency swap has been used to modify the characteristics ofthe 200 million pounds sterling bonds and an interest-rate swap to modify the 500 million euro bonds.
During early 2002 and late 2001, the Company repurchased outstanding bonds with a face value of $109 million and $ 322 million, respectively. Inconnection with these repurchases the Company recorded a gain on extinguishments of debt of $ 3 million and $12 million, respectively. Of therepurchased bonds, in 2002, an amount totaling a face value of $ 31 million was cancelled while an amount totaling a face value of $19 million wassubsequently re-issued. In 2001, the Company re-issued a portion of the repurchased bonds with a face value of $ 248 million. The re-issue pricebecame the new cost basis of the bonds.
Almost all of the Company’s publicly traded bonds contain cross-default clauses which would allow the bondholders to demand repayment if theCompany was to default on any borrowing at or above a specified threshold.
Note 15 Accrued liabilities and otherAccrued liabilities and other consists of the following:
December 31, 2002 2001
Insurance reserves $ 2,091 $ 2,175Derivatives 1,101 791Accrued personnel costs 715 643Contract related reserves 522 545Provisions for warranties and contract penalties 450 383Taxes payables 423 368Interest 290 263Deferred taxes 253 190Provisions for restructuring 233 167Other 2,241 1,575Total $ 8,319 $ 7,100
In 2002 and 2001 the line “Other” includes an amount of $1,118 million and $134 million, respectively, relating to the asbestos liability. The increase inthe asbestos liability is primarily due to the reclassification of $ 806 million from other liabilities in 2002 as well as an additional provision in 2002, offset bypayments to claimants (see Note 17). The remaining amount in “Other” represents provisions for project disputes, other legal related matters and otheraccrued expenses and deferred income.
(U.S. dollar amounts in millions, except per share amounts)
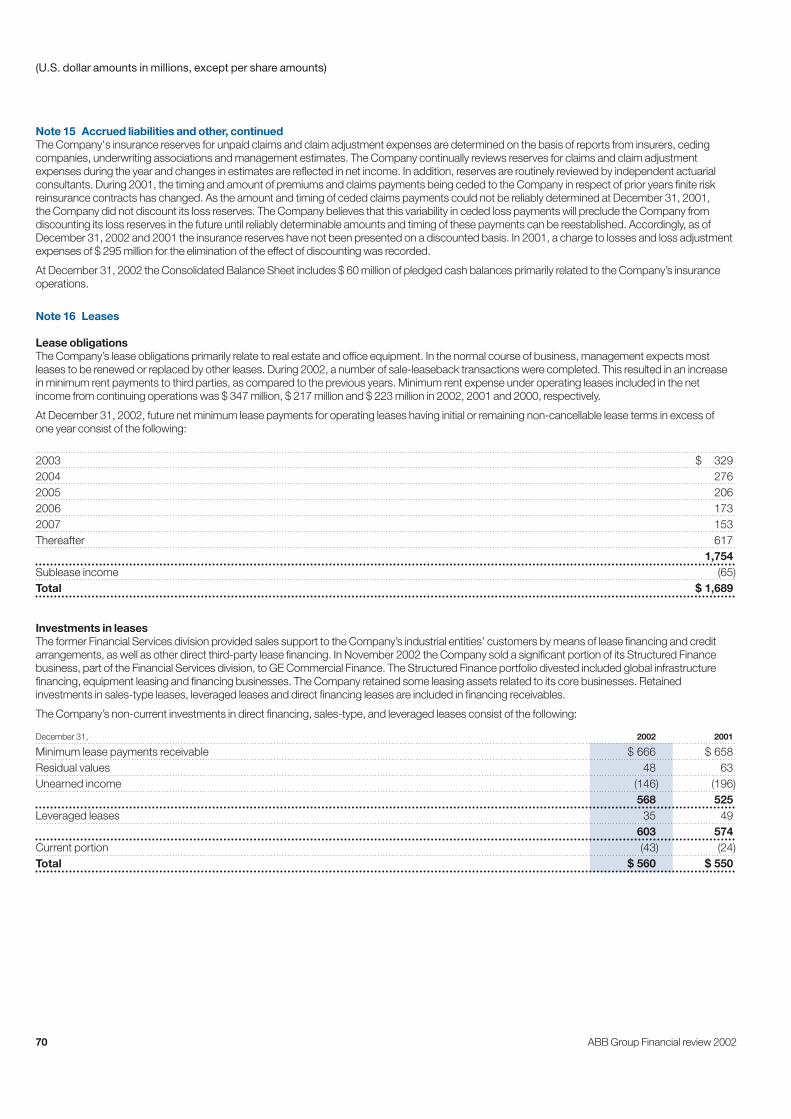
70 ABB Group Financial review 2002
(U.S. dollar amounts in millions, except per share amounts)
Note 15 Accrued liabilities and other, continuedThe Company's insurance reserves for unpaid claims and claim adjustment expenses are determined on the basis of reports from insurers, cedingcompanies, underwriting associations and management estimates. The Company continually reviews reserves for claims and claim adjustmentexpenses during the year and changes in estimates are reflected in net income. In addition, reserves are routinely reviewed by independent actuarialconsultants. During 2001, the timing and amount of premiums and claims payments being ceded to the Company in respect of prior years finite riskreinsurance contracts has changed. As the amount and timing of ceded claims payments could not be reliably determined at December 31, 2001, the Company did not discount its loss reserves. The Company believes that this variability in ceded loss payments will preclude the Company fromdiscounting its loss reserves in the future until reliably determinable amounts and timing of these payments can be reestablished. Accordingly, as ofDecember 31, 2002 and 2001 the insurance reserves have not been presented on a discounted basis. In 2001, a charge to losses and loss adjustmentexpenses of $ 295 million for the elimination of the effect of discounting was recorded.
At December 31, 2002 the Consolidated Balance Sheet includes $ 60 million of pledged cash balances primarily related to the Company’s insuranceoperations.
Note 16 Leases
Lease obligationsThe Company’s lease obligations primarily relate to real estate and office equipment. In the normal course of business, management expects mostleases to be renewed or replaced by other leases. During 2002, a number of sale-leaseback transactions were completed. This resulted in an increasein minimum rent payments to third parties, as compared to the previous years. Minimum rent expense under operating leases included in the netincome from continuing operations was $ 347 million, $ 217 million and $ 223 million in 2002, 2001 and 2000, respectively.
At December 31, 2002, future net minimum lease payments for operating leases having initial or remaining non-cancellable lease terms in excess of one year consist of the following:
2003 $ 3292004 2762005 2062006 1732007 153Thereafter 617
1,754Sublease income (65)Total $ 1,689
Investments in leasesThe former Financial Services division provided sales support to the Company’s industrial entities’ customers by means of lease financing and creditarrangements, as well as other direct third-party lease financing. In November 2002 the Company sold a significant portion of its Structured Financebusiness, part of the Financial Services division, to GE Commercial Finance. The Structured Finance portfolio divested included global infrastructurefinancing, equipment leasing and financing businesses. The Company retained some leasing assets related to its core businesses. Retainedinvestments in sales-type leases, leveraged leases and direct financing leases are included in financing receivables.
The Company’s non-current investments in direct financing, sales-type, and leveraged leases consist of the following:
December 31, 2002 2001
Minimum lease payments receivable $ 666 $ 658Residual values 48 63Unearned income (146) (196)
568 525Leveraged leases 35 49
603 574Current portion (43) (24)Total $ 560 $ 550

ABB Group Financial review 2002 71
Note 16 Leases, continuedAt December 31, 2002, minimum lease payments under direct financing and sales-type leases are scheduled to be received as follows:
2003 $ 682004 592005 402006 452007 38Thereafter 416Total $ 666
Note 17 Commitments and contingencies
GeneralThe Company is subject to various legal proceedings and claims which have arisen in the ordinary course of business that have not been finallyadjudicated. It is not possible at this time for the Company to predict with any certainty the outcome of such litigation. However, except as stated below,management is of the opinion, based upon information presently available and on advice of external counsel, that it is unlikely that any such liability, tothe extent not provided for through insurance or otherwise, would have a material adverse effect in relation to the Company’s consolidated financialposition, liquidity or results of operations.
EnvironmentalThe Company is a participant in several legal and regulatory actions, which result from various U.S. and other federal, state and local environmentalprotection legislation as well as agreements with third parties. Provisions for such actions are accrued when the events are probable and the relatedcosts can be reasonably estimated. Changes in estimates of such costs are recognized in the period determined. While the Company cannot estimatethe impact of future regulations affecting these actions, management believes that the ultimate disposition of these matters will not have a materialadverse effect on the Company’s consolidated financial position, liquidity or results of operations.
The Company records accruals for environmental matters based on its estimated share of costs in the accounting period in which responsibility isestablished and costs can be reasonably estimated. Environmental liabilities are recorded based on the most probable cost, if known, or on theestimated minimum cost, determined on a site-by-site basis. Revisions to the accruals are made in the period the estimated costs of remediation change.
Costs of future expenditures for environmental remediation obligations are not discounted to their present value. The Company records a receivable if the estimated recoveries from insurers or other third parties are determined to be probable.
Guarantees-generalAll guarantees issued before January 1, 2003, are accounted for in accordance with Statement of Financial Accounting Standards No. 5 (SFAS 5),Accounting for Contingencies. Provisions are recorded in the Consolidated Financial Statements at the time it becomes probable the Company willincur losses pursuant to a guarantee.
Certain guarantees issued or modified after December 31, 2002 will be accounted for in accordance with FASB Interpretation No. 45 (FIN 45), Guarantor’s Accounting and Disclosure Requirements for Guarantees; Including Indirect Guarantees of Indebtedness of Others. Upon issuance of certain guarantees, a liability, equal to the fair value of the guarantee, will be recorded.
Guarantees-performancePerformance guarantees represent obligations where the Company guarantees the performance of a third party’s product or service according to theterms of the contract. Such guarantees may include guarantees that a project will be completed within a specified time. If the third party does not fulfillthe obligation, the Company will compensate the guaranteed party in cash or in kind. Performance guarantees include surety bonds, advance paymentguarantees, and performance standby letters of credit.
In November 2002, the Financial Accounting Standards Board issued FIN 45, the disclosure requirements of which are effective for financial statementsrelating to periods ending after December 15, 2002. FIN 45 requires that the Company disclose the “maximum potential exposure” of certainguarantees as well as possible recourse provisions that may allow the Company to recover from third parties amounts paid out under such guarantees.The “maximum potential exposure” as defined by FIN 45 does not allow any discounting of the Company’s assessment of actual exposure under theguarantees. The information below reflects the Company’s maximum potential exposure under the guarantees, which is higher than management’sassessment of the expected exposures.
(U.S. dollar amounts in millions, except per share amounts)
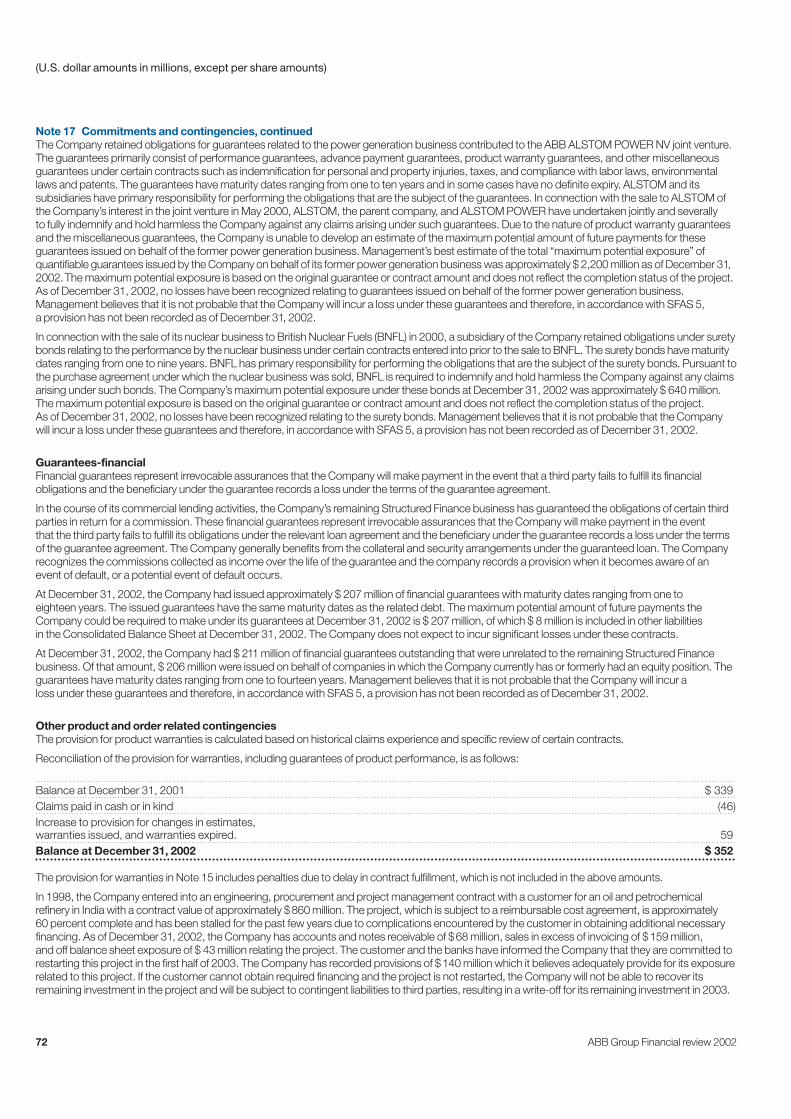
72 ABB Group Financial review 2002
Note 17 Commitments and contingencies, continuedThe Company retained obligations for guarantees related to the power generation business contributed to the ABB ALSTOM POWER NV joint venture.The guarantees primarily consist of performance guarantees, advance payment guarantees, product warranty guarantees, and other miscellaneousguarantees under certain contracts such as indemnification for personal and property injuries, taxes, and compliance with labor laws, environmentallaws and patents. The guarantees have maturity dates ranging from one to ten years and in some cases have no definite expiry. ALSTOM and itssubsidiaries have primary responsibility for performing the obligations that are the subject of the guarantees. In connection with the sale to ALSTOM ofthe Company’s interest in the joint venture in May 2000, ALSTOM, the parent company, and ALSTOM POWER have undertaken jointly and severally to fully indemnify and hold harmless the Company against any claims arising under such guarantees. Due to the nature of product warranty guaranteesand the miscellaneous guarantees, the Company is unable to develop an estimate of the maximum potential amount of future payments for theseguarantees issued on behalf of the former power generation business. Management’s best estimate of the total “maximum potential exposure” ofquantifiable guarantees issued by the Company on behalf of its former power generation business was approximately $ 2,200 million as of December 31,2002.The maximum potential exposure is based on the original guarantee or contract amount and does not reflect the completion status of the project.As of December 31, 2002, no losses have been recognized relating to guarantees issued on behalf of the former power generation business.Management believes that it is not probable that the Company will incur a loss under these guarantees and therefore, in accordance with SFAS 5, a provision has not been recorded as of December 31, 2002.
In connection with the sale of its nuclear business to British Nuclear Fuels (BNFL) in 2000, a subsidiary of the Company retained obligations under suretybonds relating to the performance by the nuclear business under certain contracts entered into prior to the sale to BNFL. The surety bonds have maturitydates ranging from one to nine years. BNFL has primary responsibility for performing the obligations that are the subject of the surety bonds. Pursuant tothe purchase agreement under which the nuclear business was sold, BNFL is required to indemnify and hold harmless the Company against any claimsarising under such bonds. The Company’s maximum potential exposure under these bonds at December 31, 2002 was approximately $ 640 million.The maximum potential exposure is based on the original guarantee or contract amount and does not reflect the completion status of the project. As of December 31, 2002, no losses have been recognized relating to the surety bonds. Management believes that it is not probable that the Companywill incur a loss under these guarantees and therefore, in accordance with SFAS 5, a provision has not been recorded as of December 31, 2002.
Guarantees-financialFinancial guarantees represent irrevocable assurances that the Company will make payment in the event that a third party fails to fulfill its financialobligations and the beneficiary under the guarantee records a loss under the terms of the guarantee agreement.
In the course of its commercial lending activities, the Company’s remaining Structured Finance business has guaranteed the obligations of certain thirdparties in return for a commission. These financial guarantees represent irrevocable assurances that the Company will make payment in the event that the third party fails to fulfill its obligations under the relevant loan agreement and the beneficiary under the guarantee records a loss under the termsof the guarantee agreement. The Company generally benefits from the collateral and security arrangements under the guaranteed loan. The Companyrecognizes the commissions collected as income over the life of the guarantee and the company records a provision when it becomes aware of anevent of default, or a potential event of default occurs.
At December 31, 2002, the Company had issued approximately $ 207 million of financial guarantees with maturity dates ranging from one toeighteen years. The issued guarantees have the same maturity dates as the related debt. The maximum potential amount of future payments theCompany could be required to make under its guarantees at December 31, 2002 is $ 207 million, of which $ 8 million is included in other liabilities in the Consolidated Balance Sheet at December 31, 2002. The Company does not expect to incur significant losses under these contracts.
At December 31, 2002, the Company had $ 211 million of financial guarantees outstanding that were unrelated to the remaining Structured Financebusiness. Of that amount, $ 206 million were issued on behalf of companies in which the Company currently has or formerly had an equity position. Theguarantees have maturity dates ranging from one to fourteen years. Management believes that it is not probable that the Company will incur a loss under these guarantees and therefore, in accordance with SFAS 5, a provision has not been recorded as of December 31, 2002.
Other product and order related contingenciesThe provision for product warranties is calculated based on historical claims experience and specific review of certain contracts.
Reconciliation of the provision for warranties, including guarantees of product performance, is as follows:
Balance at December 31, 2001 $ 339Claims paid in cash or in kind (46)Increase to provision for changes in estimates, warranties issued, and warranties expired. 59Balance at December 31, 2002 $ 352
The provision for warranties in Note 15 includes penalties due to delay in contract fulfillment, which is not included in the above amounts.
In 1998, the Company entered into an engineering, procurement and project management contract with a customer for an oil and petrochemicalrefinery in India with a contract value of approximately $860 million. The project, which is subject to a reimbursable cost agreement, is approximately 60 percent complete and has been stalled for the past few years due to complications encountered by the customer in obtaining additional necessaryfinancing. As of December 31, 2002, the Company has accounts and notes receivable of $68 million, sales in excess of invoicing of $159 million,and off balance sheet exposure of $ 43 million relating the project. The customer and the banks have informed the Company that they are committed torestarting this project in the first half of 2003. The Company has recorded provisions of $140 million which it believes adequately provide for its exposurerelated to this project. If the customer cannot obtain required financing and the project is not restarted, the Company will not be able to recover itsremaining investment in the project and will be subject to contingent liabilities to third parties, resulting in a write-off for its remaining investment in 2003.
(U.S. dollar amounts in millions, except per share amounts)

ABB Group Financial review 2002 73
Note 17 Commitments and contingencies, continuedAsbestos liability
OverviewWhen the Company sold its 50 percent interest in ABB ALSTOM POWER NV to ALSTOM in May 2000, it retained ownership of CombustionEngineering, a subsidiary that had conducted part of the Company’s power generation business and that now owns commercial real estate that itleases to third parties. Combustion Engineering was named as a co-defendant, together with third parties, in numerous lawsuits in the United States inwhich the plaintiffs claimed damages for personal injury arising from exposure to or use of equipment that contained asbestos that CombustionEngineering supplied, primarily during the early 1970s and before. Other ABB Group entities were sometimes named as defendants in asbestos claims.These entities include ABB Lummus Global Inc. (Lummus) (which is part of the Company’s Oil, Gas and Petrochemicals business) and BasicIncorporated (Basic) (which is currently a subsidiary of Asea Brown Boveri Inc. and was formerly a subsidiary of Combustion Engineering). These claims,however, were insignificant compared to the Combustion Engineering claims and have not had a material impact on the Company’s ConsolidatedBalance Sheet or Consolidated Income Statement.
As of December 31, 2002, 2001 and 2000, provisions of $ 1,118 million, $ 940 million and $ 590 million, respectively, were recorded in respect ofasbestos claims and related defense costs. The Company determined the amounts to be provided in 2001 and 2000 by estimating the expected costof future claim settlements over a period of several years. In 2002, the provision is based on the Company’s obligations under Combustion Engineering’sChapter 11 plan of reorganization, as described below, and assumes the confirmation of the plan. These provisions do not reflect probable insurancerecoveries on those claims. The Company also recorded receivables of approximately $ 241 million, $ 263 million and $ 251 million at December 31,2002, 2001 and 2000, respectively, for probable insurance recoveries, which were established with respect to the claims reserved against. During 2002and 2001, Combustion Engineering experienced a significant increase in the level of new claims and higher total and per-claim settlement costs ascompared to prior years. Cash payments, before insurance recoveries, to resolve Combustion Engineering’s asbestos claims were $ 236 million (including$ 30 million contributed into the CE Settlement Trust, described below), $ 136 million and $ 125 million in 2002, 2001 and 2000. Administration anddefense costs were $ 32 million, $ 13 million and $ 7 million in 2002, 2001 and 2000.
Negotiations with representatives of asbestos claimants and pre-packaged Chapter 11 filingIn October 2002, the Company determined that it was likely that the expected asbestos-related costs of Combustion Engineering would exceed thevalue of its assets ($ 812 million at September 30, 2002), if its historical settlement policies continued into the future. The Company and CombustionEngineering determined to resolve the asbestos liability of Combustion Engineering and its affiliates, including ABB Ltd, by reorganizing CombustionEngineering under Chapter 11, the principal business reorganization chapter of the U.S. Bankruptcy Code. Under Chapter 11, a debtor is authorized toreorganize its business for the benefit of its creditors and shareholders. In addition to permitting rehabilitation of the debtor, Chapter 11 promotesequality of treatment of creditors and equity security holders who hold substantially similar claims against or interests in the debtor and its assets.Section 524(g) of the Bankruptcy Code, which is designed for companies with large numbers of asbestos-related claims, provides mechanisms forefficiently channeling asbestos-related personal injury claims through a trust and increases the likelihood that the value of an operating business can bepreserved. The Company and Combustion Engineering determined to structure the Chapter 11 reorganization as a “pre-packaged plan,” in whichacceptances of the plan would be solicited prior to the filing of the Chapter 11 case, thus reducing the duration and expense of the bankruptcyproceedings.
Beginning in October 2002, the Company and Combustion Engineering conducted extensive negotiations with representatives of asbestos claimantswith respect to a pre-packaged plan. On November 22, 2002, Combustion Engineering and the asbestos claimants’ representatives entered into aMaster Settlement Agreement for settling open asbestos-related personal injury claims that had been lodged against Combustion Engineering prior toNovember 15, 2002. At the same time, Combustion Engineering entered into a CE Settlement Trust Agreement, which provided the manner in which atrust (the “CE Settlement Trust”) would be funded and administered with respect to the payment of asbestos-related personal injury claims settled underthe Master Settlement Agreement. Under the terms of the Master Settlement Agreement, eligible claimants who met all criteria to qualify for paymentwere entitled to receive a percentage of the value of their claim from the CE Settlement Trust and retain a claim against Combustion Engineering for theunpaid balance. The Master Settlement Agreement divides claims into three categories, based on the status of the claim at November 14, 2002, thestatus of the documentation relating to the claim, and whether or not the documentation establishes a valid claim eligible for settlement and payment byCombustion Engineering. The Master Settlement Agreement was supplemented in January 2003 to clarify the rights of certain claimants whose right toparticipate in a particular payment category was disputed.
Pursuant to the Master Settlement Agreement the CE Settlement Trust was funded by:
■ cash contributions from Combustion Engineering in the amount of $ 5 million at inception;
■ cash contributions from ABB Inc., a subsidiary of ABB Ltd, on December 31, 2003 in the amount of $ 30 million;
■ a promissory note from Combustion Engineering in the principal amount of approximately $ 101 million (guaranteed by Asea Brown Boveri Inc.); and
■ an assignment by Combustion Engineering of the $ 311 million unpaid balance of principal and interest due to Combustion Engineering from AseaBrown Boveri Inc. under a loan agreement dated May 12, 2000 (guaranteed by ABB Ltd).
On January 17, 2003, the Company announced that the Company and Combustion Engineering had reached an agreement on a proposed Pre-Packaged Plan of Reorganization for Combustion Engineering under Chapter 11 of the Bankruptcy Code (the “Plan”). The agreement was reachedboth with representatives of asbestos claimants with existing asbestos-related personal injury claims against Combustion Engineering (encompassingclaimants who had lodged claims prior to November 15, 2002 and were eligible to participate in the Master Settlement Agreement and claimants whohad lodged claims after that date and were not eligible to participate in the Master Settlement Agreement) and with the proposed representative ofpersons who may be entitled to bring asbestos-related personal injury claims in the future.
(U.S. dollar amounts in millions, except per share amounts)
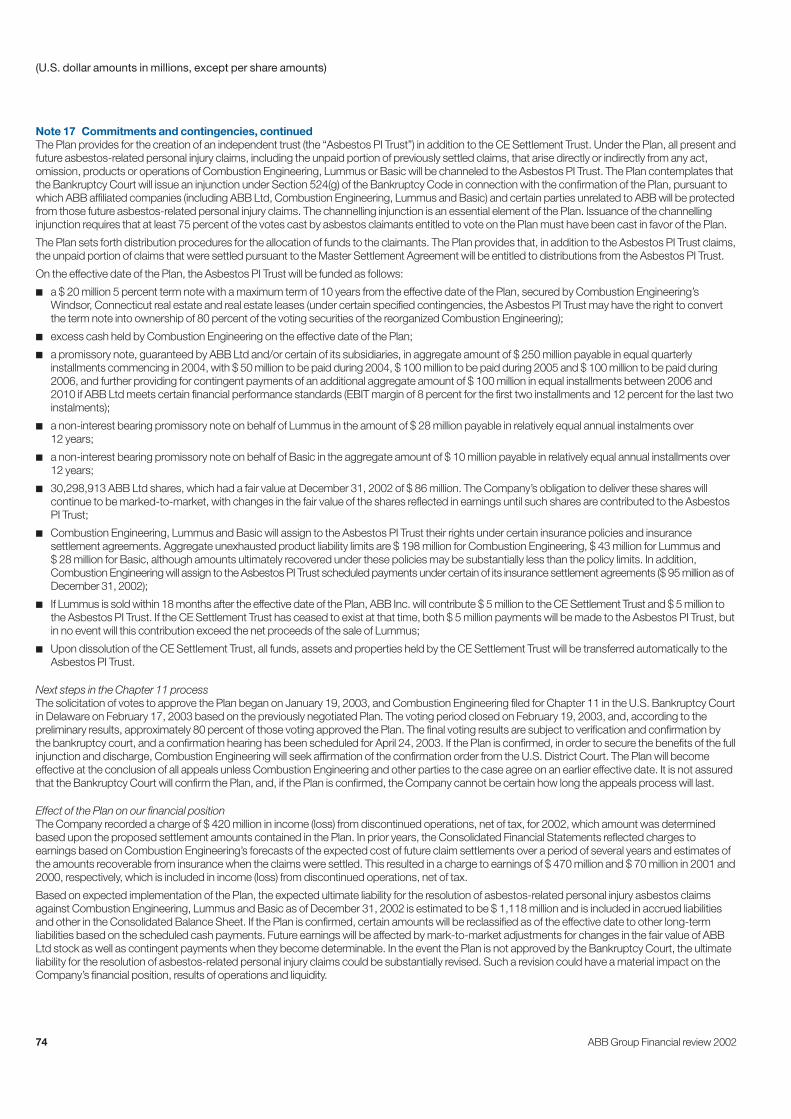
74 ABB Group Financial review 2002
Note 17 Commitments and contingencies, continuedThe Plan provides for the creation of an independent trust (the “Asbestos PI Trust”) in addition to the CE Settlement Trust. Under the Plan, all present andfuture asbestos-related personal injury claims, including the unpaid portion of previously settled claims, that arise directly or indirectly from any act,omission, products or operations of Combustion Engineering, Lummus or Basic will be channeled to the Asbestos PI Trust. The Plan contemplates thatthe Bankruptcy Court will issue an injunction under Section 524(g) of the Bankruptcy Code in connection with the confirmation of the Plan, pursuant towhich ABB affiliated companies (including ABB Ltd, Combustion Engineering, Lummus and Basic) and certain parties unrelated to ABB will be protectedfrom those future asbestos-related personal injury claims. The channelling injunction is an essential element of the Plan. Issuance of the channellinginjunction requires that at least 75 percent of the votes cast by asbestos claimants entitled to vote on the Plan must have been cast in favor of the Plan.
The Plan sets forth distribution procedures for the allocation of funds to the claimants. The Plan provides that, in addition to the Asbestos PI Trust claims,the unpaid portion of claims that were settled pursuant to the Master Settlement Agreement will be entitled to distributions from the Asbestos PI Trust.
On the effective date of the Plan, the Asbestos PI Trust will be funded as follows:
■ a $ 20 million 5 percent term note with a maximum term of 10 years from the effective date of the Plan, secured by Combustion Engineering’sWindsor, Connecticut real estate and real estate leases (under certain specified contingencies, the Asbestos PI Trust may have the right to convertthe term note into ownership of 80 percent of the voting securities of the reorganized Combustion Engineering);
■ excess cash held by Combustion Engineering on the effective date of the Plan;
■ a promissory note, guaranteed by ABB Ltd and/or certain of its subsidiaries, in aggregate amount of $ 250 million payable in equal quarterlyinstallments commencing in 2004, with $ 50 million to be paid during 2004, $ 100 million to be paid during 2005 and $ 100 million to be paid during2006, and further providing for contingent payments of an additional aggregate amount of $ 100 million in equal installments between 2006 and2010 if ABB Ltd meets certain financial performance standards (EBIT margin of 8 percent for the first two installments and 12 percent for the last twoinstalments);
■ a non-interest bearing promissory note on behalf of Lummus in the amount of $ 28 million payable in relatively equal annual instalments over 12 years;
■ a non-interest bearing promissory note on behalf of Basic in the aggregate amount of $ 10 million payable in relatively equal annual installments over12 years;
■ 30,298,913 ABB Ltd shares, which had a fair value at December 31, 2002 of $ 86 million. The Company’s obligation to deliver these shares willcontinue to be marked-to-market, with changes in the fair value of the shares reflected in earnings until such shares are contributed to the AsbestosPI Trust;
■ Combustion Engineering, Lummus and Basic will assign to the Asbestos PI Trust their rights under certain insurance policies and insurancesettlement agreements. Aggregate unexhausted product liability limits are $ 198 million for Combustion Engineering, $ 43 million for Lummus and$ 28 million for Basic, although amounts ultimately recovered under these policies may be substantially less than the policy limits. In addition,Combustion Engineering will assign to the Asbestos PI Trust scheduled payments under certain of its insurance settlement agreements ($ 95 million as ofDecember 31, 2002);
■ If Lummus is sold within 18 months after the effective date of the Plan, ABB Inc. will contribute $ 5 million to the CE Settlement Trust and $ 5 million tothe Asbestos PI Trust. If the CE Settlement Trust has ceased to exist at that time, both $ 5 million payments will be made to the Asbestos PI Trust, butin no event will this contribution exceed the net proceeds of the sale of Lummus;
■ Upon dissolution of the CE Settlement Trust, all funds, assets and properties held by the CE Settlement Trust will be transferred automatically to theAsbestos PI Trust.
Next steps in the Chapter 11 processThe solicitation of votes to approve the Plan began on January 19, 2003, and Combustion Engineering filed for Chapter 11 in the U.S. Bankruptcy Courtin Delaware on February 17, 2003 based on the previously negotiated Plan. The voting period closed on February 19, 2003, and, according to thepreliminary results, approximately 80 percent of those voting approved the Plan. The final voting results are subject to verification and confirmation bythe bankruptcy court, and a confirmation hearing has been scheduled for April 24, 2003. If the Plan is confirmed, in order to secure the benefits of the fullinjunction and discharge, Combustion Engineering will seek affirmation of the confirmation order from the U.S. District Court. The Plan will becomeeffective at the conclusion of all appeals unless Combustion Engineering and other parties to the case agree on an earlier effective date. It is not assuredthat the Bankruptcy Court will confirm the Plan, and, if the Plan is confirmed, the Company cannot be certain how long the appeals process will last.
Effect of the Plan on our financial positionThe Company recorded a charge of $ 420 million in income (loss) from discontinued operations, net of tax, for 2002, which amount was determinedbased upon the proposed settlement amounts contained in the Plan. In prior years, the Consolidated Financial Statements reflected charges toearnings based on Combustion Engineering’s forecasts of the expected cost of future claim settlements over a period of several years and estimates ofthe amounts recoverable from insurance when the claims were settled. This resulted in a charge to earnings of $ 470 million and $ 70 million in 2001 and2000, respectively, which is included in income (loss) from discontinued operations, net of tax.
Based on expected implementation of the Plan, the expected ultimate liability for the resolution of asbestos-related personal injury asbestos claimsagainst Combustion Engineering, Lummus and Basic as of December 31, 2002 is estimated to be $ 1,118 million and is included in accrued liabilitiesand other in the Consolidated Balance Sheet. If the Plan is confirmed, certain amounts will be reclassified as of the effective date to other long-termliabilities based on the scheduled cash payments. Future earnings will be affected by mark-to-market adjustments for changes in the fair value of ABBLtd stock as well as contingent payments when they become determinable. In the event the Plan is not approved by the Bankruptcy Court, the ultimateliability for the resolution of asbestos-related personal injury claims could be substantially revised. Such a revision could have a material impact on theCompany’s financial position, results of operations and liquidity.
(U.S. dollar amounts in millions, except per share amounts)

ABB Group Financial review 2002 75
Note 17 Commitments and contingencies, continuedContingencies related to former Nuclear technology businessThe Company retained liability for certain specific environmental remediation costs at two sites in the U.S. that were operated by its Nuclear technologybusiness, which has been sold to British Nuclear Fuels (BNFL) in 2000. Pursuant to the purchase agreement with BNFL, the Company has retained all ofthe environmental liabilities associated with its Combustion Engineering subsidiary’s Windsor, Connecticut facility and a portion of the environmentalliabilities associated with its ABB C-E Nuclear Power, Inc. subsidiary’s Hematite, Missouri facility. The primary environmental liabilities associated withthese sites relate to the costs of remediating radiological and chemical contamination at these facilities. Such costs are not payable until a facility is takenout of use and generally are incurred over a number of years. Although it is difficult to predict with accuracy the amount of time it may take to remediateradiological contamination upon decommissioning, based on information that BNFL has made publicly available, the Company believes that it may takeuntil 2013 to remediate the Hematite site. With respect to the Windsor site, the Company believes the remediation may take until 2008. At the Windsor site, the Company believes that a significant portion of such remediation costs will be the responsibility of the U.S. government pursuant to theAtomic Energy Act and the Formerly Used Site Environmental Remediation Action Program because such costs relate to materials used by CombustionEngineering in its research and development work on, and fabrication of, nuclear fuel for the United States Navy. As a result of the sale of the Nucleartechnology business, in April 2000 the Company established a reserve of $ 300 million in connection with estimated remediation costs related to thesefacilities. Expenditures charged to the remediation reserve were $12 million and $ 6 million during 2002 and 2001, respectively. In connection with the pre-packaged Chapter 11 filing by Combustion Engineering discussed above, the Company will retain all environmental liabilities associated with theWindsor site.
Note 18 TaxesProvision for taxes consists of the following:
Year ended December 31, 2002 2001 2000
Current taxes on income $ 258 $ 152 $ 215Deferred taxes (175) (89) 85Tax expense from continuing operations 83 63 300Tax expense from discontinued operations 72 39 128Total $ 155 $ 102 $ 428
The Company operates in countries that have differing tax laws and rates. Consequently, the consolidated weighted-average effective rate will vary fromyear to year according to the source of earnings or losses by country.
Year ended December 31, 2002 2001 2000
Reconciliation of taxes:Income (loss) from continuing operations before taxes and minority interest $ 251 $ (66) $ 1,106Weighted-average tax rate 39.0% 37.9% 37.6%Taxes at weighted-average tax rate 98 (25) 416Items taxed at rates other than the weighted-average tax rate (127) 112 (63)Non-deductible goodwill amortization – 49 45Changes in valuation allowance 108 (31) (71)Changes in enacted tax rates 1 6 (41)Other, net 3 (48) 14Tax expense from continuing operations $ 83 $ 63 $ 300Effective tax rate for the year 33.1% (95.5%) 27.1%
In 2001, the reconciling item “Other, net” of $ 48 million includes an amount of $ 50 million relating to adjustments with respect to the resolution of certainprior year tax matters.
In 2001, the income (loss) from continuing operations before taxes and minority interest of $66 million includes a provision for insurance liabilities in aninsurance subsidiary, located in a low tax jurisdiction (see Note 15). Furthermore, “Items taxed at rates other than the weighted-average tax rate”includes the tax effects of this provision and the reclassification of a $ 12 million gain on extinguishment of debt. The effective tax rate applicable toincome from continuing operations excluding the tax effect of these items would be 29.2 percent.
In 2002, the income (loss) from continuing operations before taxes and minority interest of $ 251 million includes additional financing related costs,restructuring costs, and costs related to non-core activities as well as a $ 215 million gain recorded from the change in the company’s convertible debtoutstanding. The $ 215 million gain offset in part these additional costs.
(U.S. dollar amounts in millions, except per share amounts)

76 ABB Group Financial review 2002
Note 18 Taxes, continuedDeferred income tax assets and liabilities consist of the following:
December 31, 2002 2001
Deferred tax liabilities:Financing receivables $ (226) $ (194)Property, plant and equipment (421) (458)Pension and other accrued liabilities (356) (252)Insurance reserves (230) (190)Other (186) (145)
Total deferred tax liability (1,419) (1,239)Deferred tax assets:
Investments and other 2 14Property, plant and equipment 58 185Pension and other accrued liabilities 857 952Unused tax losses and credits 1,075 697Other 332 238
Total deferred tax asset 2,324 2,086Valuation allowance (1,227) (1,145)Deferred tax asset, net of valuation allowance 1,097 941Net deferred tax liability $ (322) $ (298)
Deferred tax assets and deferred tax liabilities can be allocated between current and non-current as follows:
December 31, 2002 2001
Current Non-current Current Non-current
Deferred tax liability $ (253) $ (1,166) $ (190) $ (1,049)Deferred tax asset, net 558 539 495 446Net deferred tax asset (liability) $ 305 $ (627) $ 305 $ (603)
The non-current deferred tax asset, net, is included in investments and other.
Certain entities have deferred tax assets related to net operating loss carry-forwards and other items. Because recognition of these assets is uncertain,valuation allowances of $1,227 million and $1,145 million have been established as of December 31, 2002 and 2001, respectively.
At December 31, 2002, net operating loss carry-forwards of $ 2,815 million and tax credits of $ 66 million are available to reduce future taxable income of certain subsidiaries, of which $1,240 million loss carry-forwards and $ 42 million tax credits expire in varying amounts through 2022 and theremainder do not expire. These carry-forwards are predominately related to the Company’s U.S. and German operations.
Note 19 Other liabilitiesThe Company’s other liabilities amount to $1,647 million and $ 2,280 million at December 31, 2002 and 2001, respectively.
Other liabilities include non-current provisions of $ 460 million and $1,241 million, advances from customers relating to long-term construction contractsof $ 612 million and $ 539 million and non-current deferred income of $151 million and $ 89 million at December 31, 2002 and 2001, respectively. In2001 non-current provisions included $806 million, which was reclassified in 2002 from other liabilities to accrued liabilities and other (see Note 17).
The Company entered into tax advantaged leasing transactions with U.S. investors prior to 1999. Prepaid rents that have been received on thesetransactions are $ 349 million and $ 355 million at December 31, 2002 and 2001, respectively, and have been recorded as deposit liabilities. Net gains on these transactions are being recognized over the lease terms.
Note 20 Employee benefitsThe pension and other related benefit liability, net of the prepaid pension and other related benefits, in the Consolidated Balance Sheet was $1,102million and $1,230 million at December 31, 2002 and December 31, 2001, respectively. The decrease is primarily due to an increase in contributionsduring 2002.
The Company operates several pension plans, including defined benefit, defined contribution and termination indemnity, in accordance with localregulations and practices. These plans cover the majority of the Company’s employees and provide benefits to employees in the event of death,disability, retirement or termination of employment. Certain of these plans are multi-employer plans.
Some of these plans require employees to make contributions and enable employees to earn matching or other contributions from the Company. The funding policy of these plans is consistent with the local government and tax requirements. The Company has several pension plans which are notrequired to be funded pursuant to local government and tax requirements.
(U.S. dollar amounts in millions, except per share amounts)

ABB Group Financial review 2002 77
Note 20 Employee benefits, continuedDefined benefit plans provide benefits primarily based on employees’ years of service, age and salary. The cost and obligations from sponsoring definedbenefit plans are determined on an actuarial basis using the projected unit credit method. This method reflects service rendered by the employees to thedate of valuation and incorporates assumptions concerning employees’ projected salaries.
For the years ended December 31, 2002, 2001 and 2000, net periodic pension cost consists of the following:
Pension benefits Other benefits
2002 2001 2000 2002 2001 2000
Service cost $ 186 $ 177 $ 202 $ 6 $ 5 $ 5Interest cost 318 311 314 28 26 23Expected return on plan assets (281) (291) (306) – – –Amortization of transition liability 13 9 10 6 6 6Amortization of prior service cost 15 14 34 – – –Recognized net actuarial (gain) loss 22 4 (1) 6 3 1Other 9 (19) 12 – – –Total $ 282 $ 205 $ 265 $ 46 $ 40 $ 35
The following tables set forth the change in benefit obligations, the change in plan assets and the funded status recognized in the Consolidated FinancialStatements at December 31, 2002 and 2001, for the Company’s principal benefit plans:
Pension benefits Other benefits
2002 2001 2002 2001
Benefit obligation at the beginning of year $ 6,005 $ 6,012 $ 389 $ 342Service cost 186 177 6 5Interest cost 318 311 28 26Contributions from plan participants 43 36 4 2Benefit payments (437) (373) (34) (32)Benefit obligations of businesses acquired 46 9 – –Benefit obligations of businesses disposed (14) (6) – –Actuarial (gain) loss (60) 48 26 46Plan amendments and other (56) – (5) 1Exchange rate differences 993 (209) – (1)
Benefit obligation at the end of year 7,024 6,005 414 389Fair value of plan assets at the beginning of the year 4,226 4,592 – –
Actual return on plan assets (84) (300) – –Contributions from employer 717 372 30 30Contributions from plan participants 43 36 4 2Benefit payments (437) (373) (34) (32)Plan assets of businesses acquired 44 6 – –Plan assets of businesses disposed (3) (1) – –Other (50) 17 – –Exchange rate differences 689 (123) – –
Fair value of plan assets at the end of year 5,145 4,226 – –Unfunded amount(1) 1,879 1,779 414 389Unrecognized transition liability (1) (9) (60) (67)Unrecognized actuarial loss (1,168) (781) (150) (131)Unrecognized prior service cost (57) (67) – (3)Net amount recognized $ 653 $ 922 $ 204 $ 188(1) These amounts include $1,070 million and $863 million at December 31, 2002 and 2001, respectively, for pension plans which are not required to be funded pursuant to local government
and tax requirements.
(U.S. dollar amounts in millions, except per share amounts)

78 ABB Group Financial review 2002
(U.S. dollar amounts in millions, except per share amounts)
Note 20 Employee benefits, continuedThe following amounts have been recognized in the Company’s Consolidated Balance Sheet at December 31, 2002 and 2001:
Pension benefits Other benefits
2002 2001 2002 2001
Prepaid pension cost $ (572) $ (389) $ – $ –Accrued pension cost 1,428 1,380 204 188Intangible assets (24) (14) – –Accumulated other comprehensive loss (179) (55) – –Net amount recognized $ 653 $ 922 $ 204 $ 188
The pension and other related benefits liability reported in the Consolidated Balance Sheet contains an accrual of $ 27 million and $ 49 million atDecember 31, 2002 and 2001, respectively, and the prepaid pension and other related benefits asset reported in the Consolidated Balance Sheetcontains $15 million and $ 2 million at December 31, 2002 and 2001, respectively, for employee benefits that do not meet the criteria of Statement ofFinancial Accounting Standards No. 87, Employers’ Accounting for Pensions (SFAS 87) or Statement of Financial Accounting Standards No. 106,Employers’ Accounting for Postretirement Benefits Other Than Pensions.
The pension and other related benefits liability reported in the Consolidated Balance Sheet includes $ 203 million and $ 69 million at December 31, 2002and 2001, respectively, to record a minimum pension liability. The increase in the minimum pension liability from 2001 is primarily attributable to changesin the discount rate in the German and U.S. pension plans that do not have plan assets.
The Company has a defined benefit pension plan that covers substantially all employees in Sweden. Effective December 31, 2002, the assets which had previously been pledged to the plan were contributed and have been reflected as a component of “fair value of plan assets” as of December 31, 2002 (see Note 5).
During 2002 and 2001, the Company contributed $188 million and $162 million, respectively, of available-for-sale debt securities to certain of theCompany’s pension plans in the United States and the United Kingdom.
The projected benefit obligation (PBO) and fair value of plan assets for pension plans with benefit obligations in excess of plan assets were:
2002 2001
December 31, PBO Assets Difference PBO Assets Difference
PBO exceeds assets $ 6,956 $ 5,068 $ 1,888 $ 5,911 $ 4,123 $ 1,788Assets exceed PBO 68 77 (9) 94 103 (9)Total $ 7,024 $ 5,145 $ 1,879 $ 6,005 $ 4,226 $ 1,779
The accumulated benefit obligation and fair value of plan assets for pension plans with accumulated benefit obligations in excess of plan assets were:
2002 2001
December 31, ABO Assets Difference ABO Assets Difference
ABO exceeds assets $ 5,524 $ 4,206 $ 1,318 $ 2,330 $ 1,141 $ 1,189Assets exceed ABO 911 939 (28) 2,983 3,085 (102)Total $ 6,435 $ 5,145 $ 1,290 $ 5,313 $ 4,226 $ 1,087
At December 31, 2002 and 2001, the assets of the plans were comprised of:
Pension benefits
2002 2001
Equity securities 33% 35%Debt securities 51% 47%Other 16% 18%
At December 31, 2002 and 2001, plan assets included $ 3 million and $ 6 million, respectively, of the Company’s capital stock.
The following weighted-average assumptions were used in accounting for defined benefit pension plans, for the years ended December 31, 2002 and 2001:
Pension benefits Other benefits
2002 2001 2002 2001
Discount rate 5.05% 5.32% 6.74% 7.24%Expected return on plan assets 6.15% 6.81% – –Rate of compensation increase 3.05% 3.07% – –
The Company has multiple non-pension post-retirement benefit plans. The Company’s health care plans are generally contributory with participants’contributions adjusted annually. The health care trend rate was assumed to be 12.92 percent for 2002, then gradually declining to 6.46 percent in 2012,and to remain at that level thereafter.

ABB Group Financial review 2002 79
Note 20 Employee benefits, continuedAssumed health care cost trends have a significant effect on the amounts reported for the health care plans. A one-percentage-point change inassumed health care cost trend rates would have the following effects at December 31, 2002:
One-percentage- One-percentage-point increase point decrease
Effect on total of service and interest cost components $ 2 $ (2)Effect on accumulated post-retirement benefit obligation $ 26 $ (22)
The Company also maintains several defined contribution plans. The expense for these plans was $ 23 million, $ 26 million and $ 27 million in 2002,2001 and 2000, respectively. The Company also contributed $141 million, $135 million and $108 million to multi-employer plans in 2002, 2001 and2000, respectively.
Note 21 Management incentive planThe Company has a management incentive plan under which it offers stock warrants and warrant appreciation rights (WARs) to key employees for noconsideration.
Warrants granted under this plan allow participants to purchase shares of the Company at predetermined prices. Participants may sell the warrantsrather than exercise the right to purchase shares. Equivalent warrants are listed on the SWX Swiss Exchange (virt-x), which facilitates valuation andtransferability of warrants granted under this plan.
Each WAR gives the participant the right to receive, in cash, the market price of a warrant on the date of exercise of the WAR. The WARs are non-transferable.
Participants may exercise or sell warrants and exercise WARs after the vesting period, which is three years from the date of grant. Vesting restrictionscan be waived in the event of death, disability or divorce. All warrants and WARs expire six years from the date of grant. The terms and conditions of theplan allow the employees of subsidiaries that have been divested to retain their warrants and WARs. As the primary trading market for shares of ABB Ltdis the SWX Swiss Exchange (virt-x), the exercise prices of warrants and the trading prices of equivalent warrants listed on the SWX Swiss Exchange (virt-x) are denominated in Swiss Francs (CHF). Accordingly, exercise prices are presented below in CHF. Fair values have been presented in U.S. dollarsbased upon exchange rates in effect as of the applicable period.
WarrantsThe Company accounts for the warrants using the intrinsic value method of APB Opinion No. 25 (APB 25), Accounting for Stock Issued to Employees,as permitted by Statement of Financial Accounting Standards No. 123 (SFAS 123), Accounting for Stock Based Compensation. All warrants wereissued with exercise prices greater than the market prices of the stock on the dates of grant. Accordingly, the Company has recorded no compensationexpense related to the warrants, except in circumstances when a participant ceased to be employed by a consolidated subsidiary, such as after adivestment by the Company. In accordance with FASB Interpretation No. 44, Accounting for Certain Transactions Involving Stock Compensation, theCompany recorded compensation expense based on the fair value of warrants retained by participants on the date their employment ceased, with anoffset to additional paid in capital. The impact of such expense is not material.
Presented below is a summary of warrant activity for the years shown:Weighted-
averageNumber of Number of exercise
warrants shares (1) price (CHF)(2)
Outstanding at January 1, 2000 27,699,040 10,267,288 32.34Granted (3) 28,128,360 5,625,672 53.00Forfeited (385,000) (65,789) 38.42Outstanding at December 31, 2000 55,442,400 15,827,171 38.75Granted (4) 23,293,750 4,658,750 17.00Forfeited (2,240,000) (461,452) 48.53Outstanding at December 31, 2001 76,496,150 20,024,469 33.46Forfeited (8,105,090) (1,621,018) 30.29Outstanding at December 31, 2002 68,391,060 18,403,451 33.74
Exercisable at December 31, 2000 60,000 38,904 28.22Exercisable at December 31, 2001 10,538,000 6,832,839 27.95Exercisable at December 31, 2002 29,751,060 10,675,451 32.41(1) All warrants granted prior to 1999 require the exercise of 100 warrants for 64.84 registered shares of ABB Ltd. All other warrants require the exercise of five warrants for one registered share of
ABB Ltd. Information presented reflects the number of registered shares of ABB Ltd that warrant holders can receive upon exercice.(2) Information presented reflects the exercise price per registered share of ABB Ltd.(3) The aggregate fair value at date of grant of warrants issued in 2000 was $ 54 million, assuming a dividend yield of 1.7 percent, expected volatility of 33 percent, risk-free interest rate of
4.4 percent, and an expected life of six years.(4) The aggregate fair value at date of grant of warrants issued in 2001 was $ 16 million, assuming a dividend yield of 1.25 percent, expected volatility of 47 percent, risk-free interest rate of
3.5 percent, and an expected life of six years.
(U.S. dollar amounts in millions, except per share amounts)

80 ABB Group Financial review 2002
Note 21 Management incentive plan, continuedPresented below is a summary of warrants outstanding at December 31, 2002
Weighted-Exercise price Number of Number of average(presented in CHF)(1) warrants shares (2) remaining life
30.89 4,743,000 3,075,361 1.0 years25.54 5,795,000 3,757,478 1.9 years37.50 4,648,060 929,612 2.4 years41.25 14,565,000 2,913,000 2.9 years53.00 19,940,000 3,988,000 3.5 years17.00 18,700,000 3,740,000 4.9 years(1) Information presented reflects the exercise price per registered share of ABB Ltd.(2) Information presented reflects the number of registered shares of ABB Ltd that warrant holders can receive upon exercise of warrants.
WARsAs each WAR gives the holder the right to receive cash equal to the market price of a warrant on date of exercise, the Company is required by APB 25 to record a liability based upon the fair value of outstanding WARs at each period end, amortized on a straight-line basis over the three-year vestingperiod. In selling, general and administrative expenses, the Company recorded income of $14 million and $ 58 million for 2002 and 2001, respectively,and expense of $ 31 million in 2000, excluding amounts charged to income (loss) from discontinued operations, net of tax, as a result of changes in the fair value of the outstanding WARs and the vested portion. In June 2000, to hedge its exposure to fluctuations in fair value of outstanding WARs, the Company purchased cash-settled call options from a bank, which entitle the Company to receive amounts equivalent to its obligations under theoutstanding WARs. In accordance with Emerging Issues Task Force No. 00-19 (EITF 00-19), Accounting for Derivative Financial Instruments Indexed to,and Potentially Settled in a Company’s Own Stock, the cash-settled call options have been recorded as assets measured at fair value, with subsequentchanges in fair value recorded through earnings as an offset to the compensation expense recorded in connection with the WARs. During 2002, 2001and 2000, excluding amounts charged to income (loss) from discontinued operations, net of tax, the Company recognized expense of $ 26 million, $ 54 million and $ 4 million, respectively, in interest and other finance expense, related to the cash-settled call options.
The aggregate fair value of outstanding WARs was $ 9 million and $ 53 million at December 31, 2002 and 2001, respectively. Fair value of WARs wasdetermined based upon the trading price of equivalent warrants listed on the SWX Swiss Exchange (virt-x).
Presented below is a summary of WAR activity for the years shown.
Number ofWARs
outstanding
Outstanding at January 1, 2000 35,249,400Granted 30,846,640Exercised (25,000)Forfeited (710,000)Outstanding at December 31, 2000 65,361,040Granted 39,978,750Exercised (548,000)Forfeited (1,238,720)Outstanding at December 31, 2001 103,553,070Exercised (1,455,080)Forfeited (3,803,750)Outstanding at December 31, 2002 98,294,240
At December 31, 2002, and December 31, 2001, 26, 974,240 and 9,087,000 of the WARs were exercisable, respectively. No WARs were granted in 2002. The aggregate fair value at date of grant of WARs issued in 2001 and 2000 was $ 28 million and $ 80 million, respectively.
(U.S. dollar amounts in millions, except per share amounts)

ABB Group Financial review 2002 81
Note 22 Stockholders’ equityAt December 31, 2002, including the warrants issued under the management incentive plan and call options sold to a bank at fair value during 2001, the Company had outstanding obligations to deliver 40 million shares at exercise prices ranging from CHF 17.00 to CHF 53.00. The call options expire in periods ranging from 2004 to 2007 and were recorded as equity instruments in accordance with EITF 00-19. Also, at December 31, 2002, theCompany had obligations to deliver 85 million shares at an exercise price of CHF 18.48 as a result of the issuance of convertible debt in May 2002. Inaddition pursuant to the Plan of reorganization of Combustion Engineering, as described in Note 17, the Company will contribute 30 million shares tothe Asbestos PI Trust.
During 2000, the Company sold 18 million shares of its treasury stock to a bank at fair market value and sold put options which enabled the bank to sell up to 18 million shares to the Company at exercise prices ranging from CHF 25.54 to CHF 53.00 per share. The put options were recorded as equity instruments in accordance with EITF 00-19, as the terms of the put options allowed the Company to choose a net share settlement. In 2001, theCompany settled the outstanding written put options by purchasing the 18 million shares at a weighted average exercise price of CHF 40.93 per share.
Dividends are payable to the Company’s stockholders based on the requirements of Swiss law, ABB Ltd’s Articles of Incorporation, and stockholders’equity as reflected in the unconsolidated financial statements of ABB Ltd prepared in compliance with Swiss law. At December 31, 2002, of the CHF 6,647 million stockholders’ equity recorded in such unconsolidated financial statements, CHF 3,000 million was share capital, another CHF 3,545 million was restricted and CHF 102 million is available for distribution.
In March 2003, the Company sold 80 million treasury shares in two transactions for approximately $156 million.
Note 23 Earnings per shareBasic earnings per share is calculated by dividing income by the weighted-average number of shares outstanding during the year. Diluted earnings pershare is calculated by dividing income by the weighted-average number of shares outstanding during the year, assuming that all potentially dilutivesecurities were exercised and that any proceeds from such exercises were used to acquire shares of the Company’s stock at the average market priceduring the year or the period the securities were outstanding, if shorter. Potentially dilutive securities comprise: outstanding written call options, if dilutive;the securities issued under the Company’s management incentive plan, to the extent the average market price of the Company’s stock exceeded theexercise prices of such instruments; shares issuable in relation to the convertible bonds if dilutive; and outstanding written put options, for which netshare settlement at average market price of the Company’s stock was assumed, if dilutive.
The shares issuable in relation to the warrants and options outstanding in connection with the Company’s management incentive plan were excludedfrom the computation of diluted earnings per share in 2002 and 2001, as their inclusion would have been antidilutive. In 2000, only those warrants andoptions that were considered dilutive have been included in the computation of diluted earnings per share. In 2002, the shares issuable in relation to theconvertible bonds were included in the computation of diluted earnings per share for the period they were outstanding.
Basic earnings per share:
Year ended December 31, 2002 2001 2000
Income (loss) from continuing operations $ 97 $ (165) $ 766Income (loss) from discontinued operations, net of tax (880) (501) 677Cumulative effect of change in accounting principles (SFAS 133), net of tax – (63) –Net income (loss) $ (783) $ (729) $ 1,443
Weighted average number of shares outstanding (in millions) 1,113 1,132 1,180
Earnings per share:Income (loss) from continuing operations $ 0.09 $ (0.15) $ 0.65Income (loss) from discontinued operations, net of tax (0.79) (0.43) 0.57Cumulative effect of change in accounting principles (SFAS 133), net of tax – (0.06) –Net income (loss) $ (0.70) $ (0.64) $ 1.22
(U.S. dollar amounts in millions, except per share amounts)

82 ABB Group Financial review 2002
Note 23 Earnings per share, continuedDiluted earnings per share:
Year ended December 31, 2002 2001 2000
Income (loss) from continuing operations $ 97 $ (165) $ 766Effect of dilution:
Convertible bonds, net of tax (187) – –Income (loss) from continuing operations, adjusted (90) (165) 766Income (loss) from discontinued operations, net of tax (880) (501) 677Cumulative effect of change in accounting principles (SFAS 133), net of tax – (63) –Net income (loss), adjusted $ (970) $ (729) $ 1,443
Weighted average number of shares outstanding (in millions) 1,113 1,132 1,180Dilutive potential shares:
Warrants and options – – 5Convertible bonds 53 – –
Diluted weighted average number of shares outstanding (in millions) 1,166 1,132 1,185
Earnings per share:Income (loss) from continuing operations, adjusted $ (0.08) $ (0.15) $ 0.65Income (loss) from discontinued operations, net of tax (0.75) (0.43) 0.57Cumulative effect of change in accounting principles (SFAS 133), net of tax – (0.06) –Net income (loss), adjusted $ (0.83) $ (0.64) $ 1.22
Warrants and options to purchase 40 million shares were not included in the computation of diluted earnings per share for 2002 because the exerciseprices were greater than the average market price of the Company’s shares during the period the instruments were outstanding.
Note 24 Restructuring chargesDuring the first quarter of 1999 and in connection with its purchase of Elsag Bailey, the Company implemented a restructuring plan intended toconsolidate operations and gain operational efficiencies. The plan called for workforce reductions of approximately 1,500 salaried employees primarily in Germany and the United States (EB Restructuring). Restructuring charges and related write downs of $192 million were included in other income (expense), net, during 2000, of which approximately $ 90 million related to the continued integration of Elsag Bailey. The EB Restructuring wassubstantially complete at the end of 2000.
In July 2001, the Company announced a restructuring program (2001 program) anticipated to extend over 18 months. The 2001 program was initiatedin an effort to improve productivity, reduce cost base, simplify product lines, reduce multiple location activities and perform other downsizing in responseto weakening markets and consolidation of major customers in certain industries.
In 2001 the Company recognized restructuring charges of $109 million relating to workforce reductions and $ 71 million related to lease terminationsand other exit costs associated with the restructuring program. These costs are included in other income (expense), net. Termination benefits of $ 32 million were paid to approximately 2,150 employees and $ 31 million was paid to cover costs associated with lease terminations and other exitcosts. Workforce reductions include production, managerial and administrative employees. At December 31, 2001, accrued liabilities included $ 78 million for termination benefits and $ 39 million for lease terminations and other exit costs.
In 2002 the Company recognized charges of $166 million related to workforce reductions and charges of $ 38 million related to lease terminations andother exit costs associated with the 2001 program. These costs are included in other income (expense), net. Based on changes in management’soriginal estimate a $ 21 million reduction in the amounts accrued for workforce reductions, lease terminations and other exit costs have been included in other income (expense), net. Currency fluctuations resulted in a $ 24 million increase in the liabilities accrued for workforce reductions, leaseterminations and other exit costs. Termination benefits of $149 million were paid to approximately 4,000 employees and $ 29 million was paid to covercosts associated with lease terminations and other exit costs. Workforce reductions include production, managerial and administrative employees. AtDecember 31, 2002, accrued liabilities included $ 94 million for termination benefits and $ 52 million for lease terminations and other exit costs. The2001 program was substantially completed during 2002 and the remaining liability will be used through 2003.
As a result of the 2001 program, certain assets, inventories and property, plant and equipment have been identified as impaired or will no longer be usedin continuing operations. The Company recorded $ 18 million and $41 million in 2002 and 2001, respectively, to write down these assets to fair value.These costs are included in cost of sales and other income (expense), net.
In October 2002, the Company announced the Step change program. Detailed project planning continues to be developed and evaluated bymanagement. The Company estimates that restructuring cost under the program will be approximately $ 300 million and $ 200 million in 2003 and 2004,respectively. The goals of the program are to increase competitiveness of the Company’s core businesses, reduce overhead costs and streamlineoperations by approximately $ 800 million on an annual basis by 2005. The Step change program is expected to be completed by mid-2004.
(U.S. dollar amounts in millions, except per share amounts)

ABB Group Financial review 2002 83
Note 24 Restructuring charges, continuedIn 2002, related to Step change program, the Company recognized restructuring charges of $ 51 million related to workforce reductions and $ 26 millionrelated to lease terminations and other exit costs associated with the restructuring program. These costs are included in other income (expense), net.Termination benefits of $ 13 million were paid to approximately 200 employees and $ 1 million was paid to cover costs associated with leaseterminations and other exit costs. Workforce reductions include production, managerial and administrative employees. At December 31, 2002, accruedliabilities included $ 38 million for termination benefits and $ 25 million for lease terminations and other exit costs.
As a result of the Step change program, certain assets have been identified as impaired or will no longer be used in continuing operations. The Companyrecorded $ 2 million to write down these assets to fair value. These costs are included in other income (expense), net.
2001 program Step change Other Total
Year ended December 31, 2002Restructuring charge for workforce reduction $ 166 $ 51 $ – $ 217Restructuring charge for lease terminations and other 38 26 – 64Write-down cost 18 2 – 20Change in estimate (21) – (9) (30)Total restructuring charges and related asset write-downs $ 201 $ 79 $ ( 9) $ 271
Year ended December 31, 2001Restructuring charge for workforce reduction $ 109 $ – $ – $ 109Restructuring charge for lease terminations and other 71 – – 71Write-down cost 41 – – 41Change in estimate – – – –Total restructuring charges and related asset write-downs $ 221 $ – $ – $ 221
Note 25 Segment and geographic dataDuring 2001, the Company realigned its worldwide enterprise around customer groups, replacing its former business segments with four end-userdivisions, two channel partner divisions, and a financial services division. The four end-user divisions – Utilities, Process Industries, Manufacturing andConsumer Industries, and Oil, Gas and Petrochemicals – served end-user customers with products, systems and services. The two channel partnerdivisions – Power Technology Products and Automation Technology Products – served external channel partners such as wholesalers, distributors,original equipment manufacturers and system integrators directly and end-user customers indirectly through the end-user divisions. The FinancialServices division provided services and project support for the Company’s internal as well as for the Company’s external customers.
The Utilities division served electric, gas and water utilities – whether state-owned or private, global or local, operating in liberalized or regulated markets – with a portfolio of products, services and systems. The division’s principal customers were generators of power, owners and operators ofpower transmission systems, energy traders and local distribution companies. The Utilities division employed approximately 14,800 people as ofDecember 31, 2002.
In April 2002, the Company merged its Process Industries division and its Manufacturing and Consumer Industries division to form a new Industriesdivision. The Industries division served the automotive, cement, chemical, distribution, electronics, food and beverage, life sciences, marine, metals,mining, paper, petroleum, printing and telecommunications industries with application-specific power and automation technology. The Industriesdivision employed approximately 23,300 people as of December 31, 2002.
The Power Technology Products division covered the entire spectrum of technology for power transmission and power distribution includingtransformers, switchgear, breakers, capacitors and cables as well as other products, platforms and technologies for high- and medium-voltageapplications. Power technology products are used in industrial, commercial and utility applications. These products were sold through the Company’send-user divisions as well as through external channel partners, such as distributors, contractors and original equipment manufacturers and systemintegrators. The Power Technology Products division employed approximately 26,400 people as of December 31, 2002.
The Automation Technology Products division provided products, software and services for the automation and optimization of industrial andcommercial processes. Key technologies include measurement and control, instrumentation, process analysis, drives and motors, power electronics,robots, and low voltage products. These technologies were sold to customers through the end-user divisions as well as through external channelpartners such as wholesalers, distributors, original equipment manufacturers and system integrators. The Automation Technology Products divisionemployed approximately 33,300 people as of December 31, 2002.
The Oil, Gas and Petrochemicals division supplied a comprehensive range of products, systems and services to the global oil, gas and petrochemicalsindustries, from the development of onshore and offshore exploration technologies to the design and supply of production facilities, refineries andpetrochemicals plants. The Oil, Gas and Petrochemicals division employed approximately 11,900 people as of December 31, 2002. The Companyannounced in 2002 that the Company intend to dispose of this business division (see Note 3).
The Financial Services division supported the Company’s businesses and customers with financial solutions in structured finance, leasing, projectdevelopment and ownership, financial consulting, insurance and treasury activities. In 2002 a significant part of the division’s structured finance andleasing activities were sold to GE Commercial Finance. Proprietary trading activities in treasury centers ceased and remaining treasury activities wereintegrated in Corporate. The insurance and project development and ownership activities were transferred to the Non-Core Activities division.
(U.S. dollar amounts in millions, except per share amounts)

84 ABB Group Financial review 2002
Note 25 Segment and geographic data, continuedNon-Core Activities includes the following:
■ the Company’s Insurance business area (part of the former Financial Services division);
■ the Company’s Equity Ventures business area and the remaining Structured Finance business that was not sold to GE Commercial Finance (part of the former Financial Services division);
■ the Company’s Building Systems business area;
■ the Company’s New Ventures business area;
■ the Company’s Customer Service, Group Processes, Logistic Systems, and Semiconductors business areas.
Corporate includes Headquarters, Central Research and Development, Real Estate, as well as, beginning in 2002, Treasury Services.
The Company evaluates performance of its divisions based on earnings before interest and taxes (EBIT), which excludes interest and dividend income,interest expense, provision for taxes, minority interest, and income (loss) from discontinued operations, net of tax. In accordance with Statement ofFinancial Accounting Standards No. 131, Disclosures about Segments of an Enterprise and Related Information, the Company presents divisionrevenues, depreciation and amortization, amortization of goodwill in 2001 and 2000, restructuring charges and related asset write-downs, EBIT, netoperating assets and capital expenditures, all of which have been reclassified to reflect the changes to the Company’s internal structure, including theeffect of inter-division transactions. Division revenues and EBIT are presented as if certain historical third-party sales by subsidiaries in product-supplyingdivisions had been routed through other divisions as they would have been under the customer-centric structure. Management has reflected prioryears’ divisional financial information in this way to allow analysis of trends in divisional revenues and margins on a basis consistent with the Company’sthen existing structure and transaction flow.
The following tables summarize information for each reportable division:
RestructuringDepreciation charge and Net
and Amortization related assets operating Capital2002 Revenues (1) amortization of goodwill write-downs EBIT (2) (3) assets (4)(7) expenditures
Utilities $ 4,826 $ 52 $ – $ 31 $ 75 $ 992 $ 20Industries 4,412 56 – 59 145 1,129 21Power Technology Products 4,355 117 – 29 353 1,389 97Automation Technology Products 5,035 145 – 80 373 2,278 112Non-Core Activities:
Insurance 657 2 – – 40 1,397 1Equity Ventures(5) 21 – – – 38 1,096 –Structured Finance(6) 92 9 – – 116 1,346 –Building Systems 2,372 11 – 22 (114) 68 9New Ventures 132 13 – 15 (68) 308 15Other Non-Core Activities 912 75 – 15 (171) (456) 29
Total Non-Core Activities 4,186 110 – 52 (159) 3,759 54Corporate / Other 527 76 – 20 (317) 9,344 143Inter-division elimination (5,046) – – – (76) (7,633) –Consolidated $ 18,295 $ 556 $ – $ 271 $ 394 $ 11,258 $ 447
(U.S. dollar amounts in millions, except per share amounts)

ABB Group Financial review 2002 85
Note 25 Segment and geographic data, continued
RestructuringDepreciation charge and Net
and Amortization related assets operating Capital2001 (restated) Revenues (1) amortization of goodwill write-downs EBIT(2)(3)(8) assets (4)(7)(8) expenditures
Utilities $ 5,634 $ 49 $ 24 $ 24 $ 158 $ 790 $ 27Industries 4,995 53 41 38 151 924 35Power Technology Products 3,961 113 6 52 234 1,283 105Automation Technology Products 4,756 145 54 43 364 2,287 109Non-Core Activities:
Insurance 956 – 6 – (342) 1,093 1Equity Ventures(5) 35 – – – 76 1,160 –Structured Finance(6) 133 10 – – 27 1,789 3Building Systems 2,568 16 – 2 20 (23) 10New Ventures 113 17 – 6 (167) 262 34Other Non-Core Activities 1,325 68 – 14 (66) (795) 74
Total Non-Core Activities 5,130 111 6 22 (452) 3,486 122Corporate / Other 612 62 24 42 (165) 7,320 173Inter-division elimination (5,706) – – – (133) (5,346) –Consolidated $ 19,382 $ 533 $ 155 $ 221 $ 157 $ 10,744 $ 571
RestructuringDepreciation charge and Net
and Amortization related assets operating Capital2000 Revenues (1) amortization of goodwill write-downs EBIT(2)(3) assets (4)(7) expenditures
Utilities $ 5,460 $ 34 $ 41 $ 39 $ 251 $ 755 $ 26Industries 5,443 47 55 42 197 829 44Power Technology Products 3,587 114 8 38 244 1,302 105Automation Technology Products 4,671 190 36 45 445 2,436 111Non-Core Activities:
Insurance 805 1 5 – 98 912 1Equity Ventures(5) 41 – – – 70 556 –Structured Finance(6) 126 13 – – 47 1,309 10Building Systems 2,506 17 – – 57 57 11New Ventures 108 3 – – (12) 60 3Other Non-Core Activities 1,236 74 1 – (43) 583 70
Total Non-Core Activities 4,822 108 6 – 217 3,477 95Corporate / Other 780 100 6 28 (135) 5,335 58Inter-division elimination (5,408) – – – (46) (2,567) –Consolidated $ 19,355 $ 593 $ 152 $ 192 $ 1,173 $ 11,567 $ 439(1) Revenues have been reclassified for the Utilities and Industries divisions to reflect the increase in sales that would have occurred if the Company’s 2002 internal structure and transaction flow
had been in place for all periods presented. The effect of assuming that certain historical sales by the product divisions would have been routed through other divisions before final sale to anexternal customer, as they would have been if the customer-centric structure had been in place in those prior years, was to increase division revenues for 2002, 2001 and 2000, respectively,by $ 1,363 million, $ 2,119 million and $ 2,139 million for the Utilities division and by $ 276 million, $ 847 million and $ 1,039 million for the Industries division. The Company assumed that internal pricing structures for these inter-division sales were also in place for all periods presented, resulting in a reduction to division revenues for 2002, 2001 and 2000, respectively, by $ 55 million, $ 99 million, and $ 211 million for the Power Technology Products division; and by $ 84 million, $ 153 million and $ 200 million for the Automation Technology division.
(2) Consistent with the assumptions described in (1) above, division EBIT reflects the retroactive transfer of profits of $ 0 million, $ 41 million, and $ 46 million in 2002, 2001 and 2000, respectively,from Power Technology and Automation Technology Products, to Utilities and Industries, in order to reflect the impact that these inter-divisional sales would have had on historical results.
(3) EBIT, excluding amortization of goodwill in 2001 and 2000, would have been $ 394 million, $ 312 million and $ 1,325 million in 2002, 2001 and 2000, respectively.(4) Corporate / Other includes net operating assets of $ 7,723 million, $ 5,551 million and $ 4,018 million relating to the former Financial Service Treasury Center business area in 2002, 2001 and
2000, respectively.(5) Includes the Company’s investment in Jorf Lasfar Energy Company S.C.A.(6) Includes the Company’s investment in Swedish Export Credit Corporation.(7) Net operating assets is calculated based upon total assets (excluding cash and equivalents, marketable securities, current loans receivable, taxes and deferred charges) less current liabilities
(excluding borrowings, taxes, provisions and pension-related liabilities).(8) Restated, See Notes 2 and 13.
Effective January 1, 2003, in order to streamline the Company’s structure and improve operational performance, the Company has put into place twodivisions: Automation Technologies, which combines the former Automation Technology Products and Industries divisions and employs approximately56,600 people; and Power Technologies, which combines the former Power Technology Products and Utilities divisions and employs approximately41,200 people.
(U.S. dollar amounts in millions, except per share amounts)

86 ABB Group Financial review 2002
Note 25 Segment and geographic data, continued
Geographic information
Revenues Long-lived assetsYear ended December 31, December 31,
2002 2001 2000 2002 2001
Europe $ 10,265 $ 10,852 $ 12,104 $ 2,043 $ 1,947The Americas 4,101 4,863 4,673 403 467Asia 2,603 2,435 1,741 281 270Middle East and Africa 1,326 1,232 837 65 69
$ 18,295 $ 19,382 $ 19,355 $ 2,792 $ 2,753
Revenues have been reflected in the regions based on the location of the customer. Long-lived assets primarily represent property, plant andequipment, net, and are shown by the location of the assets.
The Company does not segregate revenues derived from transactions with external customers for each type or group of products and services.Accordingly, it is not practicable for the Company to present revenues from external customers by product and service type.
Management estimates that approximately 43 percent of the Company’s employees are subject to collective bargaining agreements in variouscountries. These agreements are subject to various regulatory requirements and are renegotiated on a regular basis in the normal course of business.
(U.S. dollar amounts in millions, except per share amounts)

ABB Group Financial review 2002 87
ABB Ltd Group Auditors’ Report
To the stockholders of ABB Ltd:
As auditors of the group, we have audited the accompanying consolidated balance sheet of ABB Ltd as of December 31, 2002, and the relatedconsolidated income statement, statement of cash flows, statement of changes in stockholders’ equity and notes, for the year then ended.
These consolidated financial statements are the responsibility of the Board of Directors. Our responsibility is to express an opinion on these consolidatedfinancial statements based on our audit. We confirm that we meet the legal requirements concerning professional qualification and independence.
We did not audit the consolidated financial statements of ABB Holdings Inc., a wholly-owned subsidiary, which statements reflect total assetsconstituting 15 percent and total revenues constituting 14 percent of the related consolidated totals as of and for the year ended December 31, 2002;and we did not audit the financial statements of Jorf Lasfar Energy Company (a corporation in which the Company has a 50 percent interest) or theconsolidated financial statements of the Swedish Export Credit Corporation (a corporation in which the Company has a 35 percent interest); theCompany’s investment in these companies is stated at $ 336 million and $ 206 million, respectively, and the Company’s equity in their net income of$132 million and $ 254 million, respectively, is stated at $ 66 million and $ 89 million, respectively, as of and for the year ended December 31, 2002.Those statements were audited by other auditors whose reports have been furnished to us.The auditors’ report on the consolidated financialstatements of Swedish Export Credit Corporation included an explanatory paragraph that describes a restatement to previously reported amounts forthe year ended December 31, 2001. Our opinion, insofar as it relates to amounts included for those companies and their subsidiaries, is based solely on the reports of the other auditors.
Our audit was conducted in accordance with auditing standards promulgated by the Swiss profession and with other internationally recognized auditingstandards, which require that an audit be planned and performed to obtain reasonable assurance about whether the consolidated financial statementsare free from material misstatement. We have examined, on a test basis, evidence supporting the amounts and disclosures in the consolidated financialstatements. We have also assessed the accounting principles used, significant estimates made and the overall consolidated financial statementpresentation. We believe that our audit and the reports of other auditors provide a reasonable basis for our opinion.
In our opinion, based on our audit and the reports of other auditors, the consolidated financial statements referred to above present fairly, in all materialrespects, the consolidated financial position of ABB Ltd at December 31, 2002, and the consolidated results of its operations and its cash flows for theyear then ended in conformity with accounting principles generally accepted in the United States and comply with Swiss law.
We recommend that the consolidated financial statements submitted to you be approved.
Without qualifying our opinion, we draw attention to the following matters that are further discussed in Notes 1 and 17. Combustion Engineering, awholly-owned consolidated subsidiary of ABB Ltd, experienced a greater-than-anticipated increase in the number of and amounts demanded to settlecertain asbestos-related claims. As a result, on February 17, 2003, Combustion Engineering filed for reorganization under Chapter 11 of the UnitedStates Bankruptcy Code (“the Code”). After that date, Combustion Engineering’s financial results will be deconsolidated and ABB Ltd will beginreporting its investment in Combustion Engineering using the cost method. Combustion Engineering represents 4 percent of ABB Ltd’s consolidatedliabilities and less than 1 percent of ABB Ltd’s consolidated assets and consolidated revenues at December 31, 2002, and for the year then ended.Some claimants have named ABB Ltd or other subsidiaries of ABB Ltd in connection with claims against Combustion Engineering, but there has beenno adjudication that any such entity has liability for such claims. Until Combustion Engineering receives an approved Plan of Reorganization in order to emerge from Chapter 11, and injunctive relief afforded under the Code has been provided to bar future claims from being made against ABB Ltd andits subsidiaries, the ultimate settlement amount of asbestos-related claims and the potential exposure of ABB Ltd and its other subsidiaries to liability for Combustion Engineering’s asbestos-related claims remains uncertain.
In addition, as described in Notes 1 and 14, on December 17, 2002, the Company entered into a 364-day $1.5 billion credit facility to fund day-to-dayoperations and, in connection with this agreement, the Company must meet strict financial and performance covenants and dispose of significantassets to meet its scheduled debt repayments in 2003. Recent credit rating downgrades of the Company’s borrowings and net losses reported on aconsolidated basis in 2001 and 2002, with a resulting decrease in the Company’s consolidated stockholders’ equity, may impact the Company’s ability to refinance existing obligations in 2003.
The existence of the asbestos-related issues of the Company’s subsidiary, Combustion Engineering, and the restrictive aspects relating to theCompany’s credit facility, as discussed above, result in uncertainty as to ABB Ltd’s ability to continue as a going concern. We refer you to Note 1 whichoutlines management’s plans to address its asbestos-related issues and its liquidity situation.
As discussed in Note 13, the Company restated the consolidated financial statements as of December 31, 2001, and for the year then ended, for theeffect of Swedish Export Credit Corporation’s restatement to its consolidated financial statements to correct an error in its accounting for the fair value ofcertain financial instruments.
As discussed in Note 2, in 2001 the Company changed its method of accounting for derivative financial instruments. As also discussed in Note 2, in2002 the Company changed its method of accounting for goodwill acquired in business combinations and its criteria for classification of itemsaccounted for as discontinued operations, resulting in reclassifications to all periods presented for items meeting the criteria after January 1, 2002.
We also audited the adjustments that were applied to reclassify amounts reflected in the consolidated financial statements as of December 31, 2001,and for the two years then ended, in connection with the presentation of discontinued operations as described in Notes 2 and 3. Those statements,before such adjustments, were audited by us as of December 31, 2001 and for the year then ended and were audited by us jointly with other auditors forthe year ended December 31, 2000. In our opinion, such adjustments were appropriate and have been properly classified.
Ernst & Young AG
J. Birgerson C. Barone
Auditors in charge
Zurich, SwitzerlandApril 4, 2003

88 ABB Group Financial review 2002
ABB Ltd, Zurich
Income StatementYear ended December 31 (CHF in thousands) 2002 2001
Revenues 7 721Personnel expenses (33,609) (19,980)Other expenses (34,432) (44,316)Dividend income 26,655 4,490,148Interest income 103,688 44,639Interest expenses (27,608) (37,636)Gain from sale of participations 307 –Write-down of participations (4,898,780) –Loss on sale of own shares – (37,208)Write-down of own shares (289,680) (323,077)Income (loss) before taxes (5,153,452) 4,073,291Income taxes – (60)Net income (loss) (5,153,452) 4,073,231
Balance SheetDecember 31 (CHF in thousands) 2002 2001
Cash and equivalents 152 4,300,907Receivables 28,054 38,423Total current assets 28,206 4,339,330
Loans to subsidiary 3,570,000 1,070,000Participations 3,750,910 6,847,918Own shares 94,320 384,000Total fixed assets 7,415,230 8,301,918Total assets 7,443,436 12,641,248
Current liabilities 96,329 140,689Bonds 700,000 700,000Total liabilities 796,329 840,689
Share capital 3,000,023 3,000,023Legal reserve 600,005 600,005Reserve for treasury shares 2,944,904 2,944,904Other reserves 302,968 302,968Retained earnings 4,952,659 879,428Net income (loss) (5,153,452) 4,073,231Total stockholders’ equity 6,647,107 11,800,559Total liabilities and stockholders’ equity 7,443,436 12,641,248

ABB Group Financial review 2002 89
Notes to Financial Statements
Note 1 GeneralABB Ltd, Zurich directly or indirectly controls all group companies which are fully consolidated in the Group financial statements of ABB Ltd, Zurich. These Consolidated Financial Statements are of overriding importance for the purpose of the economic and financial assessment of ABB Ltd, Zurich.The unconsolidated financial statements of ABB Ltd, Zurich are prepared in accordance with Swiss law and serve as complementary information to the Consolidated Financial Statements.
Note 2 Cash and equivalents(CHF in thousands) 2002 2001
Cash and bank 152 907Cash with subsidiaries – 4,300,000Total 152 4,300,907
Note 3 Receivables(CHF in thousands) 2002 2001
Non-trade receivables (1) 9,897 17,632Non-trade receivables from subsidiaries – 18Prepaid expenses /accrued income 4 59Prepaid expenses /accrued income from subsidiaries 18,153 20,714Total 28,054 38,423(1) Includes a receivable from an employee pension plan amounting to CHF 8,417 thousand (CHF 14,968 thousand in 2001).
Note 4 Loans to subsidiariesABB Ltd entered into an interest bearing credit agreement with ABB Asea Brown Boveri Ltd, Zurich. The loan is valued at cost and pledged under the creditfacility agreement (see Note 9 to the accompanying financial statements).
Note 5 Participations Ownership interest Company name Purpose Domicile 2002 2001
ABB Holding Ltd Holding CH-Zurich CHF 1,200,009,432 100% –BBC Brown Boveri Ltd Holding CH-Zurich CHF 570,580 100% –ABB Participation Ltd Holding CH-Baden CHF 462,681,000 – 100%ABB Participation AB Holding SE-Västeras SEK 4,689,565,105 – 100%ASEA Holding AB Holding SE-Västeras SEK 100,000 – 100%
The investments in subsidiaries are valued at lower of cost or market. The determination of fair values is done by using different methods including thediscounted cash flow method (DCF).
Note 6 Current liabilities(CHF in thousands) 2002 2001
Non-trade payables 2,527 1,903Non-trade payables to subsidiaries 3,202 2,932Accrued expenses /deferred income 18,310 29,112Accrued expenses /deferred income from subsidiaries 62 93Short-term loan from subsidiaries 72,228 106,649Total 96,329 140,689
Note 7 Bonds(CHF in thousands) 2002 2001
Bond 1999–2009 3.75% 500,000 500,000Note 2001–2008 3.75% 100,000 100,000Note 2001–2003 3.25% (Repayment January 24, 2003) 100,000 100,000Total 700,000 700,000

90 ABB Group Financial review 2002
Note 8 Stockholders’ equityShare Restricted Other Retained
(CHF in thousands) capital reserves reserves earnings Net income (loss) Total
Opening balance sheet 3,000,023 3,544,909 302,968 879,428 4,073,231 11,800,559Allocation to retained earnings 4,073,231 (4,073,231) –Net loss for the year (5,153,452) (5,153,452)Closing balance sheet 3,000,023 3,544,909 302,968 4,952,659 (5,153,452) 6,647,107
Share capital divided in:Number of
(CHF in thousands) registered shares Par value Total
Issued shares 1,200,009,432 CHF 2.50 3,000,023Contingent shares 80,000,000 CHF 2.50 200,000
In 2001, ABB Ltd and its subsidiaries, ABB Equity Limited and ABB Transinvest Limited, have acquired the following ABB Ltd shares to cover the obli-gations of a management incentive plan and various corporate purposes:
Treasury shares 2002 2001
Number of Price per Number Price pershares share /CHF of shares share /CHF
Opening balance 86,830,312 33.92 16,484,208 38.71Purchases – – 82,946,104 31.74Sales – – (12,600,000) 25.84Closing balance 86,830,312 33.92 86,830,312 33.92
Note 9 Pledge(CHF in thousands) 2002 2001
Loans to subsidiary pledged 3,570,000 –
This pledge relates to the USD 1.5 billion credit facility signed on December 17, 2002 (refer to Note 14 to the Consolidated Financial Statements).
Note 10 Contingent liabilities(CHF in thousands) 2002 2001
Liability to pension fund 1,034 –Financial guarantee to subsidiary(1) 333,275 –Total 334,309 –(1) Relates to an intra-group financing.
Furthermore, Combustion Engineering, an indirect wholly owned subsidiary of ABB Ltd, Zurich, experienced a greater-than-anticipated increase in thenumber of and amounts demanded to settle certain asbestos-related claims. Some claimants have named ABB Ltd, Zurich or subsidiaries of ABB Ltd,Zurich in connection with claims against Combustion Engineering, but there has been no adjudication that any such entity has liability for such claims.Please refer to Note 17 to the Consolidated Financial Statements for more detailed information.
The company is part of a value added tax group and therefore jointly liable to the federal tax department for the value added tax debts of the other members.
Note 11 Credit facility agreementOn December 17, 2002, ABB Ltd, Zurich and certain subsidiaries of ABB Ltd, Zurich entered into a 364-day USD 1.5 billion credit facility to fund day-to-day operations of the ABB Group. For more detailed information please refer to Note 14 to the Consolidated Financial Statements.
There are no further items which require disclosure in accordance with Art. 663 b of the Swiss Code of Obligations.

ABB Group Financial review 2002 91
Proposed appropriation of available earnings
(CHF in thousands) 2002 2001
Net income (loss) for the year (5,153,452) 4,073,231Release of other reserves 302,968 –Carried forward from previous year 4,952,659 879,428Profit available to the Annual General Meeting 102,175 4,952,659Dividend – –Balance to be carried forward 102,175 4,952,659
The Board of Directors proposes to dissolve the other reserves of CHF 302,967,172 through transfer to the profit carried forward, to renounce to thedistribution of a dividend and to carry forward to new account the amount of profit available to the Annual General Meeting in the amount of CHF 102,174,342.

92 ABB Group Financial review 2002
As statutory auditors, we have audited the accounting records and the financial statements (balance sheet, income statement and notes; pages 88 to 91) of ABB Ltd, Zurich, for the year ended December 31, 2002.
These financial statements are the responsibility of the Board of Directors. Our responsibility is to express an opinion on these financial statementsbased on our audit. We confirm that we meet the legal requirements concerning professional qualification and independence.
Our audit was conducted in accordance with auditing standards promulgated by the Swiss profession, which require that an audit be planned andperformed to obtain reasonable assurance about whether the financial statements are free from material misstatement. We have examined on a test basis evidence supporting the amounts and disclosures in the financial statements. We have also assessed the accounting principles used, significant estimates made and the overall financial statement presentation. We believe that our audit provides a reasonable basis for our opinion.
In our opinion, the accounting records, financial statements and the proposed appropriation of available earnings comply with Swiss law and thecompany’s articles of incorporation.
We recommend that the financial statements submitted to you be approved.
Without qualifying our opinion, we draw attention to the following:
As described in Note 4 and 5 to the accompanying financial statements, loans and participations to ABB Group companies are valued at the lower ofcost or fair values. These have been determined using generally recognized valuation methods including the discounted cash flow method (DCF) and are based on management’s budgets and estimates of future cash flows including proceeds from planned disposals of non-core business unitsheld for sale.
We also refer to Note 10 to the accompanying financial statements regarding Combustion Engineering, an indirect wholly-owned subsidiary of ABB Ltd,Zurich, and to Note 11 to the accompanying financial statements regarding the 364-day USD 1.5 billion credit facility to fund day-to-day operations ofthe ABB Group, and as described in more detail in Notes 17 and 14 to the consolidated financial statements of ABB Ltd prepared in accordance withaccounting standards generally accepted in the United States.
The existence of the asbestos-related issues of the indirect subsidiary of ABB Ltd, Zurich, Combustion Engineering, the restrictive aspects relating tothe above mentioned credit facility and the potential impact of these items (including the risk of not achieving the forecasted future cash flows) on thecarrying values of participations and loans to group companies, as discussed above, result in uncertainty as to ABB Ltd, Zurich’s ability to continue as agoing concern. We refer you to Note 1 to the consolidated financial statements which outlines ABB Group management’s plans to address theasbestos-related issues and the ABB Group’s liquidity situation. Should Group management’s plans not be successful, the accompanying financialstatements would be required to be prepared on the basis of net realizable values and the board of directors would need to observe the regulations ofArticle 725 of the Swiss Code of obligations.
Ernst &Young AG
J.Birgerson Y.VontobelAuthorized Public Accountant Certified Accountant
Auditors in charge
Zurich, April 4, 2003
Report of the Statutory Auditors
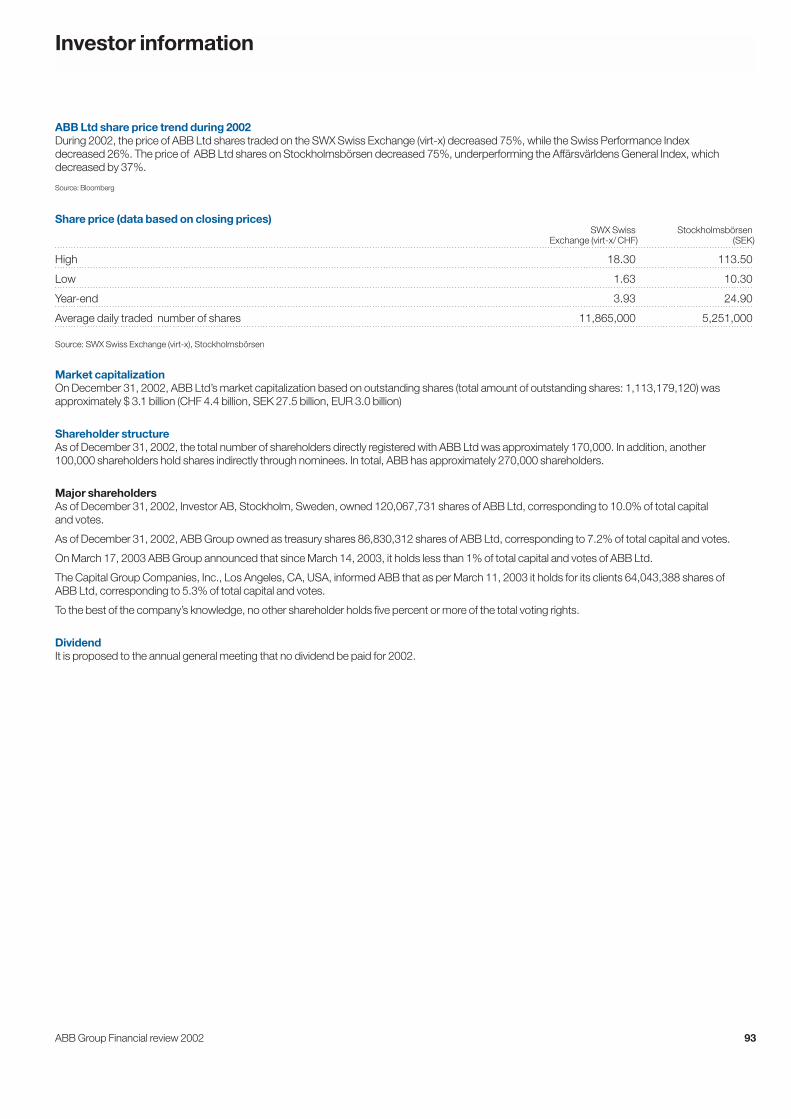
ABB Group Financial review 2002 93
ABB Ltd share price trend during 2002During 2002, the price of ABB Ltd shares traded on the SWX Swiss Exchange (virt-x) decreased 75%, while the Swiss Performance Index decreased 26%. The price of ABB Ltd shares on Stockholmsbörsen decreased 75%, underperforming the Affärsvärldens General Index, whichdecreased by 37%.
Source: Bloomberg
Share price (data based on closing prices)SWX Swiss Stockholmsbörsen
Exchange (virt-x/CHF) (SEK)
High 18.30 113.50
Low 1.63 10.30
Year-end 3.93 24.90
Average daily traded number of shares 11,865,000 5,251,000
Source: SWX Swiss Exchange (virt-x), Stockholmsbörsen
Market capitalizationOn December 31, 2002, ABB Ltd’s market capitalization based on outstanding shares (total amount of outstanding shares: 1,113,179,120) wasapproximately $ 3.1 billion (CHF 4.4 billion, SEK 27.5 billion, EUR 3.0 billion)
Shareholder structureAs of December 31, 2002, the total number of shareholders directly registered with ABB Ltd was approximately 170,000. In addition, another 100,000 shareholders hold shares indirectly through nominees. In total, ABB has approximately 270,000 shareholders.
Major shareholdersAs of December 31, 2002, Investor AB, Stockholm, Sweden, owned 120,067,731 shares of ABB Ltd, corresponding to 10.0% of total capital and votes.
As of December 31, 2002, ABB Group owned as treasury shares 86,830,312 shares of ABB Ltd, corresponding to 7.2% of total capital and votes.
On March 17, 2003 ABB Group announced that since March 14, 2003, it holds less than 1% of total capital and votes of ABB Ltd.
The Capital Group Companies, Inc., Los Angeles, CA, USA, informed ABB that as per March 11, 2003 it holds for its clients 64,043,388 shares of ABB Ltd, corresponding to 5.3% of total capital and votes.
To the best of the company’s knowledge, no other shareholder holds five percent or more of the total voting rights.
DividendIt is proposed to the annual general meeting that no dividend be paid for 2002.
Investor information

94 ABB Group Financial review 2002
Per-share data2002 2001
Dividend (CHF) n.a.(1) n.a.(2)
Par value (CHF) 2.50 2.50Vote per share 1 1Weighted average number of shares outstanding (in millions) 1,113 1,132Dilution from convertible bonds (in millions) 53 –Diluted weighted average number of shares outstanding (in millions) 1,166 1,132(1) It is proposed to the Annual General Meeting that no dividend be paid for 2002.(2) In order to strengthen the balance sheet, no dividend was paid for 2001.
Key ratios (1)
(US$) 2002 2001
EBITDA per share* 0.86 0.83Basic earnings (loss) per share (0.70) (0.64)Diluted earnings (loss) per share* (0.83) (0.64)Stockholders’ equity per share* 1.28 3.16Cash flow per share* 0.02 1.75Dividend pay-out-ratio (%) n.a. n.a.Direct yield (%) n.a. n.a.Market-to-book (%) 310.6 545.9Basic P / E ratio n.a. n.a.Diluted P / E ratio n.a. n.a.
*Calculation based on diluted weighted average number of shares outstanding.(1) 2001 figures restated and adjusted for the 4 for 1 share split on May 7, 2001.
ABB Ltd annual general meetingThe 2003 annual general meeting of ABB Ltd will be held at 2:00 p.m. on Friday, May 16, 2003 at the Messe Zurich hall in Zurich-Oerlikon, Switzerland.The meeting will be held principally in German and will be simultaneously translated into Swedish, English and French. Shareholders entered in the shareregister, with the right to vote, by May 6, 2003, are entitled to participate in the meeting.
Admission cardsHolders of registered shares of ABB Ltd will receive their admission cards on request using the reply form enclosed with the invitation. The reply form or a corresponding notification must reach the company not later than May 7, 2003. For technical reasons, notifications arriving after that date will not betaken into consideration. The full text of the invitation in accordance with Article 700 of the Swiss Code of Obligations was published in SchweizerischesHandelsamtsblatt on April 23, 2003. For shareholders in Sweden an Information Meeting will be held in Västerås, Sweden, on May 19, 2003 at 3:00 p.m.
ABB shareholders’ calendar 2003Three months results 2003 April 29ABB Ltd annual general meeting, Zurich May 16ABB Ltd Information Meeting, Västerås May 19Six-month results 2003 July 29Nine-month results 2003 October 28

ABB Group Financial review 2002 95
Source: Bloomberg and Affärsvärlden
Stock Exchange listingsABB Ltd is listed on the SWX Swiss Exchange (virt-x), Stockholmsbörsen, Frankfurt Stock Exchange, London Stock Exchange and New York Stock Exchange.
Ticker symbol for ABB LtdSWX Swiss Exchange (virt-x) ABBNStockholmsbörsen ABBFrankfurt Stock Exchange ABJLondon Stock Exchange ANNNew York Stock Exchange (NYSE) ABB
Ticker symbol for ABB Ltd at BloombergSWX Swiss Exchange (virt-x) ABBN VXStockholmsbörsen ABB SSFrankfurt Stock Exchange ABJ GRLondon Stock Exchange ANN LNNew York Stock Exchange (NYSE) ABB US
Ticker symbol for ABB Ltd at ReutersSWX Swiss Exchange (virt-x) ABBZn.VXStockholmsbörsen ABB.STFrankfurt Stock Exchange ABBn.FLondon Stock Exchange ABBZnq.LNew York Stock Exchange (NYSE) ABB.N
The global ISIN code for the ABB share is: CH 001 222 171 6.
Price trend for ABB Ltd shares
SEK
0
25
50
75
100
125
1/02 2/02 3/02 4/02 5/02 6/02 7/02 8/02 9/02 10/02 11/02 12/02
1/02 2/02 3/02 4/02 5/02 6/02 7/02 8/02 9/02 10/02 11/02 12/020
5
10
15
20CHF Price trend for ABB Ltd shares, Zurich
Swiss Performance Index rebased, Zurich
Price trend for ABB Ltd shares, StockholmAffärsvärlden Index rebased, Stockholm

96 ABB Group Financial review 2002
Credit rating for ABB Ltd as of March 31, 2003
Standard & Poor’sLong-term Corporate Credit Rating: BB+Long-term Senior Unsecured debt: BB–Short-term Corporate Credit Rating: BNegative Outlook
Moody’sLong-term Senior Implied Rating: Ba3Long-term Senior Unsecured Rating: B1Short-term Debt rating: Not PrimeNegative Outlook
The credit rating can be subject to revision at any time. For the latest credit ratings please see Moody’s and Standard & Poor’s web pages.
Bondholder informationOutstanding public bonds as of December 31, 2002.
Issuer Original issued principal amount Coupon Due Bloomberg ticker Reuters ticker
ABB International Finance Ltd USD 250 million 7% 2003 ABB 7 02/14/03 CH010628296=ABB International Finance Ltd CHF 350 million 3.5% 2003 ABB 3.5 06/30/03 CH1051943=ABB International Finance Ltd ITL 250 billion 10% 2003 ABB 10 08/06/03 CH004494059=ABB International Finance Ltd CAD 180 million collared FRN 2003 ABB 0 10/20/03 CH004629256=ABB International Finance Ltd EUR 300 million 3.5% 2003 ABB 3.5 12/29/03 CH009513361=ABB International Finance Ltd EUR 500 million 5.25% 2004 ABB 5.25 03/08/04 CH010817129=ABB International Finance Ltd ITL 200 billion 8.125% 2004 ABB 8.125 03/10/04 CH004909615=ABB International Finance Ltd CHF 400 million 3% 2004 ABB 3 08/19/04 CH830110=ABB International Finance Ltd EUR 300 million 5.375% 2005 ABB 5.375 06/30/05 CH011319629=ABB International Finance Ltd JPY 50 billion 0.5% 2005 ABB 0.5 09/20/05 CH013519668=ABB International Finance Ltd EUR 475 million 5.125% 2006 ABB 5.125 01/11/06 CH012214901=ABB International Finance Ltd USD 968 million Convertible 4.625% 2007 ABB 4.625 05/16/07 CH014749721=ABB International Finance Ltd EUR 500 million 9.5%* 2008 ABB 9.5 01/15/08 CH014855653=ABB International Finance Ltd GBP 200 million 10%* 2009 ABB 10 05/29/09 CH014855661=ABB Finance Inc. USD 250 million 6.75% 2004 ABB 6.75 06/03/04 CH007637454=ABB Ltd CHF 500 million 3.75% 2009 ABB 3.75 09/30/09 CH896367=S
* Excl. step-up

ABB Group Financial review 2002 97
(US$ millions, other than ratios, employees and percentages) 2002 2001 (restated) 2000
Consolidated Income StatementsRevenues 18,295 19,382 19,355Earnings before interest and taxes (EBIT) 394 157 1,173Income (loss) from continuing operations before taxes and minority interest 251 (66) 1,106Income (loss) from continuing operations 97 (165) 766Net income (loss) (783) (729) 1,443
Consolidated Balance SheetsCash and equivalents 2,478 2,442 1,245Marketable securities 2,135 2,924 4,193Other current assets 15,342 17,294 16,044Non-current assets 9,578 9,645 9,480Total assets 29,533 32,305 30,962
Short-term borrowings and current maturities of long-term borrowings 2,576 4,701 3,523Other current liabilities 15,838 15,465 13,059Long-term borrowings 5,376 5,003 3,763Other long-term liabilities 4,472 4,946 5,125Stockholders’ equity including minority interest 1,271 2,190 5,492Total liabilities and stockholders’ equity 29,533 32,305 30,962
Consolidated Statements of Cash FlowsNet cash provided by operating activities 19 1,983 747Net cash provided by (used in) investing activities 2,651 (1,218) (489)Net cash provided by (used in) financing activities (2,812) 677 (392)Effects of exchange rate changes on cash and equivalents 141 (72) (84)Net change in cash and equivalents (1) 1,370 (218)
Other dataOrders received 18,112 19,672 20,908EBITDA (1) 1,005 944 2,009Capital expenditures, excluding purchased intangible assets 460 607 426Capital expenditures for acquisitions 154 597 896Research and development expense 550 593 660Order-related development expenditures 249 405 555Dividends declared pertaining to fiscal year (Swiss francs in millions) – – 900Total debt 7,952 9,704 7,286Gearing 86.2% 81.6% 57.0%Net debt position (3,339) (4,338) (1,848)Net operating assets 11,258 10,744 11,567Number of employees 139,051 156,865 160,818
RatiosEarnings before interest and taxes/Revenues 2.2% 0.8% 6.1%Return on equity (52.4%) (20.4%) 30.6%Current assets/Current liabilities 1.08 1.12 1.30Liquidity ratio 27.3% 27.9% 30.2%Net operating assets/Revenues 61.5% 55.4% 59.8%Net working capital/Revenues 15.4% 12.4% 16.4%(1) Earnings before interest, taxes, depreciation and amortization
ABB Group statistical data

98 ABB Group Financial review 2002
Main exchange rates used in the translation of the Financial Statements
Average Year-end Average Year-endCurrency ISO Codes 2002/US$ 2002/US$ 2001/US$ 2001/US$
Australian dollar AUD 1.84 1.77 1.94 1.96Brazilian real BRL 2.94 3.54 2.32 2.32Canadian dollar CAD 1.57 1.58 1.55 1.60Chinese yuan renminbi CNY 8.28 8.28 8.27 8.28Danish krone DKK 7.90 7.08 8.34 8.45EURO EUR 1.06 0.95 1.12 1.14Indian rupee INR 48.55 47.97 47.18 48.24Japanese yen JPY 125.17 118.71 121.55 131.27Norwegian krone NOK 8.00 6.93 9.02 9.05Polish zloty PLN 4.07 3.83 4.09 3.98Pound sterling GBP 0.67 0.62 0.69 0.69Swedish krona SEK 9.71 8.74 10.36 10.56Swiss franc CHF 1.56 1.39 1.69 1.68
Exchange rates

e_FR_Umschlag 24.04.2003 7:27 Uhr Seite 2

© C
opyright 2003 AB
B. A
ll rights reserved.©
Designed by w
illiams &
phoa.ABB Group Annual RFinancial review
power technologies
ABB LtdCorporate CommunicationsP.O. Box 8131CH-8050 ZurichSwitzerlandTel: +41 (0) 43 317 7111Fax: +41 (0) 43 317 7958
www.abb.com
ABB LtdInvestor RelationsP.O. Box 8131CH-8050 ZurichSwitzerlandTel: +41 (0) 43 317 7111Fax: +41 (0) 1 311 9817
ABB LtdInvestor RelationsP.O. Box 5308Norwalk CT 06856-5308USATel: +1 203 750 7743Fax: +1 203 750 2262
ABB LtdInvestor RelationsSE-721 83 VästeråsSwedenTel: +46 (0) 21 32 50 00Fax: +46 (0) 21 32 54 48
AB
B G
roup
Annual R
epo
rt 2002 Financial review
e_FR_Umschlag 24.04.2003 7:26 Uhr Seite 1