abdul malik kakar - well test analysis of hydraulically fractured gas wells
TRANSCRIPT
ABSTRACT
Vast reserves of natural gas exist trapped in lowpermeability formations throughout the world. Due tothe low viscosity of gas, reserves under certain conditionscan be recovered from these low permeability formationswhere the economic recovery of conventional liquidhydrocarbons would not be possible. In order to alloweconomic production from gas wells in low permeabilityreservoirs, hydraulic fracturing is often necessary toincrease gas recovery.
The presence of non-Darcy flow significantly reducesthe effective conductivity of the propped fracture, andhence adversely affects productivity of a hydraulicallyfractured gas well. This paper presents study, which isaimed at analysis of well test conducted on hydraulicallyfractured gas well. A simulation study was conductedto generate pressure-transient response for a hydraulicallyfractured gas well for the purpose of well testinterpretation. The non-Darcy flow effects have beeninvestigated as a function of fracture geometry. Theresulting variation in transient pressure responseeventually leads to changes in the well productioncapacity. The paper also includes the investigation ofoptimum fracture geometry for which non-Darcy floweffects are negligible thereby optimizing wellperformance.
INTRODUCTION
Hydraulic fracturing is an effective technique forincreasing the productivity of gas wells producing fromlow permeability formations. For a fractured well,fracture length, fracture conductivity and formationpermeability are the parameters that govern productivityof the well. Post-fractured well test analysis significantlyaids evaluating fracture treatment design and forecastingthe well performance.
When a gas well is hydraulically fractured, flow patternin the formation is no longer radial and propped fracturewill dominate the flow system. Therefore, conventionalinflow performance relationship (IPR) models based onradial flow assumption are not applicable. At longertimes the Pseudo-radial flow is reached in every fracturedsystem irrespective of fracture conductivities.
The equations developed for radial homogeneous systembecome equally applicable for analysing this flow period.However, Pseudo-radial flow period data can not beused for estimating fracture parameters, and a negativeskin factor has been used to reflect the stimulation effect.
As the permeability in the propped fracture is muchhigher than formation matrix permeability, much of thegas will first flow into the fracture, and then along thefracture, before reaching the wellbore. The non-Darcyeffects associated with inertia and high flow velocitiesin the fracture significantly influence the wellperformance. Other factors that are likely to affect thewell productivity may include formation damage, waterblocking and alteration of capillary pressure due tofracturing fluid invasion.
This paper presents study, which is aimed at analysisof both pressure-transient, and deliverability testingdata, for hydraulically fractured gas wells in the presenceof non-Darcy flow. A simulation study was conductedto generate pressure-transient response for a hydraulicallyfractured gas well for the purpose of well testinterpretation. The non-Darcy flow effects have beeninvestigated as a function of fracture geometry. The wellis assumed vertical and producing at a constant flowrate. Permeability, skin, non-Darcy flow co-efficientand absolute open-flow-potential, are determined fromwell test analysis. An optimum case has also beeninvestigated for which non-Darcy flow effects arenegligible.
263
WELL TEST ANALYSIS OF HYDRAULICALLY FRACTURED GAS WELLSFOR NON-DARCY FLOW EFFECTS
Abdul Malik Kakar1, Shiyi Zheng2 and George Stewart3
1Pakistan Petroleum Limited (PPL), Heriot-Watt University, [email protected] University, [email protected] University, EPS, [email protected]
FRACTURED WELL PRODUCTIVITY
The inflow performance of a hydraulically fracturedwell is controlled by dimensionless fracture conductivity,Fcd. [13].
Wherekf *wf = Fracture conductivity (i.e. ability of fracture toconduct fluid to the wellbore).k *xf = Ability of formation to deliver fluid into hydraulicfracture.
For values of Fcd equal or greater than 300, the fracturewill be called infinite-conductive. [2]
Flow Patterns in Hydraulically Fractured Wells
Five distinct flow patterns occur in the fracture andformation around a hydraulically fractured well. Theyare named as fracture-linear, bi-linear, formation linear,elliptical, and pseudoradial flow. [11]
Fracture-linear flow is short-lived and is normallydominated by wellbore storage effects. During thisperiod, most of the fluid entering the wellbore comesfrom fluid expansion in the fracture, and flow patternis essentially linear. Bilinear flow evolves in finite-conductive fracture, and is mostly the first flow regimethat can be observed after the wellbore storage effectsare dissipated. This period is featured by linear flowsin both the fracture and formation and that the fracturetips do not affect the pressure behaviour of the well.Most of the fluid in this period comes from the formation,and pwf is a linear function of t1/4. The duration of bi-linear flow depends on Fcd.
Formation linear flow occurs in only infinite-conductivefractures. Elliptical flow, a transitional flow, occurs onlyin between a linear and nearly linear flow patterns atearly times and a radial or nearly radial flow at latertimes. Pseudoradial flow occurs in fractures irrespectiveof fracture conductivities. After sufficiently long flowperiod, the fracture appears to the reservoir as an extendedwellbore. All the equations developed for radialhomogeneous system are equally applicable forinterpreting data of this flow period. The larger the timeis, the later the development of essentially radial flow.[11]
Non-Darcy Flow
Laminar flow of fluid through a porous media can bedescribed using Darcy’s law.
Where u is the superficial velocity, k is thepermeability, dp is the pressure drop, and x is thedimension at x-direction.
Darcy’s law provides basis for describing fluidflow in porous media, but cannot describe fluidflow accurately when the flow rate is high. Forgases, flow rate is always very high especially inthe restricted areas such as near the wellbore andin fractures. Forchhimer (1901) proposed a classicalequation for counteracting the deficiencyencountered with Darcy’s law, by adding a non-Darcy term into Darcy’s flow equation. He foundthat the pressure gradient required to maintain acertain flow rate through porous media was higherthan predicted by Darcy’s law. [1]
Where ρ the fluid density, and is the non-Darcy flowcoefficient. Different authors have referred to β in anumber of different ways including: turbulence factorby Cornell and Katz, and Tek et. al., coefficient of inertialresistance by Greerstma, and Al-Rumhy et. al., thevelocity coefficient by Firoozabadi, the non-Darcycoefficient by Civan and Evans, Liu et. al. The non-Darcy flow coefficient is usually determined by analysisof multi-rate pressure test, and from correlations in caseswhere well test data is not available. [1].
Cornell and Katz attributed the non-Darcy effect, inother words the non-linearity between pressure gradientand velocity, to turbulence. However many researcherssuch as Bear, Scheidgger, Barek, Ruth and Ma, Whitakerhave agreed that the non-linearity is not due to turbulencebut to inertial effects. Bear gave the following threereasons to exclude turbulence as cause for the non-Darcy effect [1].
1. In turbulent flow through pipes, the linear term ofEq-3 does not exist.
2. In flow through pipes, the transition from laminarto turbulent flow is not gradual but rather steep.
3. The critical Reynolds number Re at which transitionstarts is several orders of magnitude higher than thatat which non-Darcy effect begins.
264
Non-Darcy Flow in Propped Fractures
Analysis of the effects of non-Darcy flow in high rateoil and gas wells shows that, fracture conductivities aredominated by non-Darcy flow effects and that effectiveconductivities are non-linearly dependent on proppantcoverage. [5].
Significant non-Darcy flow can exist in a fracture atany time in the life of a vertically fractured well. Onthe average, about 10% of the total fracture pressuredrop can be attributed to non-Darcy flow effects [2, 6].If substantial non-Darcy flow is occurring in the fracture,the calculation of fracture length using conventionaltechniques will result in values that are far too small.[7]
The transient pressure response of finite-conductivityfractures with non-Darcy flow are governed by thedimensionless fracture conductivity, Fcd anddimensionless flow rate, [2, 6]
When analysing post-fracture well test, the overalleffective fracture conductivity taking into account theflow distribution along the fracture is given by:
The coefficient C depends on the flow condition in fracture,and value ranges from 0.3 to 0.6. [5]
In high rate, hydraulically fractured gas wells, non-Darcy flow effects may reduce effective fractureconductivity by a factor of 10 [5]. The non-Darcy flowcan reduce the effective conductivity near the wellboreby a factor of 20 or more. [7]
The effect of non-Darcy flow is more significant whendescribing gas flow in propped fractures. As a result ofneglecting the effects of non-Darcy flow in fracture,conflicts arise between well testing estimates and designvalues of fracture conductivity and fracture half-length,which continue cause uncertainty and debate.
SIMULATION
Overview
A numerical simulator (Eclipse-300, SchlumbergerGeoquest, compositional simulation software) is used
for generating pressure-transient behaviour ofhydraulically fractured gas well. Black-oil simulationmodel could be an option, however as the main objectiveswere to investigate non-Darcy flow effects, and this isonly possible with compositional model.
Dual porosity models are conventionally used to describefractured gas reservoirs. In this model, the flow fromthe matrix to fracture is assumed to be in semi-steadystate. It has been demonstrated that such models do notpredict the matrix-fracture flow accurately. This isparticularly true when the matrix permeability is verylow. This necessitates taking full transient flow behaviourwithin the matrix quantinuum. It may be noted thattransient time in a very low permeability gas reservoirsmay range from a few days to several months. [10]
Reservoir Model
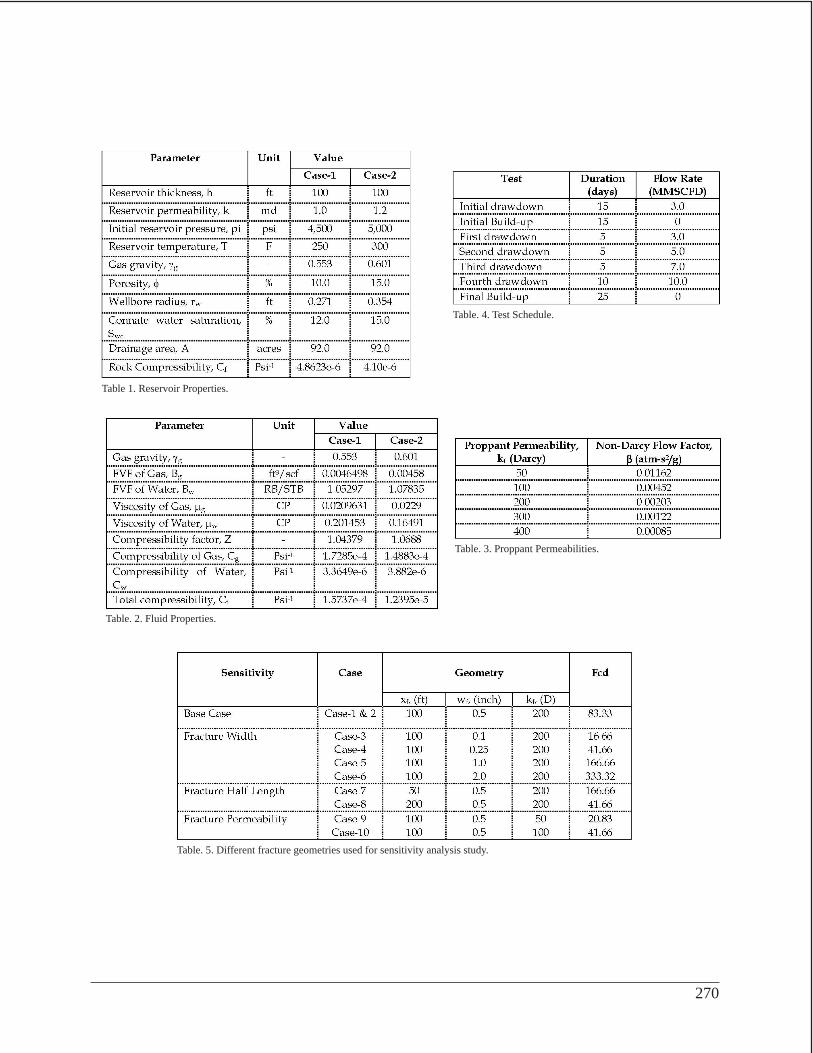
In first the system investigated in this study, we haveconsidered a single, fully penetrated, vertical well inthe centre of a horizontal, closed and square reservoirof uniform thickness, h. The well is intercepted by afully penetrating hydraulic fracture. The fracture has aheight of h, half-length of xf, width of wf and permeabilityof kf. The reservoir properties are assumed uniform andhomogeneous. The fluid considered for this study is drygas (methane) with a specific gravity of 0.553. Table 1lists the basic reservoir properties. The most widelyused Peng-Robison equation of state (EOS) was usedto obtain fluid properties such as viscosity, FVF andcompressibility.
Fracture Model
A symmetric two-wing, fully penetrated vertical fracture,with half-length, xf of 100 ft and width, wf of 0.5 inch,is modelled. Non-Darcy flow factors for proppants usedin the simulation model are taken from StimLab report.The proppant type selected for the range of permabilitiesand temperature is “resin-coated sand”, having porosityof 39.1%.
Coefficient of inertia has units of [L-1], but some oflaboratories use unit of [atm-s2/g, also called Forchhimerunit, F]. The values provided for non-Darcy flow factorby StimLab are in the later units, and the same unit isrequired for Eclipse. Values of for different proppantpermabilities are tabulated in Table 3.
Modelling Grids
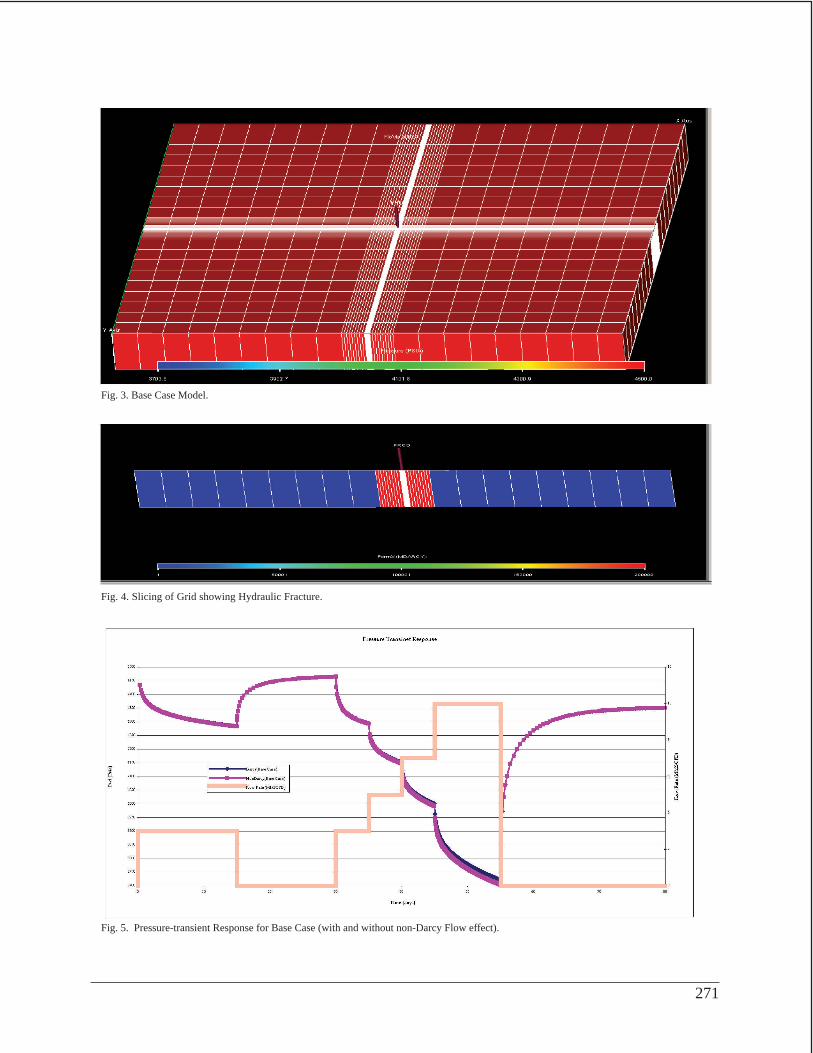
A low permeability gas reservoir (square- 2,000 x 2,000ft) with a hydraulically fractured gas well in the centreis modelled using 2D Cartesian grids coordinates (3,249 grid cells), (57 blocks each in x and y direction).The size of grids cells is small near the well (1 ft) and
265

fracture tips (10 ft) in x-direction, and close to thefracture face (1 ft) in y-direction. Larger size of gridscells 100 ft in the matrix) is assigned to the blocks awayfrom the fracture. Base model’s grids are shown in Figs.3. and 4.
Pressure Transient Response for Base Model
Pressure-Transient response generated from base modelis shown in Fig. 5. This shows more pressure draw downwith non-Darcy flow.
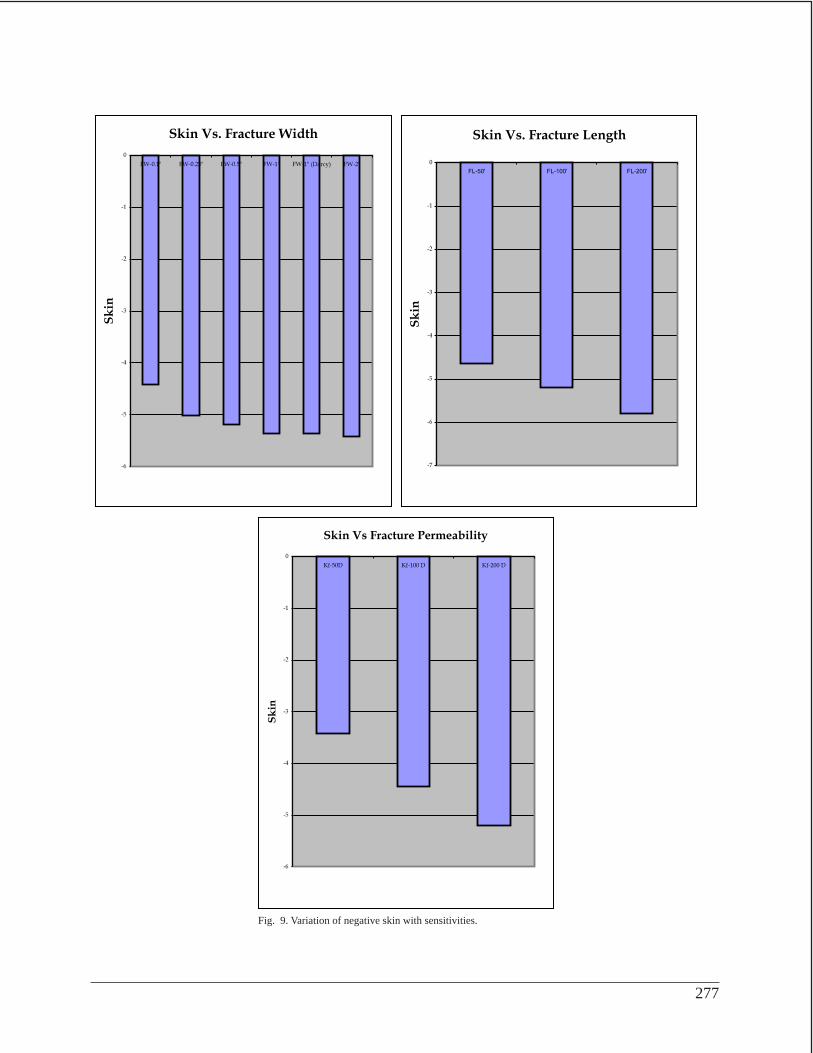
Sensitivities Studies
In order to investigate effects of non-Darcy flow onperformance of a fractured gas well, a sensitivity studyof different factors was performed. Different fracturefactors such as fracture half-length (xf), fracture width(wf) and proppant permabilities (kf) are analysed. Table5 presents different cases that have been studied. Pressure-Transient response generated from simulation of all thecases for sensitivity analysis are shown in Fig. 7.
WELL TEST ANALYSIS
The pressure-transient behaviour to be analysed (usingPansystem, ® EPS) was generated from compositionalsimulator as discussed in previous section. The scheduleof a multi-rate drawdown and build-up, in which the ratesare kept constant in all the cases, is given in Table 4.
Fluid Parameters
The fluid properties were calculated using the mostwidely used Peng-Robinson EOS as shown in Table 2.
Model Validation
As a first step of interpretation the base model was analysedfor validation. The default model selected, as the basemodel was a vertical fracture-finite conductivity-closedsystem. The test was analysed as dry gas, vertical well,and the analysis are shown in Fig. 6.
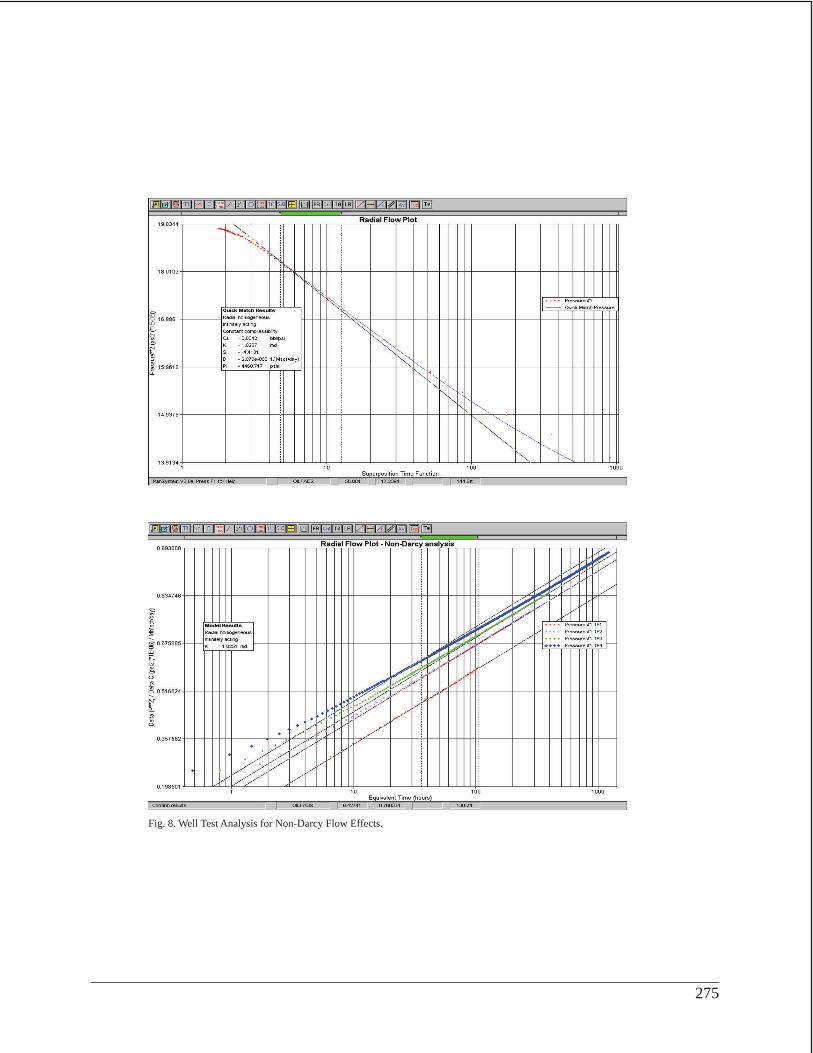
Analysis for Non-Darcy Flow
In order to analyse the non-Darcy flow effects, thedefault model was selected as radial homogeneous-infinite acting. In Pansystem, it is only possible to carryout non-Darcy flow analysis, when the model is radialhomogenous. The procedure of the analysis is dividedinto build-up and multi-rate drawdown:
Build-Up Analysis
The radial flow regime for initial build-up, was analysedon semilog plot, Horner plot, to estimate initial reservoir
pressure, pi. Whereas the radial flow regime for finalbuild-up was analysed on semilog plot, Horner plot, todetermine average reservoir pressure, p*, reservoirpermeability, k, and total skin, S.
Flow-after-Flow Transient Analysis
This analysis is aimed at determining the Darcy and non-Darcy skin factors, S and D respectively. In order to carryout this analysis, it is necessary to have multi-rate test.Procedure of analysis is as follows:
1. After selecting each of the four drawdowns onsemilog plot, Horner plot, the permeability valueobtained in the first test period was adjusted withthe one estimated from the final build-up estimatedpreviously.
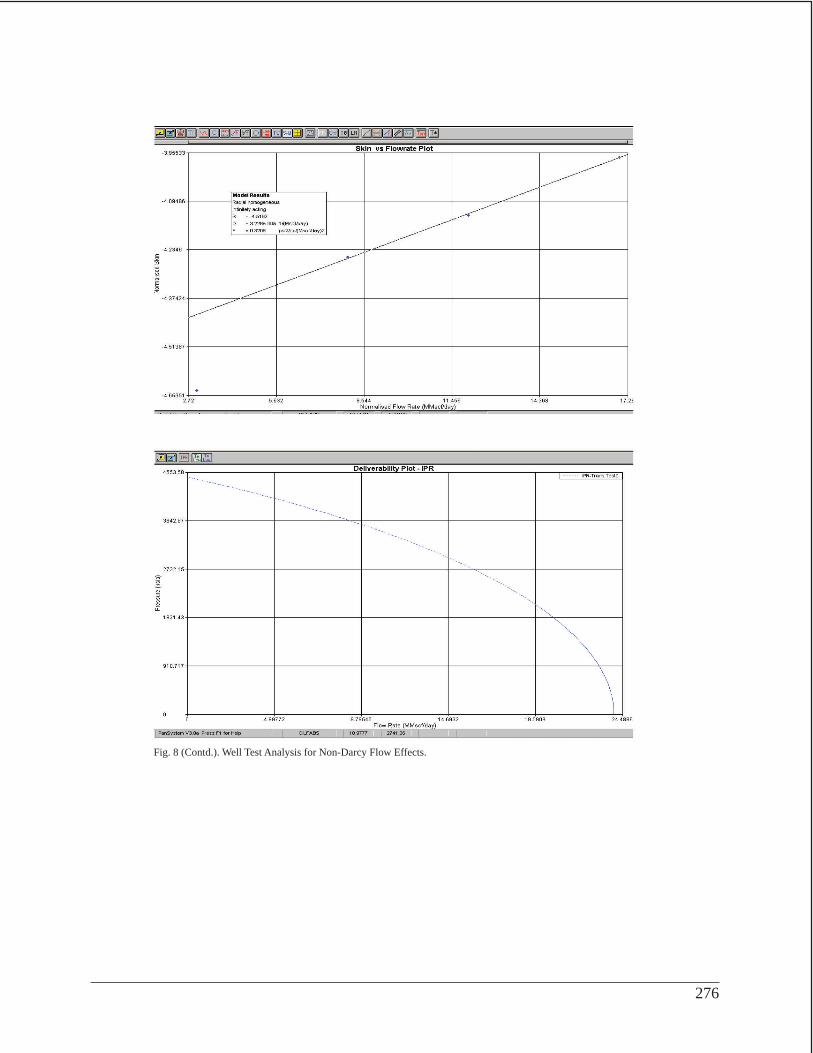
2. Parallel lines were placed at the same permeability,with one on each test period. In order to do ratedependent skin analysis the non-Darcy skin analysisoption was utilized, and total skin associated witheach test period was determined.
3. On skin vs. flow rate plot (S~Q) a line was fittedby selecting skin calculations; Darcy skin, S, ratedependent skin, D and non-Darcy flow coefficient,F, are determined. After confirming the results,the previously obtained, S on Horner plot is over-written. The skin, S determined from this plot isappropriate since the skin from Horner plot was atotal skin, which includes both Darcy and non-Darcy skin.
4. After confirming values of S, D and F in step-3,from transient deliverability analysis, IPR curve isplotted.
Well Test analysis is shown in Fig. 8.
266
Fig-1: Graphical representation of determining S andD form Mutirate test. [15]

SUMMARY OF RESULTS
Results
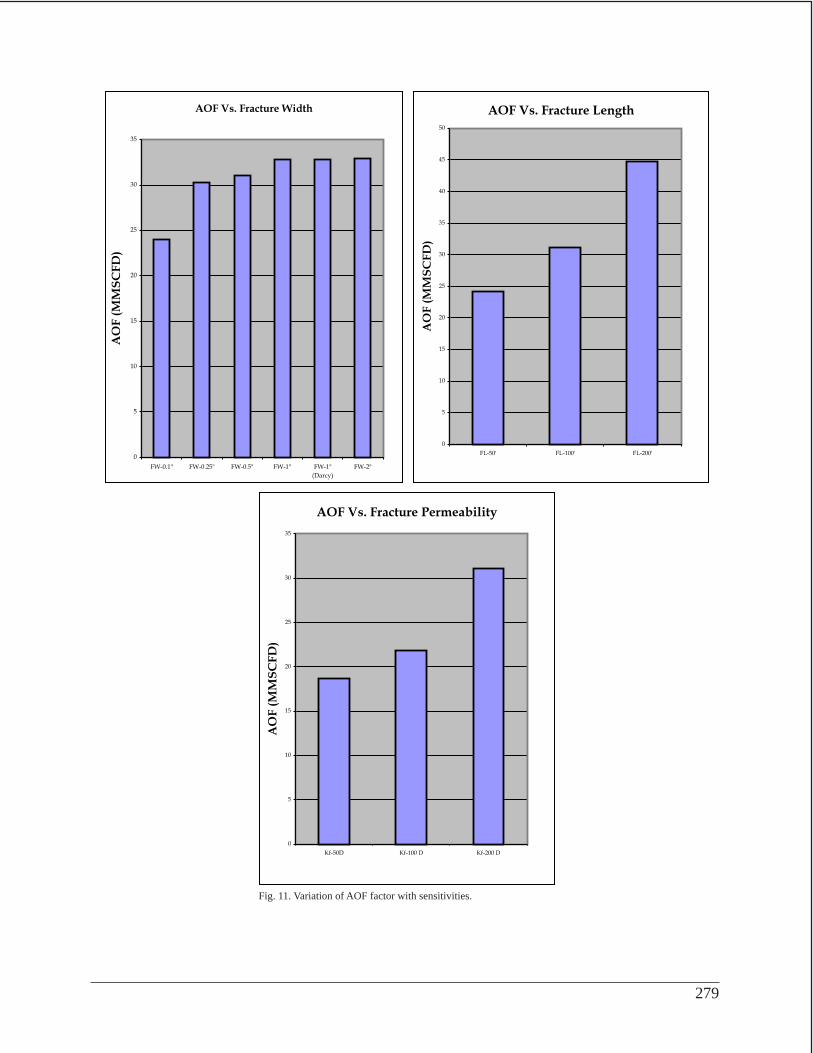
The base case was modelled with two scenarios, oneneglecting non-Darcy flow effects and other includingthis effect. All the sensitivities of fracture geometrieswere analysed for non-Darcy flow effects, while theoptimum case was also analysed for both scenarios.Results of well tests analysis and interpretation for allthe cases including base case, sensitivities and optimumcase are plotted in Figs. 9 to 11.
Discussion
It is clear from the comparison plots that both thenegative skin and AOF are increasing, with the increaseof fracture width, fracture half-length and fracturepermeability.
As observed from the results of well test analysis andinterpretation, the fracture width and permeabilitysignificantly affect performance of the well and hencesupporting the concept of tip screenout (TSO) fracturing,i.e. the wider, shorter fracture provides much betterproductivity than long, narrow one.
As this study aimed at the analysing and investigatingfor non-Darcy flow effects, the optimum case in whichfracture width is 1 inch, gives negligible non-Darcyflow effects. This is clear from pressure-transient responseas shown in Fig. 9 and well test results. Therefore, afracture width of 1 inch or greater minimizes the non-Darcy flow effects to negligibly small thereby improvesperformance of a hydraulically fractured gas well.
CONCLUSIONS
1. The productivity of a hydraulically fractured gaswell is determined by fracture length, fractureconductivity and post-fractured permeability.
2. Non-Darcy flow in the fracture significantly affectsthe productivity of a fractured gas well. Hydraulicfracturing treatment should create a wide and high-conductivity fracture to reduce this effect. Shortand wide fractures (such as TSO fracturing),significantly reduces the non-Darcy flow effects.
3. Propped hydraulic fracture with fracture width of1” or greater, yields results which show non-Darcyflow effects negligibly small.
FUTURE WORK
Some highlighted important work that may be done infuture to continue this study is:
1. Utilizing improved simulation skills to simulatehydraulic fracture accurately, particularly lookingfor the fracture tip effects. Although an attempt wasmade to study the tip effects by defining tip asimpermeable block, no effects were seen in theresults.
2. As the effects of non-Darcy flow are consideredmore adverse for multiphase flow, this work maybe extended to hydraulically fractured Gas-Condensate wells.
REFERENCES
[1] SPE 70015, “Literature Review on Correlations ofthe Non-Darcy Coefficient”, Dacun Li, SPE, and ThomasW. Engler, SPE, New Mexico Institute of Mining andTechnology.[2] SPE 71573, “Fractured-Well-Test Design andAnalysis in the Presence of Non-Darcy Flow”, A. Gil,SPE, and E. Ozkan, SPE, Colorado School of Mines,and R. Raghavan, SPE, Phillips Petroleum Co.[3] SPE 63176, “Effect of Non-Darcy Flow on theInterpretation of Transient Pressure Responses ofHydraulically Fractured Wells”, S. Umnuayponwiwat,SPE, and E. Ozkan, SPE, Colorado School of Mines,and C.M. Pearson, SPE, and M. Vincent, SPE, CarboCeramics Inc.[4] SPE 26150, “Physical Explanations of Non-DarcyFlow Effects for Fluid Flow in Porous media”, HulpingMa, SPE, and D.W.Ruth, DPE. U. of Manitoba.[5] SPE 20709, “The Effects of Non-Darcy Flow inPropped Hydraulic Fractures”, J.P. Martins, PE,BP Exploration; D. Milton-Tayler, BP Research; andH.K. Leung, SPE, BP Exploration
[6] SPE 11101, “Non-Darcy Compressible Flow of RealGases in Propped Fracture”, Ubani, phraim A.Evans,
267
Fig. 2. Tip Screen Out and Conventional Fracturing Compared [13]

Ronald D.U. of Oklahoma.[7] SPE 5586, “The Effects of Non-Darcy Flow on theBehavior of Hydraulically Fractured Gas Wells (includesassociated paper 6417), Holditch, S.A.Texas A and MU.Morse, R.A.Texas A and M U.[8] SPE 25465, “Production Performance ofHydraulically Fractured Gas Wells “, Liao, Yizhu, Lee,W.J., Texas A and M U.[9] SPE 77901, “An Analytical Model for ProductionEstimation from Hydraulically Fractured Tight-GasReservoirs”, M.M. Rahman*, M.K. Rahman, and S.S.Rahman; SPE, School of Petroleum Engineering,University of New South Wales, Australia.[10] SPE 39060, “Simulation of Fractured GasReservoir-An Overview”, S. Vossoughi, SPE, K. Asgarir,SPE, University of Kansas.[11] “Gas Reservoir Engineering” John Lee, Robert A.Wattenberger.[12] “Well Testing”, Prof. George Stewart.[13] “Production Technology-2”, Dr. David R. Davis.[14] “Fundaments of Reservoir Engineering”, L.P.Dake.[15] “Gas Well Testing”, David A.T. Donohue.[16] “Unified Fracture Design”, Michael Economides,Ronald Oligney and Peter Valko.
268

269
270
Table 1. Reservoir Properties.
Table. 4. Test Schedule.
Table. 2. Fluid Properties.
Table. 3. Proppant Permeabilities.
Table. 5. Different fracture geometries used for sensitivity analysis study.
271
Fig. 3. Base Case Model.
Fig. 4. Slicing of Grid showing Hydraulic Fracture.
Fig. 5. Pressure-transient Response for Base Case (with and without non-Darcy Flow effect).

272
Fig. 6. Well Test Analysis for Model Validation.

273
Fig. 6 (Contd.). Well Test Analysis for Model Validation.

274
Fig. 7. Pressure-transient Plots for Sensitivities Studied.
275
Fig. 8. Well Test Analysis for Non-Darcy Flow Effects.
276
Fig. 8 (Contd.). Well Test Analysis for Non-Darcy Flow Effects.
277
Fig. 9. Variation of negative skin with sensitivities.

278
Fig. 10. Variation of non-Darcy flow factor with sensitivities.
279
Fig. 11. Variation of AOF factor with sensitivities.

Abdul Malik Kakar
Abdul Malik Kakar holds aMaster’s degree in PetroleumEngineering from Heriot-WattUniversity, Edinburgh-UK andBachelor’s degree in PetroleumEngineering from the Universityof Engineering and Technology(UET), Lahore-Pakistan. He iscurrently working as a Petroleum Engineer withTechnical Services Department of Pakistan PetroleumLimited (PPL). Kakar joined PPL in January 1998 andhas to his credit over six (06) years of experience inProduction Technology, Production Operations and WellTesting. He is a member of Pakistan Engineering Council(PEC) and Society of Petroleum Engineers (SPE), andalso a member of the SPE’s program committee inKarachi.
ABOUT THE AUTHOR
280