abg basel 3 seminar - seb group · pdf fileabg . basel 3 . seminar. oct 6. th, 2010. 2. ... eu...
TRANSCRIPT
Anders Kvist Head
of Group Treasury
ABG Basel 3
Seminar
Oct 6th, 2010

2
Transmission of financial crisis to the
real economyResulting inability to absorb
increasing trading and credit losses
nor to re-intermediate large off-balance sheet exposures
Excessive on-
and off-balance sheet leverage
Low capitalisation, thin equity cushions, deteriorating quality of
banks’
capital sources
Insufficient liquidity buffers
of most financial institutions, which
ultimately turned to central banks for refinancing
Interconnectedness of systemic institutions
through an array of complex and sometimes non-
transparent transactions
Procyclical
deleveraging
of banks exacerbated negative effects of
financial and RE crisis on the real economy
Basel Committee’s key concerns for the global banking sector
BA
SE
LII
IR
EG
UL
AT
OR
YF
RA
ME
WO
RK
:A
NO
VE
RV
IEW
Source J.P.Morgan

3
•
Timetable too aggressive in light of magnitude of change Second round of consultation & QIS required
•
Extended phase in & grandfathering of utmost importance
•
Leverage Ratio strongly opposed (SBA and, finally, EBF agreed. IIF disagrees but support no fixed minimum)
•
Capital Base
-
Write-up of written down hybrid Tier 1 capital securities must be allowed
-
Net pension fund deficits should not be deducted from equity
•
Credit Valuation Adjustments (CVA)
-
Proposed capital add-on for OTC derivatives strongly opposed
•
Liquidity Coverage Ratio
-
Concept OK but run-off assumptions much too pessimistic and liquid asseteligibility much to narrow. Covered bond holdings must be given more credit.
•
Net stable Funding Ratio
-Too prescriptive and conservative. No fixed ratio should be required
SEB´s
consultative response largely agreed
√√√(√)
√
√√
(√)
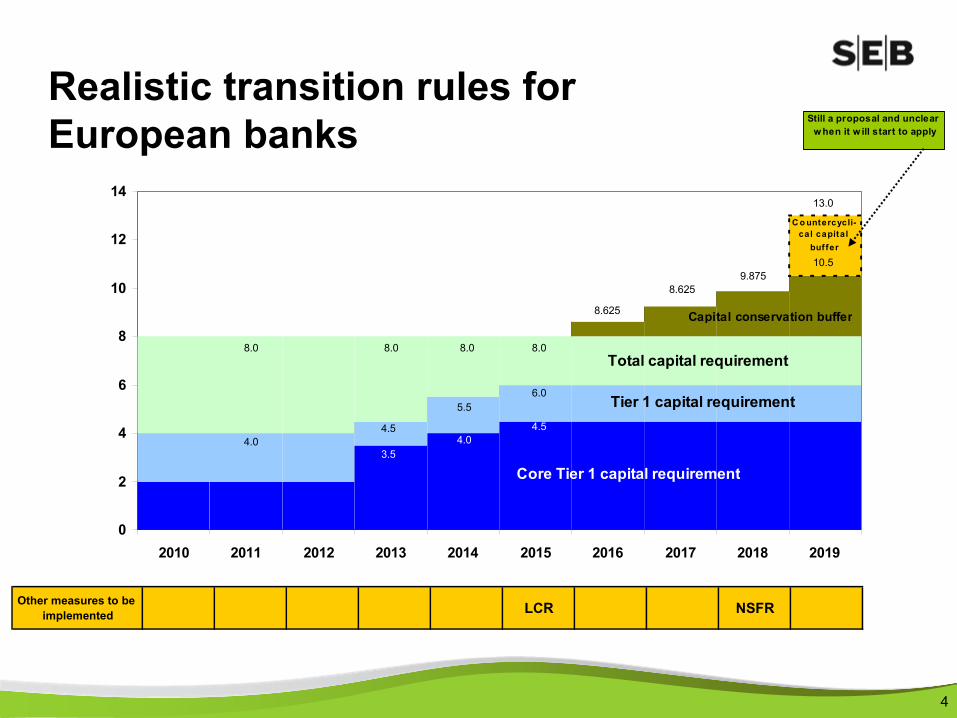
Realistic
transition
rules
for European banks
0
2
4
6
8
10
12
14
2010 2011 2012 2013 2014 2015 2016 2017 2018 2019
3.5
4.5
8.0
C o untercycli-cal capital
buf fer
8.0
5.5
4.04.5
6.0
8.0
Core Tier 1 capital requirement
Tier 1 capital requirement
Capital conservation buffer8.625
8.6259.875
10.5
13.0
Total capital requirement8.0
4.0
Still a proposal and unclear w hen it w ill start to apply
Other measures to be implemented LCR NSFR
4

Redefine bank capital
Introduce supplementary leverage ratios
Liquidity & funding ratios
Adjust for cyclical & systemic effects
Capture additional risk exposures
Basel III and impact on Nordic banks Five key areas of new regulation
1
2
3
4
5
5

13,9 14,3
12,111,7
14,514,7
Dec 2009 Jun 2010
Total capital ratio, %Tier I capital ratio, %Core Tier I
Capital adequacy without transitional floor
SEK bnCapital base 107.3
103.9RWA 730
714
EU stress tests and Basel III
Tier 1 ratio in EU stress test
Benchmark scenario: 11.8%
Adverse scenario: 10.7%
+sovereign shock: 10.3%
Basel III
Core tier 1 well above the aggregate of the required minimum plus conservation buffer and maximum countercyclical buffer
Combined effect of the redefined capital base and RWAs
of 100-
150bps on CT1 in 2012E
SEB’s
capitalisation more than adequate
6
7
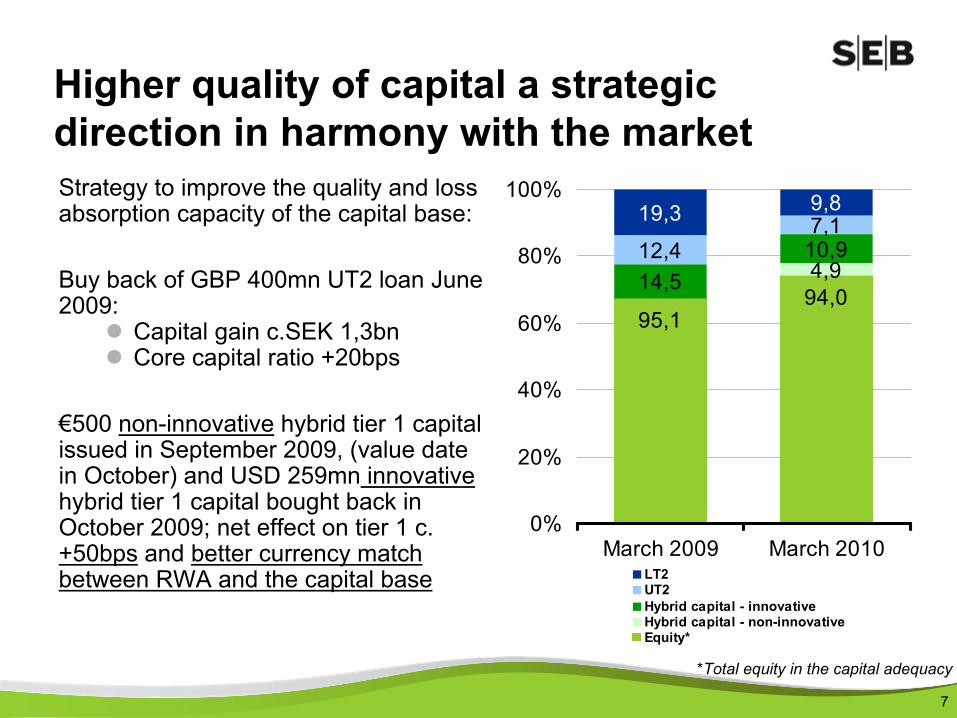
Higher quality of capital a strategic direction in harmony with the marketStrategy to improve the quality and loss absorption capacity of the capital base:
Buy back of GBP 400mn UT2 loan June 2009:
Capital gain c.SEK
1,3bn
Core capital ratio +20bps
€500 non-innovative
hybrid tier 1 capital issued in September 2009, (value date in October) and USD 259mn
innovative
hybrid tier 1 capital bought back in October 2009; net effect on tier 1 c. +50bps
and better currency match
between RWA and the capital base
95,194,04,914,5
10,912,47,119,3 9,8
0%
20%
40%
60%
80%
100%
March 2009 March 2010LT2UT2Hybrid capital - innovativeHybrid capital - non-innovativeEquity*
*Total equity in the capital adequacy

Capital management conclusions●
SEB has a large buffer to any new benchmark requirements
SEB can wait for details of non-common equity components to develop and the investment market’s acceptance of these
No conclusions for contingent capital and hybrid tier 1 capital yet
Size/Design of countercyclical and systemic (?) buffers still unclear
●
The buffer on top of all regulatory buffers can be small
Most potential scenarios already covered
●
Very unclear role for Tier 2 capital going forward
●
Normalization of dividend in accordance with dividend policy preferred route for returning capital as of now
8

SEB’s
balance sheet liquidity is structurally strong
Assets Equity & Liabilities
Balance sheet structure (June 2010)
Funding <1 year
Funding, remaining maturity
>1 year
Cash & Lending
Financial Institutions
Deposits from the publicOther
Lending
Net Bond portfolio
Equity
Short-term and Liquid
assets
Stable funding
Short-term funding
“Banking book”
Net Other trading
Deposits Financial
Institutions
Household Lending
9
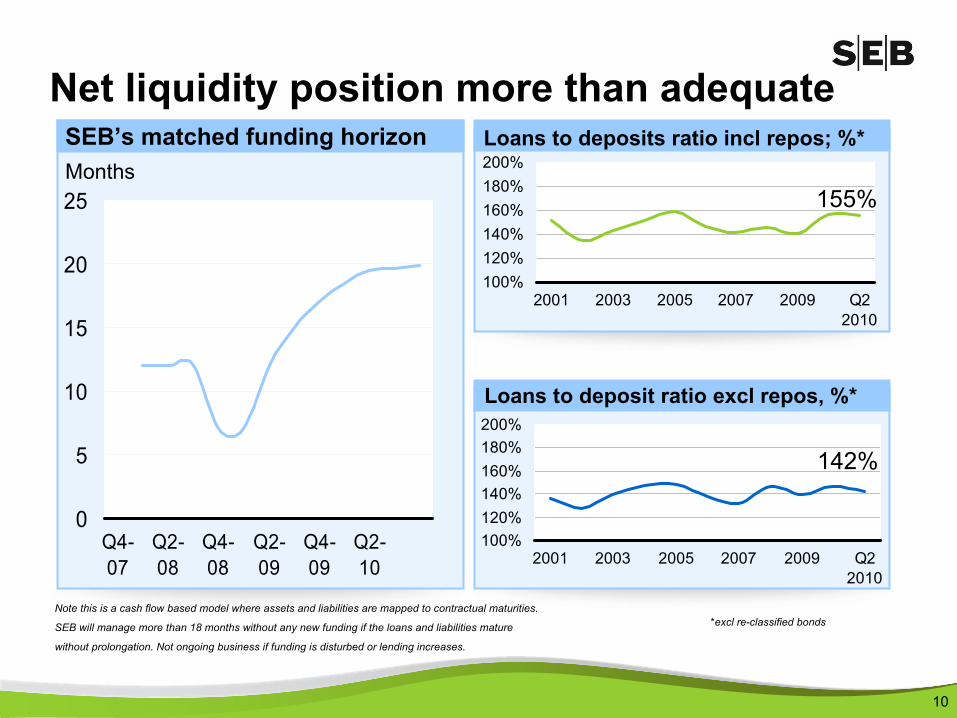
Loans to deposits ratio incl
repos; %*
Net liquidity position more than adequateSEB’s
matched funding horizon
Months
100%120%140%160%180%200%
2001 2003 2005 2007 2009 Q22010
155%
0
5
10
15
20
25
Q4-07
Q2-08
Q4-08
Q2-09
Q4-09
Q2-10
Loans to deposit ratio excl repos, %*
100%120%140%160%180%200%
2001 2003 2005 2007 2009 Q22010
142%
*excl
re-classified
bondsNote this is a cash flow based model where assets and liabilities are mapped to contractual maturities.
SEB will manage more than 18 months without any new funding if the loans and liabilities mature
without prolongation. Not ongoing business if funding is disturbed or lending increases.
10

Funding structure SEB Group, SEK 1,580bn, June 2010
Schuldscheins and Reg Bonds 1,3%
Mortgage Covered Bonds Germany
2,5%
Subordinated debt 2,0%
Deposits - General Public 42,2%
Senior debt 6,3%
Public Covered Bonds Germany 4,4%
CPs/CDs 10,8%
Deposits - Central Banks 7,6%
Mortgage Covered Bonds Sweden 10,1%
Deposits - Financial Institutions 13,0%
11
Managing NSFR●
Issuance of Swedish and German covered bonds and create cover pools for other loan classes
●
Increase and/or prolong deposit volume by either attracting new volumes or incentivizing
customers to transfer funds from mutual funds
●
Restructure lending by shortening duration or transfer corporate
lending to bonds that are kept in SEB’s
balance sheet
●
“Externalize”
lending by either securitizing parts of loan portfolio or assisting large corporates
to replace credit from SEB with bonds issued
to third parties (public issues or private placement)●
Reduce trading portfolios
●
Reduce credit facilities●
Issuance of senior unsecured debt
12
No rush –
and we still think it is a too rigid framework not fit for the Nordic markets

Managing Liquidity Coverage Ratio (LCR)●
SEB has a high quality liquidity portfolio in SEK and EUR
●
Further build-up of liquidity reserves can easily be funded by using the untapped potential in the mortgage cover pool
●
In addition, significant international Commercial Paper borrowing capacity
●
All collateral normally eligible for central bank borrowing purposes should qualify as liquidity reserve assets for the purposes of LCR
●
Local Swedish regulatory approach desirable
13
Requirements easy to meet –
but we would encourage a framework more geared to covered bonds
Liquidity management conclusions•
SEB has a diversified and functional funding starting point with
access
to all relevant funding markets
-
The transitional rules proposed means that the current liquidity management strategy remains valid
•
Customer Pricing will more accurately reflect costs of Capital-
On and off balance sheet consumption
-
Liquidity
•
The proposed Basel III framework remains structurally misaligned
to the robust Nordic funding markets
-
Too little credit given to covered bonds
-
Too little credit given to the robustness of corporate deposit
14

15
Summary
Redefine bank capital
Changes to capital definitions in line with SEB’s
current conservative risk and capital management
Under both the current and new rules, SEB remains among the best
capitalised banks in Europe
SEB’s
relative position vs. European peers is likely to improve as the impact of the new rules on SEB is estimated to be smaller than the European average–
New rules reflect full benefits of current high common equity component within Core Tier 1
A combined effect of the redefined capital base and RWAs
of 100-150bps on SEB’s
CT1 in 2012E
Capture additional risk exposures
Further details on proposed changes required for detailed assessment
Introduce supplementary leverage ratios
SEB within top quartile of European banking universe and within top half of Nordic banks due to high capital levels and minimal relative off balance sheet and credit derivative exposures
Liquidity & funding standards
Impact of Liquidity and Funding Ratios highly dependent on continued refinements by Committee
Long transition times allow ample time to adapt business model –
should Nordic characteristicse
not be recognized
Adjust for cyclical & systemic effects
In line with SEB’s
current dividend policy which is already based on a “through the cycle”
payout ratio–
Flexibility to be adjusted depending on “point in time”
capitalisation level
Proposed regulatory changes reinforce a more robust view on capital, echoing SEB’s
own capital and risk management strategy. All buffer capital requirements have not been set yet.

16