abhd11, a new diacylglycerol lipase involved in weight
TRANSCRIPT
RESEARCH ARTICLE
ABHD11, a new diacylglycerol lipase involved
in weight gain regulation
Johanna EscoubetID1*, Mireille Kenigsberg1, Murielle Derock1, Veeranagouda Yaligara1,
Marie-Dominique Bock1, Sandrine Roche1, Florence Massey1, Helène de Foucauld1,
Charles BettembourgID1, Anne Olivier1, Antoine Berthemy2, Joel Capdevielle3,
Richard Legoux3, Eric Perret3¤, Armelle Buzy1, Pascale Chardenot4, Valerie Destelle4,
Aurelie Leroy4, Christophe Cahours4, Sandrine Teixeira4, Patrick Juvet1, Pascal Gauthier1,
Michael Leguet1, Laurence Rocheteau-Beaujouan1, Marie-Agnès Chatoux1,
Willy Deshayes1, Margerie Clement1, Mostafa Kabiri5, Cecile Orsini1, Vincent Mikol1,
Michel Didier1, Jean-Claude Guillemot1
1 Sanofi Research and Development, Chilly-Mazarin, France, 2 Evotec, Toulouse, France, 3 Sanofi
Research and Development, Toulouse, France, 4 Sanofi Research and Development, Montpellier, France,
5 Sanofi Research and Development, Industriepark Hochst, Frankfurt, Germany
¤ Current address: Evotec, Toulouse, France
Abstract
Obesity epidemic continues to spread and obesity rates are increasing in the world. In addi-
tion to public health effort to reduce obesity, there is a need to better understand the underly-
ing biology to enable more effective treatment and the discovery of new pharmacological
agents. Abhydrolase domain-containing protein 11 (ABHD11) is a serine hydrolase enzyme,
localized in mitochondria, that can synthesize the endocannabinoid 2-arachidonoyl glycerol
(2AG) in vitro. In vivo preclinical studies demonstrated that knock-out ABHD11 mice have a
similar 2AG level as WT mice and exhibit a lean metabolic phenotype. Such mice resist to
weight gain in Diet Induced Obesity studies (DIO) and display normal biochemical plasma
parameters. Metabolic and transcriptomic analyses on serum and tissues of ABHD11 KO
mice from DIO studies show a modulation in bile salts associated with reduced fat intestinal
absorption. These data suggest that modulating ABHD11 signaling pathway could be of
therapeutic value for the treatment of metabolic disorders.
Introduction
The prevalence of obesity is increasing and affects 650 million people, becoming one of the
foremost global health threats [1] [2]. Obesity can seriously impair health through a broad
range of complications such as cardiovascular diseases, type 1 and 2 diabetes, cancer, musculo-
skeletal disorders, psychosocial imbalances and reduced quality of life. Lifestyle modification is
an integral part of the weight management journey, but is often insufficient on its own, and
needs to be complimented by pharmacological and surgical add-on treatments to achieve
greater and more sustainable weight loss, as appropriate. There are so far a limited number of
pharmacological agents that are effective and safe for managing obesity [3]. As a result, there is
PLOS ONE
PLOS ONE | https://doi.org/10.1371/journal.pone.0234780 June 24, 2020 1 / 21
a1111111111
a1111111111
a1111111111
a1111111111
a1111111111
OPEN ACCESS
Citation: Escoubet J, Kenigsberg M, Derock M,
Yaligara V, Bock M-D, Roche S, et al. (2020)
ABHD11, a new diacylglycerol lipase involved in
weight gain regulation. PLoS ONE 15(6):
e0234780. https://doi.org/10.1371/journal.
pone.0234780
Editor: Daniela Cota, "INSERM", FRANCE
Received: March 31, 2020
Accepted: June 2, 2020
Published: June 24, 2020
Copyright: © 2020 Escoubet et al. This is an open
access article distributed under the terms of the
Creative Commons Attribution License, which
permits unrestricted use, distribution, and
reproduction in any medium, provided the original
author and source are credited.
Data Availability Statement: All relevant data are
within the manuscript and its Supporting
Information files.
Funding: The work was funded by Sanofi. Sanofi
provided support in the form of salaries for all
Sanofi authors [J.E., M.Ke., M.De., V.Y., M.D.B., S.
R., F.M., H.d.F., C.B., A.O., J.C., R.L., E.P., A.Bu., P.
C., V.D., A.L., C.C., S.T., P.J., P.G., M.L., L.R.B., M.
A.C., W.D., M.C., M.Ka., C.O., V.M., M.Di., J.C.G.].
The funder had a role in the decision to publish but
no role in the study design, data collection and
analysis or preparation of the manuscript. The
a need to identify new targets and molecular therapeutics for the treatment of this metabolic
disorder which is one of the most difficult public health issues our society has faced in recent
years.
Targeting the endocannabinoid system by blocking cannabinoid receptors or enzymes
responsible for their synthesis was considered a promising strategy to treat obesity and associ-
ated diseases. One of the physiological roles of the endocannabinoid system is the regulation of
the metabolic homeostasis via central, but also peripheral, cannabinoid receptor 1 (CB1).
Endocannabinoids play a role in the regulation of food intake by affecting feeding behavior
and by acting directly on peripheral organs such as the liver, white adipose tissue and the gas-
trointestinal tract where CB1 is expressed. [4–7]. However, CB1 antagonists have shown lim-
ited benefit risk ratio in humans [8].
The endogenous ligand of CB1 and CB2, 2-Arachidonoyl glycerol (2-AG) [9, 10], is a full
agonist and most abundant in the rodent brain [11]. 2-AG is a neuromodulator playing roles
in learning and memory, anxiety, pain, appetite and weight gain [12].
2-AG levels are tightly controlled by different biosynthetic and degradative pathways. Sev-
eral enzymes have been implicated in its catabolic pathway, Monoacylglycerol lipase (MAGL)
being the principal hydrolase in rodent brain [13], but it can be also degraded by FAAH,
ABHD6 or ABHD12 to arachidonic acid and glycerol [14].
In 1989, Farooqui et al. described 2-diacylglycerol lipases (DAGL) activities in bovine brain
[15], one localized in plasma membrane and the other localized in microsomes. Both activities
were inhibited by the lipase inhibitor RHC80267. The latter authors purified, but did not iden-
tify, a 27 kDa protein from the microsomal fraction and a 52 kDa protein from the plasma
membrane fraction.
In 2003, Bisogno et al. identified by a bioinformatic approach and cloned two human DAG
lipases: DAGLα and β of respectively 70 and 120 kDa [16]. Both proteins are expressed at the
plasma membrane. They have four transmembrane domains and contain the serine hydrolase
catalytic triad Ser, Asp, His with the serine included in the serine lipase motif GXSXG. These
DAGLs generate 2-AG from DAG in a Ca2+ dependent manner. The main inhibitors
described were non-specific lipases inhibitors, RCH80267 [17] and THL (tetrahydrolipstatin)
[18]. Inhibitors of DAG lipase α were shown to reduce food intake and body weight in mice
[19] but no compounds have demonstrated clinical efficacy so far.
In 2007, Rosenberger et al. further characterized substrate specificity and kinetic parameters
of microsomal 29 kDa DAG lipase [20]. They showed that the enzyme hydrolyzes stearate in
preference to palmitate from the sn-1 position of 1,2-diacyl-sn-glycerols and produced the
CB-1 receptor ligand, 2-arachidonoyl-sn-glycerol.
In the present study, we have identified Abhydrolase domain-containing protein 11
(ABHD11) as a 29kDa DAG lipase that can synthesize in vitro the endocannabinoid, 2-Arachi-
donoyl glycerol (2-AG) from 1-stearoyl-2-arachidonoyl-sn-glycerol as a substrate. This mito-
chondrial enzyme is a new DAG lipase displaying a different tissue expression pattern and
different cell localization from the previously characterized DAG lipases α and β.
There is no compelling monogenic genetic association between hABHD11 and human dis-
eases. However, in the case of Williams-Beuren syndrome [21], about 25 genes are hemizy-
gously deleted including ABHD11 gene. This rare developmental disease leads to
supravalvular aortic stenosis, mental retardation, overfriendliness, and specific facial features.
These patients also present metabolic abnormalities including decreased triglycerides (TG)
[22] and lower body mass [23], but the direct association is not established yet.
To determine if this enzyme plays a role in obesity, mice deprived of ABHD11 (KO
ABHD11) were phenotyped in a high fat diet (HFD) study and we have shown that the absence
of ABHD11 leads to resistance to weight gain. KO ABHD11 mice under HFD display a lean
PLOS ONE ABHD11 is involved in weight gain regulation
PLOS ONE | https://doi.org/10.1371/journal.pone.0234780 June 24, 2020 2 / 21
specific roles of the authors are articulated in the
‘author contribution’ section.
Competing interests: All authors were Sanofi
employees during the course of the study except A.
Be. who was an Evotec associate. Some authors
may hold Sanofi shares. This does not alter the
authors’ adherence to PLOS ONE policies on
sharing data and materials.
phenotype and normal plasma parameters associated with blood bile salt level modification
and reduced intestinal absorption of fat.
These in vivo data suggest that ABHD11 or ABHD11-associated signaling pathway could be
an attractive target for weight gain regulation.
Material and methods
Liposome preparation and DAG lipase enzymatic reaction assay
ABHD11 enzymatic activity was measured by detecting the presence of the molecule referred
to as m/z 287.1 (+) by mass spectrometry. This method is described, e.g. in Thomas et al. [24]
and in Rimmerman et al. [25].
Liposome preparation. 10 μL DAG (10 mg/ml in CH3CN) was mixed with 50 μL Lyso
phosphatidyl choline (LPC-SIGMA at 5 mg/ml in CHCL3), evaporated to dryness, solubilized
with 30 μL CHCI3 followed by 100 μL of homogenizing buffer (0.1 M MOPS pH 7.4, 0, 25%
BSA) and then subjected to ultrasound using a warming ultrasonic bath (Deltasonic) in an
open tube for 15 min at 37˚C, allowing slow CHCL3 evaporation and liposome generation.
DAGL activity. was measured at 37˚C for 20 hours with 90 μL of 100 mM MOPS pH 7.4,
100 μL of purified fraction from brain, or equivalent quantity of recombinant ABHD11, and
10 μL DAG in LPC liposome as substrate (150 μΜ final DAG) or variable amount for enzy-
matic characterization.
For PMSF and RHC80267 inhibition, preincubation was carried out for 30 min at 3 mM
and 1 mM, respectively, before adding DAG. RHC80267 (Sigma Aldrich) was also used. The
reactions were stopped by adding chloroform supplemented with internal standard 2-AG-D8
(Cayman chemicals) for extraction. After centrifugation (5 min at 1500g), the organic layers
were collected and dried under vacuum. The residues were suspended with 50 μL of H20/
CH3CN mix (80:20) and analyzed by high performance liquid chromatography/mass spec-
trometry in "MRM-like" mode.
LC-MSMS "MRM-like" experiment. The HPLC system consisted of an Ultimate (DIO-
NEX) mounted with a NanoColumn POROS R1–150 mm x 75 μm, equilibrated with 70% elu-
ent A (H20 0.2% HCOOH) and 30% eluent B (CH3CN 0.2% HCOOH). 2-AG was eluted with
a linear gradient from 30% eluent B to 100% eluent B in 12 min with a flow rate of 200 nL/
min, followed by an isocratic wash with 100% eluent B. Experiments were performed on a
Q-TOF instrument (Waters-Micromass) in positive ionization mode operating in the MS/MS
mode. MS/MS analyses were performed over a mass range of m/z 250–300 and mass set 379.29
(+) during the LC-MS run, at the retention time of 2-AG, in a window of 10 min. Energy colli-
sion was set to 28ev. The transition 379.29(+) -> 287.1 (+) was extracted for quantification
purposes and normalized with m/z 637.3 (from LPC).
Immunofluorescence cell staining
MCF7 cells were rinsed in PBS, fixed 10 min with 3.7% paraformaldehyde and permeabilized
in 0.5% Triton in PBS for 15 min. After two washes in PBS, cells were incubated in Antibody
Diluent with Background Reducing Components (DAKO) for 1 hour. Cells were then co-
stained overnight at 4˚C with anti-ABHD11 mouse antibody (Abnova, H00083451-B01P)
diluted at 1/25 and anti-COX IV rabbit antibody (Abcam, ab16056) diluted at 1/500 in anti-
body diluent. After 2 washes in PBS, anti-mouse Alexa-488 and anti-rabbit Alexa-555 at 1/500
in antibody diluent were incubated for 1h. Finally, after 2 washes in PBS, nuclei were stained
with DAPI followed by 2 further washes in PBS. Images were obtained with confocal micro-
scope Leica DMI 3000.
PLOS ONE ABHD11 is involved in weight gain regulation
PLOS ONE | https://doi.org/10.1371/journal.pone.0234780 June 24, 2020 3 / 21
Mitochondria purification from mice brain
Mitochondria were isolated by Percoll density gradient using the protocol described by Sims
et al. [26] and Western blot analyses were performed for VDAC-1 (mitochondrial marker),
LDH, Calregulin and ABHD11.
Generation of KO ABHD11 mice
To delete the entire ABHD11 gene sequence, a vector containing the LacZ-loxP-Ub1-em7--
Neo-loxP cassette, flanked by endogenous mouse homology arms at 5’ and 3’, was constructed
and introduced into C57BL6F1 ES cells. Successful transfection of ES cells replaced the entire
coding region from ATG in exon1 to TAA in exon6 of the murine gene with LacZ-loxP-U-
b1-em7-Neo-loxP cassette. LacZ was fused at the endogenous ATG. The entire deletion Size
was 2,309 nt. Regeneron’s GEMM platform (VelociMouse1) was used to target ES cells and
microinject them into mouse embryos. In brief, C57BL6F1 ES cells were electroporated with
the linearized vector construct and positive clones were microinjected into 8-cell stage mouse
C57BL6 embryos. Microinjected embryos were transferred to uteri of pseudo pregnant recipi-
ent females, weaned pups were scored, and high percentage chimera males were selected for
mating with flp-positive C57BL6 females to generate F1 animals for further breeding. Wild
type and KO animals were identified by genomic tail DNA probed with PCR applying the fol-
lowing primer pairs: WT-Fwd: 5’- GCGACAAACCCCAAGACTTC-3’; WT-Rev: 5’- AGTCCC CTGGCTGCT CTTC-3’; KO-Fwd: 5’-TTCTCAGTATTGTTTTGCCAAGTTCT-3’.
Mice were kept and bred under specific pathogen-free conditions in the animal care facilities
accredited by the Association for Assessment and Accreditation of Laboratory Animal Care
International (AAALAC) and all mouse experiments were conducted in accordance with
European guidelines for care and use of laboratory animals and were approved by the local
ethics committee (Comites d’Ethique pour la Protection de l’Animal de Laboratoire C2EA-24
and CEEA-22). Mice were housed (maximum 6 for females and 4 for males) in standard cages
of 370cm2, containing bedding made of wood shavings. They were identifiable by a microchip
system. The animal facility was under controlled conditions of light, temperature, pressure
and humidity.
DIO design
Three week-old mice were genotyped and fed with a standard diet (STD): 6% soybean oil cor-
responding to 14.8 kJ% fat (Ssniff, Germany). They were randomized at Week 6 on weight
parameter to generate HFD and STD groups for each genotype. At this step, mice in the HFD
group were switched from the STD to a HFD (47.4 kJ% fat) based on beef tallow, hydrogenated
coconut oil and corn oil (Ssniff, Germany). Mice in the STD group were maintained on STD
until the end of the study. Body mass and food intake were recorded weekly. To collect feces,
mice were placed in individual metabolic cages for 24h with free access to food and drink. The
feces were then weighed and frozen at -80˚C until lipid extraction.
Three independent Diet Induced Obesity experiments, named DIO1, DIO2 and DIO3 have
been performed on WT and KO ABHD11 female mice during this study. These three DIO
were performed in the same experimental conditions, only the number of mice per group, the
duration of the study and some read out were different between them.
DIO 1. This DIO involved 26 female and 24 male mice distributed in the following
groups. Females: 7 KO mice under HFD, 6 KO mice under STD, 7 WT mice under HFD and 6
WT mice under STD. Males: 8 KO mice under HFD, 8 WT mice under HFD and 8 WT mice
under STD (severe reduction of male KO mice birth led us to form only one group of KO
mice, the HFD). Mice weight and food consumption were recorded from 4th to 27th week of
PLOS ONE ABHD11 is involved in weight gain regulation
PLOS ONE | https://doi.org/10.1371/journal.pone.0234780 June 24, 2020 4 / 21

age. Fasting insulin level and fasting glycemia were measured at Weeks 8, 12, 16, 20 and 24.
Non-fasting insulin was recorded at 6, 10, 14, 18, 22 and 27 weeks of age. Oral glucose toler-
ance test was carried out at Week 15. Tissues were collected at the end of the study and flash
frozen for endocannabinoid measurement by mass spectrometry.
DIO 2. This DIO involved 32 female mice distributed in the following groups: 8 KO mice
under HFD, 8 KO mice under STD, 8 WT mice under HFD and 8 WT mice under STD. Mice
weight was recorded from 6th to 31th week of age. Blood were collected for serum preparation
at 6th and 30th weeks of age and used for metabolomics studies, in which 749 metabolites
were simultaneously quantified. Tissues were collected for transcriptomic analysis at the end
of the study (30 weeks of age).
DI0 3. This DIO involved 108 female mice distributed in the following groups: 27 KO
mice under HFD, 27 KO mice under STD, 27 WT mice under HFD and 27 WT mice under
STD. Mice weight and food consumption were recorded from 6th to 19th week of age. Feces
collection was carried out at the 19th week of age.
At the end of the studies, mice were euthanized by pentobarbital administration. Tissues
were flash frozen for transcriptomic analysis or 2-AG quantification.
For practical reasons and following the observation of similar phenotypes between male
and female and a more thorough characterization of female group during DIO1, DIO 2 and
DIO 3 were only performed on female. Most of data presented in this paper have been
obtained from female mice. The weight curve of male mice from the DIO 1 is presented in
Supporting Information.
Insulin recording
Insulin was measured in plasma with Mouse Ultrasensitive Insulin ELISA (Alpco) according
to the manufacturer’s instruction.
Blood glycemia recording
Glucose levels were measured with a blood glucose meter BG Star1 (Sanofi)
Oral glucose tolerance test
The test was performed with overnight fasting mice during DIO1. A solution of 2g glucose/kg
was orally administrated to mice at 10mL/kg. Blood was collected from tail just before the
administration of glucose and after 30 min, 1h, 1h30 and 2h. Glycemia was measured with BG
Star (sanofi).
Insulin sensitivity test
The test was performed with 2 hours-fasting mice during DIO1 at Week 26. The concentration
of insulin (one Unit/kg) was chosen to induce a significant reduction of blood glucose level
without risking of animal loss. Insulin (Umuline Rapide1, Lilly) was intraperitoneally admin-
istered to mice. Glycemia was measured just before the administration of insulin and after 15,
30, 45 min and 1h30.
HOMA-IR index
The HOMA-IR (homeostasis model assessment of insulin resistance) index was calculated as
[fasting glucose in mg/dL] �[fasting insulin in mU/L]/405 to assess insulin resistance.
PLOS ONE ABHD11 is involved in weight gain regulation
PLOS ONE | https://doi.org/10.1371/journal.pone.0234780 June 24, 2020 5 / 21
Statistical methodology for DIO generated data
A three-way analysis of variance was performed with Genotype, Diet as factors and Time as
repeated factor. Then, when appropriate, post-hoc analyses were performed to see the effect of
the diet and of the genotype on the studied parameter. For parameters Body weight, Glycemia,
delta-insulin sensitivity versus baseline, a three-way analysis of variance was performed on
data. For parameters delta-OGTT versus baseline and Insulin, a three-way analysis of variance
was performed on rank-transformed data. Significance level was set to 5% (pvalue<0.05).
RNA extraction and quality assessment for mice liver RNA transcriptomic
analysis
Frozen mice liver samples from DIO2 were thawed on ice and used for total RNA extraction:
700 μL of QIAzol Lysis Reagent (Qiagen) was added to 20 to 30 mg of liver tissue in tissue
homogenizing tubes (Precellys) and homogenized using a Precellys 24 lyser. Then 140 μL
chloroform was added, mixed for 15 sec and centrifuged 15 min at 12000 g at 4˚C. The upper
aqueous phase was discarded and RNA fraction was isolated using QIAcube HT-Kit and
QIAExtractor (Qiagen). RNA quality was determined using RNA 6000 Nano kit and 2100
Bioanalyzer (Agilent). All RNA samples had an RNA integrity number (RIN) between 7 and 9.
Microarray and data analysis
About 100 ng total RNA was processed for Microarray as described by manufacturer using
SurePrint G3 Mouse Gene Expression v2 8x60K Microarray chips (Agilent). Microarray files
were analyzed using Array studio (OmicSoft Corp. Qiagen). Data analysis includes 1) genera-
tion of raw signal intensities from g-Processed signal, 2) setting threshold/ adding constants
(raw signal intensities < 5 were set as 1), 3) combining multiple probes based on Mapping
gene name, 4) Log2 transformation and 5) 75th Quantile normalization. Non-parametric tests
were performed on normalized data and only samples which passed QC were used for two-
way ANOVA.
Metabolomic study on mouse serum
Mice sera were flash frozen and delivered to Metabolon, Inc (617 Davis Drive, Suite 400, Dur-
ham, NC 27713) for metabolomics studies. In brief, samples were extracted and split into
equal parts for analysis on the LC/MS/MS and Polar LC platforms. Proprietary software was
used to match ions to an in-house library of standards for metabolite identification and for
quantitation by peak area integration.
Omics analysis of data
Both metabolomics and transcriptomics data were integrated with AskOmics (Garnier et al.
2017). This allowed us to detect significant changes in the metabolome of the KO mice, sup-
ported by transcriptomics significant changes in liver that could not have been detected by
analyzing the datasets separately (metabolome only or transcriptome only)
We designed a data-driven model to load all the results of both studies in the same reposi-
tory using AskOmics [27] (S6 Fig, in S1 Appendix).
To link genes to metabolites, all paths were computed between the Compound (metabolite)
and Gene classes of the Kegg and Reactome databases, using the RDF version provided by
Bo2RDF [28]. This integration work allowed us to query all data to identify genes and metabo-
lites having a biological relation and also being affected by the genotype and/or the diet.
PLOS ONE ABHD11 is involved in weight gain regulation
PLOS ONE | https://doi.org/10.1371/journal.pone.0234780 June 24, 2020 6 / 21
Lipid extraction and dosage from feces
Feces from each mouse of DIO3 were resuspended in a normal saline solution and crushed
with a spatula. Then, the same volume of chloroform/methanol solution (2:1) was added to
proceed with the lipid extraction. The suspension was homogenized and then centrifuged 10
min at 1000g. To collect the lipid phase, the bottom of the tube was pierced and the lipid phase
was collected in a pre-weighed glass vial. Solvent from the lipid phase was evaporated under a
hood for 24h. Then, the vials containing the lipids which had been extracted from feces, were
weighed again to obtain the lipid mass. They were further resuspended in cholesterol buffer
10X (600μL assay buffer/g of feces) (Cayman Chemical) by strong vortexing.
Total cholesterol concentration was quantified in lipid feces suspensions using a colorimet-
ric assay (Cayman Chemical) according to the manufacturer’s instruction.
Triglycerides concentration was quantified in lipid feces suspensions using a colorimetric
assay (Cayman Chemical) according to the manufacturer’s instruction.
Fatty acid concentration was quantified in lipid feces suspensions using a fluorimetric assay
(Biovision) according to the manufacturer’s instruction.
Results
Purification, biochemical characterization, expression pattern and
sequence analysis of ABHD11
ABHD11 is able to catalyze the hydrolysis of 1-stearoyl 2-arachidonoylglycerol. Start-
ing from a whole pig brain homogenized in a detergent, we purified a 29 kDa protein following
a protocol described by Farooqui et al. [15]. The isolation procedure is summarized in S1A Fig
of S1 Appendix. We first used an activity-based protein profiling (ABPP) assay with a serine
hydrolase probe (Fluorophosphonate, FP-bodipy) and then an enzymatic assay by 2-AG mass
spectrometry (MS) titration to follow DAG lipase activity throughout the different purification
steps.
S1B Fig in S1 Appendix of Supporting Information shows the detection of a 29 kDa band
from pig brain, which fluoresces only in the absence of a serine hydrolase inhibitor PMSF.
After extraction, soluble 29 kDa protein does not require any detergent and conventional puri-
fication steps can be carried out. We purified to homogeneity this protein with a DAG lipase
activity. LC-MS analysis of the labelled band allowed the identification of ABHD11 tryptic
peptides (S1E Fig of S1 Appendix).
The sequence encoding full length human ABHD11 was further cloned in a mammalian
cell expression vector and the protein expressed in HEK293 mammalian cells. Triton X100
detergent extracts from HEK293 cells transfected with ABHD11 were purified according to a
similar procedure (S1A Fig, in S1 Appendix). The Heparin-Sepharose elution fraction was sub-
mitted to ABPP. The transfected ABHD11 was detected only in the absence of PMSF (S1C Fig,
in S1 Appendix), with a molecular weight corresponding to a mature form of the protein
around 30 kDa. Recombinant ABHD11 protein was further purified to homogeneity and char-
acterized by MS (S1D Fig, in S1 Appendix). The observed molecular mass of this recombinant
protein agrees with the molecular mass of 30278 +/-3 Da corresponding to the polypeptide
described in S1E Fig. The MS profile also illustrated the high degree of purity obtained.
Purified hABHD11 was further characterized following in-solution trypsin digestion by
peptide fingerprinting and tandem LC MSMS. LC MSMS experiments analyses unambigu-
ously identified a peptide having a VPAPSSSSGGRGGAEPR sequence corresponding to the
N-terminal mature form of the protein, deleted from the 33 amino acid signal peptide (S1E
Fig, in S1 Appendix).
PLOS ONE ABHD11 is involved in weight gain regulation
PLOS ONE | https://doi.org/10.1371/journal.pone.0234780 June 24, 2020 7 / 21
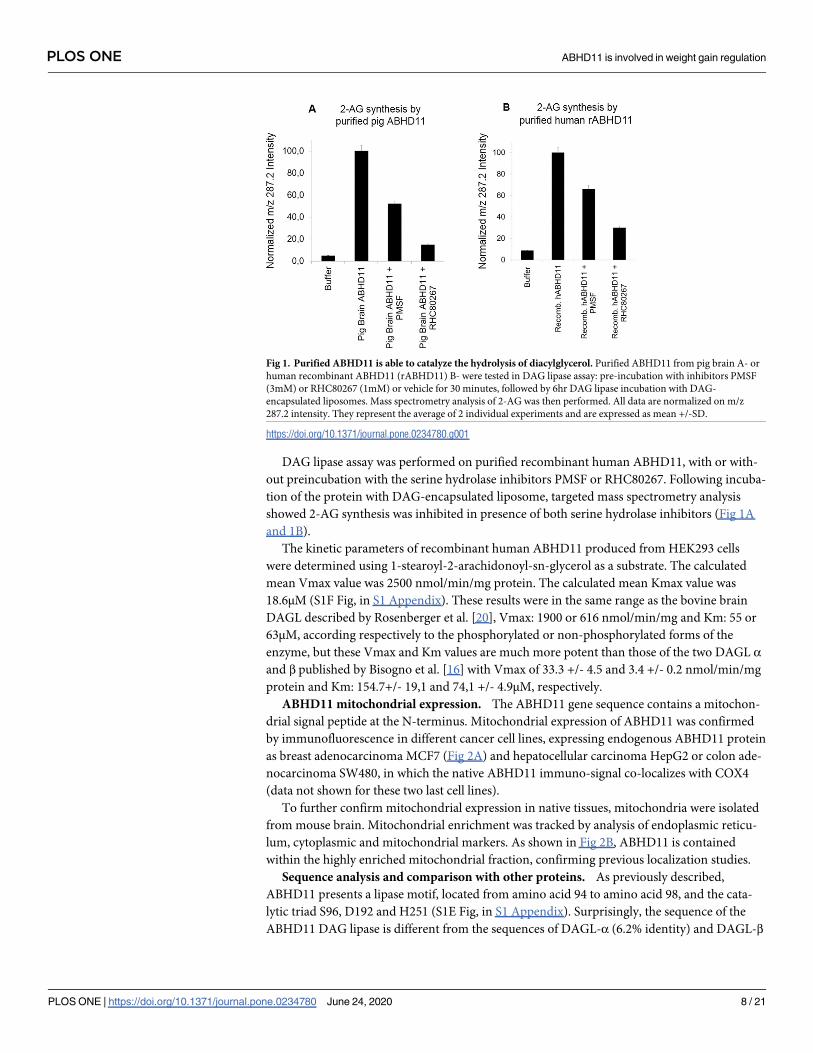
DAG lipase assay was performed on purified recombinant human ABHD11, with or with-
out preincubation with the serine hydrolase inhibitors PMSF or RHC80267. Following incuba-
tion of the protein with DAG-encapsulated liposome, targeted mass spectrometry analysis
showed 2-AG synthesis was inhibited in presence of both serine hydrolase inhibitors (Fig 1A
and 1B).
The kinetic parameters of recombinant human ABHD11 produced from HEK293 cells
were determined using 1-stearoyl-2-arachidonoyl-sn-glycerol as a substrate. The calculated
mean Vmax value was 2500 nmol/min/mg protein. The calculated mean Kmax value was
18.6μΜ (S1F Fig, in S1 Appendix). These results were in the same range as the bovine brain
DAGL described by Rosenberger et al. [20], Vmax: 1900 or 616 nmol/min/mg and Km: 55 or
63μΜ, according respectively to the phosphorylated or non-phosphorylated forms of the
enzyme, but these Vmax and Km values are much more potent than those of the two DAGL αand β published by Bisogno et al. [16] with Vmax of 33.3 +/- 4.5 and 3.4 +/- 0.2 nmol/min/mg
protein and Km: 154.7+/- 19,1 and 74,1 +/- 4.9μΜ, respectively.
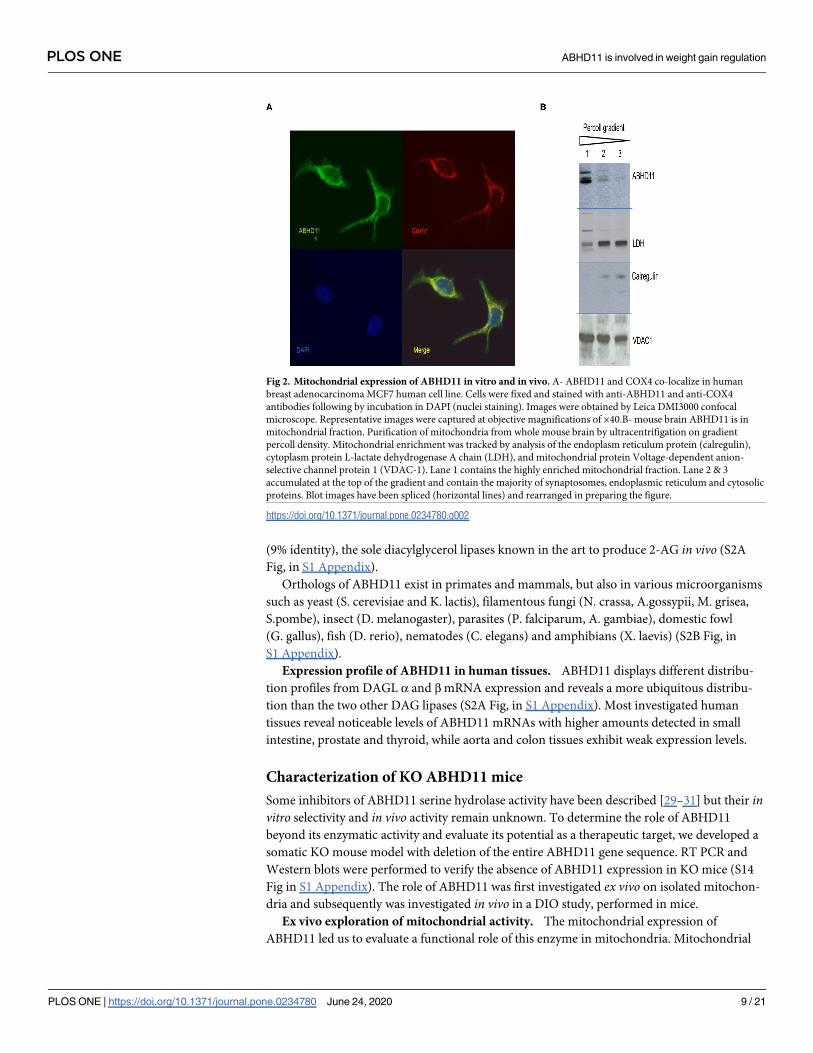
ABHD11 mitochondrial expression. The ABHD11 gene sequence contains a mitochon-
drial signal peptide at the N-terminus. Mitochondrial expression of ABHD11 was confirmed
by immunofluorescence in different cancer cell lines, expressing endogenous ABHD11 protein
as breast adenocarcinoma MCF7 (Fig 2A) and hepatocellular carcinoma HepG2 or colon ade-
nocarcinoma SW480, in which the native ABHD11 immuno-signal co-localizes with COX4
(data not shown for these two last cell lines).
To further confirm mitochondrial expression in native tissues, mitochondria were isolated
from mouse brain. Mitochondrial enrichment was tracked by analysis of endoplasmic reticu-
lum, cytoplasmic and mitochondrial markers. As shown in Fig 2B, ABHD11 is contained
within the highly enriched mitochondrial fraction, confirming previous localization studies.
Sequence analysis and comparison with other proteins. As previously described,
ABHD11 presents a lipase motif, located from amino acid 94 to amino acid 98, and the cata-
lytic triad S96, D192 and H251 (S1E Fig, in S1 Appendix). Surprisingly, the sequence of the
ABHD11 DAG lipase is different from the sequences of DAGL-α (6.2% identity) and DAGL-β
Fig 1. Purified ABHD11 is able to catalyze the hydrolysis of diacylglycerol. Purified ABHD11 from pig brain A- or
human recombinant ABHD11 (rABHD11) B- were tested in DAG lipase assay: pre-incubation with inhibitors PMSF
(3mM) or RHC80267 (1mM) or vehicle for 30 minutes, followed by 6hr DAG lipase incubation with DAG-
encapsulated liposomes. Mass spectrometry analysis of 2-AG was then performed. All data are normalized on m/z
287.2 intensity. They represent the average of 2 individual experiments and are expressed as mean +/-SD.
https://doi.org/10.1371/journal.pone.0234780.g001
PLOS ONE ABHD11 is involved in weight gain regulation
PLOS ONE | https://doi.org/10.1371/journal.pone.0234780 June 24, 2020 8 / 21
(9% identity), the sole diacylglycerol lipases known in the art to produce 2-AG in vivo (S2A
Fig, in S1 Appendix).
Orthologs of ABHD11 exist in primates and mammals, but also in various microorganisms
such as yeast (S. cerevisiae and K. lactis), filamentous fungi (N. crassa, A.gossypii, M. grisea,
S.pombe), insect (D. melanogaster), parasites (P. falciparum, A. gambiae), domestic fowl
(G. gallus), fish (D. rerio), nematodes (C. elegans) and amphibians (X. laevis) (S2B Fig, in
S1 Appendix).
Expression profile of ABHD11 in human tissues. ABHD11 displays different distribu-
tion profiles from DAGL α and β mRNA expression and reveals a more ubiquitous distribu-
tion than the two other DAG lipases (S2A Fig, in S1 Appendix). Most investigated human
tissues reveal noticeable levels of ABHD11 mRNAs with higher amounts detected in small
intestine, prostate and thyroid, while aorta and colon tissues exhibit weak expression levels.
Characterization of KO ABHD11 mice
Some inhibitors of ABHD11 serine hydrolase activity have been described [29–31] but their invitro selectivity and in vivo activity remain unknown. To determine the role of ABHD11
beyond its enzymatic activity and evaluate its potential as a therapeutic target, we developed a
somatic KO mouse model with deletion of the entire ABHD11 gene sequence. RT PCR and
Western blots were performed to verify the absence of ABHD11 expression in KO mice (S14
Fig in S1 Appendix). The role of ABHD11 was first investigated ex vivo on isolated mitochon-
dria and subsequently was investigated in vivo in a DIO study, performed in mice.
Ex vivo exploration of mitochondrial activity. The mitochondrial expression of
ABHD11 led us to evaluate a functional role of this enzyme in mitochondria. Mitochondrial
Fig 2. Mitochondrial expression of ABHD11 in vitro and in vivo. A- ABHD11 and COX4 co-localize in human
breast adenocarcinoma MCF7 human cell line. Cells were fixed and stained with anti-ABHD11 and anti-COX4
antibodies following by incubation in DAPI (nuclei staining). Images were obtained by Leica DMI3000 confocal
microscope. Representative images were captured at objective magnifications of ×40.B- mouse brain ABHD11 is in
mitochondrial fraction. Purification of mitochondria from whole mouse brain by ultracentrifigation on gradient
percoll density. Mitochondrial enrichment was tracked by analysis of the endoplasm reticulum protein (calregulin),
cytoplasm protein L-lactate dehydrogenase A chain (LDH), and mitochondrial protein Voltage-dependent anion-
selective channel protein 1 (VDAC-1). Lane 1 contains the highly enriched mitochondrial fraction. Lane 2 & 3
accumulated at the top of the gradient and contain the majority of synaptosomes, endoplasmic reticulum and cytosolic
proteins. Blot images have been spliced (horizontal lines) and rearranged in preparing the figure.
https://doi.org/10.1371/journal.pone.0234780.g002
PLOS ONE ABHD11 is involved in weight gain regulation
PLOS ONE | https://doi.org/10.1371/journal.pone.0234780 June 24, 2020 9 / 21
respiration profiles were compared in WT and KO ABHD11 mice in different ex vivo models
including 1) isolated liver mitochondria, 2) mouse embryonic fibroblasts (MEFs), 3) primary
hepatocytes, using both mitostress “normal” conditions and a beta oxidation assay that allowed
both mitochondrial respiration and beta oxidation to be monitored (S3, S4, S5 Figs, in S1
Appendix).
Overall no difference in respiration profiles between WT and KO mouse cellular models
were observed.
Mild differences between KO and WT ABHD11 mice. KO ABHD11 mice are viable and
only a slight but significant reduction in body weight has been noticed in males exclusively. In
addition, less abdominal fat deposit was observed in KO as compared to WT male animals (S6
Fig, in S1 Appendix).
Blood biochemical analyses were conducted in 9 week-old male mice and did not reveal
KO genotype effects on any of the measured metabolic parameters, including LDL, HDL, total
cholesterol, glucose, triglyceride, urea, creatinine, phosphor, calcium or bilirubin levels (S7A
Fig, in S1 Appendix).
As both mitochondria and endocannabinoid systems are involved in regulating energy bal-
ance, ABHD11 KO mice were further evaluated in locomotor and muscular strength assays
(S7B and S7C Fig, in S1 Appendix) with no significant difference observed, as compared to
their control WT littermate animals. In addition, no change in rectal temperature was also
noticed (37.5+/-0.2˚C both for WT and KO male mice, n = 10).
A study was conducted on WT and KO mice (n = 6 per genotype) to determine any macro-
scopic and histological modification across tissues (skin, white and brown fats, genital organs,
urinary tract, digestive tube, liver and gallbladder, pancreas, lymphoid organs, brain, eyes,
optic nerves, endocrine system, cardio-respiratory system, skeletal muscle. . .). Only some eye
defects were reported, including iris synechiae, melanophagy in the iris or the ciliary body, cat-
aract (with reduced lens size when advanced) and retinal atrophy in KO mice. Therefore,
9-week old male KO mice were evaluated across sensory vision and touch escape tests (S7D
and S7E Fig, in S1 Appendix). These investigations indicated that such ophthalmologic defects
led to blindness. This vision defect observed in KO mice is probably linked to dysfunction
occurring during embryo development. This defect has no influence on food intake as mice
use their sense of smell for feeding. This has been controlled for measuring the food intake in
the next DIO experiments.
KO ABHD11 mice resist DIO and present normal biochemical parameters
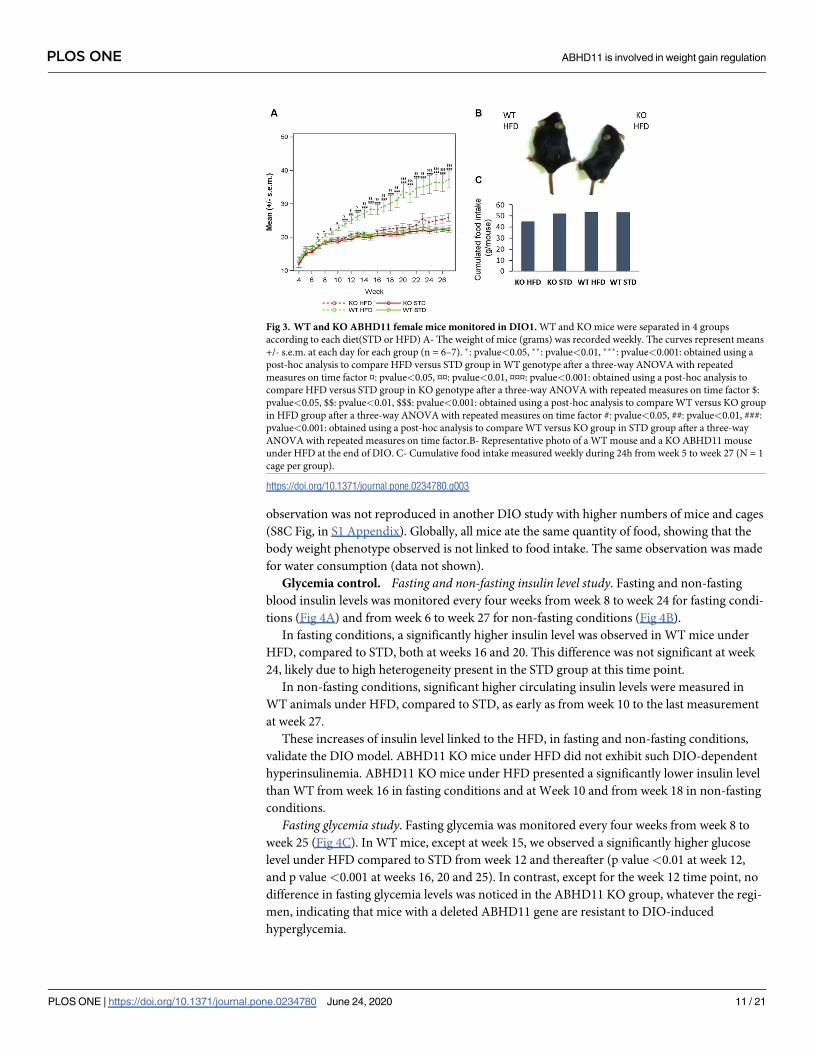
KO ABHD11 mice resist weight gain induced by HFD. As expected, WT mice under
HFD presented a significantly higher weight compared to STD (standard diet) (p value <0.05
from Week 7) (Fig 3, study performed on female mice). In contrast, ABHD11 KO mice were
resistant to diet-induced obesity, as no significant difference in mice weights were observed
between the two regimens in DIO1. A strong resistance to weight gain, even not complete, is
also observed in DIO2 and DIO3, showing the robustness of the genotype effect (S8A-S8B Fig,
in S1 Appendix). Furthermore, DIO1 performed on both sexes, showed no sex difference in
the resistance to DIO phenotype observed in KO mice. A significant lower weight was
observed in KO HFD group compared to WT HFD group from Week 8 (S8D Fig, in S1
Appendix).
Due to the duration of the study, mice could not be kept in individual cages. Food and
water consumption was evaluated by cage. As shown in Fig 3C, there were few differences in
the cumulative food intake, whatever the genotype or the regimen. Only a slightly less food
intake was measured in KO mice under HFD. This likely represents an artefact, as this
PLOS ONE ABHD11 is involved in weight gain regulation
PLOS ONE | https://doi.org/10.1371/journal.pone.0234780 June 24, 2020 10 / 21
observation was not reproduced in another DIO study with higher numbers of mice and cages
(S8C Fig, in S1 Appendix). Globally, all mice ate the same quantity of food, showing that the
body weight phenotype observed is not linked to food intake. The same observation was made
for water consumption (data not shown).
Glycemia control. Fasting and non-fasting insulin level study. Fasting and non-fasting
blood insulin levels was monitored every four weeks from week 8 to week 24 for fasting condi-
tions (Fig 4A) and from week 6 to week 27 for non-fasting conditions (Fig 4B).
In fasting conditions, a significantly higher insulin level was observed in WT mice under
HFD, compared to STD, both at weeks 16 and 20. This difference was not significant at week
24, likely due to high heterogeneity present in the STD group at this time point.
In non-fasting conditions, significant higher circulating insulin levels were measured in
WT animals under HFD, compared to STD, as early as from week 10 to the last measurement
at week 27.
These increases of insulin level linked to the HFD, in fasting and non-fasting conditions,
validate the DIO model. ABHD11 KO mice under HFD did not exhibit such DIO-dependent
hyperinsulinemia. ABHD11 KO mice under HFD presented a significantly lower insulin level
than WT from week 16 in fasting conditions and at Week 10 and from week 18 in non-fasting
conditions.
Fasting glycemia study. Fasting glycemia was monitored every four weeks from week 8 to
week 25 (Fig 4C). In WT mice, except at week 15, we observed a significantly higher glucose
level under HFD compared to STD from week 12 and thereafter (p value <0.01 at week 12,
and p value <0.001 at weeks 16, 20 and 25). In contrast, except for the week 12 time point, no
difference in fasting glycemia levels was noticed in the ABHD11 KO group, whatever the regi-
men, indicating that mice with a deleted ABHD11 gene are resistant to DIO-induced
hyperglycemia.
Fig 3. WT and KO ABHD11 female mice monitored in DIO1. WT and KO mice were separated in 4 groups
according to each diet(STD or HFD) A- The weight of mice (grams) was recorded weekly. The curves represent means
+/- s.e.m. at each day for each group (n = 6–7). �: pvalue<0.05, ��: pvalue<0.01, ���: pvalue<0.001: obtained using a
post-hoc analysis to compare HFD versus STD group in WT genotype after a three-way ANOVA with repeated
measures on time factor ¤: pvalue<0.05, ¤¤: pvalue<0.01, ¤¤¤: pvalue<0.001: obtained using a post-hoc analysis to
compare HFD versus STD group in KO genotype after a three-way ANOVA with repeated measures on time factor $:
pvalue<0.05, $$: pvalue<0.01, $$$: pvalue<0.001: obtained using a post-hoc analysis to compare WT versus KO group
in HFD group after a three-way ANOVA with repeated measures on time factor #: pvalue<0.05, ##: pvalue<0.01, ###:
pvalue<0.001: obtained using a post-hoc analysis to compare WT versus KO group in STD group after a three-way
ANOVA with repeated measures on time factor.B- Representative photo of a WT mouse and a KO ABHD11 mouse
under HFD at the end of DIO. C- Cumulative food intake measured weekly during 24h from week 5 to week 27 (N = 1
cage per group).
https://doi.org/10.1371/journal.pone.0234780.g003
PLOS ONE ABHD11 is involved in weight gain regulation
PLOS ONE | https://doi.org/10.1371/journal.pone.0234780 June 24, 2020 11 / 21
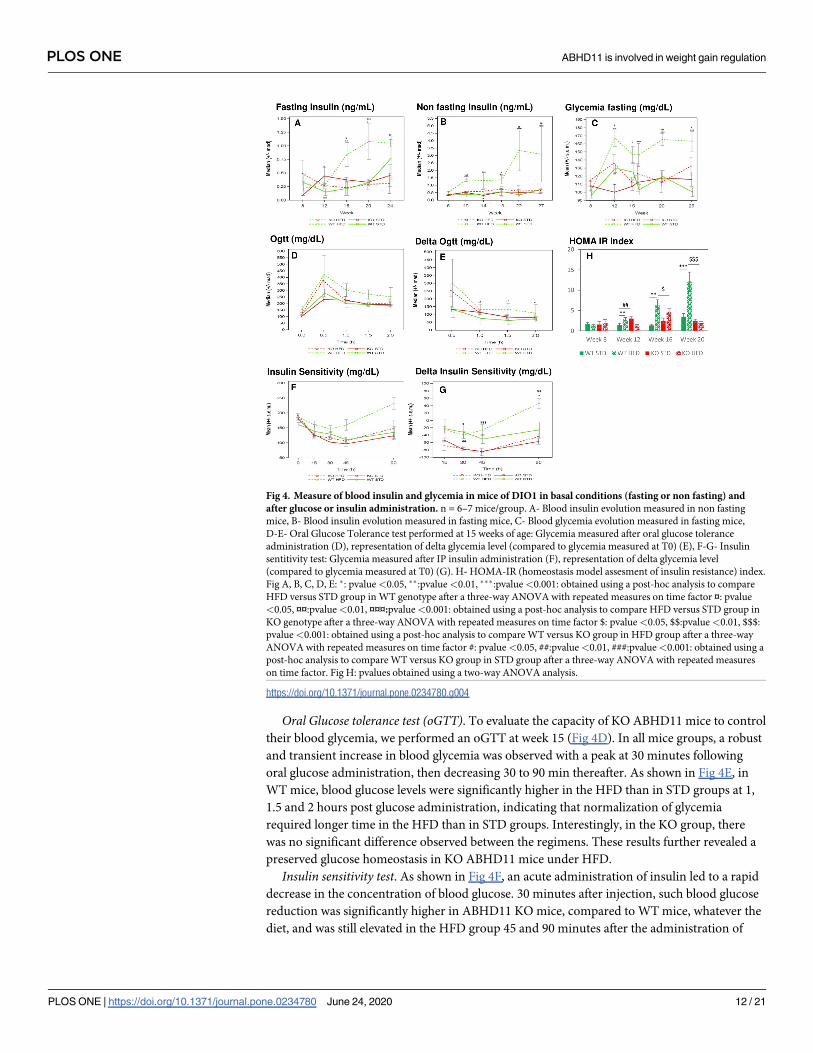
Oral Glucose tolerance test (oGTT). To evaluate the capacity of KO ABHD11 mice to control
their blood glycemia, we performed an oGTT at week 15 (Fig 4D). In all mice groups, a robust
and transient increase in blood glycemia was observed with a peak at 30 minutes following
oral glucose administration, then decreasing 30 to 90 min thereafter. As shown in Fig 4E, in
WT mice, blood glucose levels were significantly higher in the HFD than in STD groups at 1,
1.5 and 2 hours post glucose administration, indicating that normalization of glycemia
required longer time in the HFD than in STD groups. Interestingly, in the KO group, there
was no significant difference observed between the regimens. These results further revealed a
preserved glucose homeostasis in KO ABHD11 mice under HFD.
Insulin sensitivity test. As shown in Fig 4F, an acute administration of insulin led to a rapid
decrease in the concentration of blood glucose. 30 minutes after injection, such blood glucose
reduction was significantly higher in ABHD11 KO mice, compared to WT mice, whatever the
diet, and was still elevated in the HFD group 45 and 90 minutes after the administration of
Fig 4. Measure of blood insulin and glycemia in mice of DIO1 in basal conditions (fasting or non fasting) and
after glucose or insulin administration. n = 6–7 mice/group. A- Blood insulin evolution measured in non fasting
mice, B- Blood insulin evolution measured in fasting mice, C- Blood glycemia evolution measured in fasting mice,
D-E- Oral Glucose Tolerance test performed at 15 weeks of age: Glycemia measured after oral glucose tolerance
administration (D), representation of delta glycemia level (compared to glycemia measured at T0) (E), F-G- Insulin
sentitivity test: Glycemia measured after IP insulin administration (F), representation of delta glycemia level
(compared to glycemia measured at T0) (G). H- HOMA-IR (homeostasis model assesment of insulin resistance) index.
Fig A, B, C, D, E: �: pvalue<0.05, ��:pvalue<0.01, ���:pvalue<0.001: obtained using a post-hoc analysis to compare
HFD versus STD group in WT genotype after a three-way ANOVA with repeated measures on time factor ¤: pvalue
<0.05, ¤¤:pvalue<0.01, ¤¤¤:pvalue<0.001: obtained using a post-hoc analysis to compare HFD versus STD group in
KO genotype after a three-way ANOVA with repeated measures on time factor $: pvalue<0.05, $$:pvalue<0.01, $$$:
pvalue<0.001: obtained using a post-hoc analysis to compare WT versus KO group in HFD group after a three-way
ANOVA with repeated measures on time factor #: pvalue<0.05, ##:pvalue<0.01, ###:pvalue<0.001: obtained using a
post-hoc analysis to compare WT versus KO group in STD group after a three-way ANOVA with repeated measures
on time factor. Fig H: pvalues obtained using a two-way ANOVA analysis.
https://doi.org/10.1371/journal.pone.0234780.g004
PLOS ONE ABHD11 is involved in weight gain regulation
PLOS ONE | https://doi.org/10.1371/journal.pone.0234780 June 24, 2020 12 / 21
insulin. Statistical analyses were performed on delta glycemia levels revealing no diet effect,
whatever the genotype tested, except in the WT group 90 minutes after injection (p value
<0.05). ABHD11 KO mice are more responsive to an acute insulin administration than WT
mice. HOMA-IR index (homeostasis model assessment of insulin resistance) showed that
under HFD, KO mice have lower values than WT from week 16.
Taken together, these observations revealed that ABHD11 KO mice are resistant to obesity
induced by HFD and present normal blood parameters.
No difference in 2-AG levels measured in mouse tissue
Since ABHD11 can catalyze in vitro the hydrolysis of DAG to 2-AG, we further compared
endogenous 2-AG levels in tissues from KO and WT mice under standard diet conditions to
understand the mechanism of action of ABHD11. Firstly, no difference in 2-AG content was
observed in brain tissues such as cortex, hippocampus and olfactory bulbs (n = 3 animals/
genotype). 2-AG levels were then further measured in the cerebral cortex, liver, heart, gastroc-
nemius muscle, pancreas and in fat tissues in KO/WT female mice at the end of DIO study
(n = 6 or 7 animals/group). Similar to the standard diet, we globally could not report any sig-
nificant change in 2-AG levels across the tissues investigated (S9 Fig, in S1 Appendix). In addi-
tion, no difference in 2-AG level was found in mitochondria isolated from mouse liver.
Investigating the biological mechanism underlying weight gain resistance
of KO AHBHD11 mice—Omics analysis
Additional unbiased transcriptomic and metabolomic studies were conducted to further inves-
tigate biological mechanisms underlying the weight gain resistance of the KO mice. Mice
weight recording is reported in supplemental data (S8A Fig, in S1 Appendix).
Transcriptomic analysis of liver samples. Transcriptomic profiling was performed on
liver samples from a DIO animal cohort (S9 Fig, in S1 Appendix). Genotype and diet effects
on gene expression were analyzed by two way ANOVA (Fig 5 and S1 Table in S2 Appendix for
details). The liver transcriptomic pattern of KO vs WT under STD was first compared. Only
18 transcripts were found to be differentially regulated while noting that genes adjacent to
Abhd11 (Cldn3 and Stx1a) were dysregulated in KO under STD. The observed effect could be
attributed to the polar effect of Abhd11 deletion, but not due to mutation effect itself. Apart
from these genes, only CD36, a key enzyme involved in the uptake of fatty acids is upregulated
3 fold in KO under STD.
Then, the impact of diet on transcriptomic profile of WT mice was examined (WT under
HFD and WT under STD). 280 genes were significantly deregulated. As expected, WT mice
responded to HFD by activating PPARg, which ultimately induced the series of genes respon-
sible for FFA (free fatty acid) uptake, trafficking, TG synthesis by the 2-acylglycerol O-acyl-
transferase1 (Mogat1) pathway and transport (S10 Fig in S1 Appendix).
To understand the effect of HFD on ABHD11 mutation, the gene expression profile
between KO under HFD against KO under STD was compared. Interestingly, no difference in
the overall gene expression profile was observed. The genes described for fat phenotype (WT
under HFD) were carefully examined in KO under HFD. Genes responsible for fat phenotype
are expressed at similar level in KO mice under STD and in KO mice under HFD, indicating
that PPARg mediated FFA uptake and TG synthesis and transport pathways were not upregu-
lated in KO under HFD mice.
AskOmics analysis of integrated serum metabolomics and liver transcriptomics data.
S11 Fig in S1 Appendix specifies the data-driven model integrated in Askomics. Metabolomic
and transcriptomic data were linked using KEGG and Reactome databases. Fig 6 describes the
PLOS ONE ABHD11 is involved in weight gain regulation
PLOS ONE | https://doi.org/10.1371/journal.pone.0234780 June 24, 2020 13 / 21

filtering process on KO/WT under HFD data at Week 30. Before the last step, no threshold was
applied on fold changes. Considering only metabolomic data, 109 metabolites were found sig-
nificantly modulated. Among them, 31 were identified as varying significantly and were linked
to 5595 genes. Among them, 30 were linked to 265 genes that varied significantly themselves in
expression levels between the same groups. For 10 of these metabolites, the ANOVA highlighted
a significant genotype effect. Metabolites can be linked to genes varying because of diet or geno-
type. Filtering out genes varying exclusively because of diet, 154 genes remained, linked to the
same 10 metabolites. Finally, applying a fold change threshold of +/- 1.5 on these metabolites,
we kept eight of them. Corresponding metabolites and genes data are displayed in S2 Table in
S2 Appendix. Five of these eight metabolites are related to the bile acid metabolism.
Among them, cholate is a primary bile salt (fold change KO/WT = 2.3), taurocyamine is a
by-product of taurine which is involved in the conjugation of primary bile salts (fold change
Fig 5. Transcriptomic analysis of mice liver from DIO 2. A- Hierarchical clustering on differentially expressed genes
in liver samples from WTHFD vs WTSTD. Anova between WTHFD vs WTSTD yielded differential expression of 280
probes (genes/lincRNA having foldchange of ±2 with False Discovery Rate<0.05). B- number of genes/probes with
Fold change of above +2 or below -2 with FDR 0.05.
https://doi.org/10.1371/journal.pone.0234780.g005
Fig 6. Querying and filtering process to select the most significantly varying metabolites at week 30, between
ABHD11 KO and WT mice under HFD linked to genes varying themselves significantly. Values between brachets
correspond to fold change ratio (KO/WT).
https://doi.org/10.1371/journal.pone.0234780.g006
PLOS ONE ABHD11 is involved in weight gain regulation
PLOS ONE | https://doi.org/10.1371/journal.pone.0234780 June 24, 2020 14 / 21
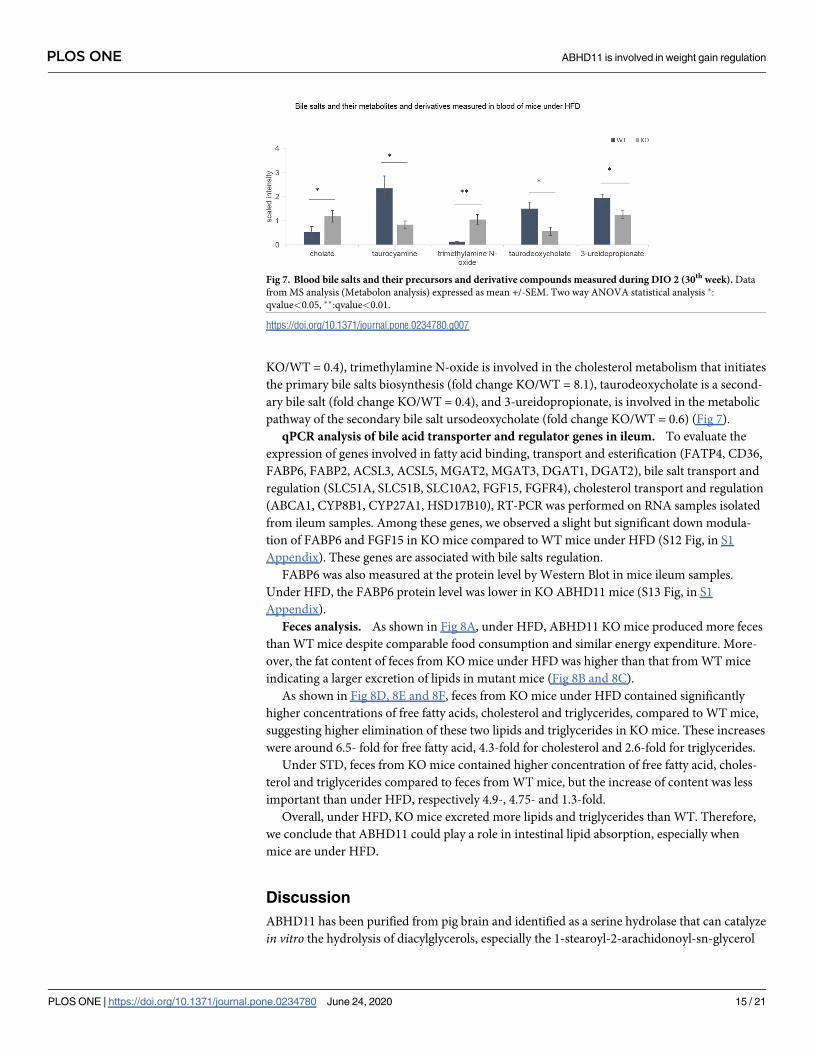
KO/WT = 0.4), trimethylamine N-oxide is involved in the cholesterol metabolism that initiates
the primary bile salts biosynthesis (fold change KO/WT = 8.1), taurodeoxycholate is a second-
ary bile salt (fold change KO/WT = 0.4), and 3-ureidopropionate, is involved in the metabolic
pathway of the secondary bile salt ursodeoxycholate (fold change KO/WT = 0.6) (Fig 7).
qPCR analysis of bile acid transporter and regulator genes in ileum. To evaluate the
expression of genes involved in fatty acid binding, transport and esterification (FATP4, CD36,
FABP6, FABP2, ACSL3, ACSL5, MGAT2, MGAT3, DGAT1, DGAT2), bile salt transport and
regulation (SLC51A, SLC51B, SLC10A2, FGF15, FGFR4), cholesterol transport and regulation
(ABCA1, CYP8B1, CYP27A1, HSD17B10), RT-PCR was performed on RNA samples isolated
from ileum samples. Among these genes, we observed a slight but significant down modula-
tion of FABP6 and FGF15 in KO mice compared to WT mice under HFD (S12 Fig, in S1
Appendix). These genes are associated with bile salts regulation.
FABP6 was also measured at the protein level by Western Blot in mice ileum samples.
Under HFD, the FABP6 protein level was lower in KO ABHD11 mice (S13 Fig, in S1
Appendix).
Feces analysis. As shown in Fig 8A, under HFD, ABHD11 KO mice produced more feces
than WT mice despite comparable food consumption and similar energy expenditure. More-
over, the fat content of feces from KO mice under HFD was higher than that from WT mice
indicating a larger excretion of lipids in mutant mice (Fig 8B and 8C).
As shown in Fig 8D, 8E and 8F, feces from KO mice under HFD contained significantly
higher concentrations of free fatty acids, cholesterol and triglycerides, compared to WT mice,
suggesting higher elimination of these two lipids and triglycerides in KO mice. These increases
were around 6.5- fold for free fatty acid, 4.3-fold for cholesterol and 2.6-fold for triglycerides.
Under STD, feces from KO mice contained higher concentration of free fatty acid, choles-
terol and triglycerides compared to feces from WT mice, but the increase of content was less
important than under HFD, respectively 4.9-, 4.75- and 1.3-fold.
Overall, under HFD, KO mice excreted more lipids and triglycerides than WT. Therefore,
we conclude that ABHD11 could play a role in intestinal lipid absorption, especially when
mice are under HFD.
Discussion
ABHD11 has been purified from pig brain and identified as a serine hydrolase that can catalyze
in vitro the hydrolysis of diacylglycerols, especially the 1-stearoyl-2-arachidonoyl-sn-glycerol
Fig 7. Blood bile salts and their precursors and derivative compounds measured during DIO 2 (30th week). Data
from MS analysis (Metabolon analysis) expressed as mean +/-SEM. Two way ANOVA statistical analysis �:
qvalue<0.05, ��:qvalue<0.01.
https://doi.org/10.1371/journal.pone.0234780.g007
PLOS ONE ABHD11 is involved in weight gain regulation
PLOS ONE | https://doi.org/10.1371/journal.pone.0234780 June 24, 2020 15 / 21

leading to the synthesis of the endocannabinoid, 2-AG, the most abundant endocannabinoid
in tissues [32]. This enzymatic activity was confirmed using purified recombinant human pro-
tein. This protein showed very similar biochemical properties to the microsomal 29 kDa DAG
lipase described by Farooqui et al., [15] and Rosenberger et al. [20], including the kinetic con-
stants of the enzyme towards the 1-stearoyl-2-arachidonoyl-sn-glycerol.
We confirmed that this alpha beta hydrolase domain-containing-protein is a serine hydro-
lase implicated in lipid metabolism, as shown by our in silico analysis of the primary sequence,
revealing the presence of a conserved lipase motif, GXSXG and the Ser, Asp, His catalytic
triad. This was also demonstrated in previous studies with heterologous expression of the
human ABHD11 in yeast cells [33], or by activity-based protein profiling with different fluoro-
phosphonates derivatives [29, 31, 34].
We have confirmed ABHD11s mitochondrial expression, both in different human cancer
cell lines, but also in mouse brain, as previously described by Lefort et al. [35] or Navia-Palda-
nius et al. [31].
Although different alternative pathways involving PIP2 phosphatase, phospholipase A1,
Lysophospholipase C [36] or DAG lipase like DDHD2 [37] may provide 2-AG, DAGLs-α and
- β are still considered as the most important enzyme for its biosynthesis. Similarly to both
DAGLs, ABHD11 is expressed in vertebrates (human, mouse) but also in other eukaryotes like
yeasts or protists [38]. It also shows different tissular and subcellular expression patterns [39],
[16], [40], suggesting different physiological roles.
We confirmed previous results obtained by Farooqui et al. [15] in bovine brain extracts that
a microsomal 29 kDa from pig brain can produce 2-AG ex vivo but we were not able to con-
firm this in vivo by measuring endogenous endocannabinoid levels in brain and in different
peripheral tissues from KO and WT mice in homeostatic conditions. A compensation mecha-
nism of 2-AG synthesis cannot be ruled out at this point by other lipases including MAGL. It
could also be related to our experimental set-up as some conditions are known to influence
endocannabinoid synthesis such as fasting for example. This would need further investiga-
tions. We do not also observe any functional impact on mitochondrial respiration. Some
Fig 8. Feces analysis during DIO3 experiment performed at 20th week for 24h. N = 26–27 mice per group. A- Feces
weight per mouse B, C- Lipids extracted from feces per mouse in percentage (B) in mg (C) D- Free fatty acid contained
in feces E- Triglycerides contained in feces F- Cholesterol contained in feces. Expressed as mean+/-SEM except graph
B expressed as median+/-MAD. Two-way Anova analysis were performed on raw data for graph A, rank transformed
data for graph B, log transformed data for graph C, D, E and F. �: pvalue<0.05, ��:pvalue<0.01, ���:pvalue<0.001: to
compare WT versus KO group in HFD or STD group after a two-way ANOVA analysis. $: pvalue<0.05, $$:
pvalue<0.01, $$$:pvalue<0.001: to compare HFD versus STD group in WT or KO genotype after a two-way ANOVA
analysis.
https://doi.org/10.1371/journal.pone.0234780.g008
PLOS ONE ABHD11 is involved in weight gain regulation
PLOS ONE | https://doi.org/10.1371/journal.pone.0234780 June 24, 2020 16 / 21
specific physiological conditions or stimulations may be necessary to produce 2-AG in mito-
chondria in vivo.
Interestingly, even though ABHD11 is expressed in most tissues and in mitochondria, an
organelle playing a key role in cell metabolism, KO ABHD11 mice are viable and present few
differences with their littermates even if they show some vision impairment, presumably asso-
ciated with embryonic development. In terms of body weight under standard diet, only a slight
difference is observed and this is exclusively seen in males.
We observed a strong resistance to weight gain of KO ABHD11 mice in DIO studies with
associated normal biochemical blood parameters. Transcriptomic analysis performed on
the mice livers confirm the absence of diet-induced obesity and metabolic deregulation in ani-
mals with deleted ABHD11 gene, suggesting a role of ABHD11 in lipid absorption in the gut.
The absence of a differential hepatic expression of genes involved in fatty acid uptake, as well
as triglyceride synthesis and transport pathways in ABHD11 KO mice under HFD, indicates
that lipids from the diet could be metabolized and/or eliminated before entering into the
circulation. Indeed, in mice under HFD, we were able to demonstrate that lipid elimination by
feces was more elevated in KO than WT mice, both due to increased fecal matter and lipid
content.
A slight decrease in the expression of FABP6 and FGF15 was measured in the ileum of KO
mice by RT PCR and by WB for FABP6. Even if this effect was weak and concerned few genes,
it could be a signature of a link between ABHD11 and regulation of bile acids. FABP6 is a pro-
tein expressed in the ileum able to bind bile acids and to transport fatty acids. It is involved in
the entero-hepatic circulation of conjugated bile acids [41] [42]. Primary bile acids are synthe-
tized from cholesterol in the liver, where they are conjugated with taurine or glycine, forming
bile salts [43]. After a meal, these bile salts are released into the gastrointestinal tract. Second-
ary bile salts result from bacterial action in the colon [44]. With the metabolome harvested
from the serum of KO mice, we have only an indirect overview of what can happen in the liver
and gut of these mice. However, the serum concentration of bile salts reflects 95% of the quan-
tity of these salts present in the intestinal lumen (5% are excreted) [45]. In the blood of KO
mice under the DIO study, we detected a modulation in primary and secondary bile salts or
precursors or derivatives thereof. The increased concentration of cholic salt, which is upstream
from other bile salts biosynthesis pathways, could result from an accumulation as it is trans-
formed to lesser degree in secondary bile salts. We can notice that the significant changes in
bile salt concentration observed in our data, could indicate fat absorption impairment in the
intestine. This regulation of bile salts in the intestine and its impact on fat elimination in the
feces could result from the ABHD11 depletion. It could be interesting to carry out an analysis
on the liver genes list that we have shown to be associated with these bile salts, precursors or
derivatives.
A putative intra-mitochondrial endocannabinoid system has been described [46, 47] with
some data, suggesting regulatory roles of endocannabinoids or 2-AG on mitochondria activity
[16, 40, 48, 49]. With the present data, we could not correlate the DAGL-like activity of
ABHD11 and its ability to synthesize 2-AG in vitro with the strong resistance of ABHD11 KO
animal to DIO. We have not demonstrated that the observed phenotype is associated with
enzymatic activity of ABHD11. Additional data would be necessary to link the in vitro pheno-
type to the in vivo phenotype, focusing on ileum tissues.
Taken together, these data demonstrate a strong role of ABHD11 in weight gain indepen-
dent from food intake, which likely occurs through impairment of gut lipid absorption. More
studies are required to further investigate mitochondrial ABHD11-modulated signaling and
metabolic pathways in intestinal tissues to confirm this hypothesis.
PLOS ONE ABHD11 is involved in weight gain regulation
PLOS ONE | https://doi.org/10.1371/journal.pone.0234780 June 24, 2020 17 / 21
Conclusion
Metabolomics data integrated with the transcriptomics data, show that the resistance of the
ABHD11 KO mice to weight gain could come from an impaired ability of the gut to absorb fat.
This deficiency would appear to be associated with a modulation of bile salts. Additional
experiments would be required to unravel the precise molecular and cellular roles of ABHD11
in weight regulation. The viability of the KO mice combined with their phenotype and molec-
ular features suggest that modulation of ABHD11 or of its signaling pathway could provide an
attractive avenue to engage into drug screening and develop new therapeutic agents for meta-
bolic disorders.
Supporting information
S1 Appendix.
(DOCX)
S2 Appendix.
(XLSX)
S3 Appendix.
(PDF)
Acknowledgments
We are grateful for the help of many investigators, cores, and lab personnel, including Aimo
Kannt and Andreas Herling for their advices in Diet induced Obesity studies, Pascal Paul, Kar-
ine Florin, Dorothee Tamarelle, Valerie Martin, Mathieu Boucher for their help in the statisti-
cal analysis, the histopathology department, the in vivo research support groups, the veterinary
services and the Global Transgenic Model & Technology group.
Author Contributions
Conceptualization: Johanna Escoubet, Veeranagouda Yaligara, Cecile Orsini, Michel Didier,
Jean-Claude Guillemot.
Data curation: Johanna Escoubet, Mireille Kenigsberg, Veeranagouda Yaligara, Helène de
Foucauld, Charles Bettembourg, Antoine Berthemy, Joel Capdevielle, Armelle Buzy, Jean-
Claude Guillemot.
Formal analysis: Veeranagouda Yaligara, Marie-Dominique Bock, Helène de Foucauld,
Charles Bettembourg, Antoine Berthemy, Joel Capdevielle, Pascale Chardenot, Jean-Claude
Guillemot.
Investigation: Johanna Escoubet, Mireille Kenigsberg, Murielle Derock, Veeranagouda Yali-
gara, Marie-Dominique Bock, Sandrine Roche, Florence Massey, Helène de Foucauld,
Charles Bettembourg, Antoine Berthemy, Joel Capdevielle, Richard Legoux, Eric Perret,
Armelle Buzy, Pascale Chardenot, Valerie Destelle, Sandrine Teixeira, Patrick Juvet, Pascal
Gauthier, Michael Leguet, Marie-Agnès Chatoux, Willy Deshayes, Margerie Clement.
Project administration: Pascal Gauthier, Laurence Rocheteau-Beaujouan, Mostafa Kabiri.
Resources: Aurelie Leroy, Christophe Cahours, Laurence Rocheteau-Beaujouan, Mostafa
Kabiri.
Supervision: Anne Olivier, Cecile Orsini, Vincent Mikol, Michel Didier, Jean-Claude
Guillemot.
PLOS ONE ABHD11 is involved in weight gain regulation
PLOS ONE | https://doi.org/10.1371/journal.pone.0234780 June 24, 2020 18 / 21
Validation: Michel Didier.
Writing – original draft: Johanna Escoubet, Mireille Kenigsberg, Veeranagouda Yaligara,
Marie-Dominique Bock, Helène de Foucauld, Charles Bettembourg, Antoine Berthemy,
Armelle Buzy, Sandrine Teixeira, Mostafa Kabiri, Jean-Claude Guillemot.
Writing – review & editing: Johanna Escoubet, Helène de Foucauld, Cecile Orsini, Vincent
Mikol, Michel Didier, Jean-Claude Guillemot.
References
1. Organization, W.H. Obesity and overweight fact sheet. 06 Nov 2019]; Available from: https://www.who.
int/en/news-room/fact-sheets/detail/obesity-and-overweight.
2. Smith K.B. and Smith M.S., Obesity Statistics. Prim Care, 2016. 43(1): p. 121–35, ix. https://doi.org/10.
1016/j.pop.2015.10.001 PMID: 26896205
3. Montan P.D., et al., Pharmacologic therapy of obesity: mechanisms of action and cardiometabolic
effects. Annals of Translational Medicine, 2019. 7(16).
4. Pagotto U., et al., The Emerging Role of the Endocannabinoid System in Endocrine Regulation and
Energy Balance. Endocrine Reviews, 2006. 27(1): p. 73–100. https://doi.org/10.1210/er.2005-0009
PMID: 16306385
5. Silvestri C. and Di Marzo V., The Endocannabinoid System in Energy Homeostasis and the Etiopathol-
ogy of Metabolic Disorders. Cell Metabolism, 2013. 17(4): p. 475–490. https://doi.org/10.1016/j.cmet.
2013.03.001 PMID: 23562074
6. Pertwee R.G., Cannabinoids and the gastrointestinal tract. Gut, 2001. 48(6): p. 859. https://doi.org/10.
1136/gut.48.6.859 PMID: 11358910
7. Massa F., Storr M., and Lutz B., The endocannabinoid system in the physiology and pathophysiology of
the gastrointestinal tract. Journal of Molecular Medicine, 2005. 83(12): p. 944–954. https://doi.org/10.
1007/s00109-005-0698-5 PMID: 16133420
8. Christensen R., et al., Efficacy and safety of the weight-loss drug rimonabant: a meta-analysis of rando-
mised trials. The Lancet, 2007. 370(9600): p. 1706–1713.
9. Mechoulam R., Identification of an endogenous 2-monoglyceride, present in canine gut, that binds to
cannabinoid receptors. Biochemical Pharmacology, 1995. 50(1): p. 83–90. https://doi.org/10.1016/
0006-2952(95)00109-d PMID: 7605349
10. Silvestri C. and Di Marzo V., Second generation CB1 receptor blockers and other inhibitors of peripheral
endocannabinoid overactivity and the rationale of their use against metabolic disorders. Expert Opinion
on Investigational Drugs, 2012. 21(9): p. 1309–1322. https://doi.org/10.1517/13543784.2012.704019
PMID: 22780328
11. Bisogno T., et al., Brain Regional Distribution of Endocannabinoids: Implications for Their Biosynthesis
and Biological Function. Biochemical and Biophysical Research Communications, 1999. 256(2): p.
377–380. https://doi.org/10.1006/bbrc.1999.0254 PMID: 10079192
12. Mechoulam R., Cannabinoids as therapeutics. Milestones in drug therapy, ed. Michael J J.B. Parnham.
2005: Birkhauser.
13. Dinh T.P., et al., Brain monoglyceride lipase participating in endocannabinoid inactivation. Proceedings
of the National Academy of Sciences of the United States of America, 2002. 99(16): p. 10819–10824.
https://doi.org/10.1073/pnas.152334899 PMID: 12136125
14. Di Marzo V. and Despres J.-P., CB1 antagonists for obesity—what lessons have we learned from rimo-
nabant? Nature Reviews Endocrinology, 2009. 5(11): p. 633–638. https://doi.org/10.1038/nrendo.
2009.197 PMID: 19844251
15. FAROOQUI A.A., RAMMOHAN K.W., and HORROCKS L.A., Isolation, Characterization, and Regula-
tion of Diacylglycerol Lipases from the Bovine Braina. Annals of the New York Academy of Sciences,
1989. 559(1): p. 25–36.
16. Bisogno T., et al., Cloning of the first sn1-DAG lipases points to the spatial and temporal regulation of
endocannabinoid signaling in the brain. J Cell Biol, 2003. 163(3): p. 463–8. https://doi.org/10.1083/jcb.
200305129 PMID: 14610053
17. Sutherland C.A. and Amin D., Relative activities of rat and dog platelet phospholipase A2 and diglycer-
ide lipase. Selective inhibition of diglyceride lipase by RHC 80267. J Biol Chem, 1982. 257(23): p.
14006–10. PMID: 7142192
PLOS ONE ABHD11 is involved in weight gain regulation
PLOS ONE | https://doi.org/10.1371/journal.pone.0234780 June 24, 2020 19 / 21
18. Lee M.W., Kraemer F.B., and Severson D.L., Characterization of a partially purified diacylglycerol lipase
from bovine aorta. Biochim Biophys Acta, 1995. 1254(3): p. 311–8. https://doi.org/10.1016/0005-2760
(94)00193-3 PMID: 7857971
19. Bisogno T., et al., A novel fluorophosphonate inhibitor of the biosynthesis of the endocannabinoid 2-ara-
chidonoylglycerol with potential anti-obesity effects. British Journal of Pharmacology, 2013. 169(4): p.
784–793. https://doi.org/10.1111/bph.12013 PMID: 23072382
20. Rosenberger T., Farooqui A., and Horrocks L., Bovine Brain Diacylglycerol Lipase: Substrate Specificity
and Activation by Cyclic AMP-dependent Protein Kinase. Lipids, 2007. 42: p. 187–95. https://doi.org/
10.1007/s11745-007-3019-7 PMID: 17393225
21. Schubert C., The genomic basis of the Williams-Beuren syndrome. Cell Mol Life Sci, 2009. 66(7): p.
1178–97. https://doi.org/10.1007/s00018-008-8401-y PMID: 19039520
22. Palacios-Verdu M.G., et al., Metabolic abnormalities in Williams-Beuren syndrome. J Med Genet, 2015.
52(4): p. 248–55. https://doi.org/10.1136/jmedgenet-2014-102713 PMID: 25663682
23. Kaplan A.S., et al., Body composition, energy expenditure, and energy intake in patients with Williams
syndrome. J Pediatr, 1998. 132(2): p. 223–7. https://doi.org/10.1016/s0022-3476(98)70435-4 PMID:
9506631
24. Thomas A., et al., Quantitative and qualitative profiling of endocannabinoids in human plasma using a
triple quadrupole linear ion trap mass spectrometer with liquid chromatography. Rapid Communications
in Mass Spectrometry, 2009. 23(5): p. 629–638. https://doi.org/10.1002/rcm.3918 PMID: 19170046
25. Rimmerman N., et al., Compartmentalization of endocannabinoids into lipid rafts in a dorsal root gan-
glion cell line. British Journal of Pharmacology, 2008. 153(2): p. 380–389. https://doi.org/10.1038/sj.
bjp.0707561 PMID: 17965731
26. Sims N.R. and Anderson M.F., Isolation of mitochondria from rat brain using Percoll density gradient
centrifugation. Nat Protoc, 2008. 3(7): p. 1228–39. https://doi.org/10.1038/nprot.2008.105 PMID:
18600228
27. Garnier X., et al., AskOmics, a web tool to integrate and query biological data using semantic web tech-
nologies, in JOBIM 2017—Journees Ouvertes en Biologie, Informatique et Mathematiques. 2017: Lille,
France. p. 1.
28. Belleau F., et al., Bio2RDF: towards a mashup to build bioinformatics knowledge systems. J Biomed
Inform, 2008. 41(5): p. 706–16. https://doi.org/10.1016/j.jbi.2008.03.004 PMID: 18472304
29. Bachovchin D.A., et al., Superfamily-wide portrait of serine hydrolase inhibition achieved by library-ver-
sus-library screening. Proc Natl Acad Sci U S A, 2010. 107(49): p. 20941–6. https://doi.org/10.1073/
pnas.1011663107 PMID: 21084632
30. Adibekian A., et al., Click-generated triazole ureas as ultrapotent in vivo-active serine hydrolase inhibi-
tors. Nat Chem Biol, 2011. 7(7): p. 469–78. https://doi.org/10.1038/nchembio.579 PMID: 21572424
31. Navia-Paldanius D., et al., Chemoproteomic, biochemical and pharmacological approaches in the dis-
covery of inhibitors targeting human alpha/beta-hydrolase domain containing 11 (ABHD11). Eur J
Pharm Sci, 2016. 93: p. 253–63. https://doi.org/10.1016/j.ejps.2016.08.031 PMID: 27544863
32. Sugiura T., et al., 2-Arachidonoylglycerol: a possible endogenous cannabinoid receptor ligand in brain.
Biochem Biophys Res Commun, 1995. 215(1): p. 89–97. https://doi.org/10.1006/bbrc.1995.2437
PMID: 7575630
33. Arya M., Srinivasan M., and Rajasekharan R., Human alpha beta hydrolase domain containing protein
11 and its yeast homolog are lipid hydrolases. Biochemical and Biophysical Research Communications,
2017. 487(4): p. 875–880. https://doi.org/10.1016/j.bbrc.2017.04.145 PMID: 28465236
34. Wiedl T., et al., Activity-based proteomics: identification of ABHD11 and ESD activities as potential bio-
markers for human lung adenocarcinoma. J Proteomics, 2011. 74(10): p. 1884–94. https://doi.org/10.
1016/j.jprot.2011.04.030 PMID: 21596165
35. Lefort N., et al., Proteome Profile of Functional Mitochondria from Human Skeletal Muscle Using One-
Dimensional Gel Electrophoresis and HPLC-ESI-MS/MS. Journal of proteomics, 2009. 72: p. 1046–60.
https://doi.org/10.1016/j.jprot.2009.06.011 PMID: 19567276
36. Ueda N., et al., Biosynthesis and degradation of the endocannabinoid 2-arachidonoylglycerol. Biofac-
tors, 2011. 37(1): p. 1–7. https://doi.org/10.1002/biof.131 PMID: 21328621
37. Araki M., et al., Enzymatic characterization of recombinant rat DDHD2: a soluble diacylglycerol lipase. J
Biochem, 2016. 160(5): p. 269–279. https://doi.org/10.1093/jb/mvw034 PMID: 27198176
38. McPartland J.M., et al., Evolutionary origins of the endocannabinoid system. Gene, 2006. 370: p. 64–
74. https://doi.org/10.1016/j.gene.2005.11.004 PMID: 16434153
39. Suarez J., et al., Distribution of diacylglycerol lipase alpha, an endocannabinoid synthesizing enzyme,
in the rat forebrain. Neuroscience, 2011. 192: p. 112–31. https://doi.org/10.1016/j.neuroscience.2011.
06.062 PMID: 21756982
PLOS ONE ABHD11 is involved in weight gain regulation
PLOS ONE | https://doi.org/10.1371/journal.pone.0234780 June 24, 2020 20 / 21
40. Reisenberg M., et al., The diacylglycerol lipases: structure, regulation and roles in and beyond endocan-
nabinoid signalling. Philos Trans R Soc Lond B Biol Sci, 2012. 367(1607): p. 3264–75. https://doi.org/
10.1098/rstb.2011.0387 PMID: 23108545
41. Pircher P.C., et al., Farnesoid X receptor regulates bile acid-amino acid conjugation. J Biol Chem, 2003.
278(30): p. 27703–11. https://doi.org/10.1074/jbc.M302128200 PMID: 12754200
42. Grober J., et al., Identification of a bile acid-responsive element in the human ileal bile acid-binding pro-
tein gene. Involvement of the farnesoid X receptor/9-cis-retinoic acid receptor heterodimer. J Biol
Chem, 1999. 274(42): p. 29749–54. https://doi.org/10.1074/jbc.274.42.29749 PMID: 10514450
43. Hofmann A.F., Hagey L.R., and Krasowski M.D., Bile salts of vertebrates: structural variation and possi-
ble evolutionary significance. J Lipid Res, 2010. 51(2): p. 226–46. https://doi.org/10.1194/jlr.R000042
PMID: 19638645
44. Qi Y., et al., Bile acid signaling in lipid metabolism: metabolomic and lipidomic analysis of lipid and bile
acid markers linked to anti-obesity and anti-diabetes in mice. Biochim Biophys Acta, 2015. 1851(1): p.
19–29. https://doi.org/10.1016/j.bbalip.2014.04.008 PMID: 24796972
45. Martinez-Augustin O. and Sanchez de Medina F., Intestinal bile acid physiology and pathophysiology.
World J Gastroenterol, 2008. 14(37): p. 5630–40. https://doi.org/10.3748/wjg.14.5630 PMID:
18837078
46. Cravatt B.F., et al., Molecular characterization of an enzyme that degrades neuromodulatory fatty-acid
amides. Nature, 1996. 384(6604): p. 83–7. https://doi.org/10.1038/384083a0 PMID: 8900284
47. Benard G., et al., Mitochondrial CB(1) receptors regulate neuronal energy metabolism. Nat Neurosci,
2012. 15(4): p. 558–64. https://doi.org/10.1038/nn.3053 PMID: 22388959
48. Siegmund S.V., et al., The endocannabinoid 2-arachidonoyl glycerol induces death of hepatic stellate
cells via mitochondrial reactive oxygen species. FASEB J, 2007. 21(11): p. 2798–806. https://doi.org/
10.1096/fj.06-7717com PMID: 17440119
49. Catanzaro G., et al., Anandamide increases swelling and reduces calcium sensitivity of mitochondria.
Biochem Biophys Res Commun, 2009. 388(2): p. 439–42. https://doi.org/10.1016/j.bbrc.2009.08.037
PMID: 19679102
PLOS ONE ABHD11 is involved in weight gain regulation
PLOS ONE | https://doi.org/10.1371/journal.pone.0234780 June 24, 2020 21 / 21