aboriginal education - csls
TRANSCRIPT

Aboriginal Education:Strengthening the Foundations
John RichardsSimon Fraser University
andC.D. Howe Institute

2
Aboriginals are a major component of “multicultural” Canada– especially in western Canada where they comprise nearlyone in seven of the next generation (under age 14 in 2006).

3
Notes:1. Provincial Aboriginal student share is about 80% = 40% (share of on-reserve
children in provincial schools) x 30% (on-reserve share of total Aboriginalpopulation) + 70% (off-reserve share). Remainder attend 500 on-reserve schools.
2. The Census underestimates the NA Indian / First Nation identity population due toincomplete reserve enumeration. Statistics Canada subsequently revises results.Which has not yet been done for the 2006 census. Here, 2006 data have beenrevised by extrapolating the 1996-2001 Indian/FN growth rate from StatisticsCanada revised data, and assuming the difference (86,700) between this estimateand recorded Census Indian/FN population resides on-reserve.

4
Some face serious problems; most face aspects of discrimination.To succeed economically, they need better education outcomes.On-reserve education is in crisis; off-reserve outcomes are better,but that is to damn with faint praise.

5
Those registered Indian /First Nation who want to
live on-reserve should beable to do so; …
… those who want to joinmainstream Canadashould also be able to doso. Without high school,there is no effectivechoice.

6
Métis are faring betterthan Indian / First Nation,but …
… given the extent ofeducation investment by
younger Canadians,Aboriginal / non-Aboriginal
education gaps have widenedamong all Aboriginal groups.

7
Improving Aboriginal education is the most important socialpolicy challenge facing Canadians. It is not an easychallenge, but there are important success stories acrossCanada to celebrate and learn from.

8
Decomposition of the Aboriginal / non-Aboriginal Wage Gap
Using Estimated Effect of Using Estimated Effect of
Characteristics on Characteristics on
Aboriginal Wages non-Aboriginal Wages
(percent)
Charactristics
1 Education 30.5 28.4
2 Full-time employment 19.9 24.4
3 Residing in a census metropolitan area 9.9 6.6
4 Province of residence 9.5 0.7
5 Experience in labour force * 9.1 7.3
6 Married 5.2 3.8
7 Knowledge of an official language -0.4 -0.9
8 Gap explained by characteristics (sum 1. to 7.) 83.6 70.2
9 Gap unexplained (10.-8.) ** 16.4 29.8
10 Total wage gap *** 100 100
Notes
* Experience is measured as age minus (years of education + 5)
** The unexplained gap is a combination of discrimination and the impact of unobserved characteristics
*** After adjusting for hours worked per year, the average Aboriginal wage is 70 percent of the average non-Aboriginal wage.
After adjusting for the lower average hours worked by Aboriginalsrelative to non-Aboriginals, the average Aboriginal wage is 70percent of the non-Aboriginal. In explaining the 30 percentage pointgap, the most important characteristic is education.
Sharpe, A., Arsenault, J.F. & Lapointe, S. (2008). The Potential Contribution ofAboriginal Canadians to Productivity and Output Growth in Canada: Anupdate to 2006-2026. Ottawa: CSLS.

9
Interprovincial differences, evidence from PISA …

10
C a n a d a r a n k e d 3 r d o n o v e r a l l a v e r a g e , m u c h l o w e r a t 1 0 t h p e r c e n t i l e
Note: significant declines in Prairies and in Quebec.
Canada’s average science performance in 2006 ranked 3rdoverall; its performance in the bottom “tail” was much weaker.

11Aboriginal students drop out in secondary school, but …

12their academic problems accumulate from primary grades …

13Richards, Hove, Afolabi. “Understanding the Aboriginal / Non-AboriginalGap in Student Performance.” available at http://www.cdhowe.org
and often become more serious in higher grades (grade 7 gapsexceed grade 4 gaps).

14
Analogous gaps exist among historically marginalized UScommunities: American Indian, Hispanic, Black

15
NAEP 2008 Trends in Academic Progress, p.15
Americans have tracked education gaps more diligently, and farlonger, than have Canadians.

16
Why do students drop out?

17
Ideally, a country – or province’s – gradient has a “high”median value and a “shallow slope”

18
Significant differences exist across provinces

19
Aboriginal and non-Aboriginal gradients display similar slope,but different means and more dispersion

20
Top five …
… bottom five
Richards, Hove, Afolabi. 2008. “Understanding the Aboriginal / non-Aboriginal Gap in StudentPerformance.” http://www.cdhowe.org
Analysis of gap in Aboriginal / non-Aboriginal studentperformance in 366 BC schools, by school district

21
Socio-economic differences explain a fifth of the FSAAboriginal/non-Aboriginal gap at the school level; negativepeer effects of Aboriginal student concentration explain nearlyhalf; positive – and negative – district level initiatives matter.

22
Regressionresults

23
Table B4.1: On-Reserve School Enrolment Size, 2008/09
Enrolment (# of Student s )
# of
Schools
% of
Schools
# of
Students
% of
Students
over 1 ,000 1 0 . 2 % 1,113 1 . 6 %
500-1,000 1 1 2 . 2 % 8,887 12 .7%
300-499 4 6 9 . 0 % 17,990 25 .7%
200-299 6 4 12 .5% 15,804 22 .6%
100-199 1 0 7 21 .0% 16,004 22 .9%
50-99 8 2 16 .1% 5,847 8 . 4 %
less than 50 1 9 9 39 .0% 4,248 6 . 1 %
Total 5 1 0 100.0% 69,893 100.0%
% of schools with <500 students 97 .6%
% of students attending
schools with <500 students 85 .7%
% of schools with < 100 students 55 .1%
% of students attending
schools with <100 students 14 .4%
On-reserve schools face very serious administrativeproblems. Most are “stand alone,” without the benefits ofdistrict-level services; most are very small; most have highpercentages of “special needs” students …
24
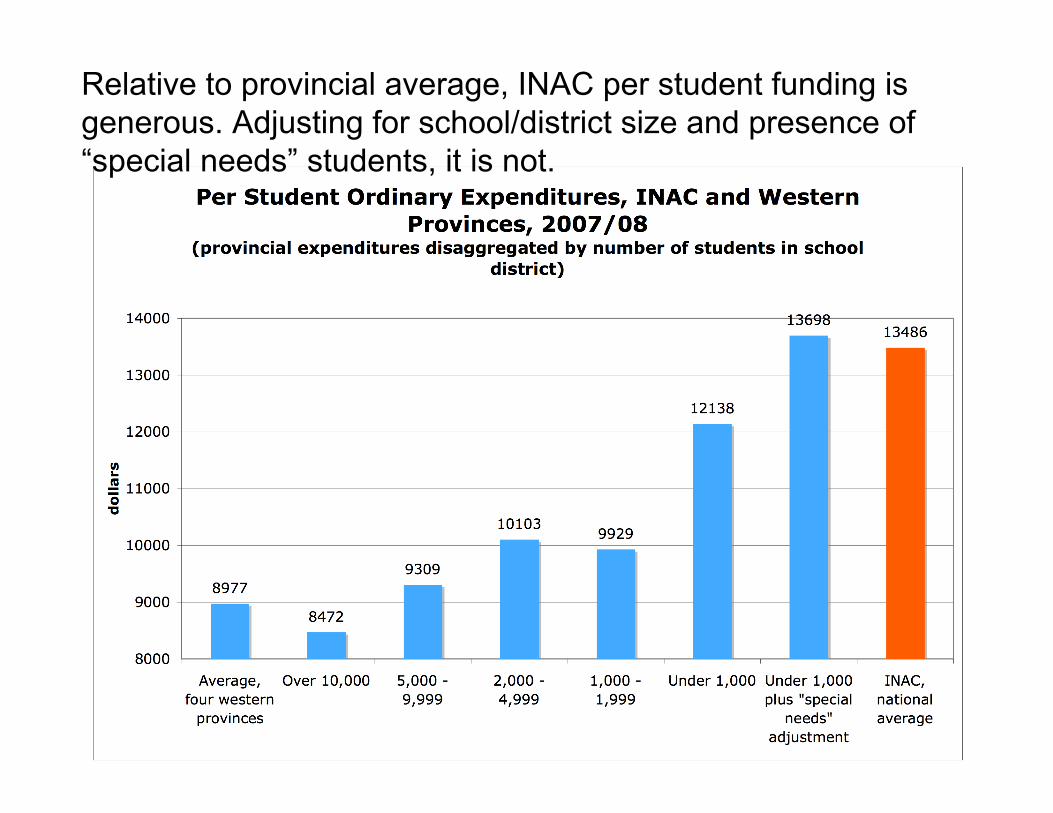
Relative to provincial average, INAC per student funding isgenerous. Adjusting for school/district size and presence of“special needs” students, it is not.

25
An Agenda for Aboriginal Education

26
An Agenda for Aboriginal Education(continued)

27
An Agenda for Aboriginal Education(continued)

28
An Agenda forAboriginal Education
(continued)

29
An Agenda for Aboriginal Education(concluded)

30
If Saskatchewan achieved BC’s female non-Aboriginaldropout rate …I. Saskatchewan Residents with Incomplete Secondary School, Ages 25-34,
by Racial Identity and Sex, 2006
Male Female Total Total
(percent)
Non-Aboriginal 6,525 4,300 10,825 61.4
Aboriginal
Indian / First Nation 2,640 2,535 5,175 29.3
Métis 870 765 1,635 9.3
Total 10,035 7,600 17,635 100.0
Total (percent) 56.9 43.1 100.0
II.Hypothetical Saskatchewan Residents with Incomplete Secondary School, Ages 25-34,
by Racial Identity and Sex, 2006 *
Male Female Total Total
(percent)
Non-Aboriginal 3,162 3,273 6,435 83.0
Aboriginal
Indian / First Nation 380 468 848 10.9
Métis 219 253 472 6.1
Total 3,761 3,994 7,756 100.0
Total (percent) 48.5 51.5 100.0
* Calculations assume 6.9%, BC non-Aboriginal female rate for incomplete secondary studies, ages 25-34.
III. Potential Beneficiaries: Additional High School Graduates, by Racial Identity and Sex **
Male Female Total Total
(percent)
Non-Aboriginal 3,363 1,027 4,390 44.4
Aboriginal
Indian / First Nation 2,260 2,067 4,327 43.8
Métis 651 512 1,163 11.8
Total 6,274 3,606 9,879 100.0
Total (percent) 63.5 36.5 100.0
** Differences between cell values in panels I and II.