about the project - national food security...
TRANSCRIPT


About the ProjectThe need for monitoring and analysis of emerging food scenarios is important for India both because ofsignificant dependence of output on the monsoon rains and the fact that globally India is one of the majorconsumers of food crops influencing markets. Management of agriculture from a public policy perspectiverequires organisation of this information and analysis as inputs to policy making.
Against this backdrop the National Food Security Mission (NFSM), Ministry of Agriculture, commissioned a3–Year study to National Council of Applied Economic Research (NCAER) in 2011–12 to bridge thisimportant gap in analytical inputs for understanding the emerging agricultural scenarios both in the short-termof one or two quarters and also in the medium to longer term.
Accordingly, the agricultural outlook and situation analysis undertaken in this study refers to the main cropbased food items: cereals (specifically rice, wheat, jowar, bajra, maize and overall coarse grains), pulses (gram,tur), selected fruits and vegetables (banana, potato, onion), sugarcane and edible oils (groundnut, rapeseed/mustard, soybean). In addition the analysis also covers milk, one livestock product.
The three main outputs of the proposed work are:
(1) A Quarterly Agricultural Outlook Report that integrates the assessment of key indicators relating toagriculture with a focus on food sectors. The reports will include assessment of the current situation oninputs, output and market conditions and also forecasts of key indicators for the full year based on modelsdeveloped for the purpose.
(2) A Semi-annual Agricultural Outlook Report which provides a longer term perspective for the food sector.These reports will present an analysis of alternative scenarios of output and consumption for the food cropstaking into account the available information and based on the suitable economic models that permitlonger term projections.
(3) Monthly briefings on the prevailing agricultural conditions.
ImplementationNCAER has set up a study team to carry out the study.
An advisory committee has been formed to provide broad guidance to the implementation of the study. TheCommittee comprises of Dr Shekhar Shah, DG, NCAER as Chair, Dr Ashok Gulati, Chairman, Commissionon Agricultural Costs and Prices, Prof. Ramesh Chand, Director, National Centre for Agricultural Policy(NCAP), New Delhi and Prof. Mahendra Dev, Director, Indira Gandhi Institute for Development Research(IGIDR), Mumbai. Representative from FAO and DFID are Special Invitees to the Committee meetings.
A Technical Support Group comprising of key officers from different departments of the government andexperts has also been formed to interact with the study team to improve the work under the study.

Agricultural Outlook and Situation Analysis Reports

AGRICULTURAL OUTLOOK AND SITUATION ANALYSIS REPORTS
ii

Agricultural Outlook and Situation Analysis Reports
Quarterly Agricultural Outlook ReportOctober–December 2013
Under the Project Sponsored by The National Food Security MissionMinistry of Agriculture
March, 2014
Prepared by
National Council of Applied Economic Research11, I.P. Estate, New Delhi 110 002agrioutlookindia.ncaer.org

AGRICULTURAL OUTLOOK AND SITUATION ANALYSIS REPORTS
iv


AGRICULTURAL OUTLOOK AND SITUATION ANALYSIS REPORTS
vi


AGRICULTURAL OUTLOOK AND SITUATION ANALYSIS REPORTS
viii

The advance estimates of national accounts project overall growth of GDP at 4.9 per centin 2013–14, higher than the 4.5 per cent growth estimated in the previous year. Whileoverall economic growth remained low in agriculture and allied sectors registered a sharpimprovement in output. Favourable monsoon rainfall helped to improve agriculturalsector’s production prospects. Although excess rainfall towards the end of monsoon periodin some of the eastern and central India led to crop damage, the late rains helped improveprospects of the rabi crops with reported increases in sown area of the rabi crops. In fact,nearly all the estimated increase in foodgrain output in 2013–14, as per the 2nd AdvanceEstimates (AE) of the Ministry of Agriculture is in the rabi season.
The report also provides an assessment based on rainfall data and trend growth in outputof food commodities. As the official estimates are still subject to further revisions based onthe new data, we have provided these estimates for a comparison as the model basedestimates are valuable when they are obtained before the final estimates are available. As aresult of higher crop production, the year also saw deceleration in overall inflation rate andfood inflation especially towards the end of 2013. International market prices haveremained stable and lower in 2013 as compared to the previous year in a number ofcommodities. Although lower prices reflect adequate supplies to meet the globalrequirements at the present levels of consumption, they also point to the need for morecompetitive production of commodities to benefit from export demand. The exchange ratedepreciation provided some cushion to exports, but they also raise the cost of importedinputs and food commodities such as edible oils. Some of the production estimates aresummarised below:
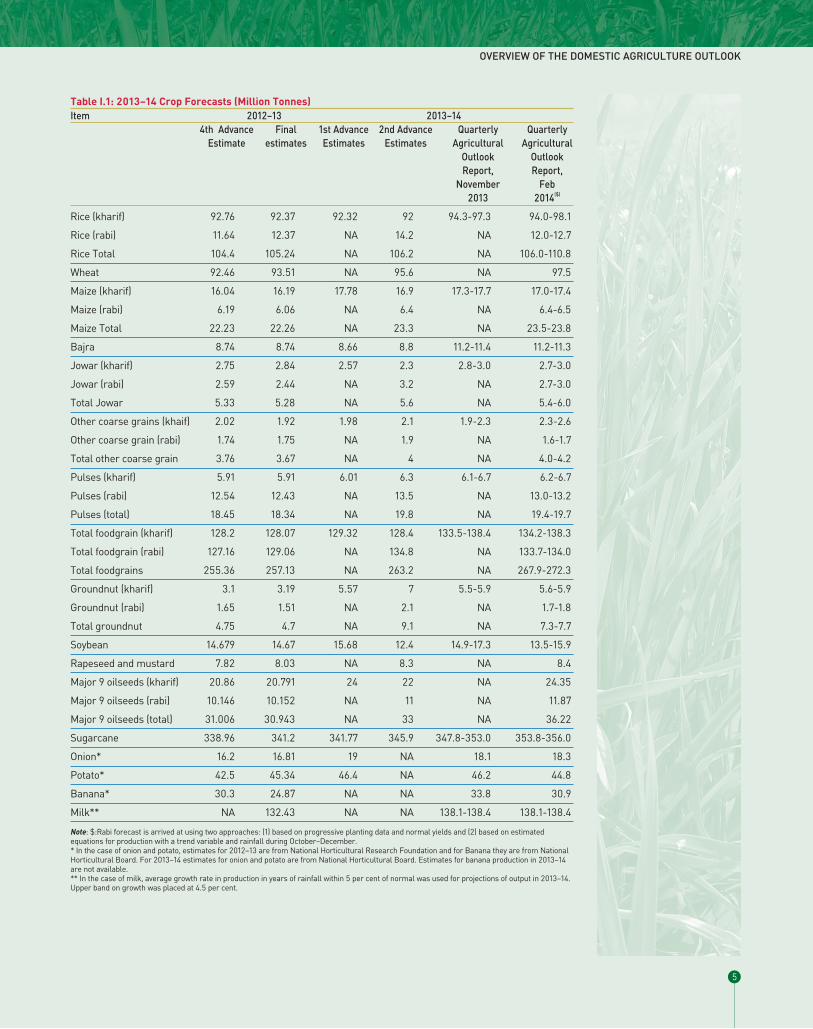
� The 2nd AE of agricultural production for 2013–14 have raised the output estimatesof foodgrains to 263.2 million tonnes from the final estimates of 257.1 million tonnesin 2012–13. The estimates based on trend and rainfall provide higher estimate of267–272 million tonnes of foodgrain production. The main difference in the twoestimates is in the case of kharif rice and bajra production. The final estimates are likelyto be between the lower end of this range and the 2nd AE.
� Production of rice is placed at 106.2 million tonnes by the 2nd AE, marginal increaseover 105.2 million tonnes in the previous year. In the case of wheat, the 2nd AE placeproduction at 95.6 million tonnes, about 2 million tonnes more than the harvest in2012–13. Our estimates are for a production of 97.5 million tonnes. As per the 2ndAE, production of coarse grains in 2013–14 is estimated at 41.6 million tonnes, upfrom about 40 million tonnes in the previous year. Our assessment is higher at44.1–44.5 million tonnes mainly because of higher production estimate of bajra.
� Pulses production is estimated by the 2nd AE at 19.8 million tonnes, close to ourassessment of 19.4–19.7 million tonnes.
� Among the major oilseeds, production of groundnut is projected by the 2nd AE at 9.1million tonnes, up from a low 4.7 million tonnes in the previous year. In the case ofsoybean, the 2nd AE of production, the 2013–14 output is about 2 million tonnes
Highlights
ix

lower than the revised estimate of 14.67 million tonnes in the previous year. Therapeseed and mustard production is projected to be maintained at about 8 milliontonnes. The overall production of nine major oilseeds is projected at 33 million tonnes,up from 30.9 million tonnes in the previous year. The estimates based on rainfall andtrend data indicate production of the nine major oilseeds at 36.22 million tonnes.While the two estimates are close in the case of rapeseed and mustard, the differencesare greater in the other cases. The main difference is in the case of kharif oilseeds.
� Sugarcane production is 345.9 million tonnes, up from 341.77 million tonnes in theprevious year. The estimates based on trend and rainfall place production in 2013–14at 353.8–356 million tonnes.
� The output of onion in 2013–14 is estimated to have increased to 18–19 milliontonnes, up from 16.8 million tonnes in the previous year. Potato production isestimated at 44.8–46.4 million tonnes, marginally higher than the production estimatefor the previous year. In the case of milk, production is estimated to increase by 4.3–4.5per cent in 2013–14 over the 132.43 million tonnes production in the previous year.
The price scenario during the year has generally reflected production conditions. The year-on-year increase in the Wholesale Price Index (WPI) for food articles dropped from closeto 19 per cent between August and November 2013 to below 14 per cent in December2013 as the impact of kharif harvest began to have an impact on prices. In the case ofonion, the price rise dropped from the height of triple digit annual rates to double digitrate by December 2013 and further to 8.8 per cent in January 2014. A key feature of theoverall price scenario is the stable prices of food commodities in the international markets.The FAO Food Price Index has shown negative year-on-year changes throughout 2013 asglobal production recovered from the drought effects of the previous year. Short-termprojections of the food price scenario indicates that year-on-year food inflation, based onWPI, may remain at 6–7 per cent in the next 2–3 months.
Using the data from FAO and also consumption expenditure surveys of the NationalSample Survey Organisation, the present report also draws attention to the trends in foodconsumption. While there is a trend increase in the per capita consumption of calories andfats improvement in the consumption of proteins has been marginal over the years. Morestriking is the change in terms of sources of nutrition: per capita consumption of livestockproducts is rising and becoming a growing source of calories and proteins relative tovegetable sources. The trends are similar in rural and urban areas. The changing trendsreflect changing consumer preferences and also availability of food commodities.
AGRICULTURAL OUTLOOK AND SITUATION ANALYSIS REPORTS
x

The study team wishes to acknowledge the support of Mr Ashish Baahuguna, Secretary,Department of Agriculture and Cooperation, to our work. He has encouraged the studyteam to improve the contents of these reports throughout the course of this study. Dr J.S.Sandhu, Agriculture Commissioner and Mr S. Lohiya, Joint Secretary (Crops), haveprovided guidance in the conduct of the study. A number of officials in the agricultureministry have participated in the meetings and other interactions held in the context of thepresent study and contributed to our understanding of the issues related to theperformance of the sector.
Reports of FAO, OECD, USDA, ABARES, IGC, and a number of other agencies havebeen referred in this report. We acknowledge the information and insights that have beenvaluable to us in the preparation of this report.
The advisory committee for the report and the technical support group have providedinputs during the course of this project on Agricultural Outlook and Situation AnalysisReports commissioned by the National Food Security Mission.
We are grateful to the experts who have contributed to our understanding of issues relatingto different aspects of the food sector. We have listed at the end of this report thepresentations that were made by these experts during the period of October 2013–March2014.
Acknowledgements
xi
Study Team
Shashanka Bhide (Project Leader), A. Govindan, Saurabh Bandyopadhyay,Mondira Bhattacharya, Laxmi Joshi, S.K. Mondal, V.P. Ahuja, Amar Singh, PalashBarua, Charu Jain, Himani Gupta, Praveen Sachdeva, Prem Mohan Srivastava,Rahul Thakur and Abjitej Kodali. J.S. Punia has coordinated production of thisreport.

AGRICULTURAL OUTLOOK AND SITUATION ANALYSIS REPORTS
xii

Preface . . . . . . . . . . . . . . . . . . . . . . . . . . . . . . . . . . . . . . . . . . . . . . . . . . . . . . . . . . . . . . . . . . . . . . . . . . . . . . . . . . . . . . .v
Foreword . . . . . . . . . . . . . . . . . . . . . . . . . . . . . . . . . . . . . . . . . . . . . . . . . . . . . . . . . . . . . . . . . . . . . . . . . . . . . . . . . . . .vii
Highlights . . . . . . . . . . . . . . . . . . . . . . . . . . . . . . . . . . . . . . . . . . . . . . . . . . . . . . . . . . . . . . . . . . . . . . . . . . . . . . . . . . . .ix
Acknowledgements and Study Team . . . . . . . . . . . . . . . . . . . . . . . . . . . . . . . . . . . . . . . . . . . . . . . . . . . . . . . . . . . . . . .xi
List of Tables . . . . . . . . . . . . . . . . . . . . . . . . . . . . . . . . . . . . . . . . . . . . . . . . . . . . . . . . . . . . . . . . . . . . . . . . . . . . . . . . .xv
List of Figures . . . . . . . . . . . . . . . . . . . . . . . . . . . . . . . . . . . . . . . . . . . . . . . . . . . . . . . . . . . . . . . . . . . . . . . . . . . . . . .xvii
I. Overview of the Domestic Agriculture Outlook . . . . . . . . . . . . . . . . . . . . . . . . . . . . . . . . . . . . . . . . . . . . . . . . . .1
II. Overview of the Global Food Outlook . . . . . . . . . . . . . . . . . . . . . . . . . . . . . . . . . . . . . . . . . . . . . . . . . . . . . . . .11
III. Factors Influencing Food Outlook . . . . . . . . . . . . . . . . . . . . . . . . . . . . . . . . . . . . . . . . . . . . . . . . . . . . . . . . . . .25
IV. Commodity Outlook Assessment . . . . . . . . . . . . . . . . . . . . . . . . . . . . . . . . . . . . . . . . . . . . . . . . . . . . . . . . . . . .45
IV.1 Rice . . . . . . . . . . . . . . . . . . . . . . . . . . . . . . . . . . . . . . . . . . . . . . . . . . . . . . . . . . . . . . . . . . . . . . . . . . . . . .45
IV.2 Wheat . . . . . . . . . . . . . . . . . . . . . . . . . . . . . . . . . . . . . . . . . . . . . . . . . . . . . . . . . . . . . . . . . . . . . . . . . . . .49
IV.3 Coarse Grains . . . . . . . . . . . . . . . . . . . . . . . . . . . . . . . . . . . . . . . . . . . . . . . . . . . . . . . . . . . . . . . . . . . . . .53
IV.4 Pulses . . . . . . . . . . . . . . . . . . . . . . . . . . . . . . . . . . . . . . . . . . . . . . . . . . . . . . . . . . . . . . . . . . . . . . . . . . . .55
IV.5 Edible Oilseeds and Oils . . . . . . . . . . . . . . . . . . . . . . . . . . . . . . . . . . . . . . . . . . . . . . . . . . . . . . . . . . . . .59
IV.6 Sugarcane and Sugar . . . . . . . . . . . . . . . . . . . . . . . . . . . . . . . . . . . . . . . . . . . . . . . . . . . . . . . . . . . . . . . .66
IV.7 Potato . . . . . . . . . . . . . . . . . . . . . . . . . . . . . . . . . . . . . . . . . . . . . . . . . . . . . . . . . . . . . . . . . . . . . . . . . . . .72
IV.8 Onion . . . . . . . . . . . . . . . . . . . . . . . . . . . . . . . . . . . . . . . . . . . . . . . . . . . . . . . . . . . . . . . . . . . . . . . . . . . .80
IV.9 Banana . . . . . . . . . . . . . . . . . . . . . . . . . . . . . . . . . . . . . . . . . . . . . . . . . . . . . . . . . . . . . . . . . . . . . . . . . . .89
IV.10 Milk . . . . . . . . . . . . . . . . . . . . . . . . . . . . . . . . . . . . . . . . . . . . . . . . . . . . . . . . . . . . . . . . . . . . . . . . . . . . .97
V. Conclusions . . . . . . . . . . . . . . . . . . . . . . . . . . . . . . . . . . . . . . . . . . . . . . . . . . . . . . . . . . . . . . . . . . . . . . . . . . . .103
Contents
xiii

xiv

I.1 2013–14 Crop Forecasts (Million Tonnes) . . . . . . . . . . . . . . . . . . . . . . . . . . . . . . . . . . . . . . . . . . . . . . . . . . .5
I.2 Year-on-Year Inflation Trend in Major Food Commodities: WPI % change YOY . . . . . . . . . . . . . . . . . . . .7
I.3a Recent Trends in Food Prices: WPI and International Price, % YOY . . . . . . . . . . . . . . . . . . . . . . . . . . . . . .8
I.3b Projections of Wholesale Prices in Delhi Based on Harmonic Analysis: % Change YOY . . . . . . . . . . . . . . .8
I.3c Projections of National Level WPI Based on ARIMA Models: % Change YOY and MOM . . . . . . . . . . .9
I.4 Supply-Demand Balances for Selected Food Commodities (Thousand Tonnes) . . . . . . . . . . . . . . . . . . . . . .9
II.1 Global Production Forecasts for Major Food Commodities (Million Tonnes) . . . . . . . . . . . . . . . . . . . . . . .13
II.2 CBOT Futures Price Quotes US$/MT . . . . . . . . . . . . . . . . . . . . . . . . . . . . . . . . . . . . . . . . . . . . . . . . . . . .20
III.1 Per Capita Income Growth During the Recent Decades . . . . . . . . . . . . . . . . . . . . . . . . . . . . . . . . . . . . . . .26
III.2 Agri-Policy Developments during October 2013 to January 2014 . . . . . . . . . . . . . . . . . . . . . . . . . . . . . . . .44
IV.1.1 Government Operations in Rice . . . . . . . . . . . . . . . . . . . . . . . . . . . . . . . . . . . . . . . . . . . . . . . . . . . . . . . . . .47
IV.1.2 Supply and Demand Balance for Rice (Thousand Tonnes) . . . . . . . . . . . . . . . . . . . . . . . . . . . . . . . . . . . . .48
IV.2.1 Government Operations in Wheat . . . . . . . . . . . . . . . . . . . . . . . . . . . . . . . . . . . . . . . . . . . . . . . . . . . . . . . .50
IV.2.2 Supply and Demand Balance for Wheat (Thousand Metric Tonnes) . . . . . . . . . . . . . . . . . . . . . . . . . . . . .52
IV.3.1 Demand Supply Balance Sheet for Maize (Thousand Tonnes) . . . . . . . . . . . . . . . . . . . . . . . . . . . . . . . . . .55
IV.4.1 Demand and Supply Balance Sheet for Pulses (Thousand Tonnes) . . . . . . . . . . . . . . . . . . . . . . . . . . . . . . .59
IV.5.1 Sowing of Rabi Oilseeds (Lakh Hectare): 2013 and 2014 . . . . . . . . . . . . . . . . . . . . . . . . . . . . . . . . . . . . . .59
IV.6.1 Sugar Supply-Demand Balance Sheet (Million Tonnes) . . . . . . . . . . . . . . . . . . . . . . . . . . . . . . . . . . . . . . .72
IV.7.1 Trends in Area, Production and Yield in Major Potato Producing States and Share of States in Area and Production . . . . . . . . . . . . . . . . . . . . . . . . . . . . . . . . . . . . . . . . . . . . . . . . . . . . . . . . . . . .73
IV.7.2 Area, Production and Yields of Potato in the Major Producing States: 2011–12 and 2012–13 . . . . . . . . . .74
IV.7.3 Potato Export Statistics . . . . . . . . . . . . . . . . . . . . . . . . . . . . . . . . . . . . . . . . . . . . . . . . . . . . . . . . . . . . . . . . .74
IV.7.4 Potato Supply and Demand (Thousand Tonnes) . . . . . . . . . . . . . . . . . . . . . . . . . . . . . . . . . . . . . . . . . . . . .75
IV.7.5 Potato Market Arrivals and Prices . . . . . . . . . . . . . . . . . . . . . . . . . . . . . . . . . . . . . . . . . . . . . . . . . . . . . . . .79
IV.7.6 Futures Prices of Potato . . . . . . . . . . . . . . . . . . . . . . . . . . . . . . . . . . . . . . . . . . . . . . . . . . . . . . . . . . . . . . . . .79
IV.8.1 Onion Production Statistics: Major States . . . . . . . . . . . . . . . . . . . . . . . . . . . . . . . . . . . . . . . . . . . . . . . . . .81
IV.8.2 State-wise Area, Production and Yield of Onion: 2012–13 . . . . . . . . . . . . . . . . . . . . . . . . . . . . . . . . . . . . .82
IV.8.3 Season-wise Area, Production and Yield of Onion . . . . . . . . . . . . . . . . . . . . . . . . . . . . . . . . . . . . . . . . . . . .82
List of Tables
xv

IV.8.4 Onion Export Statistics . . . . . . . . . . . . . . . . . . . . . . . . . . . . . . . . . . . . . . . . . . . . . . . . . . . . . . . . . . . . . . . . .83
IV.8.5 Onion Supply and Demand (Thousand Tonnes) . . . . . . . . . . . . . . . . . . . . . . . . . . . . . . . . . . . . . . . . . . . . .83
IV.9.1 Area, Production and Yield of Banana in the Major Producing States and All-India level . . . . . . . . . . . . .90
IV.9.2 Banana Export Trends . . . . . . . . . . . . . . . . . . . . . . . . . . . . . . . . . . . . . . . . . . . . . . . . . . . . . . . . . . . . . . . . . .91
IV.9.3 Banana Supply and Demand (Thousand Tonnes) . . . . . . . . . . . . . . . . . . . . . . . . . . . . . . . . . . . . . . . . . . . .91
IV.9.4 Monthly Price Differential – Wholesale & Retail . . . . . . . . . . . . . . . . . . . . . . . . . . . . . . . . . . . . . . . . . . . .94
IV.10.1 Milk Production and Yield 2012–13 – Major Indian States . . . . . . . . . . . . . . . . . . . . . . . . . . . . . . . . . . . . .98
IV.10.2 Per Capita World Dairy Consumption (Kg/Year) . . . . . . . . . . . . . . . . . . . . . . . . . . . . . . . . . . . . . . . . . . . .99
IV.10.3 WPI of Milk Relative to the Selected Other Livestock Products and Inputs: 2004–05=100 . . . . . . . . . . .101
List of Tables
xvi

I.1 GDP Growth – Agriculture& Allied vs. Overall . . . . . . . . . . . . . . . . . . . . . . . . . . . . . . . . . . . . . . . . . . . . . .2
I.2 Agricultural Production Trends . . . . . . . . . . . . . . . . . . . . . . . . . . . . . . . . . . . . . . . . . . . . . . . . . . . . . . . . . . . .2
I.3 Food Inflation Exceeds Overall Inflation Rate . . . . . . . . . . . . . . . . . . . . . . . . . . . . . . . . . . . . . . . . . . . . . . . .7
II.1 Global Price Trend of Major Commodities . . . . . . . . . . . . . . . . . . . . . . . . . . . . . . . . . . . . . . . . . . . . . . . . .16
II.2 Stocks-to-Use Ratio of Major Agricultural Commodities . . . . . . . . . . . . . . . . . . . . . . . . . . . . . . . . . . . . . .22
III.1a Trend in Cereal Consumption – Rural . . . . . . . . . . . . . . . . . . . . . . . . . . . . . . . . . . . . . . . . . . . . . . . . . . . . .26
III.1b Trend in Cereal Consumption – Urban . . . . . . . . . . . . . . . . . . . . . . . . . . . . . . . . . . . . . . . . . . . . . . . . . . . .27
III.2 Trends in Per Capita Rice Consumption . . . . . . . . . . . . . . . . . . . . . . . . . . . . . . . . . . . . . . . . . . . . . . . . . . .27
III.3 Trends in Per Capita Wheat Consumption . . . . . . . . . . . . . . . . . . . . . . . . . . . . . . . . . . . . . . . . . . . . . . . . .28
III.4 Trends in Per Capita Consumption of Coarse grains . . . . . . . . . . . . . . . . . . . . . . . . . . . . . . . . . . . . . . . . . .28
III.5 Trends in Per Capita Consumption of Pulses . . . . . . . . . . . . . . . . . . . . . . . . . . . . . . . . . . . . . . . . . . . . . . . .29
III.6 Trends in Per Capita Edible Oil Consumption . . . . . . . . . . . . . . . . . . . . . . . . . . . . . . . . . . . . . . . . . . . . . .29
III.7 Changes in the Composition of Edible Oils in Consumption . . . . . . . . . . . . . . . . . . . . . . . . . . . . . . . . . . .30
III.8 Trends in Per Capita Milk Consumption . . . . . . . . . . . . . . . . . . . . . . . . . . . . . . . . . . . . . . . . . . . . . . . . . . .31
III.9 Trends in Per Capita Consumption of Eggs, Meat and Fish . . . . . . . . . . . . . . . . . . . . . . . . . . . . . . . . . . . .31
III.10 Trends in Per Capita Consumption of Onion, Potato and Banana . . . . . . . . . . . . . . . . . . . . . . . . . . . . . . . .33
III.11 Trends in Per Capita Consumption of Calories, Protein and Fats . . . . . . . . . . . . . . . . . . . . . . . . . . . . . . . .35
III.12 Trends in Composition of Calories: Animal and Vegetable Products . . . . . . . . . . . . . . . . . . . . . . . . . . . . . .35
III.13 Trends in Composition of Per Capita Calorie Intake by Type of Food . . . . . . . . . . . . . . . . . . . . . . . . . . . .36
III.14 Trends in Composition of Per Capita Calorie Intake by Type of Food: % of Calorie Intake . . . . . . . . . . . .36
III.15 Trends in Per Capita Protein Intake by Animal and Vegetable Sources . . . . . . . . . . . . . . . . . . . . . . . . . . . .38
III.16 Trends in Per Capita Protein Intake by Type of Food . . . . . . . . . . . . . . . . . . . . . . . . . . . . . . . . . . . . . . . . .38
III.17 Trends in the Composition of Protein Intake by Type of Food: % of Protein . . . . . . . . . . . . . . . . . . . . . . .39
III.18 Per Capita Nutrient Intake in India, China and US . . . . . . . . . . . . . . . . . . . . . . . . . . . . . . . . . . . . . . . . . . .41
IV.1.1 Year-on-Year Increase in Rice Wholesale Price Index: % YOY . . . . . . . . . . . . . . . . . . . . . . . . . . . . . . . . . .46
IV.1.2 Rice Export Price – India vis-a-vis International . . . . . . . . . . . . . . . . . . . . . . . . . . . . . . . . . . . . . . . . . . . . .47
IV.1.3 Government Rice Stocks – Actual vs. Buffer Norm . . . . . . . . . . . . . . . . . . . . . . . . . . . . . . . . . . . . . . . . . . .48
IV.2.1 Wheat Price Inflation: WPI (% YOY) . . . . . . . . . . . . . . . . . . . . . . . . . . . . . . . . . . . . . . . . . . . . . . . . . . . . .50
IV.2.2 Indian Wholesale Wheat Price vis-à-vis US SRW Wheat Price FOB . . . . . . . . . . . . . . . . . . . . . . . . . . . .51
IV.2.3 Government Wheat Stocks – Actual vs. Buffer Norm . . . . . . . . . . . . . . . . . . . . . . . . . . . . . . . . . . . . . . . . .52
IV.3.1 Coarse Grain Production Trend . . . . . . . . . . . . . . . . . . . . . . . . . . . . . . . . . . . . . . . . . . . . . . . . . . . . . . . . . .54
IV.3.2 Maize Price Comparison US vs. India . . . . . . . . . . . . . . . . . . . . . . . . . . . . . . . . . . . . . . . . . . . . . . . . . . . . .55
List of Figures
xvii

IV.4.1 Trend in Area, Yield, and Production of Pulses . . . . . . . . . . . . . . . . . . . . . . . . . . . . . . . . . . . . . . . . . . . . . .56
IV.4.2 Trend in Pulse Production by Type . . . . . . . . . . . . . . . . . . . . . . . . . . . . . . . . . . . . . . . . . . . . . . . . . . . . . . . .57
IV.4.3 Trend in Minimum Support Prices for Pulses . . . . . . . . . . . . . . . . . . . . . . . . . . . . . . . . . . . . . . . . . . . . . . .57
IV.4.4 Wholesale Price Inflation Trend in Pulses . . . . . . . . . . . . . . . . . . . . . . . . . . . . . . . . . . . . . . . . . . . . . . . . . .58
IV.5.1 Edible Oil Production and Consumption . . . . . . . . . . . . . . . . . . . . . . . . . . . . . . . . . . . . . . . . . . . . . . . . . . .60
IV.5.2 Oilseed and Vegetable Oil Price Inflation (YoY % Change) . . . . . . . . . . . . . . . . . . . . . . . . . . . . . . . . . . . . .61
IV.5.3 Wholesale Price Index of Rapeseed and Mustard, Palm Oil and International Price of Palm Oil (YOY % Change) . . . . . . . . . . . . . . . . . . . . . . . . . . . . . . . . . . . . . . . . . . . . . . . . . . . . . . . . . . . . .61
IV.5.4 Arrival and Prices of Groundnut in Gondal market in Rajkot District of Gujarat . . . . . . . . . . . . . . . . . . .62
IV.5.5 Arrival and Prices of Soybean . . . . . . . . . . . . . . . . . . . . . . . . . . . . . . . . . . . . . . . . . . . . . . . . . . . . . . . . . . . .62
IV.5.6 Arrival and Prices of Rapeseed and Mustard . . . . . . . . . . . . . . . . . . . . . . . . . . . . . . . . . . . . . . . . . . . . . . . .64
IV.5.7 Total Imports of Edible Oils (Oil Year from Nov–Oct) . . . . . . . . . . . . . . . . . . . . . . . . . . . . . . . . . . . . . . . .65
IV.5.8 Share of Different Oils in Total Imports . . . . . . . . . . . . . . . . . . . . . . . . . . . . . . . . . . . . . . . . . . . . . . . . . . . .65
IV.6.1 Sugarcane Area, Production and Yield Trends . . . . . . . . . . . . . . . . . . . . . . . . . . . . . . . . . . . . . . . . . . . . . . .67
VI.6.2 Sugarcane and Sugar Production Trend . . . . . . . . . . . . . . . . . . . . . . . . . . . . . . . . . . . . . . . . . . . . . . . . . . . .68
IV.6.3 Indian Sugar Cycle . . . . . . . . . . . . . . . . . . . . . . . . . . . . . . . . . . . . . . . . . . . . . . . . . . . . . . . . . . . . . . . . . . . .68
IV.6.4 All India Sugar Price and Year-on-Year Change in WPI of Sugar . . . . . . . . . . . . . . . . . . . . . . . . . . . . . . . .69
IV.6.5 Fair Average Price (FRP) for Sugarcane and Actual Price Paid to Famers . . . . . . . . . . . . . . . . . . . . . . . . .70
IV.6.6 Sugar Beginning Stocks . . . . . . . . . . . . . . . . . . . . . . . . . . . . . . . . . . . . . . . . . . . . . . . . . . . . . . . . . . . . . . . .71
IV.7.1 Area, Production and Yield of Potato in India . . . . . . . . . . . . . . . . . . . . . . . . . . . . . . . . . . . . . . . . . . . . . . .73
IV.7.2 WPI Trends in Potato . . . . . . . . . . . . . . . . . . . . . . . . . . . . . . . . . . . . . . . . . . . . . . . . . . . . . . . . . . . . . . . . . .75
IV.7.3 Comparison between Average % YoY of WPI from 2006 to 2011 and % YoY of 2012 over 2013 . . . . . . .76
IV.7.4 Wholesale Prices of Potato in Selected Cities . . . . . . . . . . . . . . . . . . . . . . . . . . . . . . . . . . . . . . . . . . . . . . . .77
IV.7.5 Retail Prices of Potato in Selected Cities . . . . . . . . . . . . . . . . . . . . . . . . . . . . . . . . . . . . . . . . . . . . . . . . . . .77
IV.7.6 Per day Average Arrivals of Potatoes . . . . . . . . . . . . . . . . . . . . . . . . . . . . . . . . . . . . . . . . . . . . . . . . . . . . . . .78
IV.8.1 Area, Production and Yield of Onion in India . . . . . . . . . . . . . . . . . . . . . . . . . . . . . . . . . . . . . . . . . . . . . . .81
IV.8.2 Wholesale Price Index of Onion . . . . . . . . . . . . . . . . . . . . . . . . . . . . . . . . . . . . . . . . . . . . . . . . . . . . . . . . . .84
IV.8.3 Comparison between Average % YoY of WPI from 2006 to 2011 and % YoY of 2012 over 2013 . . . . . . .84
IV.8.4 Wholesale Prices of Onion in Cities . . . . . . . . . . . . . . . . . . . . . . . . . . . . . . . . . . . . . . . . . . . . . . . . . . . . . . .85
IV.8.5 Retail Prices of Onion in Metro Cities . . . . . . . . . . . . . . . . . . . . . . . . . . . . . . . . . . . . . . . . . . . . . . . . . . . . .86
IV.8.6 Per Day Average Arrivals of Onion in Selected Wholesale Markets . . . . . . . . . . . . . . . . . . . . . . . . . . . . . .87
IV.9.1 Area, Production and Yield of Banana . . . . . . . . . . . . . . . . . . . . . . . . . . . . . . . . . . . . . . . . . . . . . . . . . . . . .90
IV.9.2 WPI of Banana Relative to WPI of Fruits and Food Articles . . . . . . . . . . . . . . . . . . . . . . . . . . . . . . . . . . .92
List of Figures
xviii

IV.9.3 Comparison between Average % YoY of WPI from 2006 to 2011 and % YoY of 2012 over 2013 . . . . . . .92
IV.9.4 Wholesale Prices of Banana in Selected Cities . . . . . . . . . . . . . . . . . . . . . . . . . . . . . . . . . . . . . . . . . . . . . . .93
IV.9.5 Retail Prices of Banana in Selected Cities . . . . . . . . . . . . . . . . . . . . . . . . . . . . . . . . . . . . . . . . . . . . . . . . . .94
IV.9.6 Per Day Average Arrivals of Bananas . . . . . . . . . . . . . . . . . . . . . . . . . . . . . . . . . . . . . . . . . . . . . . . . . . . . . .95
IV.10.1 Compound Decadal Growth Rate of Milk Production . . . . . . . . . . . . . . . . . . . . . . . . . . . . . . . . . . . . . . . .97
IV.10.2 Average Milk Yield/day . . . . . . . . . . . . . . . . . . . . . . . . . . . . . . . . . . . . . . . . . . . . . . . . . . . . . . . . . . . . . . . .99
IV.10.3 Trends in the WPI for Milk and Foodgrains: % YOY . . . . . . . . . . . . . . . . . . . . . . . . . . . . . . . . . . . . . . . .100
IV.10.4 FAO International Dairy Price Index – % change YOY . . . . . . . . . . . . . . . . . . . . . . . . . . . . . . . . . . . . . . .101
List of Figures
xix

xx

I.1 Economic Growth Sluggish, but Agricultural GrowthUpbeatImproved agricultural growth has contributed to achieving a higher growth rate of theeconomy in the current year as compared to 2012–13. The Advance Estimates of India’snational income statistics, the first official estimates for India’s GDP for 2013–14 releasedon Feb 7, 2014, indicate that the economy grew at an annual rate of 4.9 per cent followingan even slower growth rate of 4.5 per cent in the previous year. Agricultural growth hasbeen projected at 4.6 per cent as compared to a mere 1.4 per cent in 2012–13.
A number of agencies were predicting a modest growth of the economy in the current year.The Reserve Bank of India (RBI) in its Second Quarter Review of Monetary Policy2013–14 scaled down India’s economic growth forecast for FY 2013–14 to 5 per cent fromthe earlier projection of 5.5 per cent, citing downside risk stemming from domesticconstraints. The International Monetary Fund (IMF) and the Asian Development Bank(ADB) were pegging growth somewhat lower.
A highly favourable south west monsoon in 2013 resulted in higher production of mostkharif grains, pulses and oilseeds. The first advance estimates of agricultural productionby the Ministry of Agriculture, released towards the end of September 2013, placed khariffoodgrain production at 129.32 million tonnes, above the 128.2 million tonnes in theprevious year. However, the 2nd AE released in February 2014, have dropped the khariffoodgrain production to 128.4 million tonnes, just above the 2012–13 estimates.Nevertheless, the first assessment of the overall production of crop output for the full year2013–14 shows that foodgrain output for the year is expected to be a new record exceeding263 million tonnes.
Combined with estimated higher production of oilseeds, fruits and vegetables, other crops,livestock products (primarily milk), and forestry and fisheries resulted in an overallagricultural and allied sector year-on-year GDP growth rate of 4.6 per cent for 2013–14.The Economic Advisory Council of the Prime Minister (EAC) in September 2013 hadprojected agricultural sector’s GDP growth rate in FY 2013–14 at 4.8 per cent comparedto less than 2 per cent in 2012–13 on the basis of normal monsoon rains.
PART I
Overview of the DomesticAgriculture Outlook
1
The 2nd AE releasedin February 2014,have dropped thekharif foodgrainproduction to 128.4million tonnes, justabove the 2012–13estimates.Nevertheless, thefirst assessment ofthe overallproduction of cropoutput for the fullyear 2013–14 showsthat foodgrain outputfor the year isexpected to be a newrecord exceeding263 million tonnes.

AGRICULTURAL OUTLOOK AND SITUATION ANALYSIS REPORTS
2
Figure I.1: GDP Growth – Agriculture & Allied vs. Overall
Figure I.2: Agricultural Production Trends
Rice Wheat C. Grains Pulses Total Sugarcane Potato Onion Bannana MilkOilseeds
2008–09 99.18 80.68 40.03 14.57 27.72 285.03 34.40 13.57 26.20 112.202009–10 89.09 80.80 33.55 14.66 24.88 292.30 36.60 12.16 26.50 116.402010–11 95.98 86.87 43.40 18.24 32.48 342.38 42.30 15.12 29.80 121.802011–12 105.31 94.88 42.04 17.09 29.80 361.07 41.48 17.51 28.46 127.902012–13 105.24 93.51 40.04 18.34 30.94 341.20 42.48 16.82 30.28 133.002013–14 # 106.19 95.60 41.64 19.77 32.98 345.92 44.80 18.00 30.90 138.10
# Final Estimate for rice, wheat, coarse grains, pulses, oilseeds and sugarcane.

I.2 Excess Rains Temper Kharif ProspectsDespite a favourable monsoon in 2013, the 2nd advance estimate of crop productionbrought out in February 2014 by the Ministry of Agriculture pegged 2013–14 khariffoodgrain production at 128.4 million tonnes, with only a marginal increase over 2012–13production of 128.1 million tonnes. A 0.4 million tonne decline in rice production,estimated at 92 million tonnes was offset by higher production of maize. Some of thedownward revision in production estimates from the 1st AE appears to be related to theadverse impact of the super cyclone Phailin which hit India’s eastern coast on October 12,2013 and subsequent heavy rains in Andhra Pradesh and Orissa raising the likelihood ofsome reduction in the initial assessment of kharif production.
Kharif pulses production is estimated to have increased by 0.3 million tonnes in 2013–14reaching 6.25 million tonnes. Tur (pigeon pea) and Moong (green gram) contributed tohigher production although Urd (black gram) output was lower in the present kharifseason.
The 2013–14 kharif oilseed production is estimated 1.2 million tonnes higher at 22.0million tonnes as per the 2nd AE with most of the increase coming from groundnut.Unseasonal heavy rains coinciding with soybean harvest in central India is reported to havecaused serious damage to soybean crop, leading to an estimated decline of 2.2 milliontonnes, as per the 2nd AE, from the previous harvest of 14.7 million tonnes.
Sugarcane output, which reaches the harvesting stage towards the end of the kharif seasonis estimated to be 345.9 million tonnes in 2013–14, 4 million tonnes higher than 2012–13.The estimates production for 2013–14 remains lower than the previous peak harvest of361 million tonnes in 2011–12.
I.3 Rabi Outlook PromisingThe above normal monsoon rains in most parts of the county in 2013 and its latewithdrawal provided favourable conditions for the planting of rabi crops. Although rainfallin the sowing period of Oct–December 2013 was below long period average (LPA) in thenorth west region, rabi planting was not affected adversely. Progressive rabi crop plantingdata shows a significant increase in wheat area and some increases in oilseed and pulsesarea but a marginal decline in coarse gain area. Growing conditions have been favourable.Rainfall during January has been above LPA in the northwest and central regions whererabi crop is important. Water storage in major reservoirs in early January at 105.15 BCMis significantly higher than a year ago level of 84.92 BCM and the 10 year average level of85.17 BCM, benefiting the mostly irrigated rabi crops. As a result, production of most rabicrops, is expected to higher in 2013–14 as compared to the previous year.
The overall economic environment in terms of prices paid by the farmers has been mixedfor rabi season. The energy prices have registered significant increase during the year2013–14 with both diesel and electricity prices rising at double digit rate over the previousyear. The wage rates have also shown significant increase during the year. The fertiliser andpesticide prices have increased at modest rate of less than 5 per cent over the previous yearand the WPI for manufactured products as whole also registered an increase of less than 5per cent. The rupee depreciated by about 14 per cent over the previous year during thesecond half of the year providing some support to agricultural exports but also makingimports expensive. Thus, while some of the key inputs such as fertilisers and machineryprices remained relatively stable, labour and energy inputs became expensive.
OVERVIEW OF THE DOMESTIC AGRICULTURE OUTLOOK
3
The above normalmonsoon rains inmost parts of thecounty in 2013 andits late withdrawalprovided favourableconditions for theplanting of rabicrops. Althoughrainfall in the sowingperiod ofOct–December 2013was below longperiod average (LPA)in the north westregion, rabi plantingwas not affectedadversely.Progressive rabicrop planting datashows a significantincrease in wheatarea and someincreases in oilseedand pulses area but amarginal decline incoarse gain area.Growing conditionshave beenfavourable. Rainfallduring January hasbeen above LPA inthe northwest andcentral regionswhere rabi crop isimportant.

The 2nd AE for 2013–14 places rabi production of foodgrains at 134.84 million tonnesabove the 129.06 million tonnes harvested in 2012–13. It is also the highest ever rabiharvest of foodgrains. The increase is contributed by cereals (4.64 million tonnes) andpulses (1.4 million tonnes). Among the rabi cereals, wheat is projected to contribute 2.09million tonnes to the increased production and gram accounts for 1 million tonnes of theincreased production of 1.4 million tonnes of pulses in 2013–14 over the previous year.Thus, even though kharif production is expected to show marginal improvement over theprevious year’s kharif season, the late withdrawal of rains at the end of south-westmonsoon helped improve area under rabi crops and also yields.
The production of nine major oilseeds as a whole in 2013–14 is now placed at 33 milliontonnes, up from 31 million tonnes in 2012–13. Rapeseed and mustard is projected toincrease by 0.22 million tonnes in the current year over the harvested 8.03 million tonnesin the previous year.
Among the fruits and vegetables covered in this report, our estimate of production ofpotato is 44.8 million tonnes, about the same as the 3rd AEs of production of 44.7 milliontonnes in 2012–13. Although, at an overall level rains in the south-west monsoon seasonwere favourable, the rainfall was not favourable in the eastern and north-eastern regions.However, the present estimates of production for 2013–14 available from NationalHorticulture Board are higher at 46.4 million tonnes. In the case of onion, production isestimated to exceed 18 million tonnes, about 1.5 million tonnes higher than in 2012–13.Adequate rainfall in the monsoon period helped improve production of onions in thecurrent year. The present estimates for 2013–14 available from NHRDF place productionof onions at 19 million tonnes. In the case of banana, our estimates place production at30.9 million tonnes, significantly higher than the estimated production (NHRDF) of 24.9million tonnes in 2012–13. We have retained the estimated milk production of138.1–138.4 million tonnes in 2013–14 lower than the targeted 139.7 million tonnes.
While the official estimates of production are now available for 2013–14, they are still notfinal as the rabi crop is yet to be harvested. For a comparison we have provided estimatesof production of food commodities for both the kharif and rabi seasons of 2013–14 basedon the statistical analysis of trends in output and the impact of rainfall during the cropseason. There are some significant deviations in estimates in some cases such as kharif rice,bajra and soybean where assessments based on trend and rainfall exceed the 2nd AE.
AGRICULTURAL OUTLOOK AND SITUATION ANALYSIS REPORTS
4
While the officialestimates ofproduction are nowavailable for2013–14, they arestill not final as therabi crop is yet to beharvested. For acomparison we haveprovided estimatesof production of foodcommodities forboth the kharif andrabi seasons of2013–14 based onthe statisticalanalysis of trends inoutput and theimpact of rainfallduring the cropseason. There aresome significantdeviations inestimates in somecases such as kharifrice, bajra andsoybean whereassessments basedon trend and rainfallexceed the 2nd AE.
OVERVIEW OF THE DOMESTIC AGRICULTURE OUTLOOK
5
Table I.1: 2013–14 Crop Forecasts (Million Tonnes)Item 2012–13 2013–14
4th Advance Final 1st Advance 2nd Advance Quarterly QuarterlyEstimate estimates Estimates Estimates Agricultural Agricultural
Outlook OutlookReport, Report,
November Feb2013 2014($)
Rice (kharif) 92.76 92.37 92.32 92 94.3-97.3 94.0-98.1
Rice (rabi) 11.64 12.37 NA 14.2 NA 12.0-12.7
Rice Total 104.4 105.24 NA 106.2 NA 106.0-110.8
Wheat 92.46 93.51 NA 95.6 NA 97.5
Maize (kharif) 16.04 16.19 17.78 16.9 17.3-17.7 17.0-17.4
Maize (rabi) 6.19 6.06 NA 6.4 NA 6.4-6.5
Maize Total 22.23 22.26 NA 23.3 NA 23.5-23.8
Bajra 8.74 8.74 8.66 8.8 11.2-11.4 11.2-11.3
Jowar (kharif) 2.75 2.84 2.57 2.3 2.8-3.0 2.7-3.0
Jowar (rabi) 2.59 2.44 NA 3.2 NA 2.7-3.0
Total Jowar 5.33 5.28 NA 5.6 NA 5.4-6.0
Other coarse grains (khaif) 2.02 1.92 1.98 2.1 1.9-2.3 2.3-2.6
Other coarse grain (rabi) 1.74 1.75 NA 1.9 NA 1.6-1.7
Total other coarse grain 3.76 3.67 NA 4 NA 4.0-4.2
Pulses (kharif) 5.91 5.91 6.01 6.3 6.1-6.7 6.2-6.7
Pulses (rabi) 12.54 12.43 NA 13.5 NA 13.0-13.2
Pulses (total) 18.45 18.34 NA 19.8 NA 19.4-19.7
Total foodgrain (kharif) 128.2 128.07 129.32 128.4 133.5-138.4 134.2-138.3
Total foodgrain (rabi) 127.16 129.06 NA 134.8 NA 133.7-134.0
Total foodgrains 255.36 257.13 NA 263.2 NA 267.9-272.3
Groundnut (kharif) 3.1 3.19 5.57 7 5.5-5.9 5.6-5.9
Groundnut (rabi) 1.65 1.51 NA 2.1 NA 1.7-1.8
Total groundnut 4.75 4.7 NA 9.1 NA 7.3-7.7
Soybean 14.679 14.67 15.68 12.4 14.9-17.3 13.5-15.9
Rapeseed and mustard 7.82 8.03 NA 8.3 NA 8.4
Major 9 oilseeds (kharif) 20.86 20.791 24 22 NA 24.35
Major 9 oilseeds (rabi) 10.146 10.152 NA 11 NA 11.87
Major 9 oilseeds (total) 31.006 30.943 NA 33 NA 36.22
Sugarcane 338.96 341.2 341.77 345.9 347.8-353.0 353.8-356.0
Onion* 16.2 16.81 19 NA 18.1 18.3
Potato* 42.5 45.34 46.4 NA 46.2 44.8
Banana* 30.3 24.87 NA NA 33.8 30.9
Milk** NA 132.43 NA NA 138.1-138.4 138.1-138.4
Note: $:Rabi forecast is arrived at using two approaches: (1) based on progressive planting data and normal yields and (2) based on estimatedequations for production with a trend variable and rainfall during October–December.* In the case of onion and potato, estimates for 2012–13 are from National Horticultural Research Foundation and for Banana they are from NationalHorticultural Board. For 2013–14 estimates for onion and potato are from National Horticultural Board. Estimates for banana production in 2013–14are not available.** In the case of milk, average growth rate in production in years of rainfall within 5 per cent of normal was used for projections of output in 2013–14.Upper band on growth was placed at 4.5 per cent.

I.4 Food Inflation WeakensYear-on-year headline inflation, measured by Wholesale Price Index after peaking 7.52 percent in November 2013, abated to 6.16 per cent in December compared to 7.31 per cent ayear ago, aided by drop in food inflation. Annual food inflation in December 2013 measuredby WPI of food articles abated to 13.7 per cent from 19.9 per cent a month ago, supportedlargely by lower prices of onion and rice (Figure I.4 and Table I.2). Rice price inflationdeclined marginally to 13.62 per cent in December from 15 per cent in November, whereasonion price increase on annual basis fell sharply to 39.6 per cent, the lowest in the past 13months, following increased market arrival from the late kharif crop. Wheat and milk pricesstrengthened modestly, whereas pulses, vegetable oil, and sugar prices showed decline.
Food inflation in the Short-runWith price rise of most food products, particularly of onion, cereals, pulses, vegetable oils,and sugar showing a declining trend, food inflation is expected to further moderate in theshort-run which may help in bringing down the overall inflation rate (Table I.3a). Twoapproaches were adopted for the short-term projections of price inflation of major fooditems, which are summarized in Tables I.3b–I.3c.
The highlights of the price environment are:
� The domestic and international prices show a contrasting pattern in the case ofaggregate food price index and in some specific sectors such as rice, wheat, maize andsoybean. The international prices show a declining pattern relative to the situation ayear back, the domestic prices are at elevated levels relative to previous year.
� Only in the case of groundnut oil the domestic prices show a declining pattern whileinternational prices are rising.
� The differences in domestic and international price trends are influenced by outputfluctuations, price support policies, exchange rate fluctuations and also level ofintegration with the international markets. In the case of soybean and groundnutdomestic production scenario presents a contrasting situation, with output registeringsharp increase in the case of groundnut and showing some uncertain gains in soybean.The rapeseed and mustard oil shows similar trend in domestic and internationalmarkets and in the case of palm oil difference appears to be the exchange rate wedge.
� In the case of vegetables, while overall WPI is showing lower annual increase, in thecase of potato, price rise is significant indicating supply side pressures.
� The projections of domestic prices for the next 3–4 months indicating moderate orsoftening inflationary pressures in the case of wheat, pulses, onion and edible oils as agroup, in the case of wholesale prices in Delhi or national WPI indices.
� In the case of rice and milk the two approaches of projection indicate continuedfirmness in the price scenario.
� In the case of potato and onion the projections show contrasting patterns: the pricescenario in Delhi shows softening trends for potato but at national level the pricescenario appears to show upward pressures. In the case of onion the patterns are quitethe opposite. This mixed picture suggests that prices would show moderate increase,year-on-year basis, in the case of these two vegetables, but demand pressures willremain to maintain the upward pressures.
Overall, the food prices are likely to show annual 7–8 per cent increase in the short-term.
AGRICULTURAL OUTLOOK AND SITUATION ANALYSIS REPORTS
6
With price rise ofmost food products,particularly of onion,cereals, pulses,vegetable oils, andsugar showing adeclining trend, foodinflation is expectedto further moderatein the short-runwhich may help inbringing down theoverall inflation rate.

OVERVIEW OF THE DOMESTIC AGRICULTURE OUTLOOK
7
Table I.2: Year-on-Year Inflation Trend in Major Food Commodities: WPI % Change YOYMonths Food Articles Rice Wheat Pulses Potato Onion Milk Veg Oils SugarJan ’12 -0.68 0.94 -3.42 11.01 -23.15 -75.62 12.33 9.43 2.54Feb 6.12 1.53 -3.95 7.86 -2.22 -48.66 11.70 7.65 4.07Mar 10.11 5.03 -0.58 10.10 18.43 -24.06 15.29 9.94 2.87Apr 10.92 5.98 5.97 11.29 59.30 -11.03 15.68 11.18 3.16May 10.63 4.89 6.75 16.77 72.17 -8.05 11.90 10.37 5.24Jun 10.91 7.46 6.76 20.59 84.91 -9.46 7.46 9.52 7.13Jul 10.17 9.95 6.44 28.57 73.24 -10.05 8.01 10.85 9.38Aug 9.34 10.35 12.97 34.54 70.74 -20.71 6.68 10.91 16.91Sep 8.06 12.58 18.87 28.98 52.45 -24.69 6.45 10.71 19.87Oct 6.72 14.97 19.78 19.86 49.13 -9.12 6.35 9.38 18.88Nov 8.80 15.28 23.25 18.77 67.85 16.55 6.18 9.76 15.48Dec 10.63 17.10 23.63 16.25 58.03 72.79 6.15 9.20 9.84Jan ’13 12.35 17.77 21.87 15.89 73.10 125.17 4.52 7.54 10.09Feb 11.95 17.75 21.81 13.95 50.14 182.36 4.52 7.04 10.49Mar 8.63 17.56 19.35 10.84 15.80 110.74 4.42 3.60 9.35Apr 6.08 17.09 13.55 10.52 -0.63 90.83 4.04 2.01 8.67May 8.25 18.48 12.37 5.95 1.28 94.28 4.46 0.89 7.10Jun 10.27 20.43 13.94 1.59 -8.38 114.76 4.08 0.07 6.93Jul 12.29 21.15 13.64 -7.43 -6.13 146.43 3.02 -2.23 2.20Aug 19.17 21.33 9.38 -14.70 -15.25 272.54 6.02 -2.86 -4.75Sep 18.68 18.61 7.31 -13.42 -12.28 335.88 5.77 -2.72 -7.39Oct 18.34 14.45 7.88 -10.72 0.17 293.29 5.64 -0.27 -8.21Nov 19.93 14.99 7.21 -10.56 26.71 190.34 6.25 -0.07 -8.41Dec 13.68 13.62 7.93 -7.19 54.65 39.56 6.93 -1.20 -5.99
Figure I.3: Food Inflation Exceeds Overall Inflation Rate

AGRICULTURAL OUTLOOK AND SITUATION ANALYSIS REPORTS
8
Table I.3a: Recent Trends in Food Prices: WPI and International Price, % YOY Item WPI % Change YOY International Prices % Change YOY
Oct–13 Nov–13 Dec–13 Jan–14 Oct–13 Nov–13 Dec–13 Jan–14
Food Price Index 12.8 13.9 9.6 6.3 -4.8 -4.6 -3.6 -4.5
Food articles 18.3 19.7 13.7 8.8
Food products 2.3 2.4 1.8 1.5
Cereals 11.4 11.3 10.2 9.3
Rice 14.5 15.0 13.6 13.4 -22.5 -24.0 -20.9 -23.1
Wheat 7.9 7.0 7.9 7.1 -9.2 -15.0 -16.2 -17.9
Jowar 2.9 9.4 8.8 8.2
Bajra 13.9 8.0 0.1 -0.5
Maize 6.4 7.4 4.0 -1.7 -37.3 -38.1 -36.0 -34.5
Pulses -10.7 -9.9 -7.2 -6.1
Gram -23.9 -25.5 -23.5 -22.4
Tur 0.6 3.9 9.2 8.8
Groundnut seed -10.8 -19.5 -23.5 -28.9
Rapeseed & Mustard seed -15.6 -14.3 -12.2 -9.5
Soybean 10.9 13.9 10.2 10.1 -16.4 -10.6 -8.6 -9.5
Vegetables 80.2 97.7 57.3 16.6
Potato 0.2 35.0 54.7 21.7
Onion 293.3 201.2 39.6 6.6
Fruits 15.8 13.6 9.1 5.3
Banana 30.5 16.6 16.4 14.0 -2.3 -1.6 -2.2 -0.6
Groundnut oil -2.2 -4.0 -11.0 -12.9 42.8 42.7 18.4 22.1
R & M oil -0.9 -0.8 0.3 0.6 -17.0 -14.9 -15.4 -21.2
Palm oil 3.4 7.4 5.8 6.2 -0.7 9.0 11.4 -0.9
Edible oils -0.3 0.2 -1.2 -2.0
Sugar -8.2 -7.7 -6.0 -5.2 -8.1 -4.9 -8.9 -8.4
Grain mill products 7.9 7.5 5.1 2.8
Milk 5.6 6.9 6.9 7.2
Note: International prices: IMF.
Table I.3b: Projections of Wholesale Prices in Delhi based on Harmonic Analysis: % Change Year-on-YearJan–14 Feb–14 Mar–14 Apr–14
Rice 5.8 5.7 5.7 5.7
Wheat 4.2 4.2 4.2 4.3
Tur -9.7 -9.9 -10.0 -10.0
Gram -23.6 -23.7 9.6 9.9
Urd 4.5 4.6 4.6 4.6
Masur -13.0 -14.1 -14.8 -14.8
Onion 88.7 86.9 82.8 10.4
Potato -18.1 -20.6 -20.0 -16.4
Sugar -9.1 -10.0 -10.6 -10.7
Soy oil 13.2 15.9 18.3 20.6
Palm oil 21.1 23.7 25.8 27.4
Milk 13.1 13.0 12.8 12.7

I.5 Supply-Demand Balance SummaryPart IV of the report discusses the short-term scenario for specific food commodities.Summary of the scenario that is developing in the supply-demand balance sheet of thefood commodities is summarised in Table I.4.
In arriving at the supply-demand balances, we have taken opening stock and closing stockfor rice and wheat based on accounting of government operations in foodgrains; in the caseof edible oils and sugar, closing stocks are residual as we specify domestic use based pasttrends. In the other cases, closing stocks are specified at the same level as the notionalbeginning stocks.
OVERVIEW OF THE DOMESTIC AGRICULTURE OUTLOOK
9
Table I.3c: Projections of National Level WPI based on ARIMA Models: % Change Year-on-Year andMonth over MonthCommodity % YOY % MOM
Actual Projected Actual ProjectedJan–14 Feb–14 Mar–14 Apr–14 Jan–14 Feb–14 Mar–14 Apr–14
Rice 13.4 13.3 12.5 12.6 -0.2 0.4 0.5 0.8
Wheat 7.1 7.6 7.6 5.6 0.2 0.9 -0.8 -2.7
Jowar 8.2 7.9 1.7 1.6 0.2 1.2 -0.4 1.0
Bajra -0.5 -1.2 -0.4 0.2 1.1 -0.3 0.9 2.9
Maize -1.7 0.6 2.4 1.3 -2.7 1.9 1.7 -0.7
Gram -22.4 -20.1 -16.7 -16.6 -1.3 -3.0 -1.6 -1.8
Tur 8.8 8.8 4.4 3.3 -1.1 0.7 -0.2 1.3
Pulses -6.1 -4.7 -2.9 -1.9 -0.1 -1.2 -0.1 1.1
Onion 6.6 -26.9 -22.0 -28.2 -16.6 -23.8 -19.0 -14.5
Potatoes 21.7 15.1 35.6 23.4 -23.0 -12.2 8.6 7.2
Groundnut seed -28.9 -28.2 -27.8 -28.0 -0.2 -1.4 0.5 1.3
Rape Mustard seed -9.5 -9.5 -5.7 -2.4 -0.1 -3.2 -2.9 0.0
Soyabean 10.1 9.8 3.3 -6.9 -1.5 -0.9 0.7 1.9
Edible oils -2.0 -2.8 -1.9 -1.2 -0.7 -1.2 -0.6 0.9
Food articles 8.8 9.1 10.3 10.2 -2.7 0.6 0.5 2.6
Food products 1.5 1.3 2.1 2.3 -0.4 -0.1 0.1 1.0
Food sector 6.2 6.4 7.3 7.1 -1.9 0.4 0.2 1.8
Table I.4: Supply-Demand Balances for Selected Food Commodities (Thousand Tonnes)Item/ Marketing year Rice Wheat Maize Pulses Edible oils Sugar Onion Potato
2013–14 2014–15 2013–14 2013–14 2013–14 2013–14 2013–14 2013–14
A. Supply side
Beginning stocks 23,000 19,000 550 1,964 1,643 8,800 657 2,450
Production 106,500 97,500 23,500 19,700 10,000 24,500 18,300 44,800
Imports 0 0 0 3,500 10,300 0 10 0
Total supply 129,500 116,500 24,050 25,164 21,943 33,300 18,967 47,250
B. Demand side
Exports 9,000 4,000 3,000 200 100 2000 1,000 250
Domestic use 98,000 92,500 19,850 23,000 19,200 23,000 17,310 44,550
Utilisation 107,000 96,500 22,850 23,200 19,300 25,000 18,310 44,800
C. Closing stocks 22,500 20,000 1200 1,964 2,643 8,300 657 2,450
Note: IThe supply demand balances are for the marketing year 2013–14 in all the cases except wheat, which is for MY 2014–15.

The balance sheet indicates the significant level of beginning and closing stocks in the caseof rice, wheat and sugar and relatively low stocks in the other cases. While adjustments toproduction or demand shocks are likely to be absorbed through trade or consumption inthe case of pulses and edible oils, the low stock position (even when estimated notionallyin the absence of data) reflects the vulnerability of consumption to production shocks inthe case of onion and potatoes.
AGRICULTURAL OUTLOOK AND SITUATION ANALYSIS REPORTS
10

PART II
Overview of the Global FoodOutlook
11
II.1 Economy Poised for a Modest GrowthThe global economy continues to grow at a moderate pace, in large part due to weakerprospects in many emerging market economies, with a modest acceleration of growthanticipated in 2014. The International Monetary Fund (IMF) currently forecasts globaleconomic growth in 2014 at 3.6 per cent compared to 2.9 per cent in 2013. Growthcontinues to disappoint in major emerging market economies, reflecting, to varyingdegrees, infrastructure bottlenecks and other capacity constraints, slower external demandgrowth, lower commodity prices, financial stability concerns, and, in some cases, weakerpolicy support.
On the positive side, in early December 2013, The World Trade Organisation (WTO)reached its first ever worldwide trade reform deal pertaining to trade facilitation at a make-or-break meeting at Bali. The deal also includes agriculture provisions that encourage theeliminationof export subsidies and better administration of tariff-rate quotas. Experts saythe new trade agreement could boost global economic output by as much as $1 trillion andcreate 21 million jobs, most of those in developing countries. India succeeded in securinga waiver on providing agriculture subsidies in the WTO forum.
II.2 Global Agricultural Outlook
II.2.1 Production further upGlobal agricultural outlook for 2013–14 continues to remain upbeat. Since our lastQuarterly Outlook Report ( July–September), there have been further upward revisions in2013–14 global production of wheat, coarse grains, oilseeds, vegetable oils, and sugar.However, global rice production was revised downward by 3 to 7 million tonnes by variousagencies due to a worsening of crop prospects in China and India, the two largestproducers (Table II.1).
� The FAO has revised its 2013–14 wheat production upward to 710.8 million tonnes,the USDA to 712.7 million tonnes and IGC to 698.0 million tonnes, record highs,from the 2012–13 production of 659.6, 656.2 and 655 million tonnes, respectively.
� World rice production in 2013–14 was revised downward to 494.2 million tonnes byFAO, 471.1 million tonnes by USDA, and 471 million tonnes by IGC from itsSeptember estimate, but still a record high.
� 2013–14 world coarse grain production has been revised significantly upward, about130 million tonnes above the 2012–13 level to 1295 million tonnes by FAO, 1,259million tonnes by USDA, and 1,248 million tonnes by IGC, with most of the increaseconfined to maize.
� Global oilseed production forecast for 2013–14 was revised significantly upward by all
In early December2013, The WorldTrade Organisation(WTO) reached itsfirst ever worldwidetrade reform dealpertaining to tradefacilitation at amake-or-breakmeeting at Bali. Thedeal also includesagricultureprovisions thatencourage theeliminationof exportsubsidies and betteradministration oftariff-rate quotas.Experts say the newtrade agreementcould boost globaleconomic output byas much as $1 trillionand create 21 millionjobs, most of those indevelopingcountries. Indiasucceeded insecuring a waiver onprovidingagriculturesubsidies in the WTOforum.

agencies from its earlier forecast. The revised estimates with the 2012–13 estimates inparentheses in million tonnes are: FAO – 503 (482) and USDA – 506 (474). U.S.soybean production was revised upward to 89.5 million tonnes from the Septemberestimate of 85.7 million tonnes. Reflecting higher oilseed production, 2013–14 globaledible oil production has also been revised upward to 169 million tonnes by USDA, 8.4million tonnes above the 2012–13 production, with most of the increase in palm oil,soybean oil, and sunflower seed oil.
Global wheat production in 2013–14 is forecast to increase by around 8 per cent with mostof the increase confined to the Black Sea region (the Russian Federation, Ukraine andKazakhstan) following severe drought conditions in the previous year. Significant increasein wheat production is reported in Canada, Australia, and European Union, partly offsetby lower production in the United States, China, and India. In the United States inparticular, production is estimated to decline by about 6.2 per cent reflecting droughtconditions throughout the growing season in many major winter wheat areas.
Global rice production for 2013–14, despite some downgrading in recent months in Indiaand China due to weather related problems, is forecast at a record as a result of expandedarea. Higher production is expected in all major producing countries except in Chinamainly due to an increase in planted area driven by higher government support prices.
Driven largely by a sharp increase in maize production in the U.S., the world’s largestmaize producing country, from the drought-plagued output of the previous year, globalcoarse grains production in 2013–14 is estimated at a record. Maize production in theUnited States rebounded by about 30 per cent to 354 million tonnes from its drought-reduced level in the previous year. In China and India, the consistent growth in maizeproduction in recent years has continued in 2013–14. Maize production in other majorproducing countries such as European Union, Ukraine, Canada, and Indonesia is forecastto increase to record levels, whereas in Brazil and Argentina production is likely to declinefrom the 2012–13 record levels due to an expected fall in the area in response to prevailinglower world corn prices.
AGRICULTURAL OUTLOOK AND SITUATION ANALYSIS REPORTS
12
Global wheatproduction in2013–14 is forecastto increase byaround 8 per centwith most of theincrease confined tothe Black Sea region(the RussianFederation, Ukraineand Kazakhstan)following severedrought conditions inthe previous year.
Global riceproduction for2013–14, despitesome downgradingin recent months inIndia and China dueto weather relatedproblems, is forecastat a record as aresult of expandedarea.

USDA projects world oilseeds production in 2013–14 to rise further to a record of around506 million tonnes, largely due a significant increase in soybeans, rapeseed, and sunflowerseed. In the United States, despite weather related problem in major producing areas,soybean production is estimated at a near record level of 89.5 million tonnes, an increaseof 7 million tonnes over the previous year. Relatively favourable returns to soybeans areforecast to result in an expansion of the area planted to soybeans in Brazil and Argentina,primarily at the expense of the area planted to corn. As a result, soybean production inthese countries is forecast to rise to record levels assuming favourable weather conditions.A significant increase in rapeseed production is Canada would take world rapeseedproduction to a record 70 million tonnes. World sunflower seed production is forecast torise by 13 per cent in 2013–14 to a record 43.7 million tonnes, largely driven by higherproduction in the Black Sea region and the European Union.
OVERVIEW OF THE GLOBAL FOOD OUTLOOK
13
Table II.1: Global Production Forecasts for Major Food Commodities (Million Tonnes)FAO USDA IGC ABARES
Wheat
2011–12 702.4 697.3 695 695
2012–13 659.6 656.2 655 655
2013–14 710.8 (709.8) 712.7 (708.9) 698.0 (693.0) 705 (695)
Rice
2011–12 486.1 465.8 465 NA
2012–13 489.1 469 469 NA
2013–14 494.2 (497.2) 471.1(476.8) 471 (474) NA
Maize
2011–12 888.4 886 877 886
2012–13 875.2 862.9 863 863
2013–14 1001.3 (983) 966.9 (956.7) 950 (943) 964 (957)
All Coarse grains
2011–12 1164.5 1151.3 1156 1151
2012–13 1156.3 1132.5 1135 1131
2013–14 1294.8 (1285.3) 1259.2 (1245.5) 1248 (1237) 1254 (1247)
Total Oilseeds
2011–12 454.7 446.3 NA 445
2012–13 481.5 474.1 NA 470
2013–14 502.5 (NA) 505.9 (495.1) NA 498 (487)
Total Vegetable oils
2011–12 183.6 157.5 NA 153
2012–13 190.2 160.8 NA 156
2013–14 199.3 (NA) 169.2 (167.3) NA 165 (164)
Sugar ( Raw equivalent)
2011–12 175.2 161.9 NA 174.3
2012–13 179.6 172 NA 183.6
2013–14 180.2 (NA) 174.9 NA 181.6 (181.1)
Milk
2011–12 742.2 529.7 NA NA
2012–13 765.6 544.1 NA NA
2013–14 780.3 (NA) 553.7 NA NA

World vegetable oil production in 2013–14 is forecast by USDA at a record 169 milliontonnes, up almost 8 million tonnes from the 2012–13 production, with most of theincrease in palm oil (Indonesia), soybean oil (Argentina and Brazil), rapeseed oil (Canada)and sunflower seed oil (Ukraine and Russia). Oil production from the group of annualoilseed crops is estimated to rise by around 5.0 million tonnes and the perennial oil seedcrop, mainly oil palm is forecast to add around 3.0 million tonnes to global vegetable oilproduction.
Global production outlook for pulses in major exporting countries has further improvedsince our last report. World production of dry peas, one of the leading pulses traded inglobal market, is estimated to have increased significantly in all major exporting countriessuch as Canada, Australia, and the United States in 2013–14. Canadian dry peaproduction estimate for 2013–14 has been revised upward at 3.8 million tonnes, up 13 percent from the previous year’s production, as lower harvested area has been offset by recordyields. US dry pea production is forecast to increase by 21 per cent to 700,000 tonnesmainly due to a 30 per cent increase in planted area. Australian field pea production in2013 is estimated at 397,100 tonnes, an increase of 24 per cent over 2012.
Canadian lentil production is estimated to rise by 11 per cent to 1.7 million tonnes. Thisis largely due to estimate of record yield, which more than offsets lower harvested area. TheUS lentil production is forecast to decline by 26 per cent to 200,000 tonnes due to declinein planted area. Australian lentil production in 2013 is estimated at 246,250 tonnes, anincrease of 34 per cent over the previous year.
Canadian chickpea production for 2013–14 is estimated to rise by 6 per cent to 171,000tonnes, due to above average yield estimates for the second consecutive year. 2013–14. USchickpea production is forecast at 150,000 metric tonnes, unchanged from the 2012–13level. Australian desi chickpea production in 2013 is estimated to have declined by about26 per cent to 541,290 tonnes due to poor growing conditions. This was marginally offsethigher kabuli chickpea production which increased by 26 per cent to 97,930 tonnes.
2013–14 pulse production in Myanmar, a major supplier of tropical pulses such as urd(black matpe), tur (pigeon pea), etc. is estimated at 4.8 million tonnes, marginally higherfrom the 2012–13 level.
While ABARES forecasts 2013–14 world sugar production to decline marginally to 181.6million tonnes from 183.6 million tonnes the previous year, FAO estimates a marginalincrease in production at 180.2 million tonnes. Production is forecast to be lower inEurope, the United States, India and Mexico but higher in Brazil, Thailand and China.
FAO forecasts world milk production in 2013 to grow by 1.9 per cent to 780 milliontonnes – with Asia, particularly India, expected to account for most of the increase. Returnto favourable seasonal conditions in main dairy exporting countries such as New Zealand,United States and European Union and lower feed grain prices will also contribute tohigher production.
II.2.2 Consumption upbeatWheat consumption is forecast to increase in 2013–14 from the low level of the previousyear due to larger production and lower prices with food use accounting for most of theincrease. Developing countries are likely to account for the bulk of the wheat food useincrease. Expected lower prices of feed wheat substitutes, such as corn, are expected tomoderate the extent of the increase in feed wheat demand with most of the increaseconfined to European Union, whereas in the US and China feed use is likely to decline.USDA estimates total global wheat consumption to increase by around 1.9 per cent to
AGRICULTURAL OUTLOOK AND SITUATION ANALYSIS REPORTS
14
Global productionoutlook for pulses inmajor exportingcountries has furtherimproved since ourlast report. Worldproduction of drypeas, one of theleading pulsestraded in globalmarket, is estimatedto have increasedsignificantly in allmajor exportingcountries such asCanada, Australia,and the United Statesin 2013–14.
While ABARESforecasts 2013–14world sugarproduction to declinemarginally to 181.6million tonnes from183.6 million tonnesthe previous year,FAO estimates amarginal increase inproduction at 180.2million tonnes.
FAO forecasts worldmilk production in2013 to grow by 1.9per cent to 780million tonnes – withAsia, particularlyIndia, expected toaccount for most ofthe increase.

699.3 million tonnes, FAO by 1.4 per cent to 696.1 million tonnes and IGC by 2.8 percent to 692 million tonnes.
Despite a marginal downward revision from the earlier forecast, global 2013–14 riceconsumption is projected at a record 473.0 million tonnes by USDA and 471 milliontonnes by IGC, up about 1 per cent from a year earlier. However, FAO estimate of2013–14 rice consumption is 489 million tonnes, up 2.6 per cent from the 2012–13 level.India, China and Nigeria account for most of the projected increase in global consumptionin 2013–14.
World coarse grains consumption in 2013–14 is forecast to reach a record of around 1.2billion tonnes, driven by an expected increase in the feed use, particularly maize. Total feedutilization of coarse grains in 2013–14 is currently forecast by FAO to increase by around6 per cent to 700 million tonnes which reflects recovery in world supplies and lower pricesof major coarse grains. Total maize consumption (including food, feed and industrial use)consumption is forecast by USDA to rise by 9 to 10 per cent to a record level of around935 million tonnes, with United States and China accounting for the largest increasefollowed by Mexico, Russia, and Ukraine. Barley consumption is forecast by USDA to riseby around 8 million tonnes to 141 million tonnes.
Total industrial use of maize (mostly for production of ethanol) is projected by theInternational Grains Council to approach 262 million tonnes, 6 per cent higher than in theprevious season. Most of the increase is expected to be in the United States, where assumingno change to ethanol blending mandates, ethanol producers are expected to respond toimproved producer margins during 2013–14 as maize prices are expected to moderate.
World oilseeds crush, exclusive of oil palm, is forecast by USDA to increase by 4 to 5 percent in 2013–14 to around 415 million tonnes, driven by high demand for protein mealsand vegetable oils. Most of the increase will be in soybeans (up 5 per cent to 240 milliontonnes) followed by sunflower (up 13 per cent to 37 million tonnes) and rapeseed/mustard(up 3 per cent to 64 million tonnes).
Larger supplies combined with the fall in international prices are likely to stimulate globalvegetable oil demand. As a result, world consumption is forecast to increase by 6 per centin 2013–14 to 165 million tonnes by the USDA, with both food consumption and to alesser extent industrial use of vegetable oils (primarily biodiesel) increasing. Food usegrowth is likely to remain confined to China and India. Given its competitive pricerelative to other oils, palm oil would remain the growth leader, followed by soy, rape andsunflower seed oil. National biofuel regulations, border measures and certificationrequirements will continue to influence markets for biodiesel and their feedstock. TheEuropean Union is likely to increase domestic biodiesel production in response to theintroduction in late 2013 of import duties on biodiesel from Argentina and Indonesia.
Despite a likely marginal decline in production, ABARES forecasts world sugarconsumption to increase by 2.2 per cent in 2013–14 to a record 176.8 million tonnes,driven by expected income growth, particularly in China, Indonesia, India and Brazil.Large supplies and lower international and domestic prices due to large carryover stocksare expected to underpin consumption.
II.2.3 Price trend mixedWorld commodity prices presented a mixed picture during the past quarter with wheat,maize, soybean oil, soybean meal, and sugar showing a downward trend while rice,soybeans and palm oil prices strengthening. Nevertheless, most commodity prices in recent
OVERVIEW OF THE GLOBAL FOOD OUTLOOK
15
World coarse grainsconsumption in2013–14 is forecastto reach a record ofaround 1.2 billiontonnes, driven by anexpected increase inthe feed use,particularly maize.Total feed utilizationof coarse grains in2013–14 is currentlyforecast by FAO toincrease by around 6per cent to 700million tonnes whichreflects recovery inworld supplies andlower prices of majorcoarse grains.
Larger suppliescombined with thefall in internationalprices are likely tostimulate globalvegetable oildemand.

AGRICULTURAL OUTLOOK AND SITUATION ANALYSIS REPORTS
16
A record cereal cropthis year has helpedto improve the globalsupply situation,weighing on theinternational pricesof wheat and maize.
The FAO Food PriceIndex averaged206.7 points inDecember 2013,nearly unchangedfrom November, as asharp increase indairy prices andfirming meat valuesdue to increasingdemand from Chinaand Japan largelybalanced out a steepdecline in sugarquotations and lowercereal and oil prices.Over the full 2013year, the Indexaveraged 209.9points, down 1.6 percent from 2012, butstill the third highestannual value onrecord.
months were significantly below a year-ago prices. A record cereal crop this year has helpedto improve the global supply situation, weighing on the international prices of wheat andmaize. Prices for soybeans have trended higher during recent months, underpinned by firmbuying interest from leading importers, which more than offset pressure from prospects forbumper outturns in all of the world’s main exporters. Palm oil prices in recent months hasstrengthened and exceeded a year-ago price due to strong global import demand, includingfor biodiesel production, and below-expectation output in Southeast Asia followingexcessive rainfall (Figure II.1). Improved harvesting operations in Brazil, the world’slargest sugar producer and exporter, and speculations of a possible surge of exports fromBrazil and India, owing to the weakening of currencies against the US dollar caused a slidein sugar prices.
The FAO Food Price Index averaged 206.7 points in December 2013, nearly unchangedfrom November, as a sharp increase in dairy prices and firming meat values due toincreasing demand from China and Japan largely balanced out a steep decline in sugarquotations and lower cereal and oil prices. Over the full 2013 year, the Index averaged209.9 points, down 1.6 per cent from 2012, but still the third highest annual value onrecord.
Figure II.1: Global Price Trend of Major Commodities

OVERVIEW OF THE GLOBAL FOOD OUTLOOK
17

AGRICULTURAL OUTLOOK AND SITUATION ANALYSIS REPORTS
18

II.2.4 Price outlook bearish
Generally increased wheat supplies and the expected drop in maize prices should see someweakening in world wheat prices during the rest of MY 2013–14 and MY 2014–15. Mostobservers (ABARES, the Economist Intelligence Unit) feel the world wheat indicatorprice (US #2 HRW) to fall by 9 to 10 per cent to $ 310 to $315 per tonne in 2013–14 andfurther to below $300 per tonne in 2014–15. For medium and lower protein wheatvarieties, including feed wheat, prices on world markets are expected to decline by morethan the fall in the indicator price.
With rice availabilities set to remain comfortable next year, international prices should easefurther in 2014. Thailand’s large sell off of government rice stocks and record exportablesupplies in Asia with record and near record stocks in Thailand and India, respectively arebearish factors.
The world coarse grains indicator price (US corn, fob Gulf ) is forecast by ABARES to fallby 29 per cent in 2013–14 to US$220 a tonne. This mostly reflects a record corn harvestin the United States. A proposed lowering of 2014 ethanol blending requirements in theUS and news of a number of overseas customs rejections of imported US maize on fearsof genetic modification provided negative pressure on prices in recent weeks. With onlylimited scope for growth in the U.S. fuel ethanol market, the potential outlets for therecord crop in 2013 therefore appear limited and the heavier stocks outlook should meaneven lower prices in the months ahead.
Soybean prices are expected to ease gradually in coming months against the backdrop ofample and improving supplies, especially in the world’s major exporters. The EconomistIntelligence Unit forecasts 2014 average US export prices (US # 2 Yellow fob Gulf basis)to decline by around 8 per cent year-on-year. There is likely to a strengthening in soybeanoil price through the end of the first quarter of 2014 in unison with palm oil price beyondwhich prices are expected to moderate.
With palm oil production entering its seasonal decline and with the possibility of a furtherdowngrading of production prospects in Indonesia, the palm oil market is now in a morebullish phase. This phase is expected to continue until the end of the January–Marchquarter of 2014, beyond which production will start to increase seasonally. According toexperts, palm oil prices could hit a more than one-year high at over $900 per tonne byMach 2014 rising faster than previously expected on strong demand from the biofuelindustry, mainly in Indonesia, before declining. Recent higher prices have led to asignificant reduction in the discount of palm oil to other vegetable oils, which is now at itslowest level since mid-2010. Typically, soybean oil price is on an average $200 per tonneabove palm oil which is only $75 per tonne now.
Global prices of dry peas, lentils, and chick peas are expected to fall in 2013–14 due to largersupplies and carryover stocks in major exporting countries such as Canada. The average priceof Canadian dry peas is expected to fall from the 2012–13 level, due to expectations for muchlarger carry-out stocks in 2013–14, projected by Agriculture and Agri-Food Canada.Average price is forecast to range between Canadian $ 265–295 against the previous year’sC$ 340 per tonne. The overall average price of Canadian lentils in 2013–14 is also forecastto be lower in the range of C$ 390–420 against C$ 440 per tonne in 2012–13 due to anexpected rise in carry-out stocks. Canadian chickpea price in 2013–14 is forecast at C$590–620 per tonne against $690 in 2012–13 due to higher world and Canadian supplies.
Given the relatively optimistic view of the supply fundamentals, and on the basis of furtherstock growth, there is likely to be limited price recovery in sugar in 2014, unless growing
OVERVIEW OF THE GLOBAL FOOD OUTLOOK
19
Generally increasedwheat supplies andthe expected drop inmaize prices shouldsee some weakeningin world wheatprices during therest of MY 2013–14and MY 2014–15.
Soybean prices areexpected to easegradually in comingmonths against thebackdrop of ampleand improvingsupplies, especiallyin the world’s majorexporters.
With palm oilproduction enteringits seasonal declineand with thepossibility of afurther downgradingof productionprospects inIndonesia, the palmoil market is now in amore bullish phase.

season weather in major growing countries turns adverse. The increasing cost ofproduction in many producer countries should keep further price dips relatively narrow,offer opportunities for occasional price rallies and, along with the slower stock growth,ultimately assist gradual price recovery in coming years.
World prices for dairy products are forecast to average higher in 2013–14. This reflectslimited growth in supplies from key exporting countries and continuing firm world importdemand. Prices are forecast to rise by between 6 per cent and 20 per cent in 2013–14 byABARES, with milk powder prices forecast to increase the most.
The early January CBOT futures price quotes show a further weakening of prices of mostcommodities (Table II.2).
II.2.5 Trade higherInternational trade in most commodities, perhaps with the exception of rice, is expected toexpand in 2013–14 in response to lower prices and rising consumption.
World wheat trade in 2013–14 is forecast at 142 million tonnes by FAO and IGC, 156million tonnes by USDA, and 148 million tonnes by ABARES, an increase ranging from0.7 per cent by IGC to 5 per cent by ABARES and USDA. Larger anticipated importsin Asia are likely to more than offset declining purchases in Europe, with most of theincrease in exports from the Black Sea region. For other major exporters, except Australiawhere exportable surplus is forecast to decline due to lower carryover stocks, shipments arealso forecast to rise in varying degrees.
Most international agencies estimate a decline in international rice trade, to the tune ofone million tonnes, in 2013 at around 38 million tonnes. The decline in exports is largelyconfined to Thailand and Vietnam, whereas exports from India is estimated to be more or
AGRICULTURAL OUTLOOK AND SITUATION ANALYSIS REPORTS
20
International tradein mostcommodities,perhaps with theexception of rice, isexpected to expandin 2013–14 inresponse to lowerprices and risingconsumption.
Table II.2: CBOT Futures Price Quotes US$/MT Commodity/ US$/Metric Tonnedate of QuoteSoybean CBOT 13–Nov 14–Jan 14–Mar 14–May 14–Jul 14–Aug 14–Sep 14–Nov 15–Jan
1–Nov–13 465.2 459.8 454.5 451.4 449.9 445.2 431.3 421.0 423.06–Dec–13 487.0 481.5 476.4 473.2 462.4 441.5 427.8 429.63–Jan–14 473.7 467.1 462.3 458.7 448.6 428.2 415.1 417.2Wheat CBOT 13–Dec 14–Mar 14–May 14–Jul 14–Sep 14–Dec 15–Mar
1–Nov–13 245.4 249.8 252.2 251.6 254.8 258.76–Dec–13 234.1 239.2 241.2 240.3 243.3 247.73–Jan–14 222.6 224.6 225.8 229.4 234.3 237.5Maize CBOT 13–Dec 14–Mar 14–May 14–Jul 14–Sep 14–Dec 15–Mar 15–May 15–Jul
1–Nov–13 168.2 172.2 175.5 178.0 180.6 183.7 187.4 189.5 190.66–Dec–13 166.9 171.0 174.3 177.1 179.5 182.6 186.8 189.0 190.33–Jan–14 166.7 170.0 172.7 175.2 177.9 182.1 184.4 185.7Soya Oil CBOT 13–Dec 14–Jan 14–Mar 14–May 14–Jul 14–Aug 14–Sep 14–Oct 15–Dec
1–Nov–13 916.9 923.7 931.9 938.9 944.9 947.3 947.8 946.7 948.46–Dec–13 888.0 892.6 901.5 910.3 918.7 921.5 922.8 922.2 927.33–Jan–14 845.2 851.0 858.5 866.8 869.3 871.0 871.0 874.8Sugar LCE 13–Dec 14–Mar 14–May 14–Aug 14–Oct 15–Dec
1–Nov–13 481.3 485.7 490.3 492.3 494.06–Dec–13 448.7 456.2 462.5 466.3 471.63–Jan–14 440.4 447.4 453.9 460.1 465.7
Source: Moore Research Centre, Inc. www.mrci.com/ohlc/index.php

less at the same level as in 2012, thus maintaining the topmost exporter position for thesecond consecutive year. Exports in 2014 are forecast at the same level as in 2013 ormarginally higher. Among exporters, India is foreseen to curb shipments in 2014,remaining nonetheless the leading rice exporter. Expectations of lower international pricesmay depress 2014 exports from Pakistan, the United States and Viet Nam, which isexpected to be filled by Thailand, where the recent fall of export quotations is helping thecountry recoup its competitive edge.
There has been a further upward revision in the 2013–14 global coarse grain trade, nowestimated at 139 million tonnes by USDA, an increase of 7 million tonnes over 2012–13,with most of the increase in maize from the United States and Ukraine. The US maizeexports now forecast at 37 million tonnes is double the quantity exported in 2012–13,although below the exports in prior years and significantly below the record exports ofaround 50 million tonnes in 2009–10. China’s projected imports are particularly strong at5 million tonnes (2.7 million tonnes in 2012–13), but with competitive prices, purchasesare also likely to rise in other countries, notably in Mexico where it is displacing sorghum.
International trade in vegetable oils is expected to keep expanding moderately projected ataround 69 million tonnes in 2013–14, up 2 million tonnes from the previous year’s levelwith most of the increase in palm oil and sunflower seed oil. India is projected to be thelargest importer with imports forecast at 11.8 million tonnes (up 1 million tonnes)followed by China with imports of 10.3 million tonnes. Growth in oilseed meal tradeshould rebound after last year’s slowdown, forecast at around 80 million tonnes, with mostof the increase in exports of soybean meal from Argentina.
World sugar exports are forecast to increase by 3 per cent in 2013–14 to 58.1 milliontonnes by ABARES, and by 12.5 per cent to 56.7 million tonnes by FAO, reflecting strongimport demand by the European Union, the United States and the Russian Federation andan increase in the supply of sugar available for export from Brazil, Thailand and India.
Global pulse trade in 2013–14 is likely to increase marginally or remain more or lessunchanged from the 2012–13 level.
II.2.6 StocksFollowing a rebound in global wheat production this year, world wheat closing stocks in2013–14 marketing year are expected to increase with forecasts ranging from 167 milliontonnes (up about 6.7 per cent from 2012–13) by FAO, 185.4 million tonnes (up 5.3 percent) by USDA, and 181 million tonnes (up 3.4 per cent) by IGC. However, the 2013–14ending stocks will be significantly below the ending stocks during the three yearspreceding 2012–13, when stocks were at record or near record levels of 190 to 200 milliontonnes. Stocks in the United States and India are expected to drop, whereas for most othercountries particularly Canada and China stocks are expected to grow. A marginal declinein global stocks-to-use ratio is forecast (Figure II.2).
While USDA and IGC forecast a marginal decline in rice stocks by the end of 2013–14marketing year at 105.2 and 108 million tonnes respectively, but still the second highest,FAO is forecasting a 5 million tonne increase in ending stocks at a record 179.8 milliontonnes. Most of the stocks increase is in Thailand. Stocks-to-use ratio is placed at 22.2per cent, a marginal decline over the previous year.
USDA forecasts a 27 million tonne increase in maize stocks at a record 160 million tonnes,with most of the increase in the US due to a record production. Stocks-to-use ratio is alsoexpected to improve significantly.
OVERVIEW OF THE GLOBAL FOOD OUTLOOK
21

A two million tonne increase in vegetable oil stocks is forecast by the close of the 2013–14marketing year at a record 20.4 million tonnes, with most of the increase in palm oil andrapeseed oil. While soybean oil stocks-to-use ratio is projected to decline, there is asignificant improvement in the stocks to use ratio of palm oil.
Sugar ending stocks and stocks-to-use ratio in 2013–14 are projected to improve to one ofthe highest levels in recent years.
II.3 Implications for IndiaBeing a major exporter of rice, wheat, maize, and oil meal and importer of vegetable oilsand pulses, the current global agricultural outlook scenario presents some opportunitiesand some challenges for Indian agricultural trade.
The continued build up in Thai rice stocks and its declining prices are likely to poseincreased competition for India’s high quality rice exports in 2013–14. With the removalof trade sanctions against Iran by Western countries, India’s near monopoly on basmati riceexports to Iran in recent years could come under pressure. This is further accentuated bythe increasing cost of production in India. India was one of the few countries to have abarter trade system and other payment mechanisms with Iran, which helped India toimport oil and export rice and other items to Iran. This led to a surge in India’s basmatirice exports to Iran last year which became the largest buyer of Indian basmati rice in2012–13.
There have been some concerns about the otherwise optimistic US winter wheat outlookin the aftermath of heavy snow storms in the country which provided some competitiveadvantage to Indian wheat in the short-run, with recent government wheat tenderssecuring quotes well above the government’s minimum export price of $260 per tonne.However, this is unlikely to continue for long due to pressure from record global wheatproduction and India will have to brace for increased competition in coming months.Furthermore, a significant decline in wheat procurement in 2013–14 marketing year could
AGRICULTURAL OUTLOOK AND SITUATION ANALYSIS REPORTS
22
The continued buildup in Thai rice stocksand its decliningprices are likely topose increasedcompetition forIndia’s high qualityrice exports in2013–14.
Figure II.2: Stocks-to-use Ratio of Major Agricultural Commodities
Source: USDA and ABARES (sugar).

make the government more cautious about further export allocation, especially in thecontext of implementing the National Food Security Act, which entails statutory provisionof highly subsidised food grains to a major share of Indian population.
Export outlook for Indian maize has further diminished driven by a massive increase inglobal exportable surplus of maize due to a record production and significantly lower pricesvis-a-vis previous years. India exported 4.8 million tonnes of maize in 2012–13.
Indian soybean meal will have to face increased competition in 2013–14 because of higherdomestic prices, reported poor quality due to untimely rains, and higher production inother major exporting countries such as Argentina. Exports to Iran, a major market forsoybean meal last year, could come under pressure with the lifting of trade sanctionsagainst Iran by western countries as Iran will now look for meals of other origin.
India’s competitiveness in the international sugar market will continue to be tempered bylower production, high domestic prices and increasing sugarcane prices in the context ofrising global production and record stocks leading to declining international prices. Asmost international trade in sugar is in raw form against India’s production of white sugar,Indian sugar mills will have to think of diversifying into raw sugar production to grabmarket share. Furthermore, export subsidies would be required to make exports feasible.The government has already announced several export assistance for sugar.
With the lowering of minimum export price of onion, exports have started picking up.
The recent increase in global prices of vegetable oils, particularly palm oil, will bedisadvantageous to India. However, prices are likely to soften in coming months due torecord production of most oils. As the price discount on palm oil vis-a-vis other oils,particularly soybean oil, has narrowed, there could be increased purchases of non-palm oilthis year. With the likelihood of a record rapeseed production in coming months, it wouldbe advisable for Indian importers to postpone purchases for some time until global pricesmoderate.
The likely higher domestic production of rabi pulses in India and expected lowerinternational prices for pulses, particularly dry peas, should help to contain upward pricepressures in pulses.
NotesMost recent detailed country by country analysis of the commodity situation and outlookare available in the following reports:
Food and Agriculture Organization of the United NationsFAO Cereal Supply and Demand Brief – December 2013www.fao.org/worldfoodsituation/csdb/en/
Food Outlook, November 2013www.fao.org/docrep/019/i3473e/i3473e.pdf
Oil Crops Monthly Price and Policy Update, January 2014www.fao.org/fileadmin/templates/est/COMM_MARKETS_MONITORING/Oilcrops/Documents/MPPU_Jan_14__short_.pdf
Monthly Soybean Supply and Demand Roundup – December 2013www.fao.org/fileadmin/templates/est/COMM_MARKETS_MONITORING/Oilcrops/Documents/MSSDR/MSSDR_December_13_.pdf
OVERVIEW OF THE GLOBAL FOOD OUTLOOK
23
Export outlook forIndian maize hasfurther diminisheddriven by a massiveincrease in globalexportable surplusof maize due to arecord productionand significantlylower prices vis-a-vis previous years.India exported 4.8million tonnes ofmaize in 2012–13.
India’scompetitiveness inthe internationalsugar market willcontinue to betempered by lowerproduction, highdomestic prices andincreasingsugarcane prices inthe context of risingglobal productionand record stocksleading to declininginternational prices.
The likely higherdomestic productionof rabi pulses in Indiaand expected lowerinternational pricesfor pulses,particularly drypeas, should help tocontain upward pricepressures in pulses.

International Commodity Priceswww.fao.org/economic/est/statistical-data/est-cpd/en/
United States Department of Agriculture – Foreign Agricultural ServiceGrain: World Markets and Trade, January 2014http://apps.fas.usda.gov/psdonline/circulars/grain.pdf
Oilseeds: World Market and Trade, September 2013http://apps.fas.usda.gov/psdonline/circulars/oilseeds.pdf
Agriculture and Agri-Food CanadaCanada-Outlook for Principal Field Crops December 2013www5.agr.gc.ca/resources/prod/doc/misb/mag-gam/fco-ppc/fco-ppc_2013–12–20_eng.pdf
International Grains CouncilGrain Market Report, November 2013http://www.igc.int/en/downloads/gmrsummary/gmrsumme.pdf
ABARESAgricultural Commodities Outlook, December 2013http://data.daff.gov.au/data/warehouse/agcomd9abcc004/agcomd9abcc004201312/AgCommodities201312_1.0.0.pdf
AGRICULTURAL OUTLOOK AND SITUATION ANALYSIS REPORTS
24

III.1 BackdropIn this chapter we first provide a review of the trends and patterns in food consumptionfrom the perspective of consumption of energy and protein. Changes in these patterns alsohave implications to the demand and supply of food commodities. For instance,preferences for livestock protein will require increased supplies of these commoditieswhich in turn have implications to the composition of output of the crop sector. If theconsumption level of nutrients is related to household income, does the internationalexperience provide likely future directions of food consumption in the country? Weexamine these questions through a review of trends and comparisons.
In the subsequent section, we summarise the policy developments in the quarter endingDecember 2013.
III.2 An Analysis of Changing Food Consumption Patternin IndiaEconomic growth is typically accompanied by improvements in a country’s food supply,both quantitative and qualitative, and a reduction in nutritional deficiencies. It also bringsabout changes in the production, processing, distribution and marketing of food. Dietsevolve over time and are influenced by a variety of factors such as income, prices, individualpreferences, cultural traditions, as well as environmental, other social and economic factors.
In this section we examine the evolving food consumption pattern in India over the pasttwo decades which is influenced by income induced diet diversification, impact ofglobalisation, increasing urbanisation and changing lifestyle of people. The consumptiontrends are also influenced by the availability of food items which are in turn affected bytrends in both domestic and global supplies. The trend in calorie, protein and fat intake inthe Indian diet is analyzed and a comparison is made of the trend in nutrient intake inIndia with that of China and the United States, which are at different stages of economicdevelopment. The analysis provides insights into the likely emerging food demandscenario for India in future. This analysis is based on the National Sample SurveyConsumer Expenditure Survey results1 and the FAO Food Balance Sheet data2. As theaverage per capita food consumption is derived from all India Monthly Per capitaConsumer Expenditure (MPCE) groups, it may not correspond to actual per capitaavailability. In contrast, the FAO Food Balance data refer to “average food available forconsumption”, which, for a number of reasons, is not equal to average food intake oraverage food consumption. Hence in this report, the terms “food consumption” or “food
PART III
Factors Influencing Food Outlook
25
Economic growth istypicallyaccompanied byimprovements in acountry’s foodsupply, bothquantitative andqualitative, and areduction innutritionaldeficiencies.
1. http://mospi.nic.in/Mospi_New/upload/461_final.pdf;http://mospi.nic.in/Mospi_New/upload/509_P1_final.pdf;http://mospi.nic.in/Mospi_New/upload/nss_report_541.pdf
2. http://faostat3.fao.org/faostat-gateway/go/to/download/FB/FB/E

AGRICULTURAL OUTLOOK AND SITUATION ANALYSIS REPORTS
26
Consistent with theoverall economicgrowth, the share ofconsumer spendingon food has declined.The proportion ofexpenditure on fooditems over allincome groups hasdeclined by about 10percentage points inthe rural areas andby about 16percentage points inthe urban areasbetween 1987–88and 2009–10.
intake” and “nutrient intake” using the FAO data should be treated as “food available forconsumption”.
III.2.1 Effect of income growth on consumptionIndia’s impressive economic growth in the past two decades and a more inclusive growthin recent years have has resulted in steady increase in per capita income both in urban andrural areas.
Consistent with the overall economic growth, the share of consumer spending on food hasdeclined. The proportion of expenditure on food items over all income groups hasdeclined by about 10 percentage points in the rural areas and by about 16 percentage pointsin the urban areas between 1987–88 and 2009–103. However, the income-induced dietdiversification has resulted in consumers moving away from coarse cereals such as jowarand bajra to grains such as wheat and rice (Figure III.1a. and III.1b) and more recentlyfrom cereals to high value food products such as milk, egg, meat, and fruits and vegetables– implying the negative or relatively lower income elasticity for cereals in India andpositive income elasticity for high quality food. The change is occurring both among ruraland urban households. Other factors contributing to the change in the consumptionpattern is the increasing urbanisation. During the most recent decade globalisation hasalso played an important role in the transformation of food consumption patterns ofIndian households. There has been a significant increase in imports of fresh fruits such asapple, dry fruits such as almonds and processed food products offering consumers widerchoice following trade liberalisation.
Table III.1. Per Capita Income Growth During the Recent DecadesAvg. 1987–1992 Avg. 1993–1999 Avg. 2000–2004 Avg. 2005–2009
At 2004–05 prices 2.9 4.6 3.9 7.1
At Current prices 13.0 12.8 8.0 13.9
3. www.iimahd.ernet.in/assets/snippets/workingpaperpdf/5337679172012–08–02.pdf
Figure III.1a: Trends in Cereal Consumption – Rural
Source: Various Rounds of Consumer Expenditure Survey, NSS.

III.2.2 Consumption trend by commoditiesRice: Per capita rice consumption in rural households declined from about 83 kg in1987–88 to 80 kg in 1999–2000 and more rapidly to 73 kg in 2009–10. A similar trendwas noticed in the urban households where per capita rice consumption declined from 64kg in 1987–88 to 62 kg in 1999–2000 and to 55 kg in 2009–10.
Wheat: The trend in wheat consumption shows a similar declining pattern as that of ricebut at a slower rate. Per capita consumption in rural households after remaining more orless unchanged at around 54 kg/year during 1987–88 to 1999–00 declined to slightlybelow 52 kg in 2009–10. In urban households, the decline was more significant from
FACTORS INFLUENCING FOOD OUTLOOK
27
Per capita riceconsumption in ruralhouseholds declinedfrom about 83 kg in1987–88 to 80 kg in1999–2000 andmore rapidly to 73 kgin 2009–10. Asimilar trend wasnoticed in the urbanhouseholds whereper capita riceconsumptiondeclined from 64 kgin 1987–88 to 62 kgin 1999–2000 and to55 kg in 2009–10.
The trend in wheatconsumption showsa similar decliningpattern as that of ricebut at a slower rate.
Figure III.1b: Trends in Cereal Consumption – Urban
Source: Various Rounds of Consumer Expenditure Survey, NSS
Figure III.2: Trends in Per Capita Rice Consumption

AGRICULTURAL OUTLOOK AND SITUATION ANALYSIS REPORTS
28
The decline incoarse grainconsumption duringthe study period wasmore striking than inthe case of wheatand rice, both inrural and urbanhouseholds.
around 54 kg to around 50 kg. The reason could be increased consumption of wheatproducts such as bread, biscuits, and noodles, etc. which are not included in the NSS wheatconsumption data.
Coarse grains: The decline in coarse grain consumption during the study period was morestriking than in the case of wheat and rice, both in rural and urban households. Withrising income, consumers have shifted from coarse grains, to rice and wheat. Per capitaconsumption declined from around 38 kg in 1987–88 to 13 kg in 2009–10 in ruralhouseholds and from 19 kg to 9 kg in urban households. However, the decline in humanconsumption of coarse cereals has resulted in larger availability of grains to feed the poultryand other livestock, which has registered a significant growth in recent years.
Figure III.3: Trends in Per Capita Wheat Consumption
Figure III.4: Trends in Per Capita Consumption of Coarse grains

FACTORS INFLUENCING FOOD OUTLOOK
29
Per capita pulseconsumption aftershowing an upwardtrend during1987–88 through1999–2000 hasshown a generallydeclining trend sincethen.
Edible oilconsumption hasshown a steadyupward trend both inrural and urbanhouseholds.
Pulses: Per capita pulse consumption after showing an upward trend during 1987–88through 1999–2000 has shown a generally declining trend since then. As pulses are seento have positive expenditure elasticity, the declining consumption trend indicates that theeffect of increasing consumer income may have been offset by the price effect. Limitedavailability of pulses in the global market has also limited consumption. Per capitaconsumption in urban households declined from 12 kg in 1999–00 to 9.6 kg in 2009–10and from 10 kg to 8 kg in rural households.
Edible oils: Edible oil consumption has shown a steady upward trend both in rural andurban households with per capita consumption increasing from 4 kg to 7.7 kg/year in ruralareas and from 6.6 kg to 10 kg in urban households during 1987–88 to 2009–10.
Figure III.5: Trends in Per Capita Consumption of Pulses
Figure III.6: Trends in Per Capita Edible Oil Consumption

AGRICULTURAL OUTLOOK AND SITUATION ANALYSIS REPORTS
30
Per capita milkconsumption hasincreasedsignificantly in thelast two decades,both in rural andurban areas.
The composition of oils in the consumption basket has changed sharply over the past twodecades with the emergence of palm and soybean as the major oils consumed due to lagerimports supported by lower international prices. Nevertheless, rapeseed/mustard oilcontinued to remain as the largest vegetable oil consumed in India. The pattern of averageconsumption of different oils is illustrated below for two periods: 1987–93 and 2005–09.
Milk: Per capita milk consumption has increased significantly in the last two decades, bothin rural and urban areas. The per capita milk consumption in rural households increasedfrom 39 kg/year in 1987–88 to 50 kg in 2009–10, an increase of 28 per cent, whereas inurban households per capita consumption increased from 52 kg to 65 kg during the sameperiod, registering an increase of 25 per cent. Increased consumption demand was metmainly by domestic production.
Figure III.7: Changes in the Composition of Edible Oils in Consumption
Source: FAO.
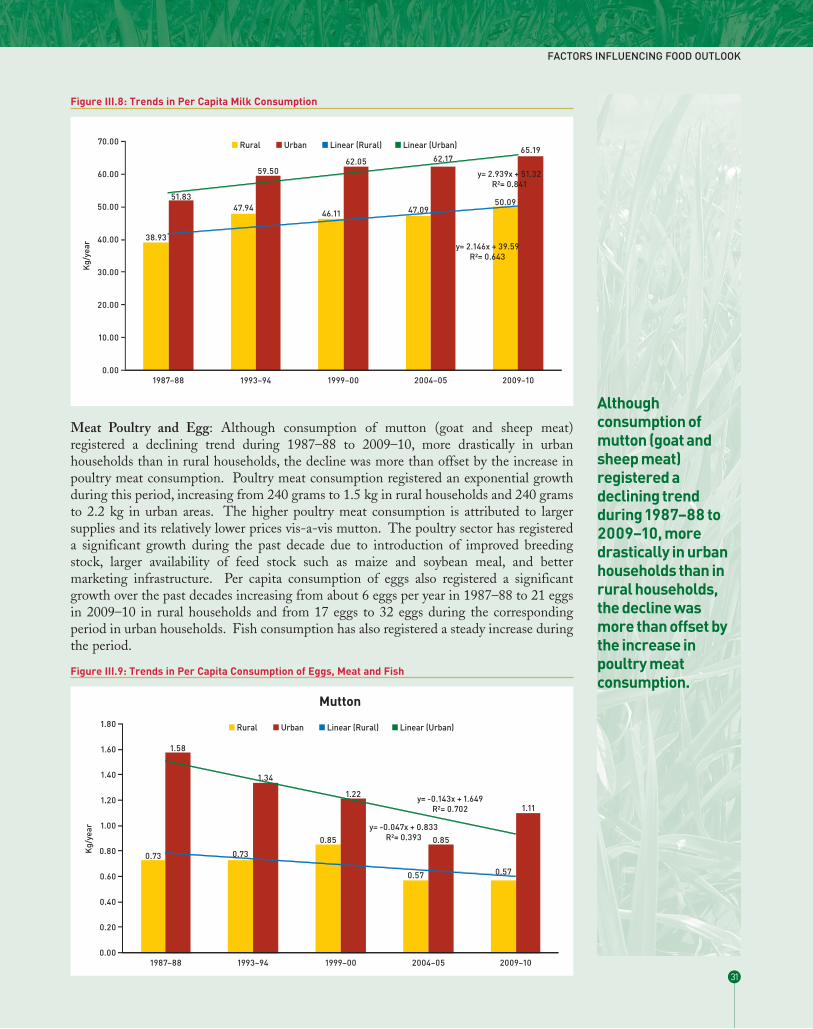
Meat Poultry and Egg: Although consumption of mutton (goat and sheep meat)registered a declining trend during 1987–88 to 2009–10, more drastically in urbanhouseholds than in rural households, the decline was more than offset by the increase inpoultry meat consumption. Poultry meat consumption registered an exponential growthduring this period, increasing from 240 grams to 1.5 kg in rural households and 240 gramsto 2.2 kg in urban areas. The higher poultry meat consumption is attributed to largersupplies and its relatively lower prices vis-a-vis mutton. The poultry sector has registereda significant growth during the past decade due to introduction of improved breedingstock, larger availability of feed stock such as maize and soybean meal, and bettermarketing infrastructure. Per capita consumption of eggs also registered a significantgrowth over the past decades increasing from about 6 eggs per year in 1987–88 to 21 eggsin 2009–10 in rural households and from 17 eggs to 32 eggs during the correspondingperiod in urban households. Fish consumption has also registered a steady increase duringthe period.
FACTORS INFLUENCING FOOD OUTLOOK
31
Althoughconsumption ofmutton (goat andsheep meat)registered adeclining trendduring 1987–88 to2009–10, moredrastically in urbanhouseholds than inrural households,the decline wasmore than offset bythe increase inpoultry meatconsumption.
Figure III.8: Trends in Per Capita Milk Consumption
Figure III.9: Trends in Per Capita Consumption of Eggs, Meat and Fish

AGRICULTURAL OUTLOOK AND SITUATION ANALYSIS REPORTS
32

Potato, Onion and Banana: Per capita vegetable and fruit consumption in general hasregistered a significant growth in the past in response to increasing per capita income.Among vegetables, we have considered only potato and onions, the major ones, and amongfruits only banana.
Per capita onion consumption recorded a steady upward trend both in rural and urban areaduring the last two decades. In rural households per capita onion consumption almostdoubled from 4.6 kg to 9 kg and in urban households from 6.1 kg to 10.4 kg. Being anessential ingredient in most non-vegetarian cooking, the increasing consumption of eggs,meat and poultry meat must have translated into increased onion consumption. Thefluctuations in production superimposed on a steady growth in consumption have resultedin onion and vegetable prices fluctuating widely from year-to-year.
Potato per capita consumption has shown a generally upward trend, more significantly inrural households where it increased from about 14 kg in 1987–88 to 20 kg in 2009–10. Inurban households the consumption grew at a lower rate from about 14 kg to 16.6 kg duringthe same period. However, the urban potato consumption is an under estimate as it doesnot take into account the increasing non-home consumption of potato snacks served byexpanding presence of fast food chains and shops.
Banana consumption, although fluctuating significantly from year-to-year, has shown agenerally upward trend, increasing from about 26 bananas per capita per year in 1987–88to 47 bananas in 2009–10 in rural areas and from 62 to 81 in urban areas.
.
FACTORS INFLUENCING FOOD OUTLOOK
33
Per capita vegetableand fruitconsumption ingeneral hasregistered asignificant growth inthe past in responseto increasing percapita income.
Figure III.10: Trends in Per Capita Consumption of Onion, Potato and Banana

III.2.3 Is Indian diet better now?How has the changing nature of food consumption pattern affected the nutrient intake inthe Indian diet? The process of diet transformation has far-reaching consequences forhealth. While an increase in the consumption of milk, animal protein and fruits andvegetables could result in reduced incidence of malnutrition, an increased consumption ofhigh-calorie and fatty food could lead to increased incidence of obesity and of diet-relateddiseases, like diabetes, coronary heart disease. The FAO Food Balance Sheet is used belowto assess the trend in macro nutrient (calorie, protein, and fat) intake in India. The trendsshow that while calorie and protein intake remained static or registered a modest growth,increase in fat consumption was more significant. These estimates are based on availabilityof food commodities.
AGRICULTURAL OUTLOOK AND SITUATION ANALYSIS REPORTS
34
While an increase inthe consumption ofmilk, animal proteinand fruits andvegetables couldresult in reducedincidence ofmalnutrition, anincreasedconsumption of high-calorie and fatty foodcould lead toincreased incidenceof obesity and of diet-related diseases,like diabetes,coronary heartdisease.

III.2.4 Calorie intake trendIn the course of changing diet pattern in India over the years, the overall calorie intake hasregistered only a modest increase from an average 2250 k. calories per capita per day during1987–1993 to 2310 k. calories during 2005–2010. A decline in calorie intake fromvegetable-based food, more importantly from cereal-based food, was more than offset byincreased calorie intake from animal based food products.
Calorie intake by type of food shows that combined contribution of cereals and pulses hasdeclined from 1580 k. calories during 1987–1993 to 1460 k. calories during 2005–2010, adecline of around 8 per cent. During the corresponding period, calorie availability fromfruits and vegetables increased by 43 per cent to 156 k. calories, from vegetable oils by 39per cent to 204 k. calories, from milk by 6 per cent to 105 k. calories, from meat, egg andfish by 25 per cent to 35 k. calories, and sugar by 9 per cent to 200 k. calories.
FACTORS INFLUENCING FOOD OUTLOOK
35
In the course ofchanging dietpattern in India overthe years, the overallcalorie intake hasregistered only amodest increasefrom an average2250 k. calories percapita per day during1987–1993 to 2310 k.calories during2005–2010.
Figure III.11: Trends in Per Capita Consumption of Calories, Protein and Fats
Figure III.12: Trends in Composition of Calories: Animal and Vegetable Products

The relative contribution of various food items (%) in total calorie intake during the studyperiod is depicted in the following diagrams.
AGRICULTURAL OUTLOOK AND SITUATION ANALYSIS REPORTS
36
Figure III.13: Trends in Composition of Per Capita Calorie Intake by Type of Food: k. calories/day
Figure III.14: Trends in Composition of Per Capita Calorie Intake by Type of Food: % of calorie intake(this figure is continued on next page)

FACTORS INFLUENCING FOOD OUTLOOK
37

III.2.5 Protein intake trendIntake of protein, the most important body building nutrient, in the Indian diet hasregistered a marginal increase during the study period to around 56 grams per day from 55grams per capita per day. As in the case of calories, the decline in protein intake fromvegetable sources was mostly offset by increased animal sources.
Analysis of protein intake by food items, indicates that contribution from cereals andpulses declined by 7 per cent each to 32 and 6.6 grams per capita per day, respectively,whereas protein from milk, meat/fish/eggs, and fruits/vegetables increased by 24, 26, and29 per cent, respectively to 6.7, 3.9, and 3.1 grams, respectively.
AGRICULTURAL OUTLOOK AND SITUATION ANALYSIS REPORTS
38
Intake of protein, themost important bodybuilding nutrient, inthe Indian diet hasregistered amarginal increaseduring the studyperiod to around 56grams per day from55 grams per capitaper day.
Figure III.15: Trends in Per Capita Protein Intake by Animal and Vegetable Sources: grams/day
Figure III.16: Trends in Per Capita Protein Intake by Type of Food: grams/day

The relative contribution of various food items (%) in total protein intake during the studyperiod is shown in the following diagrams.
FACTORS INFLUENCING FOOD OUTLOOK
39
Figure III.17: Trends in the Composition of Protein Intake by Type of Food: % of Protein (this figure iscontinued on next page)

III.2.6 India lags behind major countries in food nutrient intakeIn an effort to gauge where India stands in its food nutrient consumption level in theglobal context, an attempt is made to compare the food nutrient consumption pattern inIndia with that of China and the United States. Although these two countries are indifferent growth trajectories vis-a-vis India, the comparison would be helpful in knowingwhere India’s food requirement is headed in coming years if the high economic growthcontinues. The FAO Food Balance Sheet data is used for the analysis.
The following Charts depict the calorie, protein and fat consumption trends in India,China, and the United States. As can be observed, the current intake of calorie, proteinand fat in India is significantly below that of China and the United States.
AGRICULTURAL OUTLOOK AND SITUATION ANALYSIS REPORTS
40
The current intake ofcalorie, protein andfat in India issignificantly belowthat of China and theUnited States.

FACTORS INFLUENCING FOOD OUTLOOK
41
Figure III.18: Per Capita Nutrient Intake in India, China and US

Calorie intake level in the United States appears to have stabilised at around 3,700 k.calorie per day whereas in China, it is approaching this level. India’s calorie consumptioncurrently is only about 63 per cent of the United States and 77 per cent of China.
India’s average daily protein intake has remained nearly static over the past two decades ataround 55–57 grams. Although, the protein intake in China was close to that of India atthe beginning of 1990s, it has increased steadily since then reaching 94 grams in 2009,approaching the US level of around 115 grams.
Per capita fat intake in India, although showing an upward trend reaching around 57grams per day in recent years, lags significantly below the US intake of around 115 gramsand Chinese intake of 95 grams. While most of the fat intake in China and the US is fromanimal sources, in India the fat intake is predominantly from vegetable sources.
III.2.7 ImplicationsIndia is striving to provide food security to all its citizens through various policies andprogrammes. The recently enacted National Food Security Act is the recent and mostimportant one in this direction, which aims to supply adequate quantities of cheap cereals(predominantly wheat and rice) to the most vulnerable segment of rural and urbanpopulation. Although, this objective is consistent with the need to raise intake of caloriesit may not address the need for providing adequate quantities of nutritious and goodquality foods which makeup a healthy diet.
The present review of trends shows that despite rapid economic growth during the pasttwo decades, India’s average per capita calorie and protein intake has grown only modestly,although the per capita fat consumption has registered a higher growth. Nevertheless,there are some significant shifts in consumption pattern. Calorie and protein source in theIndian diet is diversifying with the share of fruits/vegetables and animal-based foodincreasing and share of cereal and pulses declining. The implication is that theimplementation of the cereal-based National Food Security Act will have to take intoaccount the changing consumption patterns also as it seeks to achieve the goal of providingnutritional security to the vulnerable section of the population. There is a need to includehigher protein food such as pulses or protein-enriched cereals or cereal flours so thatcheaper grains also become source of proteins besides calories. Innovations to improve use
AGRICULTURAL OUTLOOK AND SITUATION ANALYSIS REPORTS
42
India’s average dailyprotein intake hasremained nearlystatic over the pasttwo decades ataround 55–57grams. Although,the protein intake inChina was close tothat of India at thebeginning of 1990s, ithas increasedsteadily since thenreaching 94 grams in2009, approachingthe US level ofaround 115 grams.
The present reviewof trends shows thatdespite rapideconomic growthduring the past twodecades, India’saverage per capitacalorie and proteinintake has grownonly modestly,although the percapita fatconsumption hasregistered a highergrowth.
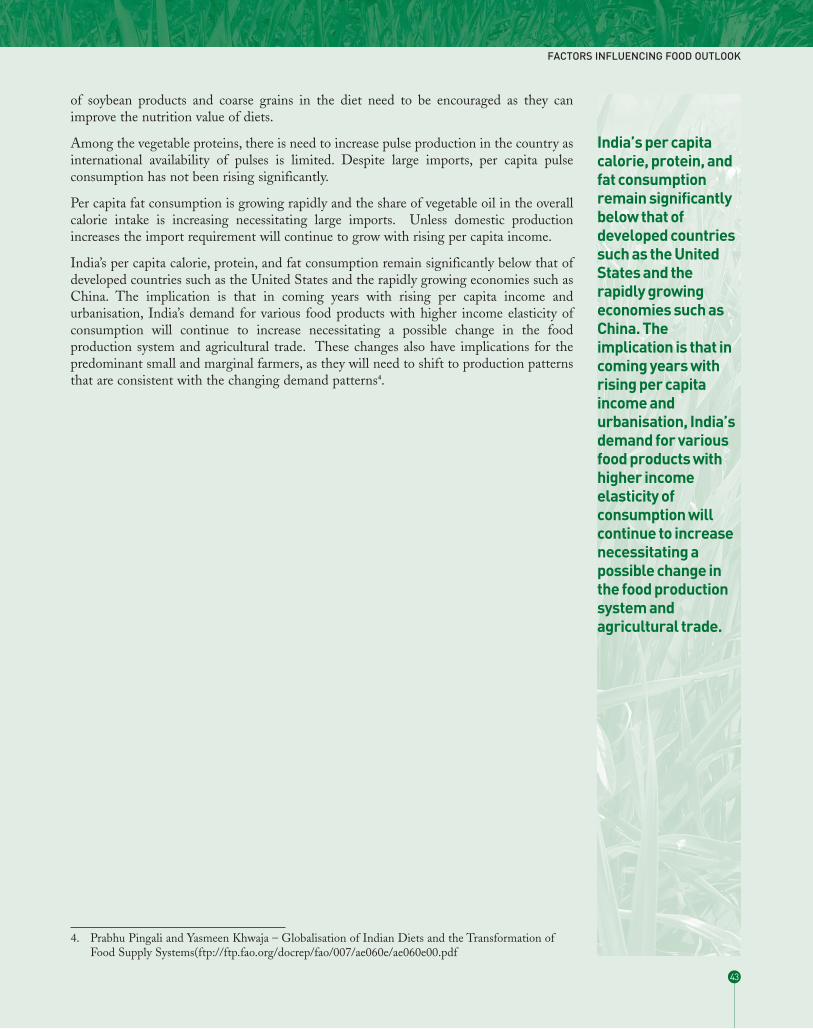
of soybean products and coarse grains in the diet need to be encouraged as they canimprove the nutrition value of diets.
Among the vegetable proteins, there is need to increase pulse production in the country asinternational availability of pulses is limited. Despite large imports, per capita pulseconsumption has not been rising significantly.
Per capita fat consumption is growing rapidly and the share of vegetable oil in the overallcalorie intake is increasing necessitating large imports. Unless domestic productionincreases the import requirement will continue to grow with rising per capita income.
India’s per capita calorie, protein, and fat consumption remain significantly below that ofdeveloped countries such as the United States and the rapidly growing economies such asChina. The implication is that in coming years with rising per capita income andurbanisation, India’s demand for various food products with higher income elasticity ofconsumption will continue to increase necessitating a possible change in the foodproduction system and agricultural trade. These changes also have implications for thepredominant small and marginal farmers, as they will need to shift to production patternsthat are consistent with the changing demand patterns4.
FACTORS INFLUENCING FOOD OUTLOOK
43
India’s per capitacalorie, protein, andfat consumptionremain significantlybelow that ofdeveloped countriessuch as the UnitedStates and therapidly growingeconomies such asChina. Theimplication is that incoming years withrising per capitaincome andurbanisation, India’sdemand for variousfood products withhigher incomeelasticity ofconsumption willcontinue to increasenecessitating apossible change inthe food productionsystem andagricultural trade.
4. Prabhu Pingali and Yasmeen Khwaja – Globalisation of Indian Diets and the Transformation of Food Supply Systems(ftp://ftp.fao.org/docrep/fao/007/ae060e/ae060e00.pdf

III.3 Policy Developments during October 2013–January2014A summary of the policy initiatives on agriculture and related sectors taken during the pastquarter is provided in Table III.2.
AGRICULTURAL OUTLOOK AND SITUATION ANALYSIS REPORTS
44
Table III.2: Agri-Policy Developments during October 2013 to January 2014Sl. No. Product Date/ Month Policy Instrument Details1. Food grains 30/10/13 CCEA The MEP on wheat was lowered to $260 per
Decision tonne from $300 per tonne.Remarks: To make Indian wheat competitive in the global market. 2. Vegetable oils 09/01/14 CCEA The import duty on refined oils was increased
Decision from 7.5% to 10%.Remarks: To protect the interest of domestic vegetable oil refiners from cheaper imports of refined palm oil andproducts.3. Sugar 26/12/13 CCEA Cabinet gave its final approval to the proposal to
Decision provide interest subvention for financial assistance to the sugar industry for effecting cane price payments.
Remarks: For effecting cane price payments by the sugar mills to farmers.4. Sugar 12/11/13 DGFT Enhancement in registered quantity for export
of sugar from 25,000 tonnes to 50,000 tonnes.5. Sugar 12/2/14 CCEA Decides to provide an export subsidy of
Rs 3,333 per tonne for exports of 4 million tonnes of raw sugar in two years.
Remarks: Both the measures to encourage sugar exports. 6. Essential 27/09/2013 Essential The stockholding limits imposed on the
commodities Commodities essential items i.e. of pulses, edible oils and (pulses, edible Act edible oilseeds extended up to 30.09.2014 vide oils, oilseeds, etc.) Central Order dated 27.09.2013, of rice and
paddy up to 30.11.2014 vide Central Order dated 29.11.2013.
Remarks: To control food inflation.7. Onion 26/12/2013 DGFT Minimum Export Price of onion lowered to $150
per tonne from $350 per tonne.Remarks: To facilitate exports.

IV.1 Rice
IV.1.1 Production heading for a recordDespite a favourable monsoon in 2013, the 1st Advance Estimate of Crop Production bythe Ministry of Agriculture released in late September 2013 pegged 2013–14 kharif riceproduction half a million tonnes lower than last year at 92.3 million tonnes reflecting poorrainfall in eastern and north eastern India. Typically the 1st advance estimate of kharif ricecrop is significantly below the final estimate and hence an upward revision in 2013–14 riceproduction was expected in the ensuing rounds. However, considering the heavy damageto the rice crop in Andhra Pradesh caused by the devastating cyclone Phailin in Octoberand subsequent heavy rains, the upward revision in kharif rice production was likely to bemodest, and the 2nd Advance Estimates released on February 14, 2014 actually revised thekharif production estimates downward to 92 million tonnes. Our own forecast based ontrend and rainfall variables arrived at before the 2nd AE are at 94–98 million tonnes. Rabirice planting through early January this year is ahead of the previous year’s level, thanks toimproved irrigation availability following copious monsoon rains and an increasedemphasis on increasing rabi rice production. Assuming normal growing conditions andsome increase in planted area, rabi rice production is forecast at 12.5–12.7 million tonnesabout one million tonnes more than last year, taking total 2013–14 rice production at106.5–110.8 million tonnes compared to 105.2 million tonnes in 2012–13 (RE released inFebruary 2014) and the previous record production of 105.3 million tonnes in 2011–12.The official 2nd Advance Estimates place rice production for 2013–14 at 106.19 milliontonnes.
IV.1.2 Consumption growth higherWholesale price index-based year-on-year rice inflation, after peaking over 21 per cent inAugust 2013, showed signs of easing, declining to 13.6 per cent in December 2013 (FigureIV.1.1). A modest increase in the MSP for the 2013–14 crop and outlook for an excellentcrop this year have not helped in containing the price rise to below double digit level inthe current year. The paddy MSP for MY 2013–14 was increased by a modest 4.8 percent, significantly below the 2012–13 increase of 15 to 16 per cent. What is necessary forthe large output to translate into moderate prices is the supply of grain in the market.Stocks with the government alone have not been adequate to bring down high rate ofinflation.
Despite higher prices, rice consumption based on the food balance sheet analysis isestimated to have increased by around 3 per cent in MY 2012–13 to 95 million tonnes.However, this consumption estimate could be somewhat on the higher side as the balancesheet approach does not take into account the change in privately-held stocks for whichestimates are not available. Based on similar analysis and assuming no significant changein government stocks as of the end of MY 2013–14, rice consumption in MY 2013–14 is
PART IV
Commodity Outlook Assessment
45
Assuming normalgrowing conditionsand some increase inplanted area, rabirice production isforecast at 12.5–12.7million tonnes aboutone million tonnesmore than last year,taking total 2013–14rice production at106.5–110.8 milliontonnes compared to105.2 million tonnesin 2012–13 (RevisedEstimates releasedin February 2014)and the previousrecord production of105.3 million tonnesin 2011–12. Theofficial 2nd AdvanceEstimates place riceproduction for2013–14 at 106.19million tonnes.
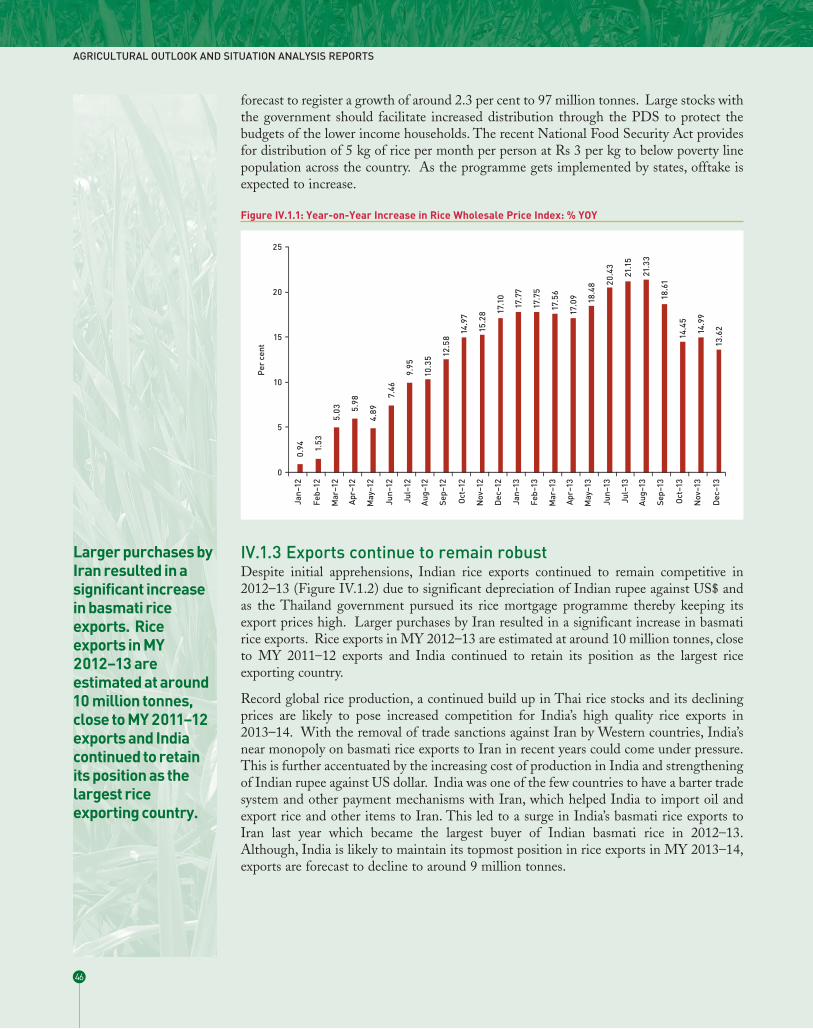
forecast to register a growth of around 2.3 per cent to 97 million tonnes. Large stocks withthe government should facilitate increased distribution through the PDS to protect thebudgets of the lower income households. The recent National Food Security Act providesfor distribution of 5 kg of rice per month per person at Rs 3 per kg to below poverty linepopulation across the country. As the programme gets implemented by states, offtake isexpected to increase.
IV.1.3 Exports continue to remain robustDespite initial apprehensions, Indian rice exports continued to remain competitive in2012–13 (Figure IV.1.2) due to significant depreciation of Indian rupee against US$ andas the Thailand government pursued its rice mortgage programme thereby keeping itsexport prices high. Larger purchases by Iran resulted in a significant increase in basmatirice exports. Rice exports in MY 2012–13 are estimated at around 10 million tonnes, closeto MY 2011–12 exports and India continued to retain its position as the largest riceexporting country.
Record global rice production, a continued build up in Thai rice stocks and its decliningprices are likely to pose increased competition for India’s high quality rice exports in2013–14. With the removal of trade sanctions against Iran by Western countries, India’snear monopoly on basmati rice exports to Iran in recent years could come under pressure.This is further accentuated by the increasing cost of production in India and strengtheningof Indian rupee against US dollar. India was one of the few countries to have a barter tradesystem and other payment mechanisms with Iran, which helped India to import oil andexport rice and other items to Iran. This led to a surge in India’s basmati rice exports toIran last year which became the largest buyer of Indian basmati rice in 2012–13.Although, India is likely to maintain its topmost position in rice exports in MY 2013–14,exports are forecast to decline to around 9 million tonnes.
AGRICULTURAL OUTLOOK AND SITUATION ANALYSIS REPORTS
46
Larger purchases byIran resulted in asignificant increasein basmati riceexports. Riceexports in MY2012–13 areestimated at around10 million tonnes,close to MY 2011–12exports and Indiacontinued to retainits position as thelargest riceexporting country.
Figure IV.1.1: Year-on-Year Increase in Rice Wholesale Price Index: % YOY

IV.1.4 StocksGovernment rice stocks (including rice equivalent of un-milled paddy rice) on January 1,2014, stood at 30.2 million tonnes compared to 29.7 million tonnes a year ago. This ismore than the government’s desired January 1 minimum buffer stock plus strategic reservelevel of 13.8 million tonnes (Figure IV.1.3). Despite the possibility of a marginal declinein rice procurement in 2013–14 from the previous year’s procurement of 34 million tonnes,as per the indications from current trends, stocks are at comfortable level to ensure suppliesto PDS.
COMMODITY OUTLOOK ASSESSMENT
47
Despite thepossibility of amarginal decline inrice procurement in2013–14 from theprevious year’sprocurement of 34million tonnes, asper the indicationsfrom current trends,stocks are atcomfortable level toensure supplies toPDS.
Table IV.1.1: Government Operations in RiceMarketing Year Govt MSP for PDS Monthly PDS Issue Price for Beginning(Oct–Sep) Procurement Paddy Offtake Milled Rice Stocks
(Million Tonnes) (Rs per tonne) (Million (Rs per tonne) (Milliontonnes)* tonnes)
Common Grade A APL Grade A BPL AAY
2002–03 16.4 (22.8) 5500 5800 2.175 8300 5650 3000 15.8
2003–04 22.9 (25.8) 5500 5800 2.092 8300 5650 3000 5.2
2004–05 24.7 (29.7) 5600 5900 1.733 8300 5650 3000 6.1
2005–06 27.6 (30.1) 5700 6000 2.000 8300 5650 3000 4.8
2006–07 25.1 (26.9) 6200 6500 2.067 8300 5650 3000 6.0
2007–08 28.7 (29.7) 7450 7750 2.100 8300 5650 3000 5.5
2008–09 34.1 (34.4) 9000 9300 2.058 8300 5650 3000 7.9
2009–10 31.4 (35.2) 10000 10300 2.300 8300 5650 3000 15.3
2010–11 34.2 (35.6) 10000 10300 2.494 8300 5650 3000 18.4
2011–12 35.0 (33.2) 10800 11100 2.677 8300 5650 3000 20.4
2012–13 34.0 (32.6) 12500 12800 2.719 8300 5650 3000 23.4
2013–14 13100 13450 8300 3000** 3000** 23.1
* Fiscal year basis ** Under NFSANote: Figures in parentheses per cent of production.
Figure IV.1.2: Rice Export Price – India vis-a-vis International
Source: FAO.

AGRICULTURAL OUTLOOK AND SITUATION ANALYSIS REPORTS
48
Figure IV.1.3: Government Rice Stocks – Actual vs. Buffer Norm (Million Tonnes)
Table IV.1.2: Supply and Demand Balance for Rice (Thousand Tonnes)Rice 2010–11 2011–12 2012–13E 2013–14F
Oct–Sep Oct–Sep Oct–Sep Oct–Sep
Production 95,980 105,300 104,400 106,500
Beginning Stocks 18,444 20,360 23,370 23,000
Imports 0 0 0 0
Total Supply 114,424 125,660 127,770 129,500
Exports 2,774 10,400 10,000 9,000
Food Use 89,090 89,890 92,270 95,400
Seed, Feed, Waste, Other 2,200 2,000 2,500 2,600
Total Use 91,290 91,890 94,770 98,000
Ending Stocks 20,360 23,370 23,000 22,500
Total Distribution 114,424 125,660 127,770 129,500
Stocks to Use Ratio % 22 25 24 23
Government Rice Operation
Beginning Stocks 18,444 20,360 23,370 23,000
Imports 0 0 0 0
Procurement 34,196 35,000 34,000 33,500
Total Availability 52,640 55,360 57,370 56,500
Offtake 1/ 32,280 31,990 34,370 34,000
Exports 0 0 0 0
Ending Stocks 20,360 23,370 23,000 22,500
Total Distribution 52,640 55,360 57,370 59,000
Note: Stocks are only government stocks. Total use is the residual and includes private stocks change. We have taken lower end of range ofproduction forecasts for 2013–14.E- Estimate; F- Forecast. 1/ Residual, includes PDS and other programmes +storage losses

IV. 2 Wheat
IV.2.1 2014 production outlook upbeatProduction outlook for the 2014 wheat crop (MY 2014–15) appears promising. Lateseason monsoon rains in most wheat growing regions, particularly Madhya Pradesh,Rajasthan and Bihar replenished soil moisture providing a favourable planting condition.Progressive planting data shows wheat sown area this year through mid-January is aheadof last year’s level by almost 1 million hectares at 31.4 million hectares, a record high.Growing conditions so far have been generally favourable characterised by cooltemperatures topped up by intermittent rains. Improved water levels in most irrigationdams and wells should provide a cushion in case winter rains turns out to be belowoptimum. Fertilizer supply situation is comfortable and pest/disease incidents havegenerally remained below the Economic Threshold Level for most crops.
Wheat yield will ultimately be influenced by weather developments during the growingperiod, particularly duration of the winter season and temperature regime during thecrucial grain filling stage in February. A prolonged cool weather and no significant increasein surface temperatures at the grain filling stage typically contribute to higher yields andbetter grain quality. However, rains at harvest time could negatively impact both quantityand quality of the crop. Assuming favourable weather condition to continue throughharvest, a normal wheat yield of around 3.1 tonne per hectare is expected taking 2014wheat production forecast to a record 97.5 million tonnes compared to 93.5 million tonneslast year and the previous record 94.9 million tonnes in 2011–12. The 2nd advanceestimates by the Ministry of Agriculture place wheat production in 2013–14 at 95.6million tonnes, which, however, is likely to be revised upward later.
IV.2.2 Consumption upBased on food balance sheet analysis, wheat consumption in MY 2013–14 is estimated tohave increased significantly due to lager availability of wheat in the open market followinglower wheat procurement by the government, despite lower offtake through the PDS.Although, the government had allocated 10 million tonnes of wheat for open market sale(OMS) at subsidised rates, the response so far has been lukewarm with only 480,000tonnes of wheat lifted during April to October 2013 indicating larger wheat availability inthe open market. OMS is likely to get better response in coming months as open marketavailability declines. During 2012–13 about 7 million tonnes of wheat were sold under theOMS. The monthly offtake of wheat from government stocks for PDS, open market sale,and other welfare programmes (excluding exports) averaged 2.5 million tonnes per monthin 2012–13. Monthly offtake in MY 2013–14 during April through October averaged 1.9million tonnes. Government wheat procurement after scaling a record high of 38.2 milliontonnes in MY 2012–13 declined sharply to around 25.0 million tonnes in MY 2013–14,leaving larger quantities of wheat in the open market.
COMMODITY OUTLOOK ASSESSMENT
49
Wheat yield willultimately beinfluenced byweatherdevelopmentsduring the growingperiod, particularlyduration of thewinter season andtemperature regimeduring the crucialgrain filling stage inFebruary.
Based on foodbalance sheetanalysis, wheatconsumption in MY2013–14 isestimated to haveincreasedsignificantly due tolager availability ofwheat in the openmarket followinglower wheatprocurement by thegovernment, despitelower offtakethrough the PDS.

IV.2.3 Wheat price inflation moderatesYear-on-year wheat price inflation measured by wholesale price remained subdued sincethe beginning of the 2013–14 marketing year, declining to around 7 per cent in recentmonths compared to over 20 per cent a year ago reflecting larger wheat availability in theopen market. The government decision to release 10 million tonnes of wheat in the openmarket and the outlook for a record crop in 2014 should keep prices under check incoming months and even during MY 2014–15. For MY 2014–15 the government hasannounced a modest increase in the MSP from Rs 13,500 in MY 2013–14 to Rs 14,000per tonne, which should also help to keep wheat prices under check next year.
AGRICULTURAL OUTLOOK AND SITUATION ANALYSIS REPORTS
50
Year-on-year wheatprice inflationmeasured bywholesale priceremained subduedsince the beginningof the 2013–14marketing year,declining to around 7per cent in recentmonths compared toover 20 per cent ayear ago reflectinglarger wheatavailability in theopen market.
Figure IV.2.1: Wheat Price Inflation: WPI (%YOY)
Table IV.2.1: Government Operations in WheatMarketing Year MSP Govt PDS PDS Issue Price Beginning(Apr–Mar) (Rs per tonne) Procurement Monthly (Rs Per tonne) Stocks
(Million Tonnes) Offtake* (Million(Million tonnes)tonnes)
APL BPL AAY
2002–03 6200 19.0 (26.1) 2.21 6100 4150 2000 26.0
2003–04 6300 15.8 (24.0) 2.03 6100 4150 2000 15.6
2004–05 6300 16.8 (23.3) 1.41 6100 4150 2000 6.9
2005–06 6400 14.8 (21.6) 1.39 6100 4150 2000 4.1
2006–07 6500 9.2 (13.3) 0.99 6100 4150 2000 2.0
2007–08 8500 11.1 (14.6) 1.02 6100 4150 2000 4.7
2008–09 10000 22.7 (28.9) 1.24 6100 4150 2000 5.8
2009–10 10800 25.3 (31.4) 1.87 6100 4150 2000 13.4
2010–11 11000 22.5 (25.9) 1.93 6100 4150 2000 16.1
2011–12 11700 28.3 (32.0) 2.02 6100 4150 2000 15.3
2012–13 12850 38.1 (40.1) 2.51 6100 4150 2000 20.0
2013–14 13500 25.1 (27.1) 6100 2000** 2000** 24.2
*Fiscal year basis ** Under NFSA *** BudgetedNote: Figures in parentheses per cent of production.

IV.2.4 Export outlook less promisingIndian wheat exports faced increased competition in 2013–14 because of improved globalwheat production and lower prices. Government’s minimum export price (MEP) of $300per tonne for wheat allocated from government stocks for exports to governmentparastatals was significantly above the global prices for similar quality of wheat resulting ina slowdown in exports. This prompted the government to lower the MEP to $260 pertonne effective October 30, 2013, which combined with a strengthening of global wheatprices has resulted in some pick up in wheat exports from government stocks in recentmonths. Government agencies designated to export wheat from government-held stocksagainst the two million tonnes export quota announced in August 2013 have so far floatedtenders for about 1.3 million tonnes which are likely to be shipped by March 31, 2014.Exports during April to October 2013 were around 3.7 million tonnes, including 1.5million tonnes from government stocks through government parastatals. Thus, total MY2013–14 exports are likely to be about 5 million tonnes.
Wheat exports in MY 2014–15 will continue to face increased competition from higherglobal production, particularly in the Black Sea region which directly competes withIndian wheat. Strengthening of Indian rupee against US dollar will be a negative factorimpacting exports. Thus, if exports are to take place, the government will have to maintainthe MEP at $260 per tonne or lower, and therefore, below the government’s economic costof about $325 per tonne. Exports by private trade will continue to be limited due to lackof parity with global prices (Figure IV.2.2). Currently, we forecast MY 2014–15 wheatexports at 4 million tonnes.
IV.2.5 Stocks downFollowing a steep decline in government wheat procurement this marketing year,government wheat stocks have declined, with January 1, 2014, stocks at 31 million tonnescompared to 34.4 million tonnes a year ago (Figure IV.2.3). Stocks are likely to decline to
COMMODITY OUTLOOK ASSESSMENT
51
Exports during Aprilto October 2013were around 3.7million tonnes,including 1.5 milliontonnes fromgovernment stocksthrough governmentparastatals. Thus,total MY 2013–14exports are likely tobe about 5 milliontonnes.
Figure IV.2.2 Indian Wholesale Wheat Price vis-à-vis US SRW Wheat Price FOB
Source: US Price – World Bank; Indian Price – Department of Consumer Affairs.Note: US SRW has typically sells at a premium over Indian wheat. Indian FOB price will be higher than the indicated Delhi wholesale price by around$40 per tonne on account of transportation cost and other handling charges.

around 19 million tonnes by the end of the 2013–14 marketing year on April 1, 2014, from24.2 million tonnes on April 1, 2013. The supply demand balances for wheat with forecastfor MY 2014–15 are summarised in Table IV.2.2.
AGRICULTURAL OUTLOOK AND SITUATION ANALYSIS REPORTS
52
Figure IV.2.3: Government Wheat Stocks-Actual vs. Buffer Norms
Table IV.2.2: Supply and Demand Balance for Wheat (Thousand Metric Tonnes)Item 2010–11 2011–12 2012–13 E 2013–14F
Apr–Mar Apr–Mar Apr–Mar Apr–Mar*
Production 80,800 86,870 94,880 92,460
Beginning Stocks 16,125 15,364 19,952 24,200
Imports 188 2 0 0
Total Supply 97,113 102,236 114,832 116,660
Exports 68 872 6,800 5,000
Food Use 74,920 76,200 78,332 87,660
Seed, Feed, Waste, Other 6,761 5,212 5,500 6,000
Total Use 81,681 81,412 83,832 93,660
Ending Stocks 15,364 19,952 24,200 18,000
Total Distribution 97,113 102,236 114,832 116,660
Stocks to Use Ratio % 19 25 29 20
Govt. Wheat Operation
Beginning Stocks 16,125 15,364 19,952 24,200
Imports 0 0 0 0
Procurement 22,347 28,335 38,148 25,100
Total Availability 38,472 43,699 58,100 49,300
PDS & other Offtake 23,072 24,162 30,140 29,800
Exports 0 100 3,100 1,500
Unaccounted 36 -515 660 0
Total Distribution 23,108 23,747 33,100 31,300
Ending Stocks 15,364 19,952 24,200 18,000
E - Estimate; F - ForecastSource: Food Corporation of India, Directorate of Economics and Statistics, NCAER Estimate.Note: Stocks are government stocks. Total use is residual and would include private stocks change.

IV.3 Coarse Grains
IV.3.1 Production likely to be higherThe government’s 1st AE pegged 2013–14 kharif coarse grain production at 31 milliontonnes (17.8 million tonnes of maize, 8.7 million tonnes of bajra, 2.6 million tonnes ofjowar, and 2 million tonnes of minor millets) against the 2012–13 output of 29.5 milliontonnes (16 million tonnes of maize, 8.7 million tonnes of bajra, 2.8 million tonnes of jowar,and 2 million tonnes of minor millets). However, considering the favourable monsoonrains during June–September 2013, the 1st advance estimate of the 2013–14 kharifproduction of bajra and jowar appears to be an under estimate. Although the 1st AE ofkharif maize appears to be close to our initial estimate of 17.7 million tonnes (provided inthe quarterly report of November 2013), cyclone Phailain followed heavy rains hasreportedly caused some damage to the ready to harvest maize crop in Andhra Pradesh.Our revised forecast for coarse grain production in kharif season of 2013–14 is 33.2–34.3million tonnes. The official 2nd Advance Estimates of kharif coarse grain production is30.11 million tonnes, with the main difference being in the output of bajra. The secondAE places bajra production at 8.8 million tonnes, close to the revised estimates of 8.74million tonnes for 2012–13. The forecast provided in the present report are at 11.2–11.3million tonnes.
The late monsoon rains this year provided a favourable planting condition for rabi coarsegrains, which include mostly maize and some jowar and barley. Progressive planting dataas on January 17 shows a 7 per cent increase in rabi maize sown area at around 1.4 millionhectares. Assuming a normal yield, production is expected to increase by 500,000 tonnesover the 2013 rabi production at around 6.5 million tonnes, taking total maize productionto 23.5 million tonnes, a record high. Production of barley and rabi jowar is expected tobe more or less at the same level as in 2013. Total 2013–14 coarse grain production is thusforecast at 43.9–45.5 million tonnes compared to the revised estimate of 40.1 milliontonnes in 2012–13 and the 2nd AE of 41.64 million tonnes.
Among all coarse grain crops in India, maize has recorded the highest growth withproduction almost doubling over the past decade, while production of most other coarsegrains has stagnated (Figure IV.3.1). Maize now ranks as the third most important foodgrain crop in India after rice and wheat. One of the reasons for the growth in maizeproduction over the last decade is the major emphasis given by government and privatesector towards development of single cross hybrids (SCHs). Since 2000, more than 80SCHs have been developed and released, which have been widely adopted by farmers withthe result that maize productivity recorded a significant improvement. Over the pastdecade maize yield has increased by almost 40 per cent to 4 tonnes per hectare with rabiyield increase contributing the most. The rapid growth in the poultry and livestock sectorand industrial use of maize led to increased demand for maize providing further impetusfor maize production.
The major challenge facing sorghum and millet research and development in India is toprovide technologies that will enable the agricultural sector to affect transformation of“subsistence farming” to a sustainable “market oriented” enterprise successfully competingwith rest of the crops. This requires that research programmes in these crops, in additionto resolving commodity production constraints, need to focus more on matchingagricultural and processing technologies to market opportunities, which provide additionalfarm income and create off-farm employment in agriculture-related enterprises.
COMMODITY OUTLOOK ASSESSMENT
53
The official 2ndAdvance Estimatesof kharif coarsegrain production is30.11 million tonnes,with the maindifference being inthe output of bajra.The second AEplaces bajraproduction at 8.8million tonnes, closeto the revisedestimates of 8.74million tonnes for2012–13. Theforecast provided inthe present reportare at 11.2–11.3million tonnes.
Among all coarsegrain crops in India,maize has recordedthe highest growthwith productionalmost doubling overthe past decade,while production ofmost other coarsegrains hasstagnated.

IV.3.2 Consumption, trade and priceThe demand for coarse grains as a food source is shrinking as, with increasing consumerpreference for and larger availability of wheat and rice. Food use of maize has shrunk,there has been a significant increase in the non-food usage of corn – mainly for feed andstarch and starch derivatives in recent years. Although, the government has includedcoarse grains in the list of commodities to be supplied at highly subsidised rates (Rs 1 perkg) under the National Food Security Act, due to stagnant production and in the absenceof an effective procurement mechanism no significant increase in food use of coarse grainis expected in the short run.
According to industry sources 63–64 per cent of annual maize production goes for feed useand about 16 per cent for industrial use, mainly starch – a significant increase from 50 percent for feed use and 5 to 6 per cent for industrial use a decade ago. A growing poultrysector is generating increased demand for maize for feed use. Although maize has variedindustrial uses such as High Fructose Corn Syrup, fuel alcohol, etc. there is very little, ifany, use of maize for such products in India. The industrial use of other coarse grains,except barley, is also limited. While the feed use of barley is declining, there is increasingdemand for barley from the malt industry driven by increasing consumption of beer andprocessed food.
Maize prices have declined sharply since the beginning of the 2013–14 marketing yearreflecting higher production and lower international prices (Figure IV.3.2). Although theMSP for maize was set at Rs 13,100 per tonne for MY 2013–14, prices in some majorproducing areas have dipped below the support level. With expected easy domesticavailability of maize due to higher production and lower export prospects, prices are likelyto remain subdued in MY 2013–14.
AGRICULTURAL OUTLOOK AND SITUATION ANALYSIS REPORTS
54
According toindustry sources63–64 per cent ofannual maizeproduction goes forfeed use and about16 per cent forindustrial use,mainly starch – asignificant increasefrom 50 per cent forfeed use and 5 to 6per cent forindustrial use adecade ago.
Figure IV.3.1 Coarse Grain Production Trend (Million Tonnes)

A consistent maize supplier in recent years, India has captured a major share of theSoutheast Asian corn export market. India offers the cheapest corn in the region and iswell located to provide short-term delivery to countries like Malaysia and Indonesia.Maize exports in MY 2012–13 were around 4.8 million tonnes compared with 4.6 milliontonnes in MY 2011–12. However, exports are likely to decline significantly in MY2013–14 due to lower international prices in response to record production (FigureIV.3.2). Currently we forecast MY 2013–14 exports at 3.0 million tonnes.
IV.4 Pulses
IV.4.1 ProductionThe government’s 1st AE pegs 2013–14 kharif season pulse production at 6 million tonnesclose to the 2012–13 kharif season production of 5.9 million tonnes and one milliontonnes below the government’s production target. The official 2nd AEs place kharif pulsesproduction in 2013–14 at 6.25 million tonnes.
Outlook for the 2014 rabi season pulse crop is promising both due to expansion in sownarea and better growing conditions compared to 2013. The government’s progressiveplanting data shows area sown to pulses through mid-January is about 700,000 hectaresmore compared with 2013 at 15.6 million hectares. A decline in rabi season’s urd and
COMMODITY OUTLOOK ASSESSMENT
55
A consistent maizesupplier in recentyears, India hascaptured a majorshare of theSoutheast Asian cornexport market. Indiaoffers the cheapestcorn in the regionand is well located toprovide short-termdelivery to countrieslike Malaysia andIndonesia.
The government’sprogressive plantingdata shows areasown to pulsesthrough mid-January is about700,000 hectaresmore compared with2013 at 15.6 millionhectares.
Figure IV.3.2: Maize price comparison US vs. India (US$/tonne)
Table IV.3.1: Demand Supply Balance Sheet for Maize (Thousand Tonnes)(Oct–Sep) 2010–11 2011–12 2012–13 2013–14 F
Opening stocks 200 600 600 550
Production 21,730 21,760 22,230 23,500
Imports 19 3 10 0
Domestic Availability 21,949 22,363 22,840 24,050
Exports 3,526 4,600 4,800 3,000
Domestic Utilisation 17,823 17,163 17,490 19,850
Closing Stocks 600 600 550 1,200

mung area was more than offset by increase in other major rabi pulses area such as gram,lentil, and peas with gram sown area reported at a record 10.2 million hectares almost onemillion hectares more than in 2013. Growing conditions so far have been normal.Assuming normal weather conditions through harvest, rabi pulse production is forecast at13 million tonnes compared to 12.5 million tonnes in 2013. For the year as a whole, theofficial 2nd AEs place pulses production at 19.77 million tonnes. Projections based ontrend and rainfall data lead to our forecast of 19.4–19.7 million tonnes, close to the 2ndAE.
Increases in area and improvement in yields, albeit modest, have contributed to higherpulse production in recent years (Figure IV.4.1). Low pulse yield in India is attributed topoor spread of improved varieties and technologies, abrupt climatic changes, vulnerabilityto pests and diseases, and generally declining growth rate of total factor productivity. Mostof the increase in pulse production in recent years has been in gram (Figure IV.4.2).
In order to give a much needed boost to pulse production, the government has beenincreasing the MSP of pulses significantly in recent years. However, the increase in MSPduring 2013–14 was modest. MSP for both arhar (tur) and urd was fixed at Rs 4,300 perquintal, and for mung at Rs 4,500 per quintal for the 2013–14 marketing year, an increaseof 11.7 per cent in the case of tur but no change in the others over the previous year.However, these changes marked an increase of 87 per cent, 71 per cent and 63 per cent,respectively, over the past four years. Among rabi pulses MSP for gram for MY 2014–15was fixed at Rs 3,100 per quintal and masur at Rs, 2,950 per quintal, although a modestincrease over the MY 2013–14 level of Rs 3,000 and Rs 2,900 per quintal, nevertheless amassive increase of 76 per cent and 58 per cent, respectively, since 2010–11 (FigureIV.4.3).
AGRICULTURAL OUTLOOK AND SITUATION ANALYSIS REPORTS
56
Increases in areaand improvement inyields, albeitmodest, havecontributed to higherpulse production inrecent years.
Figure IV.4.1: Trend in Area, Yield, and Production of Pulses

IV.4.2 Consumption, trade and priceHigher production combined with larger imports has resulted in a modest increase in pulseconsumption estimated at around 50 grams per day in 2012–13 compared to less than 40grams prior to 2012–13. This level of consumption is estimated to have been maintainedin 2013–14. Lager imports of dry peas in recent years due its lower price have resulted inits increased share in the domestic pulse consumption.
COMMODITY OUTLOOK ASSESSMENT
57
Figure IV.4.2: Trend in Pulse Production by Type
Figure IV.4.3: Trend in Minimum Support Prices for Pulses
2007–08 2008–09 2009–10 2010–11 2011–12 2012–13 2013–14 2014–15
Tur 1550 2000 2300 3000 3200 3850 4300
Mung 1700 2520 2760 3170 3500 4400 4500
Urad 1700 2520 2520 2900 3300 4300 4300
Gram 1445 1600 1730 1760 2100 2800 3000 3100
Masur 1545 1700 1870 1870 2250 2800 2900 2950

The increasing mismatch between production and consumption of pulses has resulted inlarger imports of pulses in recent years. Imports of pulses in 2012–13 (Apr–Mar) were arecord 4.0 million tonnes an increase of 500,000 tonnes over 2011–12. 2012–13 importsincluded 1.37 million tonnes of dry peas and dun peas (mutter), 506,000 tonnes of pigeonpea (tur), 642,000 tonnes of green pea (moong), 698,000 tonnes of chick peas, 506,000tonnes of lentil (masur), 84,000 tonnes of kidney beans (rajma), 180,000 tonnes of otherbeans and 24,000 tonnes of other pulses. Imports in 2013–14 through November 2013 at2 million tonnes were about 500,000 tonnes behind imports during the correspondingperiod of 2012–13 reflecting larger domestic production and higher cost of importedpulses due to the depreciation of Indian rupee against US$. Total imports in 2013–14 areprojected at 3.5 million tonnes.
Domestic price inflation for pulses as a group measured by Wholesale Price Indexremained in the negative territory since June 2013, largely due a significant decline in gramprices, the major pulse. Price inflation in other pulses mainly mung and masur, althoughshowing some declining trend, remained high in 2013 (Figure IV.4.4). Due to expectedhigher production of gram in 2014, price inflation of pulses as a group is likely to remainsubdued in 2014–15, unless the 2014 kharif season pulse crop declines significantly.
AGRICULTURAL OUTLOOK AND SITUATION ANALYSIS REPORTS
58
The increasingmismatch betweenproduction andconsumption ofpulses has resultedin larger imports ofpulses in recentyears. Imports ofpulses in 2012–13(Apr–Mar) were arecord 4.0 milliontonnes an increase of500,000 tonnes over2011–12.
Domestic priceinflation for pulsesas a group measuredby Wholesale PriceIndex remained inthe negativeterritory since June2013, largely due asignificant decline ingram prices, themajor pulse.
Figure IV.4.4: Wholesale Price Inflation Trend in Pulses (% change in 2013 over 2012)
All Pulses Gram Arhar Mung Masur Urad
Jan 15.9 22.5 7.9 19.6 18.1 -0.4
Feb 14.0 16.4 11.4 17.8 19.1 3.2
Mar 10.8 7.6 17.1 17.1 20.2 5.5
Apr 10.5 4.5 20.6 19.1 23.0 6.8
May 5.9 -2.2 16.6 18.5 15.8 7.0
Jun 1.6 -9.2 14.2 20.1 15.6 4.6
Jul -7.4 -19.8 5.1 12.1 11.7 0.8
Aug -14.7 -27.2 -2.6 3.4 6.4 -5.4
Sep -13.4 -25.5 -2.8 8.8 6.1 -7.1
Oct -10.7 -23.9 0.6 14.3 6.0 -2.7
Nov -10.6 -26.2 3.9 14.5 6.9 3.9
Dec -7.2 -23.5 9.2 16.9 12.5 5.2

IV.5 Edible Oils
IV.5.1 Rabi oilseed prospects brightWith favourable weather conditions and larger sown acreage, the country is likely toharvest a bumper mustard production this year. According to the latest data available fromthe Ministry of Agriculture, so far mustard has been sown in 7.1 million hectares this yearas against 6.7 million hectares, up by 6.0 per cent compared to the rabi season of last year.Cool temperatures and morning dew favour crop growth, which can further improve witha couple of showers in north India. Higher sowing is reported in Rajasthan, whichcontributes over 40 per cent of total mustard output in the country. Sowing of various rabioilseed crops is as follows:
The 2nd advance estimates of agricultural production in 2013–14 place total rabi oilseedproduction at 11 million tonnes, comprising of 8.3 million tonnes of rapeseed and mustardand the balance of output contributed by other oilseeds such as safflower and rabigroundnut. Our projection of production of rapeseed and mustard in 2013–14 is 8.4million tonnes, slightly higher than the 2nd AE. The 2013–14 major nine oilseedproduction is estimated under 2nd AE at 33 million tonnes, comprising of 22 milliontonnes of kharif production and 11 million tonnes of rabi oilseeds. The official finalestimate of production of nine major oilseeds in 2012–13 is 30.9 million tonnes. Heavyrainfall towards the end of the monsoon season and immediately following it in 2013–14led to some decline in the reduction of soybean output. Otherwise, the total production ofoilseeds in 2013–14, already a likely record high, would have been even higher. Theprevious peak in the production level of nine major oilseeds was 32.5 million tonnes in2010–11.
COMMODITY OUTLOOK ASSESSMENT
59
With favourableweather conditionsand larger sownacreage, the countryis likely to harvest abumper mustardproduction this year.
The 2nd advanceestimates ofagriculturalproduction in2013–14 place totalrabi oilseedproduction at 11million tonnes,comprising of 8.3million tonnes ofrapeseed andmustard and thebalance of outputcontributed by otheroilseeds such assafflower and rabigroundnut.
Table IV.4.1: Demand and Supply Balance Sheet for Pulses (‘000 tonnes)Total pulses 2010–11 2011–12 2012–13 2013–14
Production 18,240 17,090 18,340 19,770
Imports 2,780 3,500 4,010 3,500
Total supply 21,020 20,590 22,350 23,270
Total export 209 175 200 200
Domestic use 20,811 20,415 22,150 23,070
Total utilisation 21,020 20,590 22,350 23,270
% imports to production 15.2 20.5 21.7 17.8
TableIV.5.1: Sowing of Rabi Oilseeds (lakh hectare): 2013 and 2014Crop Jan 30, 2014 Jan 30, 2013 % Change
Rapeseed/Mustard 71.17 67.17 6.0
Groundnut 7.52 8.11 -7.3
Safflower 1.77 1.48 19.6
Sunflower 4.13 4.86 -15.0
Sesamum 0.77 0.6 28.3
Linseed 3.48 3.32 4.8
Others 0.45 0.64 -29.7
Total Oilseeds 89.29 86.18 3.6
Source: Weather Watch Reports, Ministry of Agriculture.

IV.5.2 Consumption Population growth and rising purchasing power of the consumers have increased total andper capita consumption of edibles. Domestic production of edible oil increased from 5.02million tonnes in 2001–02 to 7.7 million tonnes in 2012–13 and it is expected to increaseto 8.51 million tonnes in 2013–14. Consumption increased from 10.96 million tonnes in2001–02 to 18.31 million tons in 2012–13 and expected to reach 19.20 million tonnes in2013–14.
IV.5.3 PricesThe MSP of Rapeseed and mustard was raised from Rs 3000 per quintal in 2012–13production season to Rs 3050 per quintal in 2013–14 and in the case of safflower MSPwas raised from Rs 2800 per quintal to Rs 3000 per quintal in 2013–14 providing afavourable price environment to oilseeds production.
The WPI of oilseeds rose sharply in 2012 peaking at a high of 31 per cent in November2012 before declining upto July 2013. In August and September 2013 the YoY pricechange became negative and thereafter remaining positive but well below a moderate levelof 5 per cent (Figure IV.5.2). The WPI for vegetable oils showed an annual inflation rateof about 10 per cent between April 2012 and December 2013, thereafter the rate decliningsteadily reaching negative zone by July 2013 and continuing to show negative year-on-yearprice change till December 2013. International price trends have a major influence ondomestic edible oil prices as India imports about 50 per cent of its consumption.
AGRICULTURAL OUTLOOK AND SITUATION ANALYSIS REPORTS
60
The WPI forvegetable oilsshowed an annualinflation rate ofabout 10 per centbetween April 2012and December 2013,thereafter the ratedeclining steadilyreaching negativezone by July 2013and continuing toshow negative year-on-year price changetill December 2013.
Figure IV.5.1: Edible oil Production and Consumption: Thousand Tonnes

The YoY change in rapeseed and mustard oil WPI declined from 23.6 per cent in April2012 to -1.5 per cent in November 2013 and 0.3 per cent in December 2013. The YoYchange in palm oil price declined from 11.8 per cent in April 2012 to 5.2 per cent inDecember 2013. While excellent production of rapeseed and mustard crop in 2012–13 andlow international prices led to drop in edible oil price rise in 2012–13, another record cropin 2013–14 is keeping prices at moderate levels in the current year (Figure IV.5.3).
COMMODITY OUTLOOK ASSESSMENT
61
While excellentproduction ofrapeseed andmustard crop in2012–13 and lowinternational pricesled to drop in edibleoil price rise in2012–13, anotherrecord crop in2013–14 is keepingprices at moderatelevels in the currentyear.
Figure IV.5.2: Oilseed and Vegetable Oil Price Inflation (YoY % change)
Figure IV.5.3: Wholesale Price Index of Rapeseed and Mustard, Palm oil and International Price of Palmoil (P*):% YOY

IV.5.4 Market arrivals and pricesThe market arrivals and prices for the years 2012 and 2013 of important oilseeds in somemajor markets are illustrated in Figure IV.5.4 to IV.5.6. The arrivals of groundnut inRajkot, a major groundnut producing region in Gujarat has increased resulting in a declinein prices. In case of soybean, arrivals have decreased in all the markets There have beenreports of weak arrivals in markets in MP and Rajasthan because of the rains in Octoberwhich may have affected harvesting and quality of the produce. Soybean prices declineddue to weaker demand in the spot markets and bearish trend in international markets.However, lower arrivals in the key spot markets restricted excessive fall.
AGRICULTURAL OUTLOOK AND SITUATION ANALYSIS REPORTS
62
Soybean pricesdeclined due toweaker demand inthe spot markets andbearish trend ininternationalmarkets. However,lower arrivals in thekey spot marketsrestricted excessivefall.
Figure IV.5.4: Arrival and Prices of Groundnut in Gondal market in Rajkot district of Gujarat
Figure IV.5.5: Arrival and Prices of Soybean

COMMODITY OUTLOOK ASSESSMENT
63

Rapeseed/mustard seed prices in key spot market across Rajasthan witnessed a firm trend.Rapeseed prices are facing pressure currently as demand for oils is moderate which has ledto weak RM seed buying from stockists and mills in addition to the advancing rapeseedsowing under way. It is expected that the winter season uplifts the demand for oils and islikely to lend some support to the market. Also, concerns that a sharp drop in temperaturein the northern parts of the country could damage the rapeseed crop may support theprices.
IV.5.5 TradeImport of edible oils during November 2013 is reported at 9,44,309 tonnes compared to7,00,371 tonnes in November 2012, and December 2013 import is reported at 1,052,550tonnes compared to 883489 in December 2012 i.e. up by 19 per cent. The overall importof vegetable oils during November–December 2013 is reported at 2,012,018 tonnescompared to 1,608,958 tonnes, up by 25 per cent.
AGRICULTURAL OUTLOOK AND SITUATION ANALYSIS REPORTS
64
Rapeseed/mustardseed prices in keyspot market acrossRajasthan witnesseda firm trend.Rapeseed prices arefacing pressurecurrently as demandfor oils is moderatewhich has led toweak RM seedbuying fromstockists and mills inaddition to theadvancing rapeseedsowing under way.
Figure IV.5.6: Arrival and Prices of Rapeseed and Mustard

In last two months import has surged as sunflower oil was cheaper to soybean oilencouraging larger shipment of sunflower oil. Spread between RBD palmolein and crudepalm oil reduced to less than US$ 10 per tonne made RBD palmolein more attractive overCPO and also in anticipation of likely increase in import duty, palm oil shipments werehigher during the month.
COMMODITY OUTLOOK ASSESSMENT
65
Figure IV.5.7: Total Imports of Edible Oils (Oil Year from Nov–Oct)
Figure IV.5.8: Share of Different Oils in Total Imports

IV. 6 Sugarcane and Sugar
IV.6.1 Production to increaseSugarcane production in 2013–14 was projected at 347.8–353.0 million tonnes in theNovember 2013 quarterly outlook report. The government’s 1st advance estimates ofagricultural production which were released in September had pegged 2013–14 sugarcaneproduction at 341.8 million tonnes a marginal increase over the revised estimates ofproduction in 2012–13 at 341.2 million tonnes. The 2nd AEs released in February 2014,however, show upward revision in production at 345.9 million tonnes. The sugar canesown area in 2013–14 is tentatively placed at 4.87 million hectares compared to 5.01million hectares in 2012–13. The marginal decline in planted area in 2013–14 is likely tobe more than offset by higher yield estimated at 71.0 tonnes per hectare compared to 67tonnes per hectare in 2012–13. We have retained projections of November 2013 report forthe present assessment. The record sugarcane production was 361 million tonnes in2011–12, when both the area and yield was a record 5.04 million hectares, 71.7 tonnes perhectare, respectively. The average sugar recovery rate in recent years has averaged about10.22 per cent.
Sugar production is lowerDespite a higher sugarcane production, sugar production during the 2013–14 marketingyear got off to a slow start due to sugarcane pricing uncertainty in the major sugarcanegrowing states of Uttar Pradesh and Maharashtra. According to Indian Sugar MillsAssociation (ISMA) sugar production in MY 2013–14 through January 2014 was 11.54million tonnes, 16.6 per cent below production in the corresponding period of MY2012–13 at 13.85 million tonnes. With fewer number of mills currently crushingsugarcane compared to the corresponding period of last year, sugar production in MY2013–14 is expected to fall marginally short of the MY 2012–13 production. Although,ISMA’s current forecast of sugar production in MY 2013–14 is 25 million tonnescompared to 25.14 million tonnes last year, a downward revision is likely as crushing trendbecomes clearer. Currently we forecast production at 24 million tonnes. Due to the initialuncertainty about sugarcane pricing and delayed sugar milling operation, there is likely tobe increased diversion of sugarcane to the production of gur and khandasari.
IV.6.2 The Indian ‘Sugar Cycle’Sugarcane is the second most important industrial crop in India after cotton with over 5million farmers involved and additionally providing direct or indirect employment toaround 4 per cent of the rural population5. India is the second largest producer of sugarcanein the world after Brazil. Sugarcane production in India has registered a steady increaseover the years. Production increased from around 240 million tonnes in 1990–91 toaround 360 million tonnes in recent years due to increase both in area and yield (FigureIV.6.1). Area has increased from around 3.7 million hectares to around 5 million hectaresand yield increased at a modest rate from around 65 tonnes per hectare to around 70tonnes per hectare. Nevertheless, per hectare yield of sugarcane in India at around 70tonnes per hectare with significant inter-state yield variations ranging from over 100tonnes per hectare in southern India to 60 tonnes per hectare in northern India is belowthat of other major producing countries such as Brazil and Thailand where it is in excessof 75 tonnes.
AGRICULTURAL OUTLOOK AND SITUATION ANALYSIS REPORTS
66
The 2nd AEsreleased in February2014, however, showupward revision inproduction at 345.9million tonnes. Thesugar cane sownarea in 2013–14 istentatively placed at4.87 million hectarescompared to 5.01million hectares in2012–13. Themarginal decline inplanted area in2013–14 is likely tobe more than offsetby higher yieldestimated at 71.0tonnes per hectarecompared to 67tonnes per hectare in2012–13.
With fewer numberof mills currentlycrushing sugarcanecompared to thecorrespondingperiod of last year,sugar production inMY 2013–14 isexpected to fallmarginally short ofthe MY 2012–13production.
5. Sugar Vision 2050. Report by Sugarcane Breeding Institute.

Sugarcane and hence sugar production in India is characterised by a well-marked cyclicaltrend of three to four years as farmers and sugar mills respond to sugarcane prices (FigureIV. 6.2). This is a major problem facing the sugar sector, which causes uncertainty to bothfarmers and millers, and is unique to India. During the years of high production of sugarfollowing high sugarcane production, market prices of sugar fall pushing the industry intofinancial problems and forcing sugar mills to delay payment to farmers for the canesupplied to them which leads to accumulation of “cane arrears”. This prompts farmers toshift cultivation to other crops next year, lowering the area under sugarcane leading tolower production. Lower sugarcane production results in lower sugar production and highsugar prices. This helps mills to liquidate part of the cane arrears, signalling farmers toswitch back to sugarcane, setting in motion the next phase of the cycle (Figure IV.6.3).
The present high cost of production combined with lower sugar prices is likely to set inmotion the downward phase of the production cycle for sugarcane and hence sugar incoming years. According to industry sources, cane arrears are expected to have reached Rs10,000 crore (Rs 100 billion) by the end of January 2014 as lower realisation from sugarsales has hit mills. It is feared that as the season progresses, the cane price arrears are onlyexpected to go up further unless some remedial actions are initiated by the government.ISMA estimated that cane arrears may hit a record Rs 17,000–18,000 crore by the end ofMarch this year.
COMMODITY OUTLOOK ASSESSMENT
67
Sugarcane andhence sugarproduction in India ischaracterised by awell-marked cyclicaltrend of three to fouryears as farmers andsugar mills respondto sugarcane prices.
The present highcost of productioncombined with lowersugar prices is likelyto set in motion thedownward phase ofthe production cyclefor sugarcane andhence sugar incoming years.
Figure IV.6.1: Sugarcane Area, Production and Yield Trends

IV.6.3 ConsumptionThe sugar industry estimates that the current total annual consumption (absorption) ofsugar in the country, including by households, bulk buyers, and others, is roughly 23 to23.5 million tonnes, which on a per capita basis works out at about 19 kilograms, wellbelow the global per capita consumption of 24 kilograms. However, in addition to sugar,Indians consume on an average about 5 kg of gur per year, although the use of sugarcaneto produce gur and hence production and consumption of gur is steadily declining over theyears. Almost two-third of the sugar consumption is believed to be by bulk consumers.
Despite lower per capita consumption, India is the world’s biggest sugar consumer,consuming one-third more sugar than the EU and over 60 per cent more than China.Demand growth has slowed in recent years, but underlying population and economic
AGRICULTURAL OUTLOOK AND SITUATION ANALYSIS REPORTS
68
The sugar industryestimates that thecurrent total annualconsumption(absorption) of sugarin the country,including byhouseholds, bulkbuyers, and others,is roughly 23 to 23.5million tonnes,which on a per capitabasis works out atabout 19 kilograms,well below the globalper capitaconsumption of 24kilograms.
Figure VI.6.2: Sugarcane and Sugar Production Trend
Figure IV.6.3: Indian Sugar Cycle

growth should see demand growth return to higher levels, forecast to reach 30 milliontonnes by 2020 from the present 23 million tonnes. Demand growth among lower incomeconsumers will be driven by rising incomes, while middle class consumers will demandmore processed foods. Sugar consumption has been relatively resilient due to subsidisedsugar sold to lower income consumers and the relatively price-inelastic demand of moreaffluent consumers.
Reflecting the higher production and large stocks of sugar both domestically and globally,sugar prices have shown a downward trend in recent months. Year-on-year sugar priceinflation measured by Wholesale Price Index entered into a negative territory since August2013 (Figure IV.6.4). A likely near record production in MY 2013–14 and high carry instocks will continue to keep prices under pressure unless significant exports take place.
IV.6.4 Sugarcane pricing conundrumAlthough the central government fixes the fair remunerative price (FRP) for sugarcane,states are free to determine the minimum price, the state advised price (SAP), at whichsugar mills within its territory must purchase cane. While recommending the FRP forsugarcane last year at Rs 210 per quintal linked to a sugar recovery rate of 9.5 per cent, theCommission on Agricultural Costs and Prices (CACP) had cautioned that any furtherincrease in the SAP of cane by producing states would drive up output costs of sugar mills.However, in most major sugar producing states there were agitations by farmers forestablishing sugarcane SAP of Rs 300 per quintal or above, in some states these prices noteven linked to the recovery rate. In Uttar Pradesh finally the SAP was established at Rs280 per quintal. According to the sugar industry, the result is a financially unviableposition of the sugar mills across the country. Earlier this marketing year, mills in UttarPradesh refused to undertake sugarcane crushing operation after banks denied themworking capital loans, citing mills’ continued losses due to a drastic mismatch betweencane and sugar prices. Finally the state government granted mills an incentive of Rs 11.03per quintal of cane in the form of a waiver of purchase tax, entry tax and societycommission. Additionally, the Centre has offered interest-free loans of Rs 6,600 crore to
COMMODITY OUTLOOK ASSESSMENT
69
A likely near recordproduction in MY2013–14 and highcarry in stocks willcontinue to keepprices underpressure unlesssignificant exportstake place.
Figure IV.6.4: All India Sugar Price and Year-on-Year Change in WPI of Sugar
Source: Department of Civil Supplies and Office of Economic Advisor.

cash-strapped mills, mainly to clear cane arrears. Mills are asked to repay the loan in fiveyears with a moratorium on repayment in the first two years.
Although, the government has partially implemented the recommendations of RangrajanCommittee Report on Regulation on Sugar Sector in India6, relating to decontrolling salesside of sugar sector, the Committee recommendation regarding linking the sugarcaneprice to the revenue realised from sugar and by-products by all the States has not beenimplemented. For the 2014–15 season the government has established the FRP for sugarat Rs 220 per quintal, an increase of Rs 10 per quintal.
IV.6.5 Stocks2013–14 season beginning stock of sugar is tentatively placed at 8.8 million tonnescompared to around 6 million tonnes in 2012–13, which is below the record stock in earlieryears (Figure IV.6.6). With production outstripping consumption, a further build up instock is likely by the end of the 2013–14 marketing season, unless there is a significantincrease in exports. To contain the oversupply sugar situation in India, the industry issuggesting that government to build a strategic reserve of 2 to 3 million tonnes.
AGRICULTURAL OUTLOOK AND SITUATION ANALYSIS REPORTS
70
For the 2014–15season thegovernment hasestablished the FRPfor sugar at Rs 220per quintal, anincrease of Rs 10 perquintal. Figure IV.6.5: FRP for Sugarcane and Actual Price Paid to Famers
Note: FRP is linked to a recovery ratio of 9.5%.Source: Ministry of Agriculture and CACP.
6. http://eac.gov.in/reports/rep_sugar1210.pdf

IV.6.6 TradeIndia is the fourth largest exporter of sugar in the world and an occasional importer,depending upon the domestic demand and supply situation. During the past ten years,India has been a net exporter of sugar, despite the off again and on again ban on exportsdue to domestic production volatility. However, since May 14, 2012, free exports of sugarare permitted subject to prior registration of quantity. Nevertheless, the volume of exportsremains small in relation to the overall production due to high domestic consumption andlack of price parity with other major exporters. Major sugar importers from India are theneighbouring countries, East African countries like Sudan and Somalia and West Asiancountries.
Due to lack of parity with international prices and weak global demand for white sugar,India’s sugar export in MY 2012–13 is reported to have dipped to around one milliontonne, all white sugar compared to around 4 million tonnes exported in MY 2011–12.Indian sugar mills are increasingly turning towards raw sugar exports in MY 2013–14 tocash in on the demand for raws in the world market. Traders are also encouraging millsto produce more raws at the start of season. According to trade sources, in 2013–14 seasonIndia is likely to see export of about 2 million tonnes of sugar, including 1.2–1.5 milliontonnes of raws.
The Cabinet Committee on Economic Affairs on February 12 this year decided to providean export subsidy of Rs 3,333 per tonne on exports of 4 million tonnes of raw sugar in thenext two years, incurring an outgo of Rs 1,300 crore. The quantum of subsidy will be againreviewed in April this year. The subsidy will support exports and give much neededliquidity to Indian mills.
Sugar mills/merchant importers-exporters are free to import sugar including raw sugar asper their commercial prudence subject to payment of customs duty. Due to higherdomestic prices, some imports, mostly cross-border trade from Pakistan, took place in MY2012–13. India has reportedly imported around 700,000 tonnes sugar, including importsof 100,000 tonnes white sugar in MY 2012–13. In order to discourage imports of sugar,the basic customs duty on sugar import was raised from 10 per cent to 15 per cent with
COMMODITY OUTLOOK ASSESSMENT
71
Due to lack of paritywith internationalprices and weakglobal demand forwhite sugar, India’ssugar export in MY2012–13 is reportedto have dipped toaround 1 milliontonnes, all whitesugar compared toaround 4 milliontonnes exported inMY 2011–12.
Figure IV.6.6: Sugar Beginning Stocks
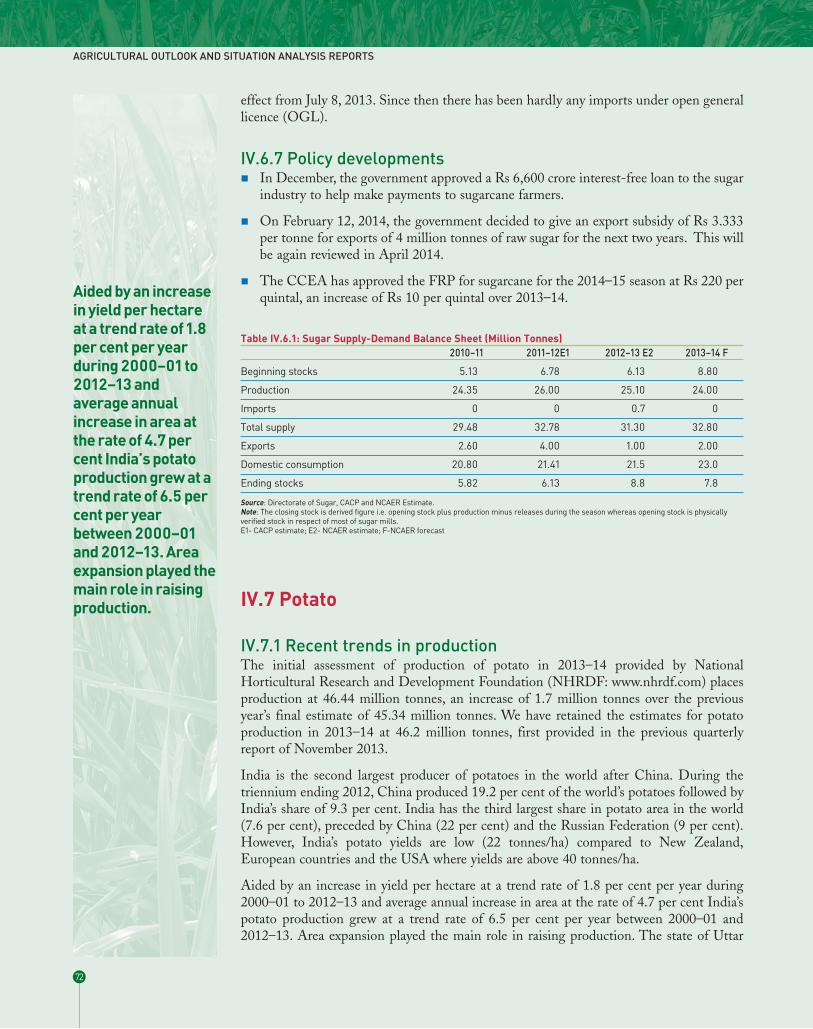
effect from July 8, 2013. Since then there has been hardly any imports under open generallicence (OGL).
IV.6.7 Policy developments� In December, the government approved a Rs 6,600 crore interest-free loan to the sugar
industry to help make payments to sugarcane farmers.
� On February 12, 2014, the government decided to give an export subsidy of Rs 3.333per tonne for exports of 4 million tonnes of raw sugar for the next two years. This willbe again reviewed in April 2014.
� The CCEA has approved the FRP for sugarcane for the 2014–15 season at Rs 220 perquintal, an increase of Rs 10 per quintal over 2013–14.
IV.7 Potato
IV.7.1 Recent trends in productionThe initial assessment of production of potato in 2013–14 provided by NationalHorticultural Research and Development Foundation (NHRDF: www.nhrdf.com) placesproduction at 46.44 million tonnes, an increase of 1.7 million tonnes over the previousyear’s final estimate of 45.34 million tonnes. We have retained the estimates for potatoproduction in 2013–14 at 46.2 million tonnes, first provided in the previous quarterlyreport of November 2013.
India is the second largest producer of potatoes in the world after China. During thetriennium ending 2012, China produced 19.2 per cent of the world’s potatoes followed byIndia’s share of 9.3 per cent. India has the third largest share in potato area in the world(7.6 per cent), preceded by China (22 per cent) and the Russian Federation (9 per cent).However, India’s potato yields are low (22 tonnes/ha) compared to New Zealand,European countries and the USA where yields are above 40 tonnes/ha.
Aided by an increase in yield per hectare at a trend rate of 1.8 per cent per year during2000–01 to 2012–13 and average annual increase in area at the rate of 4.7 per cent India’spotato production grew at a trend rate of 6.5 per cent per year between 2000–01 and2012–13. Area expansion played the main role in raising production. The state of Uttar
AGRICULTURAL OUTLOOK AND SITUATION ANALYSIS REPORTS
72
Aided by an increasein yield per hectareat a trend rate of 1.8per cent per yearduring 2000–01 to2012–13 andaverage annualincrease in area atthe rate of 4.7 percent India’s potatoproduction grew at atrend rate of 6.5 percent per yearbetween 2000–01and 2012–13. Areaexpansion played themain role in raisingproduction.
Table IV.6.1: Sugar Supply-Demand Balance Sheet (Million Tonnes)2010–11 2011–12E1 2012–13 E2 2013–14 F
Beginning stocks 5.13 6.78 6.13 8.80
Production 24.35 26.00 25.10 24.00
Imports 0 0 0.7 0
Total supply 29.48 32.78 31.30 32.80
Exports 2.60 4.00 1.00 2.00
Domestic consumption 20.80 21.41 21.5 23.0
Ending stocks 5.82 6.13 8.8 7.8
Source: Directorate of Sugar, CACP and NCAER Estimate.Note: The closing stock is derived figure i.e. opening stock plus production minus releases during the season whereas opening stock is physicallyverified stock in respect of most of sugar mills. E1- CACP estimate; E2- NCAER estimate; F-NCAER forecast

Pradesh has the highest share of production in the country (32 per cent) followed by WestBengal (27 per cent) and Bihar (14.6 per cent). The same states also account for the largestshares in area. The states with the highest average yields are Gujarat (29.8 tonnes/ha)followed closely by West Bengal (29.6), Punjab (25) and Uttar Pradesh (24.2 tonnes/ha).Tables IV.7.1 and IV.7.2 summarise the state level variations in area, production and yieldof potato in the recent years.
COMMODITY OUTLOOK ASSESSMENT
73
Table IV.7.1: Trends in Area, Production and Yield in Major Potato Producing States and Share of States inArea and ProductionStates Potato Area Potato Production Potato Yields
Trend Share of %Trend Share of Growth Rate PotatoGrowth Rate Potato Area Growth Rate Potato (% per year) Yields(% per year) (TE–2012) (% per year) Production (2000–01 to (TE–2012)(2000–01 to (%) (2000–01 to (TE–2012) 2012–13) (T/ha)
2012–13) 2012–13) (%)
Bihar 9.10 16.47 17.85 14.57 8.02 19.83
Gujarat 8.98 3.96 11.54 5.27 2.35 29.82
Haryana 5.79 1.47 7.11 1.47 1.24 22.51
Karnataka 1.32 2.26 4.69 1.23 3.32 12.19
Madhya Pradesh 7.55 4.32 10.85 3.55 3.07 18.40
Punjab 3.43 4.41 5.85 4.92 2.34 25.00
Uttar Pradesh 3.60 29.92 4.04 32.34 0.42 24.22
West Bengal 2.45 20.39 4.26 26.94 1.76 29.61
Grand Total 4.66 100.00 6.54 100.00 1.79 22.41
Source: National Horticultural Board (NHB).
Figure IV.7.1: Area, Production and Yield of Potato in India
Source: Directorate of Economics and Statistics, Ministry of Agriculture.
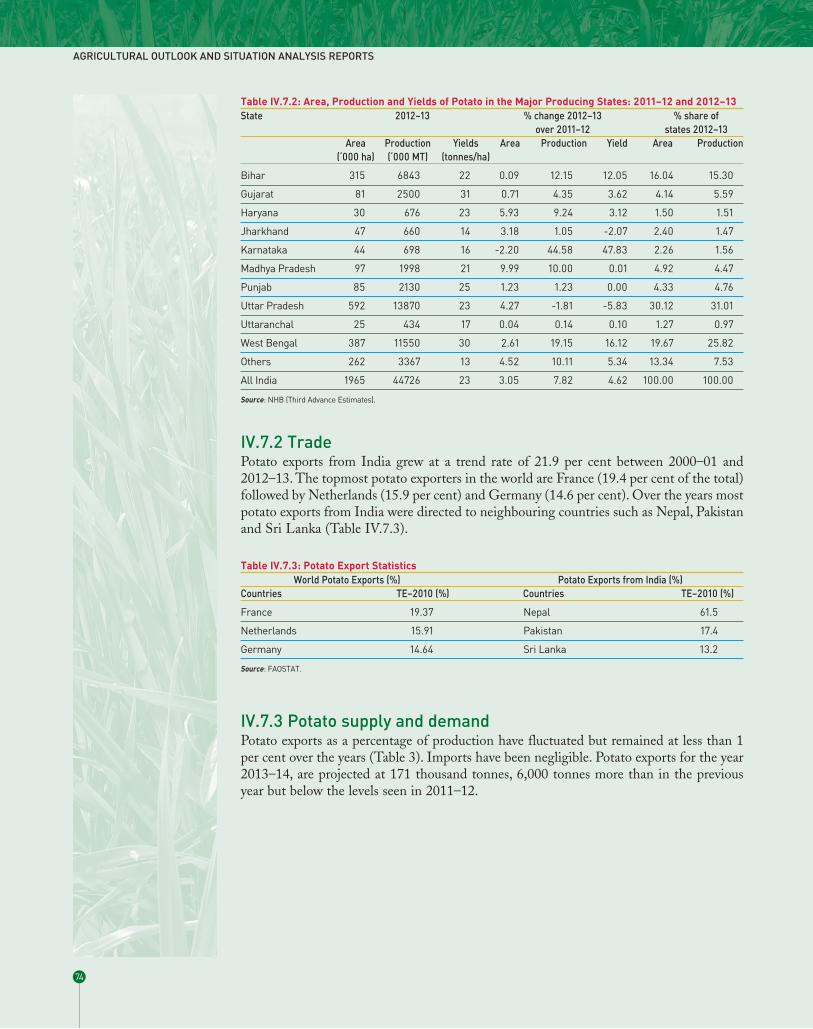
IV.7.2 TradePotato exports from India grew at a trend rate of 21.9 per cent between 2000–01 and2012–13. The topmost potato exporters in the world are France (19.4 per cent of the total)followed by Netherlands (15.9 per cent) and Germany (14.6 per cent). Over the years mostpotato exports from India were directed to neighbouring countries such as Nepal, Pakistanand Sri Lanka (Table IV.7.3).
IV.7.3 Potato supply and demandPotato exports as a percentage of production have fluctuated but remained at less than 1per cent over the years (Table 3). Imports have been negligible. Potato exports for the year2013–14, are projected at 171 thousand tonnes, 6,000 tonnes more than in the previousyear but below the levels seen in 2011–12.
AGRICULTURAL OUTLOOK AND SITUATION ANALYSIS REPORTS
74
Table IV.7.2: Area, Production and Yields of Potato in the Major Producing States: 2011–12 and 2012–13State 2012–13 % change 2012–13 % share of
over 2011–12 states 2012–13Area Production Yields Area Production Yield Area Production
(‘000 ha) (‘000 MT) (tonnes/ha)
Bihar 315 6843 22 0.09 12.15 12.05 16.04 15.30
Gujarat 81 2500 31 0.71 4.35 3.62 4.14 5.59
Haryana 30 676 23 5.93 9.24 3.12 1.50 1.51
Jharkhand 47 660 14 3.18 1.05 -2.07 2.40 1.47
Karnataka 44 698 16 -2.20 44.58 47.83 2.26 1.56
Madhya Pradesh 97 1998 21 9.99 10.00 0.01 4.92 4.47
Punjab 85 2130 25 1.23 1.23 0.00 4.33 4.76
Uttar Pradesh 592 13870 23 4.27 -1.81 -5.83 30.12 31.01
Uttaranchal 25 434 17 0.04 0.14 0.10 1.27 0.97
West Bengal 387 11550 30 2.61 19.15 16.12 19.67 25.82
Others 262 3367 13 4.52 10.11 5.34 13.34 7.53
All India 1965 44726 23 3.05 7.82 4.62 100.00 100.00
Source: NHB (Third Advance Estimates).
Table IV.7.3: Potato Export StatisticsWorld Potato Exports (%) Potato Exports from India (%)
Countries TE–2010 (%) Countries TE–2010 (%)
France 19.37 Nepal 61.5
Netherlands 15.91 Pakistan 17.4
Germany 14.64 Sri Lanka 13.2
Source: FAOSTAT.

IV.7.4 Prices The WPI of Potato had peaked in October 2009 after which it had declined considerably(Figure IV.7.2). The pattern of price index is similar in 2012 and 2013. After reaching ahigh level in July–August period prices declined upto November. After November 2012,prices continued to decline upto March 2013. On the projected growth in rabi productionof 2013–14, based on seasonal pattern, prices are expected to decline until March 2014.The projections based on short-term projections reported in Part I of the report suggestmixed trends as seasonal and regional supply-demand imbalances may lead to pricefluctuations.
COMMODITY OUTLOOK ASSESSMENT
75
Table IV.7.4: Potato Supply and Demand (Thousand Tonnes)Potatoes 2005–06 2006–07 2007–08 2008–09 2009–10 2010–11 2011–12 2012–13 2013–14
Production (‘000 tonnes) 23905 22181 28471 34391 35889 42339 41483 45340 46200
Imports (‘000 tonnes) 2.41 0.05 0.12 0 0 0 0 0 0
Total Supply (‘000 tonnes) 23908 22181 28471 34391 35889 42339 41483 45340 46200
Exports (‘000 tonnes) 78 92 82 196 96.63 198 199 165 171
Total Domestic Utilisation 23829 22089 28389 34195 35792 42141 41284 44235 45829
(‘000 tonnes)
Share of Exports to 0.33 0.42 0.29 0.57 0.27 0.47 0.48 0.36 0.36
Production (%)
Share of Domestic 99.7 99.6 99.7 99.4 99.7 99.5 99.5 99.6 99.6
Consumption to Total Supply (%)
Source: NHB&CMIE* Exportprojections of 2013–14 based on average trend growth in the recent five years.
Figure IV.7.2: WPI Trends in Potato
Source: Office of Economic Adviser, Government of India.

In comparison to the average year-on-year percentage change of WPI of potato in the fiveyear period 2006 to 2011, in 2013, the YOY percentage change was high in January toMarch, and then in December (Figure IV.7.3). In the interim period of April–Novemberthe YOY price rise in 2013 was well below the average pattern in the earlier five years.With a favourable rabi harvest in the current year, price rise should be modest in theremaining three months of the current financial year.
The patterns of monthly wholesale and retail prices in selected markets in 2012 show asimilar pattern with rising trend upto about August followed by decline or relative stabilitythereafter (Figures IV.7.4–IV.7.5). However, in 2013, there was a rising trend duringJanuary to August as in the same period of the previous year, but the declining trend afterAugust was not distinct. There was a decline in prices in some markets in November andin December. As noted earlier, arrival of rabi crop in the markets would sustain themoderating pattern of prices in the 2–3 months of 2014.
Wholesale prices are the highest in cities like Chennai, Bangalore and Mumbai which arefarther away from the main producing regions. In Lucknow, Delhi and Kolkata that arecloser to the producing regions, the prices are relatively lower.
AGRICULTURAL OUTLOOK AND SITUATION ANALYSIS REPORTS
76
With a favourablerabi harvest in thecurrent year, pricerise should bemodest in theremaining threemonths of thecurrent financialyear.
Arrival of rabi crop inthe markets wouldsustain themoderating patternof prices in the 2–3months of 2014.
Figure IV.7.3: Comparison between Average % YoY of WPI from 2006 to 2011 and % YoY of 2012 over2013
Source: Directorate of Economics and Statistics, Ministry of Agriculture.

As in the case of wholesale prices, retail prices are also the highest in cities like Chennai,Bangalore and Mumbai and relatively low in Lucknow, Delhi and Kolkata. Retail pricesare more volatile than wholesale prices, indicating differences in transportation, marketingand storage across the supply chains.
COMMODITY OUTLOOK ASSESSMENT
77
Figure IV.7.4: Wholesale Prices of Potato in Selected Cities
Source: Directorate of Economics and Statistics, Ministry of Agriculture.
Figure IV.7.5: Retail Prices of Potato in Selected Cities
Source: Directorate of Economics and Statistics, Ministry of Agriculture.

IV.7.5 Market arrivalsIn the mandis of Delhi, the per day market arrivals (average of 2008–2012) are highest inthe month of November and December with a decline during the summer months. Thearrivals in 2013 followed the average trends, registering a decline with the approach ofsummer. However, the arrivals in 2013 were much higher than the corresponding averagefigures of the previous four years. In Lucknow also the arrivals in 2013 were much largerthan the average pattern seen in the previous five years of 2008–12. In Ahmedabad averagearrivals are high in December and January, decline in February and once again increase inMarch, showing a gradual decline in the summer months. The arrivals in 2013 showed anexactly similar trend. The patterns of market arrivals are illustrated in Figures IV.6a–IV.6c.In Kolkata, the arrival pattern, not shown in the Figure IV.7.6, does not vary during theyear and may reflect only the consumption demand. The patterns generally indicatedimproved supplies in 2013 as compared to the average in the recent five years.
AGRICULTURAL OUTLOOK AND SITUATION ANALYSIS REPORTS
78
Figure IV.7.6: Per day Average Arrivals of Potatoes

The nearly stable crop arrivals in November and December 2013 in the major marketshave lent some stability to wholesale prices also (Table IV.7.5). Favourable rabi harvest willhelp sustain moderation in price trends in the short-term. While the trends in the futuresmarket prices suggest increasing prices from March till July 2014, the more recentcontracts indicate moderation in price expectations (Table IV.7.6).
COMMODITY OUTLOOK ASSESSMENT
79
Favourable rabiharvest will helpsustain moderationin price trends in theshort-term. Whilethe trends in thefutures marketprices suggestincreasing pricesfrom March till July2014, the morerecent contractsindicate moderationin price expectations
Source: www.agmarknet.nic.in
Table IV.7.5: Potato Market Arrivals and PricesConsuming Centres Avg. Wholesale Avg. Wholesale Average Market Average Market
Price in November Price in December Arrivals per day Arrivals per day 2013 (Rs/Qtl) 2013 (Rs/Qtl) in November in December
2013 (tonnes) 2013 (tonnes)
Delhi 1110 (810) 1150 (613) 2321 (831) 2009 (790)
Kolkata 1280 (1232) 1460 (960) 10 (10) 10 (10)
Mumbai 1700 (1150) 1600 (1163) 1134 1371 (1456)
Lucknow 1400 (949) 900 (693) 215 (179) 418 (215)
Bangalore 1900 (2000) 1900 (1975) 806 (969) 805 (1101)
Source: www.agmarknet.nic.inFigures in brackets are average prices and arrivals in 2012 in the months of November and December.
Table IV.7.6: Futures Prices of PotatoLaunch Date Expiry Date Futures Price (Rs/Qtl)
as on 17th January 2014
30–September–2013 31–March–2014 1047.3
29–October–2013 30–April–2014 1053.7
29–November–2013 30–May–2014 1077.7
29–December–2013 30–June–2014 1069.8
30–January–2014 31–July–2014 1078.9
Source: www.mcxindia.com

IV.7.6 OutlookThe favourable rainfall during the year raised the prospects of an increased production ofpotato in 2013–14. Initial estimates of production in major producing states such as UPand West Bengal are consistent with this assessment of higher production in 2013–14.However, the price trends suggest that the increase in production is likely to be modest.
IV.8 Onion
IV.8.1 Recent trends in productionAfter the extremely high onion prices throughout 2013, the year-on-year rise in WPI ofonion dropped to double digits and below 50 per cent for the first time in December sinceJune 2013. The decline in the prices in December, reflects recovery in production in thecurrent year. As per the current estimates, in 2012–13 onion production had dropped to16.3 million tonnes from17.5 million tonnes in the previous year. In 2013–14, productionis estimated to increase to 18–19 million tonnes. The impact of production fluctuations onprices has been large: between October 2011 and October 2012, year-on-year price risewas negative and importantly output of onion had increased from 15.1 million tonnes in2010–11 to 17.5 million tonnes in 2011–12. In 2012–13, with the drop in production,prices shot up. Finally, as production improved in 2013–14, prices are showingdeceleration. Besides the short-term production fluctuations, rising demand is also animportant consideration in planning future production and supply strategies for thisvegetable cop.
China has the largest area under onion in the world closely followed by India. In terms ofproduction too, India with 14.1 per cent of the world’s production is second to Chinawhich has 22 per cent share in world production (FAOSTAT). India’s onion yields ofabout 15 tonnes/ha are much below China’s (23 tonnes/ha). The highest onion yields arerecorded in countries like Korea and Ireland (above 60 tonnes/ha).
India’s onion production increased at a rapid pace of more than 13 per cent per yearbetween 2000–01 and 2012–13, contributed by the rise in both area and yield. Based ondata for the three years ending in 2012–13 the state of Maharashtra has the highest shareof onion area in the country (34 per cent) followed by Karnataka (17 per cent).Maharashtra also has the highest share of production (31 per cent) followed by Karnataka(15 per cent) and Madhya Pradesh (11 per cent). The state of Gujarat has the highestonion yield in the country (25 tonnes/ha) followed by Madhya Pradesh (21 tonnes/ha) andHaryana (20 tonnes/ha) (Table IV.8.1).
AGRICULTURAL OUTLOOK AND SITUATION ANALYSIS REPORTS
80
The impact ofproductionfluctuations onprices has beenlarge: betweenOctober 2011 andOctober 2012, year-on-year price risewas negative andimportantly output ofonion had increasedfrom 15.1 milliontonnes in 2010–11 to17.5 million tonnesin 2011–12. In2012–13, with thedrop in production,prices shot up.Finally, asproduction improvedin 2013–14, pricesare showingdeceleration.

While the area and production of onion increased at a high rate on the average over the12 year period till 2012–13, there were significant fluctuations in output from year-to-year(Figure IV.8.1). Onion yields reached a peak in 2008–09 and 2009–10, declining sharplyin 2010–11 and marginally in 2012–13. The third advance estimate of onion productionin 2012–13 was 16.31 million tonnes that was 7 per cent lower than the final estimate for2011–12. The final estimate for onion production in 2012–13 are 16.81 million tonnes,marginally higher than the third advance estimate. The drop in production wascontributed by decline in area and yield. There were also state level variations in the patternof growth of area and production in 2012–13 (Table IV.8.2).
COMMODITY OUTLOOK ASSESSMENT
81
Table IV.8.1: Onion Production Statistics: Major StatesStates/Uts Onion Area Onion Production Onion Yields
Growth Share of Growth Share of Growth OnionRate (%) Onion Area Rate (%) Onion Rate (%) Yields
(2000–01 to (TE–2012) (2000–01 to Production (2000–01 to (TE–2012)2012–13) (%) 2012–13) (TE–2012) (%) 2012–13) (T/ha)
Andhra Pradesh 6.71 5.86 6.57 6.33 -0.13 17.00
Gujarat 9.99 4.89 9.69 7.73 -0.27 24.85
Haryana 5.14 2.49 8.83 3.19 3.51 20.17
Karnataka 3.92 16.96 16.89 15.20 12.47 14.11
Madhya Pradesh 13.15 7.82 17.39 10.48 3.75 21.09
Maharastra 10.75 33.99 12.93 31.07 1.97 14.38
Orissa 20.02 3.37 27.25 2.50 6.03 11.67
Rajasthan 8.20 6.30 12.92 3.74 4.36 9.34
Tamil Nadu 1.89 3.09 3.96 2.40 2.03 12.20
Uttar Pradesh 0.78 2.35 3.74 2.47 2.94 16.55
Grand Total 8.60 100.00 13.25 100.00 4.29 15.74
Source: National Horticultural Board (NHB).
Figure IV.8.1: Area, Production and Yield of Onion
Source: Directorate of Economics and Statistics, Ministry of Agriculture.

Estimates of production by the three main growing seasons of the crop show that rabi cropplanted in November–December accounts for bulk of annual production. Yield is alsohigher in rabi season as compared to the two kharif seasons (Table IV.8.3).
AGRICULTURAL OUTLOOK AND SITUATION ANALYSIS REPORTS
82
Table IV.8.2: State-wise Area, Production and Yield of Onion: 2012–13States 2012–13 % Change YOY: % Share in 2012–13
2012–13 over 2011–12Area Production Yield Area Production Yield Area Production
Andhra Pradesh 85.8 1458.8 17.0 76.9 76.9 0.0 9.0 8.9
Bihar 54.3 1308.6 24.1 1.0 5.8 4.8 5.7 8.0
Chhattisgarh 18.0 269.3 15.0 28.8 21.2 -5.9 1.9 1.7
Gujarat 28.9 704.4 24.4 -52.9 -54.9 -4.2 3.0 4.3
Haryana 27.8 518.5 18.6 1.3 -12.1 -13.3 2.9 3.2
Jharkhand 17.2 322.2 18.7 9.7 1.2 -7.7 1.8 2.0
Karnataka 159.6 2395.9 15.0 -9.9 -2.3 8.5 16.6 14.7
Madhya Pradesh 96.9 2150.7 22.2 10.0 9.9 -0.1 10.1 13.2
Maharastra 260.0 4660.0 17.9 -31.9 -17.3 21.4 27.1 28.6
Orissa 34.9 419.1 12.0 -0.7 0.0 0.7 3.6 2.6
Punjab 8.2 182.9 22.2 0.1 0.1 0.0 0.9 1.1
Rajasthan 73.5 670.8 9.1 0.0 1.0 1.0 7.7 4.1
Tamil Nadu 25.3 277.9 11.0 -32.0 -50.1 -26.6 2.6 1.7
Uttar Pradesh 26.1 455.8 17.5 10.2 18.9 7.9 2.7 2.8
West Bengal 22.0 309.1 14.1 1.5 1.5 0.0 2.3 1.9
Other states 20.2 205.1 10.1 1.6 2.3 0.6 2.1 1.3
India 958.7 16309.0 17.0 -11.8 -6.9 5.6 100.0 100.0
Note: Area is in ‘000 ha, production in ‘000 tonnes and yield in tonnes/ ha. The 2012–13 data are from the 3rd AE and 2011–12 are the final estimates.Source: National Horticultural Board.
Table IV.8.3: Season-wise Area, Production and Yield of OnionSeason 2008–09 2009–10 2010–11 2011–12 2012–13
Area (% of annual total)
Main kharif 22.7 23.1 37.5 27.0 13.2
Late kharif 11.2 10.5 13.1 15.3 11.0
Rabi 66.1 66.4 49.3 57.7 75.8
Total 100.0 100.0 100.0 100.0 100.0
Area (% of annual total)
Main kharif 22.4 23.0 32.5 23.5 12.9
Late kharif 11.3 10.4 9.9 14.1 10.4
Rabi 66.3 66.6 57.6 62.5 76.8
Total 100.0 100.0 100.0 100.0 100.0
Yield (% of annual average)
Main kharif 98.8 99.4 86.9 86.9 97.0
Late kharif 100.6 99.4 75.2 92.5 94.6
Rabi 100.0 100.0 116.6 108.1 101.2
Total 100.0 100.0 100.0 100.0 100.0
Source: NHRDF.Note: 2012–13 data of NHRDF refers to the 3rd AE of production.

IV.8.2 TradeOnion exports from India grew at a trend rate of 12.3 per cent between 2000–01 and2011–12. In the recent years, India has become the largest exporter followed byNetherlands and China. However, the total exports are small quantities relative toproduction. Most of the onion from India is exported to Bangladesh, Malaysia, UAE, SriLanka and Pakistan as Indian onions are preferred in these destinations (Table IV.8.4).
IV.8.3 Onion supply and demandOnion exports as a percentage of production declined over the years, with the risingdemand in the domestic market (Table IV.8.5). This situation is likely to continue in theshort-term as increased supplies will require more area to be brought under the crop andbetter post-harvest infrastructure is developed.
IV.8.4 PricesWithin a year, onion prices usually follow a seasonal pattern with high prices fromSeptember till January and low prices thereafter as the rabi crop fills the supply pipeline.In general, prices tend to be higher in August–September as transportation of output fromproducers to the consumption centres is affected by rains (Figure IV.8.2). The logisticsconstraints of transportation and storage accentuate the price volatility because ofuncertainty associated with the supplies.
COMMODITY OUTLOOK ASSESSMENT
83
Onion exports fromIndia grew at a trendrate of 12.3 per centbetween 2000–01and 2011–12. In therecent years, Indiahas become thelargest exporterfollowed byNetherlands andChina.
Table IV.8.4: Onion Export StatisticsOnion Exporters (% share in world exports) Destination of Exports from India (% shares)
Countries TE–2011 (%) Years TE–2011 (%)
India 17.3 Bangladesh 36.8
Netherlands 16.8 Malaysia 21.1
China 8.0 United Arab Emirates 10.5
Egypt 4.7 Sri Lanka 9.6
Mexico 4.2 Pakistan 4.2
Others 49.0 Others 17.8
Source: FAOSTAT.
Table IV.8.5: Onion Supply and Demand (Thousand Tonnes)Item 2005–06 2006–07 2007–08 2008–09 2009–10 2010–11 2011–12 2012–13 2013–14
Production 8683 8885 9138 13588 12191 15118 17511 16309 18300
Imports 7 0 0 0 1 13 0 0 0
Total supply 8689 8885 9138 13588 12191 15130 17511 16309 18300
Exports 961 1378 1009 1670 1677 1182 1310 1667 1626
Total domestic utilisation 7729 7507 8129 11918 10515 13948 16201 14643 16675
Ratio of exports to 11.1 15.5 11.0 12.3 13.8 7.8 7.5 10.2 9.3
Production (%)
Ratio of domestic 89.0 84.5 89.0 87.7 86.3 92.2 92.5 89.8 90.7
Consumption to Total Supply (%)
Source: NHB & CMIE.* Export and import projections of 2013–14 based on average trend growth in the recent five years.

Monthly pattern of changes in WPI of onions points to relatively higher year-on-year risein prices from July till January and a slower increase during February–June (Figure 3).Throughout 2013, until December, the year-on-year change in WPI of onions was fargreater compared to previous years (Figure IV.8.3). As the new rabi crop arrives inmarkets, moderation in price rise should intensify.
The monthly pattern of wholesale and retail prices of onion in the major cities is similar(Figure IV.8.4 & IV.8.5). Wholesale prices began to increase in September 2012 as a resultof delay in the arrival of kharif crop due to deficient rainfall. Prices in the major marketing
AGRICULTURAL OUTLOOK AND SITUATION ANALYSIS REPORTS
84
Monthly pattern ofchanges in WPI ofonions points torelatively higheryear-on-year rise inprices from July tillJanuary and aslower increaseduringFebruary–June.
Figure IV.8.2: Wholesale Price Index of Onion
Source: Office of Economic Adviser, Government of India.
Figure IV.8.3: Comparison between Average % YoY of WPI from 2006 to 2011 and % YoY of 2012 over 2013

centres, Lasalgaon and Nashik increased October 2012 onwards, but being productioncentres, prices here were lower than other Indian cities. Prices peaked in January 2013 butstarted to fall from February onwards as a result of increased supplies of rabi harvest.However, the fall in prices was short-lived as they started to increase rapidly once thedecline in production for the year as a whole led to excess demand conditions. SinceOctober 2013 onwards there is a clear momentum of declining prices in the wholesalemarkets (Figure IV.8.4).
Following a similar pattern as the wholesale prices, the retail prices of onion showedincreasing trend from May 2012 onwards in all the selected cities and reached a peak inJanuary 2013 (Figure IV.8.5). They began to decline from February 2013 onwards, butstarted to increase once again from April 2013 as the decline in output in 2012–13 beganto affect supplies. In the month of October 2013, the monthly average retail prices werethe highest in Jaipur (Rs 80/Kg) followed closely by Delhi (Rs 75/Kg) and Kolkata (Rs70/Kg). Prices in Mumbai, Chennai and Bangalore were around Rs 65/Kg. Retail priceswere relatively lower in Bhubaneswar (Rs 52/Kg). After October, prices plummeted in allcities.
COMMODITY OUTLOOK ASSESSMENT
85
Figure IV.8.4: Wholesale Prices of Onion in Cities
Source: Directorate of Economics and Statistics, Ministry of Agriculture.

As onion prices plummeted from October 2013 onwards, there were growing demand byfarmers and traders that the present prices were unsustainable for them, and the MEP foronion was removed in December 2013 to provide an avenue for channelising excesssupplies. These short-term mismatches in supply and demand point to the need forstrengthening post-harvest infrastructure for perishable farm commodities.
IV.8.5 Market arrivalsIn the mandis of Delhi the per day market arrivals (average of 2008–2012) are highest inthe month of June and then increase once again in November and December (FigureIV.8.5). The arrivals in 2013–14 are following the average trends, though their values aremuch higher than the average values. In Kolkata, the average arrivals show a fluctuatingtrend with highest arrivals in May, July and November. The trend for 2013–14 is similar,though the arrivals have been less than the average of 2008–2012. In Ahmedabad market,arrivals are high between January and April and decline thereafter. Arrivals in 2013 are alsoshowing similar trends, except that they have shown an increase in the month of May too.In Bangalore, market arrivals are highest in October and decline rapidly then onwards. Thearrivals in 2013 are also showing similar trends.
AGRICULTURAL OUTLOOK AND SITUATION ANALYSIS REPORTS
86
These short-termmismatches insupply and demandpoint to the need forstrengthening post-harvestinfrastructure forperishable farmcommodities.
Figure IV.8.5: Retail Prices of Onion in Metro Cities
Source: Directorate of Economics and Statistics, Ministry of Agriculture.

COMMODITY OUTLOOK ASSESSMENT
87
Figure IV.8.6: Per Day Average Arrivals of Onion in Selected Wholesale Markets

IV.8.6 OutlookProduction of onion in 2013–14 is now projected at 18–19 million tonnes, up from 16.8million tonnes in 2012–13. Production of onion is sensitive to variations in rainfall andtherefore, year-to-year fluctuations in output can be expected. The very high prices of thisfood commodity during 2013–14, as a result of drop in output in the previous crop hasdrawn attention again to the need to strengthen post-harvest management of perishablecommodities.
AGRICULTURAL OUTLOOK AND SITUATION ANALYSIS REPORTS
88
Production of onionin 2013–14 is nowprojected at 18–19million tonnes, upfrom 16.8 milliontonnes in 2012–13.
Source: www.agmarknet.nic.in

IV.9 Banana
IV.9.1 Production trendsThe current official revised estimates for 2012–13 place banana production in 2012–13 at24.9 million tonnes, lower than the final estimates of production of 28.5 million tonnes in2011–12. There was a significant drop in production in Tamil Nadu and Maharashtra in2012–13 compared to the previous year. One of the factors leading to the decline is thedeficient rainfall during the year. With the improved rainfall situation in 2013–14,production is expected to increase over the previous year and our current estimate ofproduction for the year is 30.9 million tonnes. However, the projected estimates ofproduction reflect an increase of 4 per cent per year between 2011–12 and 2013–14 wellbelow the average increase seen during 2000–01 and 2012–13 indicating that upward pricepressures would remain in the short-term.
Banana accounts for about 0.8 million hectares of crop area in the country. After mangowhich has 2.3 million hectares, the largest area among fruit crops, banana has the secondlargest area as an individual crop. Globally, India is the largest producer and with its shareof 14 per cent also has the largest share of area under this crop.
Rising demand for fruits in the country, has led to sharp increase in the production ofbanana in the recent years. Banana production in India grew at a trend rate of 9.16 per centbetween 2000–01 and 2012–13. In 2012–13. Karnataka, Tamil Nadu, Maharashtra andAndhra Pradesh have the largest crop area under banana. In terms of production, Gujaratnow accounts for the largest share followed by Tamil Nadu, Maharashtra and AndhraPradesh (Table IV.9.1).
Banana requires irrigation and production is also affected by rainfall conditions. Deficientrainfall in areas where banana production is possible has an adverse impact on production.In 2012–13, when monsoon was deficient, the third advanced estimates of productionshow that production dropped to 24.9 million tonnes from 28.5 million tonnes in theprevious year. The area and production of Banana showed an increasing trend till 2010–11after which it declined (Figure IV.9.1). Yields showed a fluctuating trend with the highestachieved in 2008–09.
COMMODITY OUTLOOK ASSESSMENT
89
With the improvedrainfall situation in2013–14, productionis expected toincrease over theprevious year andour current estimateof production for theyear is 30.9 milliontonnes.
Rising demand forfruits in the country,has led to sharpincrease in theproduction of bananain the recent years.Banana production inIndia grew at a trendrate of 9.16 per centbetween 2000–01and 2012–13.

IV.9.2 Banana supply and demandDomestic demand accounts for nearly all the production of this ubiquitous fruit in thecountry. Although highly perishable, the available time lag between harvest and itsripening, allows transportation under less restrictive conditions. However, efficientdistribution chains are necessary to bring good quality fruits from long distances to theconsumers.
Banana exports from India grew at a high annual trend rate of 20.7 per cent between2000–01 and 2011–12. In the triennium ending 2011, the topmost Banana exports in the
AGRICULTURAL OUTLOOK AND SITUATION ANALYSIS REPORTS
90
Domestic demandaccounts for nearlyall the production ofthis ubiquitous fruitin the country.Although highlyperishable, theavailable time lagbetween harvest andits ripening, allowstransportation underless restrictiveconditions. However,efficient distributionchains are necessaryto bring good qualityfruits from longdistances to theconsumers.
Figure IV.9.1: Area, Production and Yields of Banana
Source: NHB
Table IV.9.1: Area, Production and Yield of Banana in the Major Producing States and All-India levelStates 2012–13 % Change in 2012–13 Share of States in
over 2011–12 2012–13 (%)Area Production Yield Area Production Yield Area Production
Andhra Pradesh 91.7 3210.7 35.0 10.7 10.7 0.0 12.7 12.9
Assam 51.5 837.0 16.2 5.0 12.3 7.0 7.1 3.4
Bihar 33.1 1701.3 51.5 3.0 7.6 4.5 4.6 6.8
Chhattisgarh 18.7 413.4 22.1 13.9 8.3 -4.9 2.6 1.7
Gujarat 70.6 4523.5 64.1 8.5 11.8 3.0 9.8 18.2
Karnataka 97.4 2529.6 26.0 6.3 7.6 1.2 13.5 10.2
Kerala 32.4 503.6 15.6 -38.3 20.1 94.4 4.5 2.0
Madhya Pradesh 26.0 1448.1 55.7 5.0 5.0 0.0 3.6 5.8
Maharashtra 82.0 3600.0 43.9 0.0 -16.6 -16.6 11.4 14.5
Orissa 27.5 521.3 19.0 0.0 3.0 2.9 3.8 2.1
Tamil Nadu 87.1 3808.0 43.7 -33.2 -43.5 -15.4 12.1 15.3
Uttar Pradesh 2.3 107.0 46.4 -92.9 -92.1 11.8 0.3 0.4
Other 101.5 1665.9 16.4 -7.7 -4.6 3.3 14.1 6.7
All India 721.8 24869.5 34.5 -9.4 -12.6 -3.6 100.0 100.0
Note: Area in ‘000 ha, production in ‘000 tonnes and yield in tonnes/ ha.Source: National Horticultural Board (NHB).

world originated from Ecuador (28.1 per cent) followed by Columbia (9.3 per cent) andPhilippines (9.1 per cent). During the same period India’s exports went to United ArabEmirates, Saudi Arabia, Nepal, Iran and Bahrain (Table IV.9.2).
India does not import Bananas. It exports small quantities to neighbouring countries andmiddle-east, amounting to less than 1 per cent of its production; however the thrusttowards exports has been increasing over the years (Table IV.9.3).
IV.9.3 PricesAlthough the WPI of Banana shows a gradual increase right from early 2008, its paceaccelerated only in mid 2012 (Figure IV.9.2). Besides the demand pressures, which are ofa longer term nature, drop in output, rising cost of production and transportation may haveaffected the price pattern in the more recent period of 2012 onwards. With the stagnationin yields, the upward pressures on prices may continue in the next few years.
Prices generally show seasonal pattern reflecting supply conditions. In 2013, prices startedto rise sharply since August, reaching a peak in November but declined in December. TheWPI of Banana increased by 20.3 per cent between 2012 and 2013. The decliningproduction along with continued high demand and rising cost pressures led to sharp pricerise. WPI of fruits and food articles as a group have shown similar trend as that of WPIof Banana, except that mid-2012 onwards the pace of increase in the WPI of fruits hasbeen less sharp than WPI of Banana.
COMMODITY OUTLOOK ASSESSMENT
91
Besides the demandpressures, which areof a longer termnature, drop inoutput, rising cost ofproduction andtransportation mayhave affected theprice pattern in themore recent periodof 2012 onwards.With the stagnationin yields, the upwardpressures on pricesmay continue in thenext few years.
Table IV.9.2: Banana Export TrendsWorld Banana Exports (%) Banana Exports from India (%)
Countries TE–2011 (%) Years TE–2011 (%)
Ecuador 28.11 United Arab Emirates 28.42
Colombia 9.28 Saudi Arabia 15.69
Philippines 9.09 Nepal 13.29
Costa Rica 9.00 Iran 11.96
Guatemala 7.25 Bahrain 10.3
Others 37.27 Others 20.34
Source: FAOSTAT.
Table IV.9.3: Banana Supply and Demand (Thousand Tonnes)Item 2005–06 2006–07 2007–08 2008–09 2009–10 2010–11 2011–12 2012–13 2013–14
Production (‘000 tonnes) 12105 16609 17647 26217 26470 29780 28455 24869 30900
Imports (‘000 tonnes) 0 0 0 0 0 0 0 0 0
Total Supply (‘000 tonnes) 12105 16609 17647 26217 26470 29780 28455 24869 30900
Exports (‘000 tonnes) 14 11 17 30 54 58 46 50 54
Total Domestic Utilisation 12090 16597 17630 26187 26415 29722 28409 24819 30846
(‘000 tonnes)
Ratio of Exports to 0.1 0.1 0.1 0.1 0.2 0.2 0.2 0.2 0.2
Production (%)
Ratio of Domestic 99.9 99.9 99.9 99.9 99.8 99.8 99.8 99.8 99.8
Consumption to Total Supply (%)
Source: NHB & CMIE.*Export and Import projections of 2013–14 are based on average growth rate for the recent five years.

The price rise in 2013 was far above the average increase seen in the previous five years.Although during May–August 2012 the year-on-year price change dropped to the averagepattern of the previous five years, it diverged again from September 2013 (Figure IV.9.3).Thus, although a favourable rainfall of 2013–14 would have a positive effect onproduction, the emerging imbalance between supply and demand on the one hand and thecost pressures on the supply chain also have an impact on prices.
AGRICULTURAL OUTLOOK AND SITUATION ANALYSIS REPORTS
92
Although afavourable rainfall of2013–14 would havea positive effect onproduction, theemerging imbalancebetween supply anddemand on the onehand and the costpressures on thesupply chain alsohave an impact onprices.
Figure IV.9.2: WPI of Banana Relative to WPI of Fruits & Food Articles
Source: Office of Economic Adviser, Government of India.
Figure IV.9.3: Comparison between Average % YoY of WPI from 2006 to 2011 and % YoY of 2012 over2013

Wholesale prices across major production and consumption regions show divergent trendsin the recent months. For instance wholesale prices in Jalgaon and Vellore show sharpfluctuations – both increase and decrease, prices in Delhi and Kolkata are relatively stable.(Figure IV.9.4).While variety differences would capture variations in absolute price levels,the differences in price change also reflect the constraints in post-harvest managementfacilities. The wholesale markets in large consuming centres such as Delhi and Kolkatamay have wider sources of supplies and see less volatile price changes than the centreswhere supply sources are more concentrated.
Among the four metros, retail prices during October to December 2013 were the highestin Kolkata (Rs 48 per dozen) and Delhi (Rs 40 per dozen). Mumbai and Chennai that arecloser to the producing regions showed rising prices till August 2013 (Rs 40–45 per dozen)and in the following months they showed a declining trend with relatively lower prices (Rs30–35 per dozen). In the smaller cities of Bhubaneswar and Jaipur, retail prices were lowerthan in the metros in most of the year (Figure IV.9.5).
COMMODITY OUTLOOK ASSESSMENT
93
The wholesalemarkets in largeconsuming centressuch as Delhi andKolkata may havewider sources ofsupplies and see lessvolatile pricechanges than thecentres wheresupply sources aremore concentrated.
Figure IV.9.4: Wholesale Prices of Banana in Selected Cities
Source: Directorate of Economics and Statistics, Ministry of Agriculture.

The variations in wholesale and retail prices across cities point to the differences acrossspace. While, assessment of differences in wholesale and retail prices requires comparisonof similar varieties, the data does reflect variations in the pattern of changes in prices at thewholesale and retail level. For instance, wholesale prices declined between December 2012and December 2013, retail prices rose. In general, the pattern shows a rising tendency inretail prices even when wholesale prices do not (Table IV.9.5).
AGRICULTURAL OUTLOOK AND SITUATION ANALYSIS REPORTS
94
Figure IV.9.5: Retail Prices of Banana in Selected Cities
Source: Directorate of Economics and Statistics, Ministry of Agriculture.
Table IV.9.4: Monthly Price Differential – Wholesale & RetailCities Dec–12 Dec–13 % Change
Wholesale Prices (Rs/Dozen)
Delhi 21.24 30 41.24
Kolkata 52.8 48 -9.09
Jalgaon 41.25 90 118.18
Vellore 18.3 18 -1.64
Retail Prices (Rs/dozen)
Cities Dec–12 Dec–13 % Change
Delhi 35 40 14.29
Kolkata 45 48 6.67
Mumbai 30.4 35 14.63
Chennai 24 30 25.00
Jaipur 22.5 35 55.56
Bhubaneshwar 25 20 -20.00
Source: Directorate of Economics and Statistics, Ministry of Agriculture.

IV.9.4 Market arrivalsIn the mandis of Delhi the per day market arrivals (average of 2008–2012) is highest in themonth of September after which arrivals decline (Figure IV.9.6). The arrivals till the monthof August 2013–14 were following the average trends, however they declined Septemberonwards. In Jalgaon, on an average arrival increased September onwards and declined in thesummer months. However, in 2013–14, arrivals increased considerably ever since January,reaching a peak in March and declined thereafter. Arrivals once again peaked in Septemberfollowing the average trend. In Bangalore, average arrivals have been more or less similarover the year with a slight decline during the summer months. However in 2013–14 arrivalsshot up in April and showed a decline in the following months. In Ahmedabad, averagearrivals were the highest in August and September showing gradual decline thereafter. Themarket arrivals have been higher in Jalgaon and to some extent in Bangalore. But inAhmedabad and Delhi, the trends in 2013–14 are not very different from the averagepattern of the recent years suggesting that the increase in output may not be very large.
COMMODITY OUTLOOK ASSESSMENT
95
The market arrivalshave been higher inJalgaon and to someextent in Bangalore.But in Ahmedabadand Delhi, the trendsin 2013–14 are notvery different fromthe average patternof the recent yearssuggesting that theincrease in outputmay not be verylarge.
Figure IV.9.6: Per Day Average Arrivals of Bananas

IV.9.5 OutlookBased on trend and rainfall data we have projected production of banana in 2013–14 at30.9 million tonnes, lower than our initial estimate of 33.8 million tonnes provided in ourNovember 2013 quarterly report. The estimated 2013–14 production is higher than theofficial third advance estimates of 24.9 million tonnes for 2012–13 but close to the fourthadvance estimates of 30.3 million tonnes for the same year. The recent price trends suggestthat increased supply has not been adequate to bring down the annual rate of increase tosingle digit levels. The market arrivals data also shows only moderate improvement insupplies.
AGRICULTURAL OUTLOOK AND SITUATION ANALYSIS REPORTS
96
Based on trend andrainfall data we haveprojected productionof banana in 2013–14at 30.9 milliontonnes, lower thanour initial estimate of33.8 million tonnesprovided in ourNovember 2013quarterly report.
Source: www.agmarknet.nic.in

IV.10 Milk
IV.10.1 Production trendsIndia has consistently been outperforming in milk production with a growth rate of over4 per cent almost double the world average. After the surge in the decade of 1970s milkproduction has sustained this momentum over the next three decades. While theOperation Flood of the 1970s and 1980s laid a foundation for improved infrastructure forcatalysing the dairy sector, consumer demand also expanded with urbanisation and incomegrowth. There has been a synergy of developments in production and consumption duringthis period.
Milk production touched the mark of 127.9 million tonnes in 2011–12 and 132.4 milliontonnes in 2012–13 recording a growth rate of 3.5 per cent in a year when monsoon rainfallwas deficient and consequent scarcity of green fodder.
The state level variations in milk yield per milch animal and contribution of each state tototal milk production of the country are significant. Ten major milk producing Indianstates produced close to 82 per cent of the total milk production in 2012–13 with the shareof Uttar Pradesh, Rajasthan, Andhra Pradesh and Gujarat being nearly 50 per cent of thetotal milk production. The average milk yield/day is the highest in Punjab for exotic-cows,non-descript cows and for buffaloes. The overall or national level average milk yield ofnon-descript cows is about 1/3 of the average milk yield of exotic-cows (Table IV.10.1).
COMMODITY OUTLOOK ASSESSMENT
97
Milk productiontouched the mark of127.9 million tonnesin 2011–12 and 132.4million tonnes in2012–13 recording agrowth rate of 3.5per cent in a yearwhen monsoonrainfall was deficientand consequentscarcity of greenfodder.
Figure IV.10.1: Compound Decadal Growth Rate of Milk Production
Source: Department of AHD&F, Government of India.

According to Indian Grassland and Fodder Research Institute (ICAR), Jhansi deficiencyof feed and fodder alone accounts for significant part of low productivity of milch animals.Though availability of crop residue (wheat and paddy straw) and concentrate feedingredients has increased in recent years with the increasing trend in the production offood crops, production of coarse cereals used as feed and fodder has stagnated. Further dueto rising demand from other livestock the gap in demand and supply of fodder for milchanimas is increasing. For improving milk yield and for maintaining growth trend in milkproduction in the coming years India has to expand area under feed and fodder crops.
AGRICULTURAL OUTLOOK AND SITUATION ANALYSIS REPORTS
98
Though availabilityof crop residue(wheat and paddystraw) andconcentrate feedingredients hasincreased in recentyears with theincreasing trend inthe production offood crops,production of coarsecereals used as feedand fodder hasstagnated.
Table IV.10.1: Milk Production and Yield 2012–13 – Major Indian States Sl. No. State State-wise total State wise total Average Milk Yield/day
Milk Production Milk Production2012–13 2012–13 Cows-Exotic Cows-Non Buffalo
(Million Tonnes) % to total Descript1 Uttar Pradesh 23.33 17.62 7.08 2.57 4.442 Rajasthan 13.95 10.53 7.67 3.67 5.623 Andhra Pradesh 12.76 9.64 7.45 2.05 4.514 Gujarat 10.31 7.79 8.81 3.95 4.785 Punjab 9.72 7.34 11.00 6.52 8.646 Madhya Pradesh 8.84 6.68 6.99 2.34 3.807 Maharashtra 8.73 6.59 6.89 1.80 4.148 Haryana 7.04 5.32 8.17 5.07 7.359 Tamil Nadu 7.00 5.29 6.81 2.72 4.4010 Bihar 6.84 5.16 6.05 2.87 3.9511 Karnataka 5.72 4.32 6.03 2.32 2.6512 West Bengal 4.86 3.67 5.56 1.91 5.0513 Kerala 2.79 2.11 9.11 2.03 2.5414 Orissa 1.72 1.30 6.15 1.47 3.7315 Jharkhand 1.68 1.27 5.94 1.55 5.6916 Jammu & Kasmir 1.63 1.23 5.66 2.63 4.8417 Uttrakhand 1.48 1.12 6.82 1.93 4.1518 Chhattisgarh 1.16 0.88 4.79 1.18 4.9419 Himachal Pradesh 1.14 0.86 4.68 1.62 3.5620 Assam 0.80 0.60 4.00 0.95 2.8521 Other States 0.93 0.70 6.76 2.23 3.83
All India 132.43 100.00 7.02 2.36 4.8
Source: Department of AHD&F, Government of India.

IV.10.2 Consumption and prices Milk and milk products remain an important source of nutritional security and with therising levels of income, the demand for all dairy products is increasing at a faster rate.Although India’s per capita dairy consumption has surpassed the world average in recentyears it is still well below the per capita consumption in the developed countries. Yet, it issignificantly higher at 105.5 kg/year in India as compared to 71.7 kg/year in thedeveloping countries.
With production growing at more than double the rate of growth of population in Indiasince 1970’s, its per capita availability appears to have reached a level close to the demandlevel indicated by its reaching world average per capita consumption. However, given thelarge gap in consumption levels between developed countries and India, milk consumptionis expected to increase at nearly the same pace as in the recent years as income levels oflower income groups rise.
COMMODITY OUTLOOK ASSESSMENT
99
Although India’s percapita dairyconsumption hassurpassed the worldaverage in recentyears it is still wellbelow the per capitaconsumption in thedeveloped countries.Yet, it is significantlyhigher at 105.5kg/year in India ascompared to 71.7kg/year in thedevelopingcountries.
Figure IV.10.2: Average Milk Yield/day
Table IV.10.2: Per Capita World Dairy Consumption (kg/year)Region 2009 2010 2011 2012 2013 %Change
2013 over Estimated Projected 2012
World 101.7 104.6 105.2 107.3 108.2 0.8
Developed countries 233.9 234.1 234.6 237.0 236.2 -0.3
Developing countries 66.7 69.4 71.7 74.0 75.6 2.2
India# 99.6 102.6 105.5 108.7 111.9 3.0
Source: OECD-FAO Food Outlook 2013, estimates for India are based on the Dept. of AHD&F estimates for 2009–2011 and are for financial yearApril–March.# Projections for India for 2012 and 2013 are based on annual growth rate of 3 per cent based on the pattern in 2009–2011.Note: The dairy consumption includes milk products also.

IV.10.3 Price trendsAs milk production increased at an annual rate of 4 per cent or more in the first decade ofthis century, its consumption was achieved even when prices were rising above the price offoodgrain indicating continued demand growth ( during 2001–02 to 2004–05). Increase inWPI for milk was significantly lower than the increase in WPI for foodgrains during2005–06 to 2008–09 and the trend reversed during 2009–12. The price rise of milk hasmoderated again since 2012–13 despite selectively permitting exports indicating supply-demand balance in the sector at the current levels of income.
However, a review of the relative price of milk with reference to another livestock productsuch as eggs for the period 2009–10 to 2013–14 indicates that milk prices have remainedremunerative with respect to other products (Table IV.10.3). Milk prices have alsoincreased faster than dairy product prices as a group. However, the feed inputs are nowbecoming more expensive relative to the milk price. Whether it is grains, pulses, fodder oroil cake, milk prices have increased more slowly than these inputs, during 2012–13 and2013–14. Feed grain prices in fact have increased faster than fodder implying even greaterneed to improve availability of fodder at economic prices. Unless there are significantproductivity gains, rising feed prices are likely to put upward pressures on milk prices inthe short as well as medium-term.
AGRICULTURAL OUTLOOK AND SITUATION ANALYSIS REPORTS
100
As milk productionincreased at anannual rate of 4 percent or more in thefirst decade of thiscentury, itsconsumption wasachieved even whenprices were risingabove the price offoodgrain indicatingcontinued demandgrowth.
Unless there aresignificantproductivity gains,rising feed prices arelikely to put upwardpressures in theshort as well asmedium-term.
Figure IV.10.3: Trends in the WPI for Milk and Foodgrains: % YOY

The underlying changes in the dairy sector are also reflected in the expansion ofproduction of value added dairy products and exports of items such as skim milk powder.Expansion of market for dairy sector, however, will have to be achieved by improvingproductivity. Otherwise, the input constraints will also constrain the growth of outputmarket as output prices rise to ensure returns to investments in the dairy sector.
IV.10.4 TradeInternational dairy products prices after showing a steep hike during 2007 and 2010 weredown in the intervening periods and moved up again at a faster rate during 2013 (FigureIV.10.4) indicating production constraints in some of the traditional exporters such asNew Zealand, European Union and Australia resulting in limited availability of the milkproducts for export.
COMMODITY OUTLOOK ASSESSMENT
101
The underlyingchanges in the dairysector are alsoreflected in theexpansion ofproduction of valueadded dairy productsand exports of itemssuch as skim milkpowder.
Table IV.10.3: WPI of Milk Relative to the Selected Other Livestock Products and Inputs: 2004–05=100Item 2009–10 2010–11 2011–12 2012–13 2013–14
Apr–Dec
I. Other livestock products
I.1 Dairy products 105.5 115.7 113.1 118.2 122.1
I.2 Eggs 102.0 106.3 106.7 106.2 104.4
II. Feed inputs
II.1 Feed cereals 89.9 99.3 91.0 88.8 86.2
II.2 Pulses 76.8 89.3 96.1 88.2 95.4
II.3 Oilseeds 108.5 124.5 122.2 105.1 79.6
II.4 Oil cakes 87.5 104.3 110.7 98.7 96.2
II.5 Fodder 102.8 94.6 101.1 92.1 83.0
Note: Feed cereals taken here are jowar bajra and maize.
Figure IV.10.4: FAO International Dairy Price Index – % change YOY
Source: FAO.Note: The FAO dairy price index consists of butter, SMP, WMP, cheese, casein price quotations.

India allowed dairy exports in a phased manner in the last two years at a time when dairyconsumption in the Asian region was increasing. It’s has already exported close to 100,000tonnes of SMP during 2013–14. India is a major beneficiary of the rising internationalmilk product prices. Its main customers are neighbouring Bangladesh and markets in thenear east and North Africa, including Egypt, Algeria, Saudi Arabia and Yemen.
Development of adequate processing and distribution network to help stabilize domesticsupplies is necessary when there is greater integration of Indian dairy sector with the globalmarkets over time.
IV.10.5 AssessmentIn view of the normal, well distributed and extended monsoon during the current year,milk production during 2013–14 is projected to grow at the historical rate of over 4 percent, significantly higher than the rate of growth of 3.5 per cent achieved during previousyear (2012–13). With decline in rate of price rise of milk as reflected in the WPI in thelast two years and growing domestic, and export demand for dairy products, domesticprices of milk and milk products are also expected to experience increase at a higher levelunless there are significant gains in productivity of the sector.
The FAO Dairy Price Indexwhichaveraged 264.6 points in December 2013 increased 26.7per cent during the year and 8.4 per cent in the last six months indicates softening of thecurrent higher International dairy products prices and may dampen export of Indian dairyproducts. Managing increased production will require efficiencies in the sector to retainmomentum of consumer demand.
AGRICULTURAL OUTLOOK AND SITUATION ANALYSIS REPORTS
102
Development ofadequate processingand distributionnetwork to helpstabilize domesticsupplies isnecessary whenthere is greaterintegration of Indiandairy sector with theglobal markets overtime.

As the financial year 2013–14 comes to a close, the available estimates suggest that theoverall GDP growth at constant prices is likely to be about 5 per cent, supported by sharpimprovement in the growth of agricultural and allied sectors from 1.4 per cent in theprevious year to 4.6 per cent in the current year. The improvement in agriculture’s output in2013–14 is reflected in the estimated foodgrain production of 263.2 million tonnes ascompared to a harvest of 257.1 million tonnes in the previous year. All the increase infoodgrain production has come from rabi season production as kharif foodgrain productionis estimated at nearly the same level in both the years at about 128 million tonnes.
The rainfall in the monsoon season of 2013 was 6 per cent above normal supportingproduction conditions in both kharif and rabi seasons. Excessive rains in the closing andpost monsoon month of October, especially in the central and eastern states had adverseeffects on kharif production, the overall agricultural output benefitted from the copiousrainfall.
The estimated production of other major food commodities as per the 2nd AE for 2013–14are:
� Among the major oilseeds, production of groundnut is projected at 9.1 million tonnes,up from a low 4.7 million tonnes in the previous year. In the case of soybean, the 2ndAE of production, the 2013–14 output is about 2 million tonnes lower than the revisedestimate of 14.67 million tonnes in the previous year. The excess rains in MadhyaPradesh in October led to crop damage and lower estimates of production. The rapeseedand mustard production is projected to be maintained at about 8 million tonnes. Theoverall production of nine major oilseeds is projected at 33 million tonnes, up from 30.9million tonnes in the previous year.
� Sugarcane production is 345.9 million tonnes, up from 341.2 million tonnes in theprevious year.
Based on the information on rainfall and trend these quarterly reports also provide anassessment of output of the major food commodities. In the current report, the foodgrainproduction in 2013–14 is projected at 267.9–272.3 million tonnes, mainly because of higherestimated production of kharif rice and bajra. The estimates based on the average rainfalland trend may not capture the impact of excessive rains in some regions and deficientrainfall particularly in the eastern region during the monsoon season and therefore providean upper bound on the estimates for 2013–14.
The report also provides production estimates for onion, potato and banana among thefruits and vegetables and milk among the livestock products.
The estimated output of onion in 2013–14 is estimated to have increased to 18–19 milliontonnes, up from 16.8 million tonnes in the previous year. Potato production is estimated at44.8–46.4 million tonnes, marginally higher than the production estimate for the previousyear. In the case of milk, production is estimated to increase by 4.3–4.5 per cent in 2013–14over the 132.43 million tonnes production in the previous year.
PART V
Conclusions
103
As the financial year2013–14 comes to aclose, the availableestimates suggestthat the overall GDPgrowth at constantprices is likely to beabout 5 per cent,supported by sharpimprovement in thegrowth of agriculturaland allied sectorsfrom 1.4 per cent inthe previous year to4.6 per cent in thecurrent year.
In the current report,the foodgrainproduction in2013–14 is projectedat 267.9–272.3million tonnes. Theestimates based onthe average rainfalland trend may notcapture the impact ofexcessive rains insome regions anddeficient rainfallparticularly in theeastern regionduring the monsoonseason andtherefore provide anupper bound on theestimates for2013–14.

The price scenario during the year has generally reflected production conditions. The year-on-year increase in the WPI for food articles dropped from close to 19 per cent betweenAugust and November 2013 to below 14 per cent in December 2013 as the impact of kharifharvest began to have an impact on prices. In the case of onion, the price rise dropped fromthe height of triple digit annual rates to double digit rate by December 2013 and further to8.8 per cent in January 2014. A key feature of the overall price scenario is the stable pricesof food commodities in the international markets. The FAO Food Price Index has shownnegative year-on-year changes throughout 2013 as global production recovered from thedrought effects of the previous year. short-term projections of the food price scenarioindicates that year-on-year food inflation, based on WPI, may remain at 6–7 per cent in thenext 2–3 months.
The report also presents a review of market arrivals and prices at wholesale and retail levelin the major markets of commodities in the case of selected fruits and vegetables to correlatethe trends with the supply and demand conditions. The indicators reflect improved supplyconditions of onion but a mixed scenario for potato.
The supply-demand balances for the commodities covered in this report point to therelatively large stocks of rice, wheat and sugar relative to the nominal stocks in the case ofother commodities such as onion, potato, banana and pulses. The post-harvest managementof perishables would play a critical role in achieving price stability in these crops asproduction shocks induced by weather fluctuations can be expected to occur. In the currentmarketing year, based on the expectation of international trade flows of the previous year,the supplies available for domestic utilisation are estimated to be at nearly the same level incomparison the previous year.
Using the data from FAO and also consumption expenditure surveys of National SampleSurvey Organisation, the present report also draws attention to the trends in foodconsumption. While there is a trend increase in the per capita consumption of calories andfats, improvement in the consumption of proteins has been marginal over the years. Morestriking is the change in terms of sources of nutrition: per capita consumption of livestockproducts is rising and becoming a growing source of calories and proteins relative tovegetable sources. Per capita consumption of fruits and vegetables is increasing and that ofcereals has reduced. The trends are similar in rural and urban areas. The changing trendsreflect changing consumer preferences and also availability of food commodities.
The policy developments in the short-term have focused on achieving price stability andincreasing supplies for consumption. The experience of heightened food inflation in therecent years has highlighted the need for investments in efficient post-harvest managementand marketing infrastructure for the farm sector.
AGRICULTURAL OUTLOOK AND SITUATION ANALYSIS REPORTS
104
The report alsopresents a review ofmarket arrivals andprices at wholesaleand retail level in themajor markets ofcommodities in thecase of selectedfruits and vegetablesto correlate thetrends with thesupply and demandconditions. Theindicators reflectimproved supplyconditions of onionbut a mixed scenariofor potato.
While there is atrend increase in theper capitaconsumption ofcalories and fats,improvement in theconsumption ofproteins has beenmarginal over theyears. More strikingis the change interms of sources ofnutrition: per capitaconsumption oflivestock products isrising and becominga growing source ofcalories and proteinsrelative to vegetablesources.

Meetings Organised under the Project, “Agricultural Outlook andSituation Analysis for Food Security” during October 2013–March2014
Monthly Briefings held in the Ministry of Agriculture, Krishi BhawanTwenty second monthly briefing was held on November 18, 2013 under the chairmanship of Secretary(Agriculture and Cooperation). Mr Satish Chander, Director General, Fertiliser Association of India, made apresentation on “Developments in the Fertiliser Sector, Impact on Fertiliser use and Food Production”.
Twenty third monthly briefing was held on December 23, 2013 under the chairmanship of Secretary(Agriculture and Cooperation). Two presentations were discussed at this meeting. Dr P. Parthasartahy Rao,Assistant Research Programme Director and Principal Scientist, Markets, Institutions and Policy, ICRISAT,Hyderabad made a presentation on Millets Utilisation, Prospects and Challenges for Meeting NutritionalNeeds of India”. Dr K. N. Rai, Principal Scientist Pearl Millet Breeding and Director of Harvest Plus IndiaProgramme, ICRISAT, Hyderabad, spoke on nutrition dimension of millets with a presentation titled “Nutri-cereal Millets”.
Twenty fourth monthly briefing was held on January 13, 2014. The Secretary (Agriculture and Cooperation)chaired the meeting. Dr Malavika Dadlani, Former Joint Director (Research), IARI, New Delhi, presented“Current Status and Outlook for Seed Sector with respect to productivity and production of food commodities”.
Twenty fifth monthly briefing was held on January 28, 2014 under the chairmanship of Secretary (A&C). MrMerritt Cluff, formerly with Food and Agriculture Organisation (FAO) made a presentation on “China’smedium-term agricultural outlook and its global implications”.
Twenty sixth monthly briefing was held on March 10, 2014. Mr T. S. Narang, Grains Trade Analyst made apresentation on “India’s Rice Export Outlook”. The meeting was chaired by the Secretary (A&C).
