about the software - centers for disease control and ... the permeation curve can be copied into the...
TRANSCRIPT
1

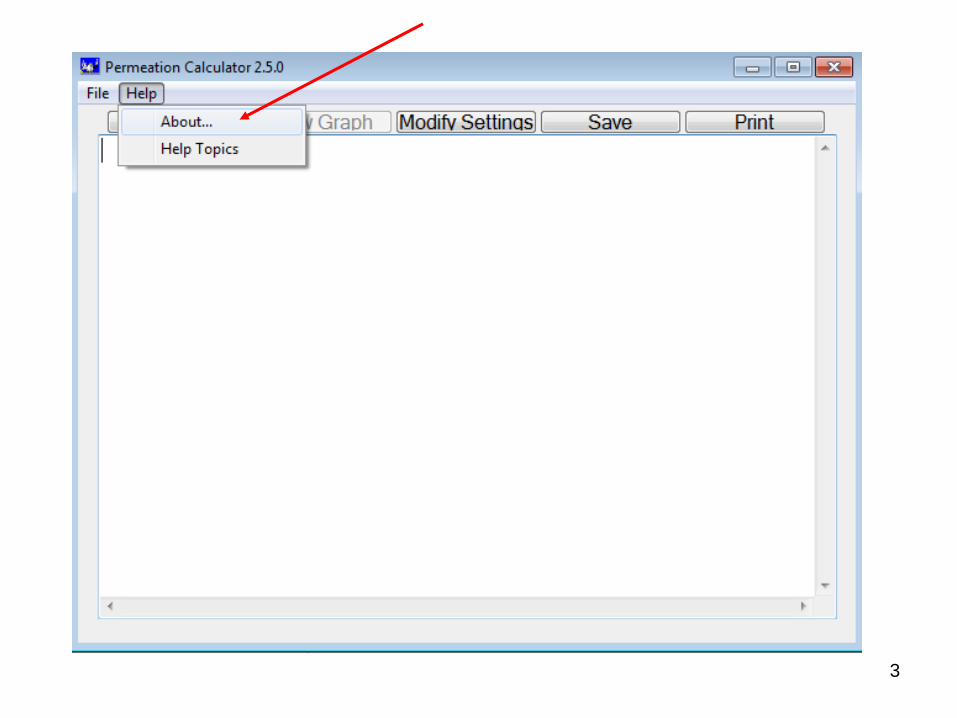
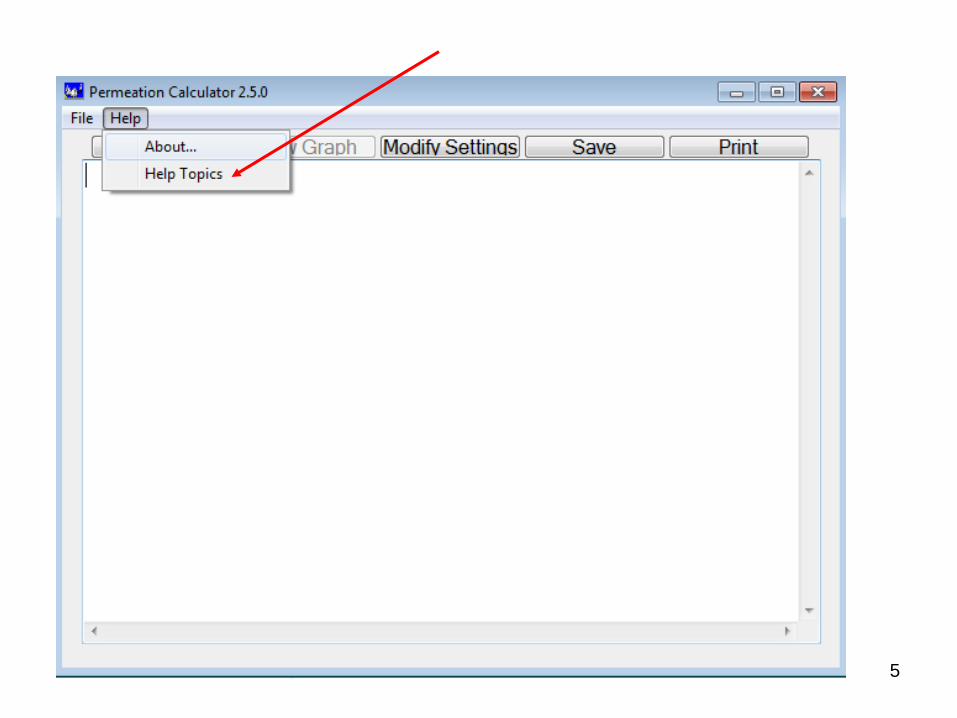
About the Software
2
3

4
5

6

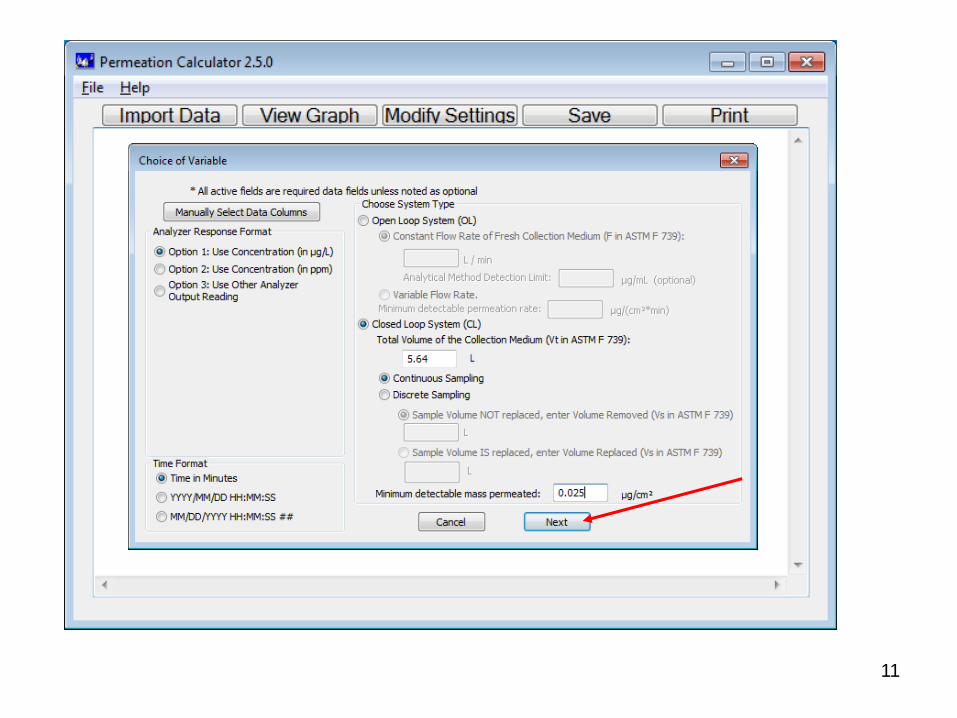
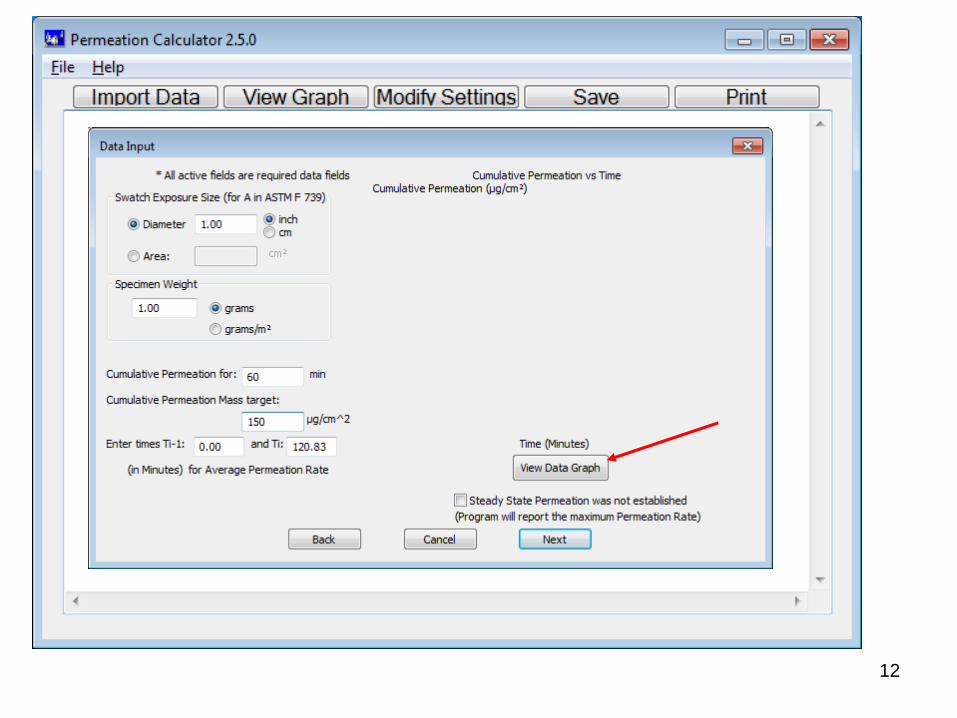
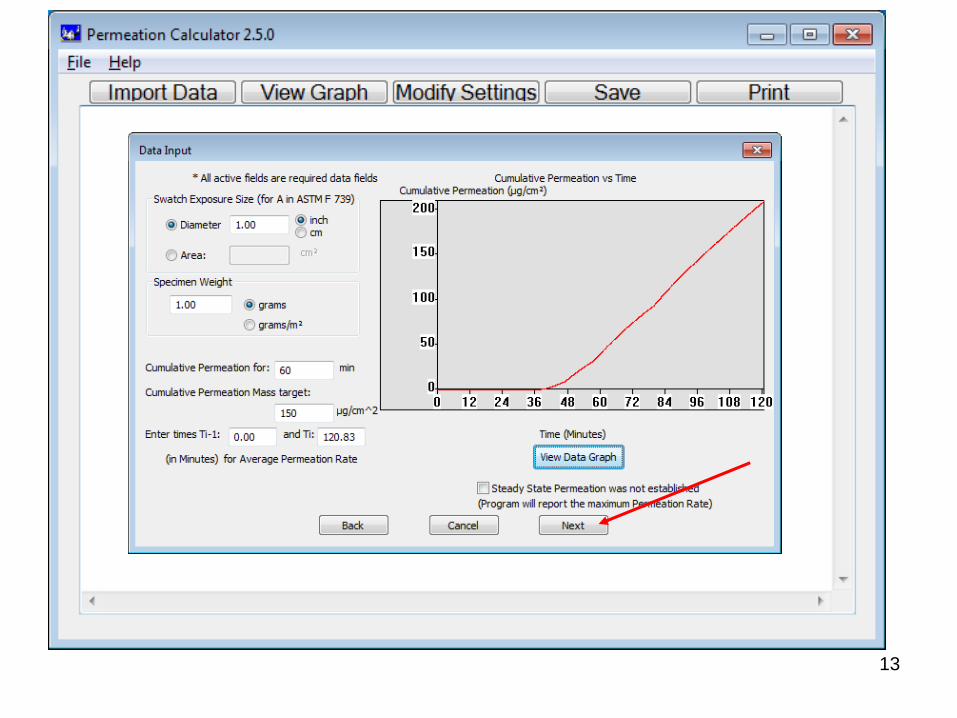
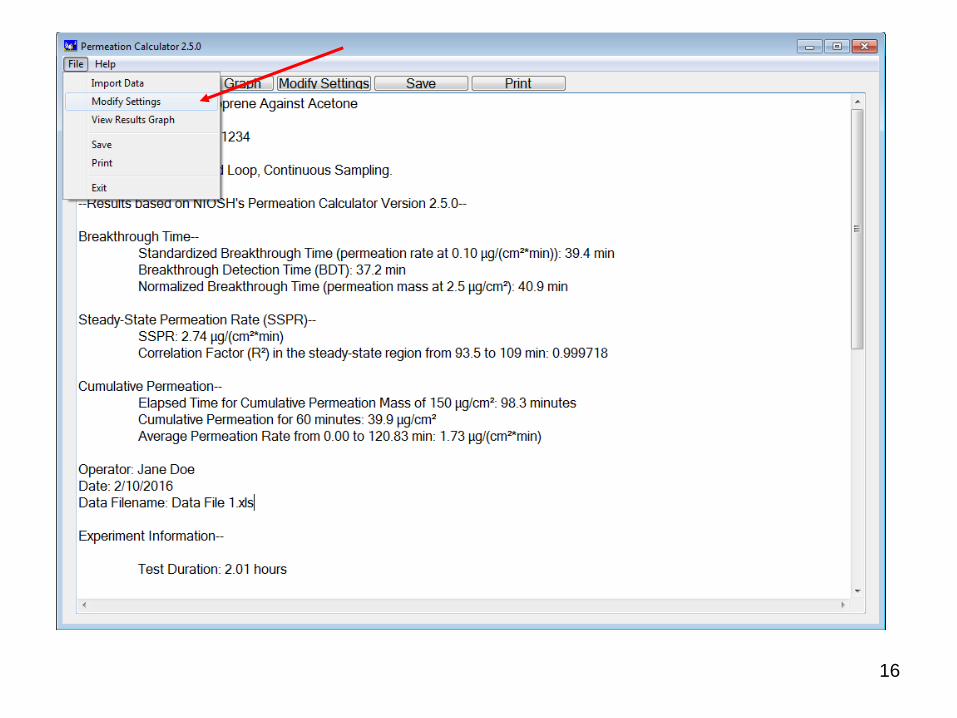
An Example for a Closed-loop
System with Continuous
Sampling
7

8
9

10
11
12
13

14

15
16

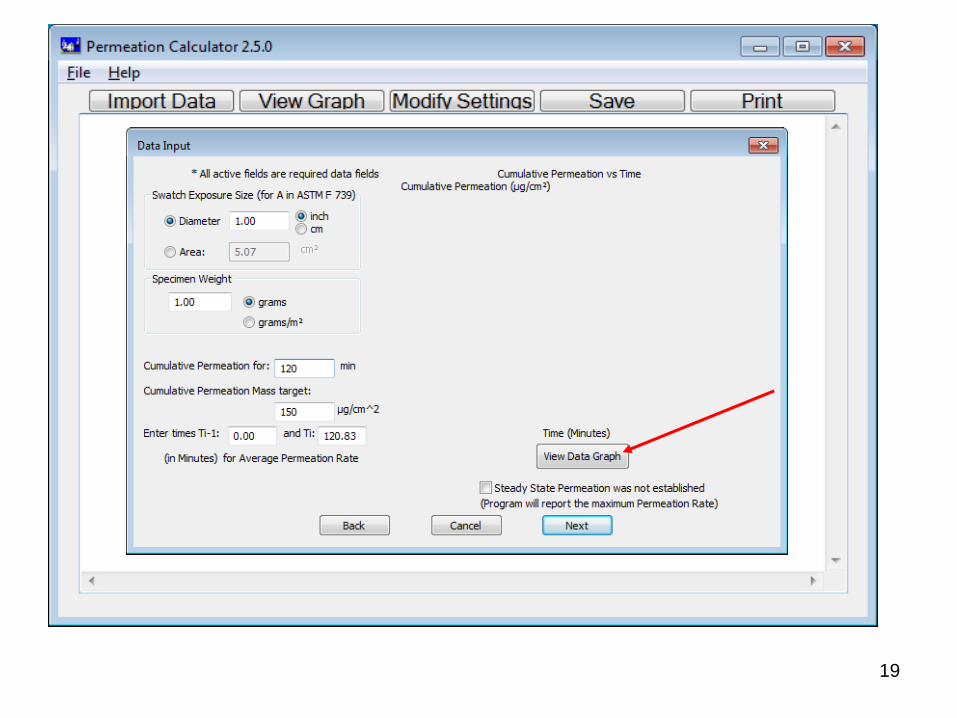
An Example of Using Modify Settings− Change Cumulative Permeation from
60 min to 120 min
17
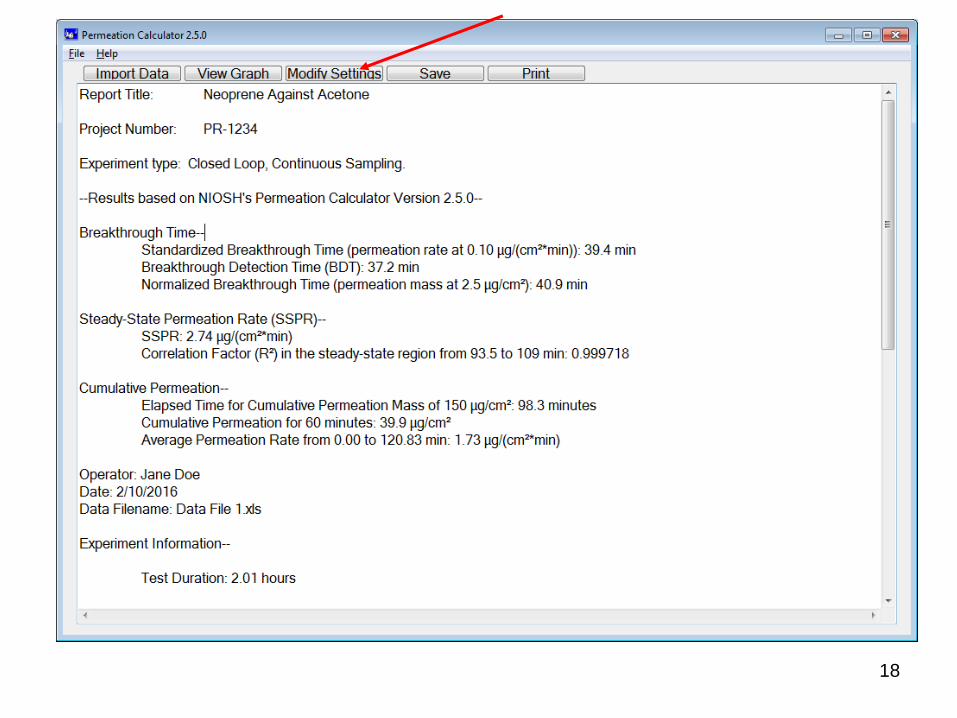
18
19

20

21
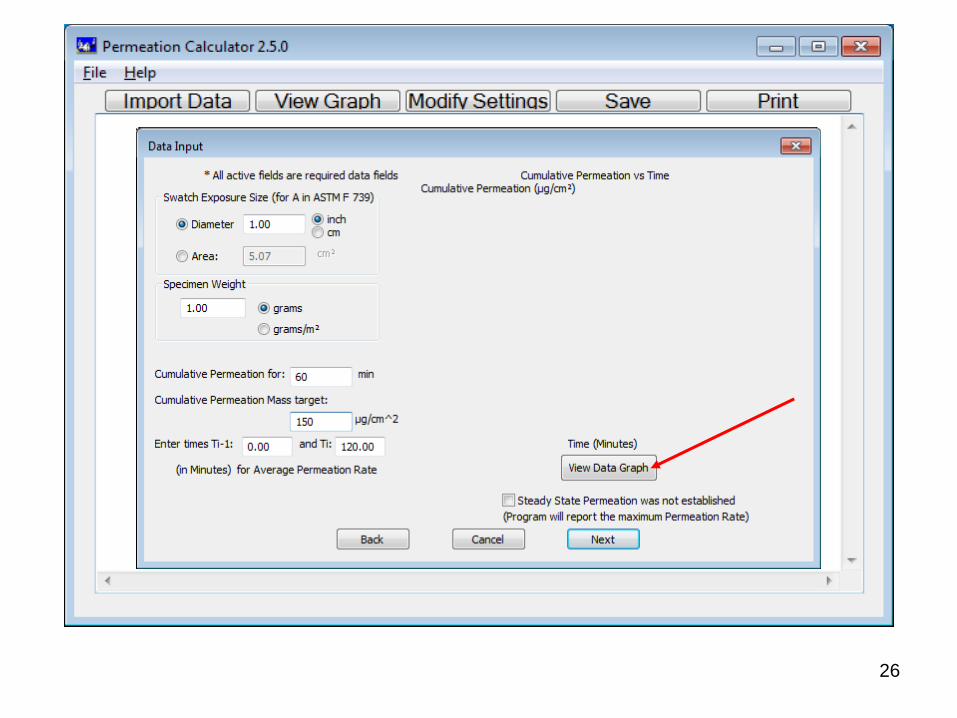
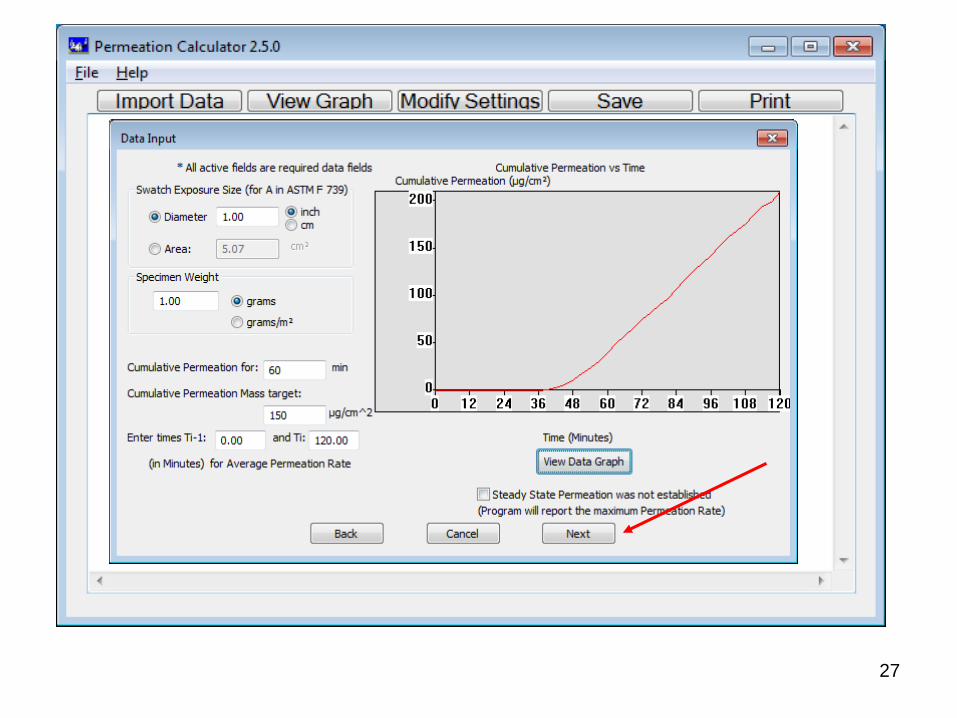
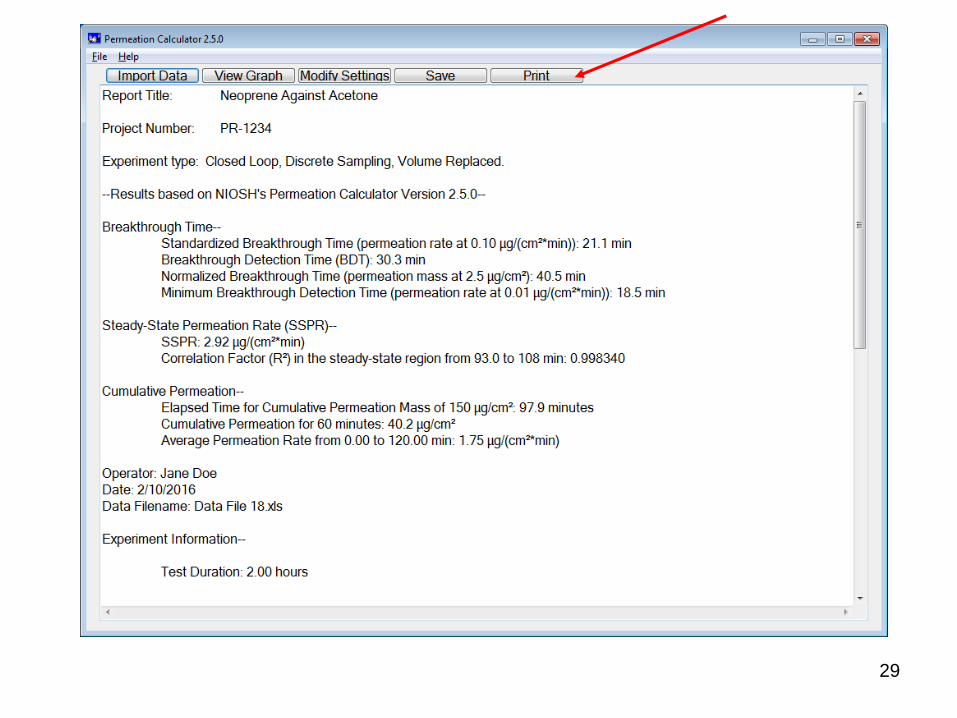
An Example for a Closed-loop System with Discrete
Sampling and the Sampling
Volume is Replaced
22
23
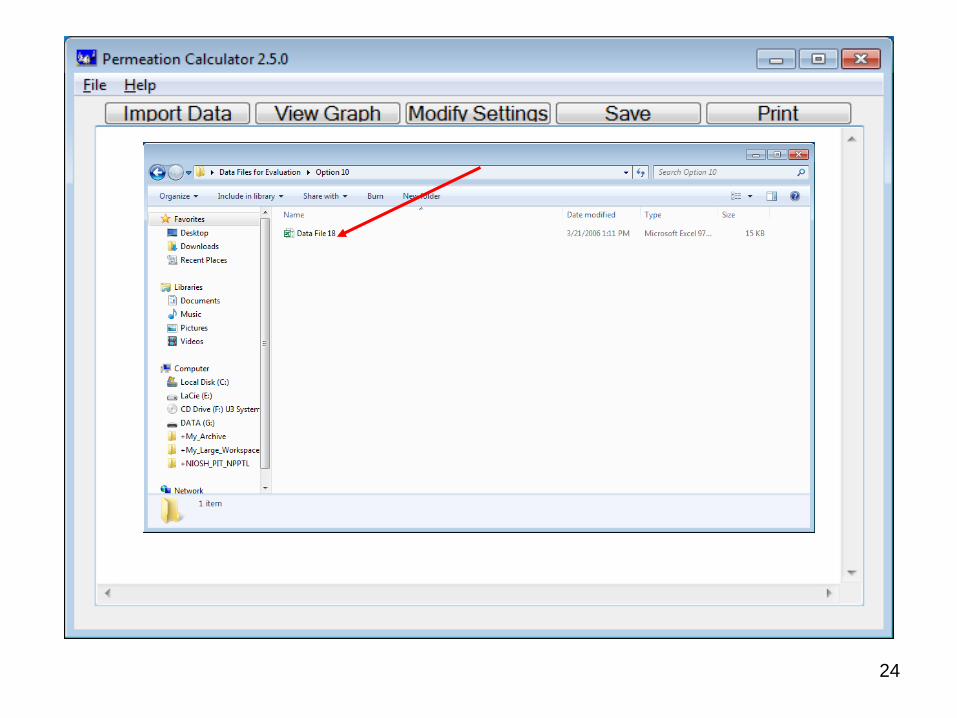
24

25
26
27

28
29
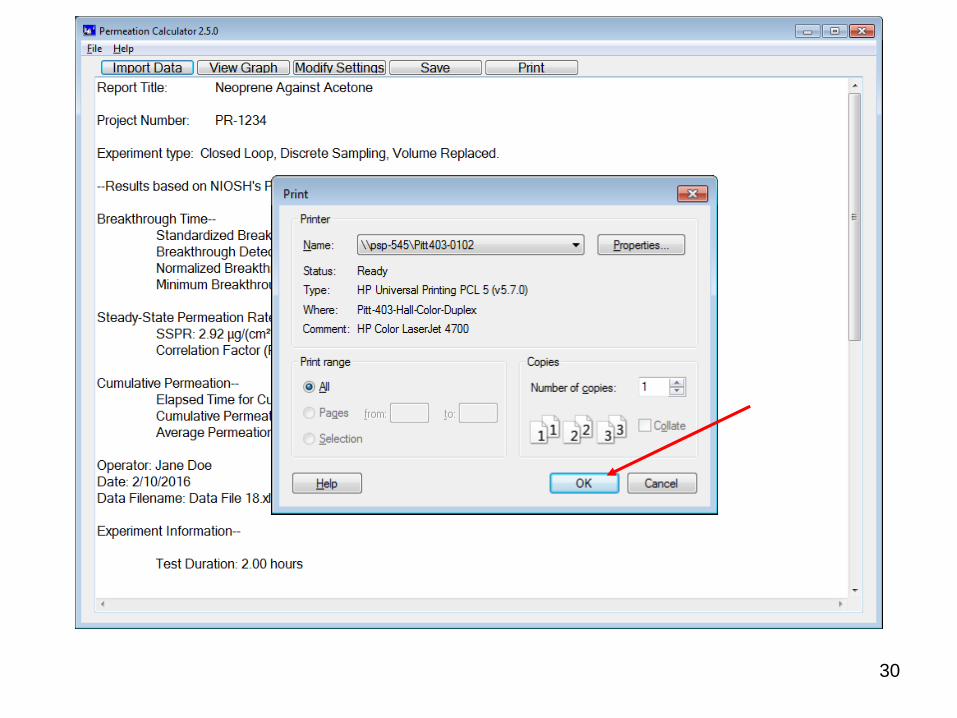
30
31
32
33

34
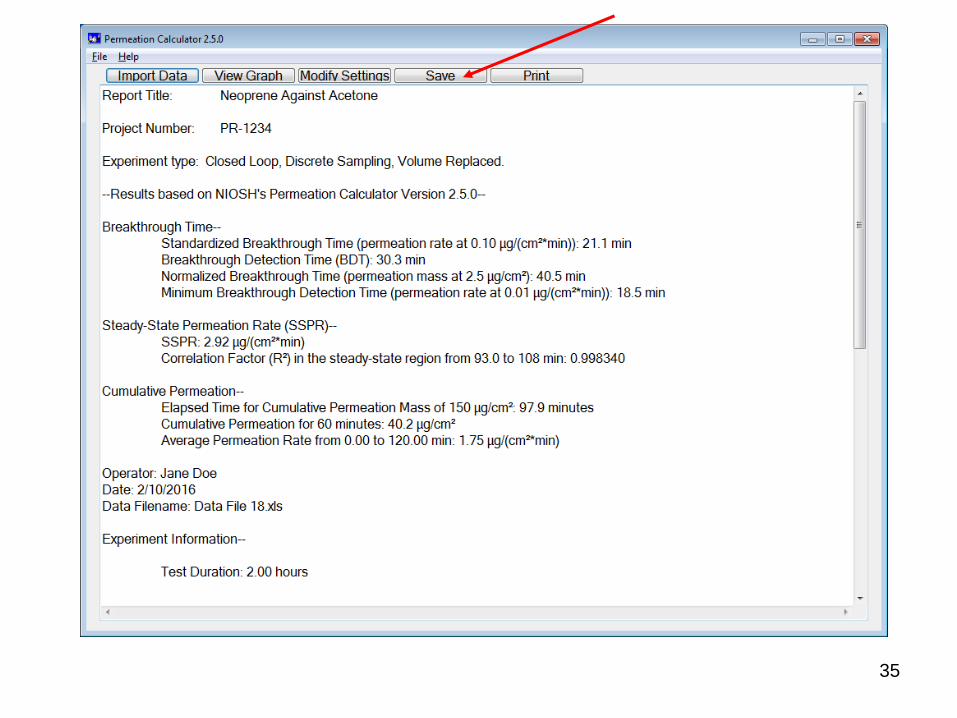
35

36

37

38
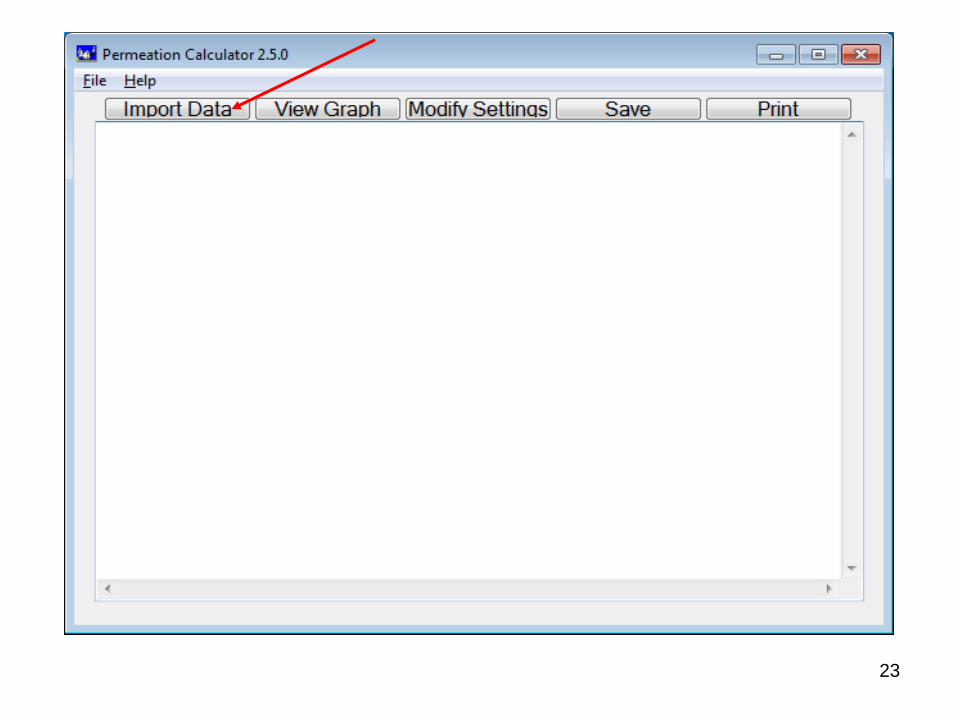
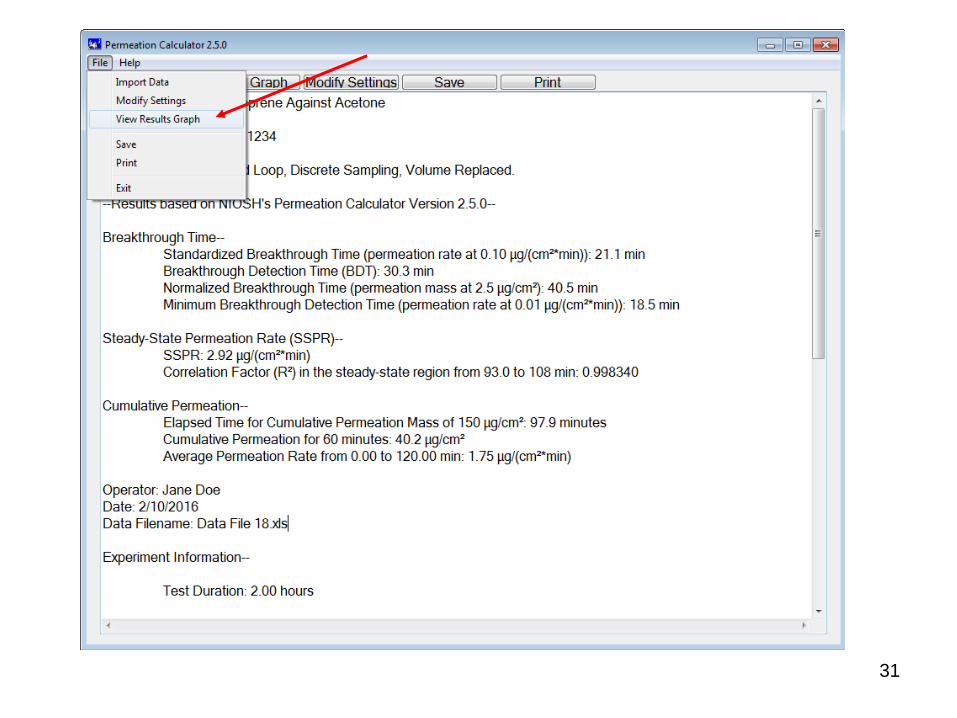
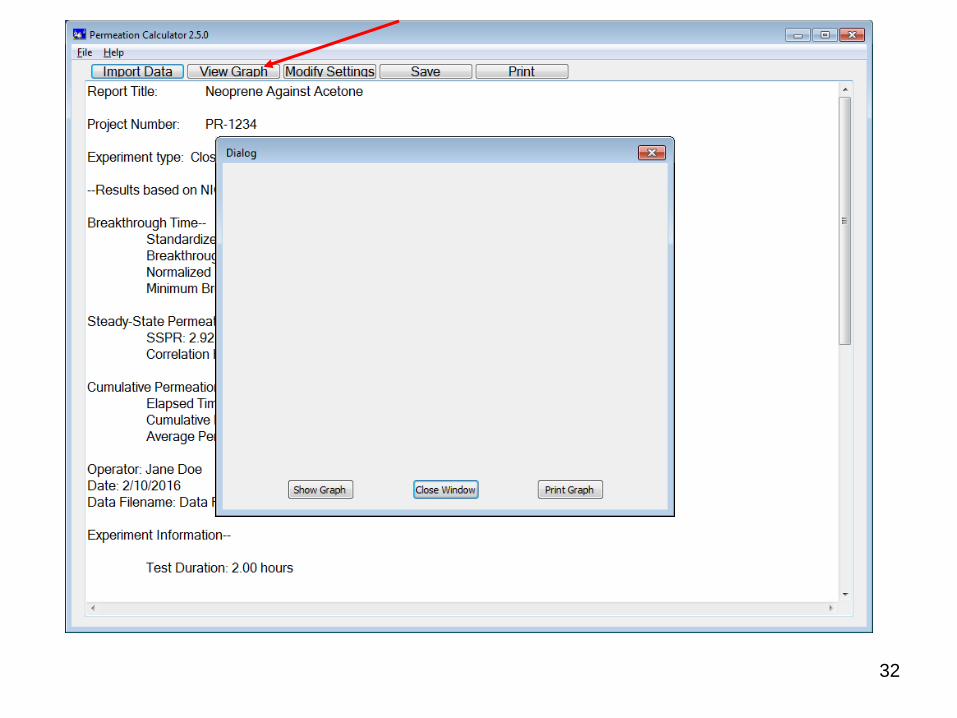
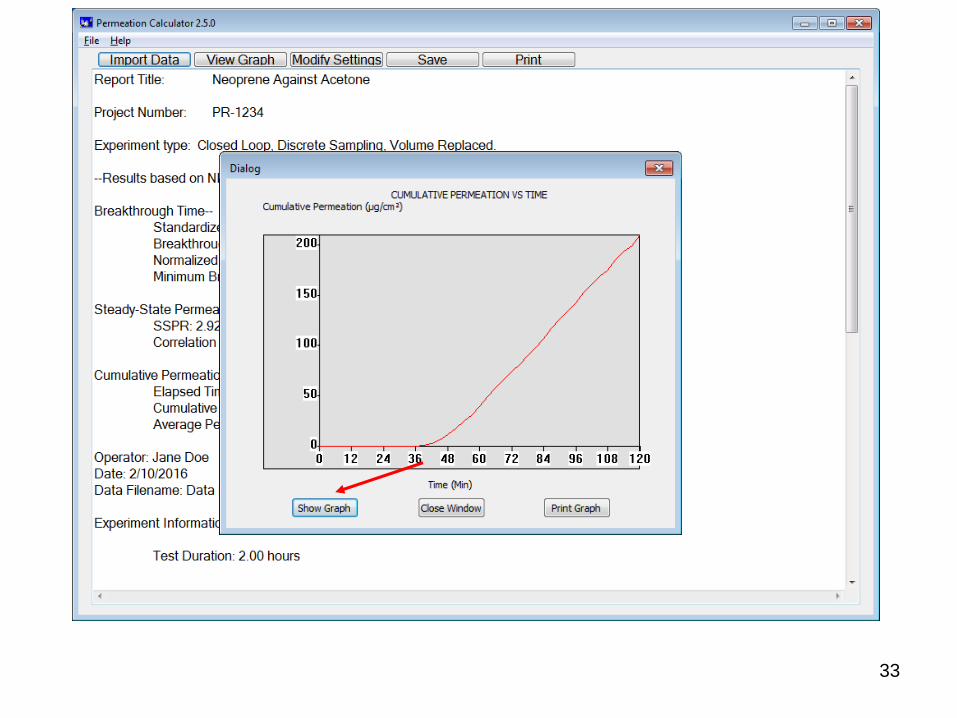
The permeation curve can be copied into the Excel file formatted
report by selecting “View Graph” and pressing “Ctrl/Print Scrn”, then
pasting the image into the report.
39
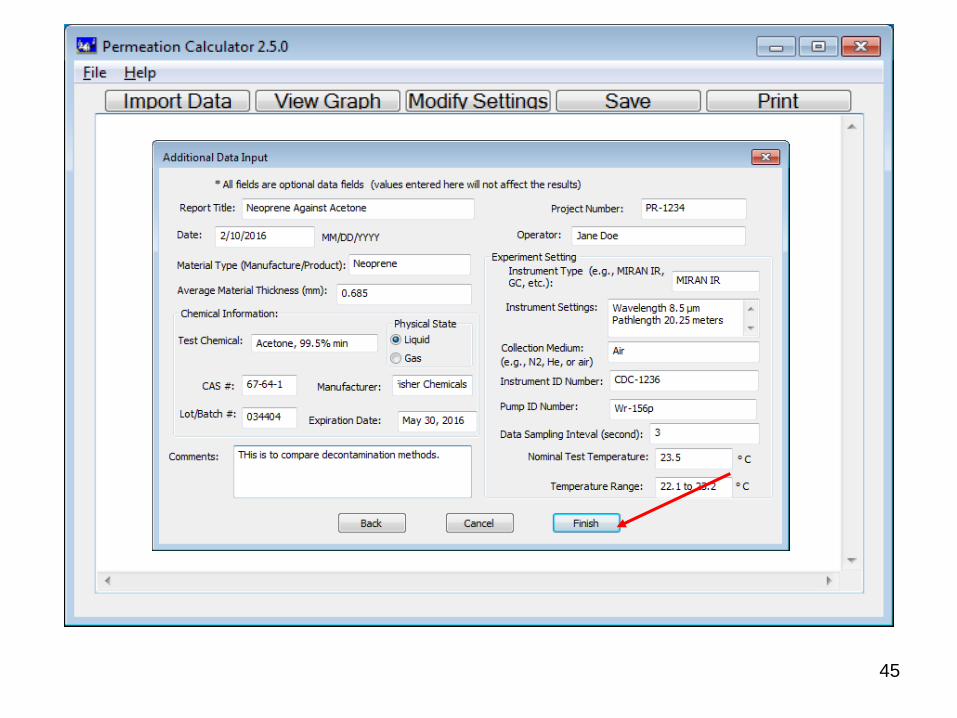
An Example for an Open-loop
System with Constant Flow Rate
of Fresh Collection Medium
40

41

42
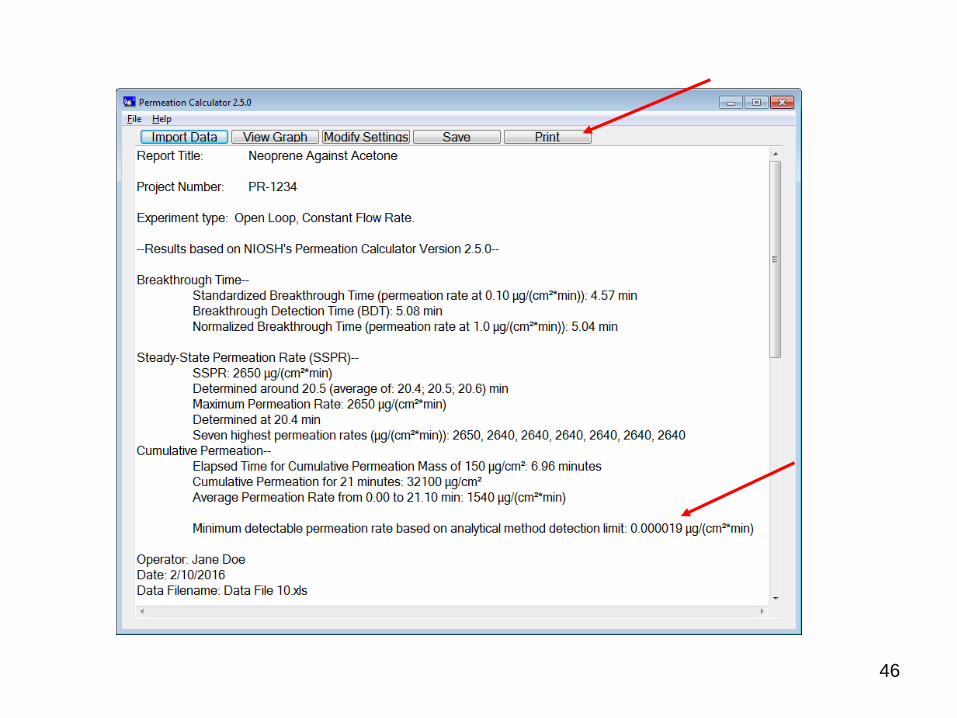
For open loop testing under a constant flow rate, there is an option to enter a
value for the “Analytical Method Detection Limit” to calculate the “Minimum
Detectable Permeation Rate” (see the report on the last slide)

43
44
45
46