about the value of jobs coalition - business oregon business alliance 200 sw market st., suite 150...
TRANSCRIPT

PORTLAND BUSINESS ALLIANCE200 SW Market St., Suite 150Portland, Oregon 97201www.valueo�obs.com
PUBLISHED BY:
a check-up on the PORTLAND-REGION’S ECONOMIC HEALTH2016
MULTNOMAH
CLACKAMAS
WASHINGTON
CLARK
YAMHILL
SKAMANIACOLUMBIA
Sandra McDonough, President & CEO, Portland Business Alliance
Jay M. Clemens, President & CEO, Associated Oregon Industries
Duncan Wyse, President, Oregon Business Council
Bill Wyatt, Executive Director, Port of Portland
Ryan Deckert, President, Oregon Business Association
Janet LaBar, President & CEO, Greater Portland, Inc.
For more information about this report or other Value of Jobs studies, go online to www.valueofjobs.com.
� 2016 Check-up on the Portland-Region’s Economic Health
� 2015 Check-up on the Portland-Region’s Economic Health
� 2015 Middle-Income Jobs
� 2014 Economic Impacts of Congestion
� 2014 Check-up on the Portland-Region’s Economic Health
� 2014 Portland-Metro’s Health Care
� 2013 Check-up on the Portland-Region’s Economic Health
� 2013 International Trade & the Portland Harbor’s Impact
� Higher Education & Regional Prosperity
� 2012 Check-up on the Portland-Region’s Economic Health
� Portland-Metro’s Manufacturing Sector study
� Land Availability: Limited Options study
� Portland-Metro’s Traded Sector study
� 2011 Check-up on the Portland-Region’s Economic Health
� 2010 International Trade study
� 2010 Check-up on the Portland-Region’s Economic Health
About the Value of Jobs Coalition
The Value of Jobs Coalition is based on the premise that in order to have a prosperous, healthy Portland region with a good quality of life, we need more private-sector jobs. The coalition began with an economic study in the fall of 2010, which showed important trends about the Portland-metro economy. A number of other studies have followed that highlight the region’s economic opportunities and challenges. Find out more at:
www.valueofjobs.com.
IntroductionBy a number of economic measures, Portland-metro’s regional economy continued to rebound in 2016. A growing economy, increasing jobs and wages and high productivity are significant strengths. As Portland-metro continues to grow, it is undergoing fundamental economic shifts that are good news for some, but prosperity is not equally spread across the region. That is the challenge ahead: How can we better share prosperity across all corners and among all residents of Portland-metro?
The Value of Jobs Coalition has tracked the health of Portland-metro’s economy in an annual Economic Check-Up report since 2010 — through the dark years of the Great Recession and into a slow-moving job recovery that finally picked up pace in 2014. Today, the Portland-metro job market remains strong with a total of 165,950 new jobs added since the depth of the recessionary losses. In a change from last year’s Economic Check-Up, nearly every industry, with the exception of manufacturing, has recovered the total number of jobs lost in the recession.
With improvements in the job market, more people are going to work. Past Value of Jobs reports have shown that Median Household Income (MHI) in Portland-metro, along with the nation, stagnated for low- and middle-income workers over the last several years. By contrast, this year’s report shows that income gains were broadly shared across all levels and poverty declined. Though Portland-metro’s incomes have not risen back to pre-recession levels, the region’s income growth between 2015 and 2016 outpaced the U.S. average as well as all comparator regions.
Another continued bright spot for Portland-metro is Gross Metropolitan Product (GMP,) which ranks 8th among major U.S. metro areas. While other regions have stronger job growth, Portland-metro continues to be a productivity powerhouse due to historic strength in electronics and semiconductor manufacturing.
This year’s report also suggests that Portland-metro is separating from some of its peer comparator regions. In terms of job and income growth, Portland-metro is inching closer to the larger metro areas that were once considered aspirational comparators, and with that comes challenges with being a more populous region.
If we are to create a strong Portland-metro and economic prosperity for everyone, tackling the following challenges must be a priority:
� Household income varied dramatically by city, and household growth by income shows disparities are on the rise. Long-term, the region is drifting toward a higher-income profile with net in-migration concentrated at the high end. Lower-income households are moving further from the region’s center, and some may be exiting Portland-metro altogether. These statistics underscore that the primary goal of the Value of Jobs Coalition — growing quality family-wage jobs — must continue so all residents have the opportunity to share the prosperity.
� An insufficient housing supply continues to impact affordability. Household displacement is rising across the region except for gentrified areas in inner Portland. Failure to address these interregional affordability challenges may impact economic mobility and opportunity, stressing the region’s infrastructure as households move farther from job centers and the city core.
� Communities of color are not equitably sharing in the region’s growing prosperity. As Portland-metro continues to grow and become more diverse, ensuring widely available opportunities for all residents will be critical for the region to thrive.
This report is an annual point-in-time look at the Portland-metro economy. It provides a foundation that can be used to address the issues raised above. The Value of Jobs Coalition is committed to finding solutions to these challenges, bringing the strength of the private sector to bear to create opportunities for everyone.
REPORT SOURCESThe data and analysis of this report were compiled by ECONorthwest for the Value of Jobs Coalition. Portland-metro in this report refers to the Metropolitan Statistical Area of Portland-Vancouver-Hillsboro, OR-WA MSA.
Data in the employment section is drawn primarily from BLS State and Area Employment files, which draws from the Current Employment Statistics survey (also known as the establishment survey). A detailed description of the State and Area data is available here: http://www.bls.gov/sae/790over.htm. In order to use the most currently available data, the data are presented for September annually (for example, 2015 data is from September 2016). This is different than the approach used in previous Value of Jobs Coalition reports, where data were reported for December of all years, except for the most recent year, which was reported for September. All periods are now equally represented as 12 month increments.
Data in the income section is drawn from two sources. Median household income data come from the U.S. Census Bureau, American Community Survey (ACS) 1-year files for 2008-2015. Income distributions were calculated using the 2013 ACS Public Use Microdata Sample (PUMS). Personal income per capita comes from BEA regional data. Note that differences exist in observed income and employment estimates between the Census Bureau and BEA data. The differences between median household income and personal income per capita reflect a variety of factors, including growing income inequality, changing demographics, differences in unreported income, and different definitions of income. In the Affordability section, Regional Price Parities provided by the BEA adjust regional incomes for cost of living.
GMP data was drawn from the Bureau of Economic Analysis and the Brookings Institution’s Metro Monitor. Exports data is drawn from the Brookings Institution’s Export Monitor 2015. Both Brooking’s reports are available at: http://www.brookings.edu/research/interactives/. Knowledge capitol data was drawn from the Redefining Global Cities Report at: http://brookings.edu/research/redefining-global-cities/.
In the jobs section, data are provided by the BEA and the U.S. Census Bureau.
Housing rent data was obtained through CoStart with affordability calculations through HUD and the Portland Housing Bureau.
Work and live data was obtained through the U.S. Census Bureau, Center for Economic Studies “on the map.”
Sandra McDonough, President & CEO, Portland Business Alliance
Jay M. Clemens, President & CEO, Associated Oregon Industries
Duncan Wyse, President, Oregon Business Council
Bill Wyatt, Executive Director, Port of Portland
Ryan Deckert, President, Oregon Business Association
Janet LaBar, President & CEO, Greater Portland, Inc.

1
What the data showThis is the seventh annual Economic Check-Up. Consistent with past reports, it focuses on three measurements of the Portland-Metropolitan Statistical Area (MSA).
� Employment � Income � Gross Metropolitan Product (GMP)
In this report, Portland-metro’s economic performance from September 2007 to September 2016 will be compared to the following:
� The average of all U.S. metropolitan areas � Peer group regions, defined as Sacramento, St. Louis, Cincinnati
and Salt Lake City � Aspirational group regions, Seattle, Denver and Minneapolis
These peer and aspirational regions have been used in past Economic Check-Up reports to put Portland-metro’s economy in context at the national level. This year’s report also includes a more detailed look at intraregional data to better understand how the region’s overall strong performance impacts different communities and neighborhoods within Portland-metro, as well as the region’s diverse demographics. This is a trend the Value of Jobs Coalition will continue to watch.
Job Growth: Strong but leveling offIn Portland-metro, like much of the nation, job growth continued in 2016, but at a slower pace than the most recent two years. Between September 2015 and September 2016, the region added 33,700 new jobs, 2,100 fewer than the year prior. See Figure 1.
BY THE NUMBERS
33,700 The number of new jobs added in Portland-metro from September 2015 to September 2016.
6,055 The number of new construction jobs added in Portland-metro between September 2015 and September 2016.
8th The national ranking of Portland-metro’s gross metropolitan product growth among the top 100 U.S. metros from 2014 to 2015.
5.9 The percentage which Portland-metro’s median household income grew in 2015, outpacing all peer and aspirational regions in annual growth.
98.7 The percentage that 2015 real median household income in Portland-metro compares to 2008 levels.
$46,457, $60,082 and $101,212 The median household income in Gresham, Portland and Camas, Wash., respectively.
$1,280 The average monthly cost of a one-bedroom apartment in Portland; exceeding 100 percent of median family income for the region (plus utility expenses).
9 The percentage that 2015 real median household incomes in Portland have decreased from 2005 levels for African Americans.
Figure 1: Annual change in non-farm employment in Portland-metro and cumulative job growth, 2008-2016
-80,000
-60,000
-40,000
-20,000
0
20,000
40,000
60,000
80,000
100,000
120,000
201620152014201320122011201020092008
-64,442
-4,250
19,483 21,717 24,508 30,692 35,850
101,508
33,700
-200
Source: BLS, Current Employment Statistics, September annually.
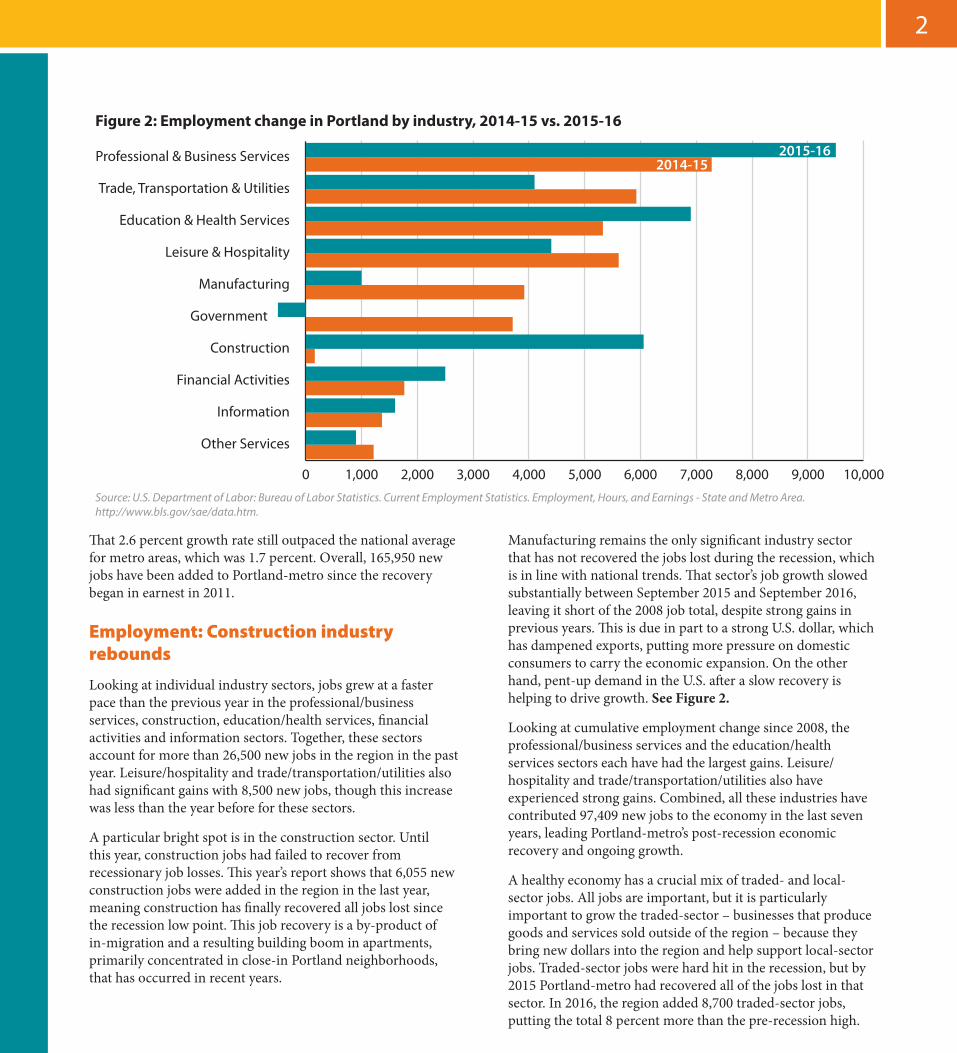
Figure 2: Employment change in Portland by industry, 2014-15 vs. 2015-16
0 1,000 2,000 3,000 4,000 5,000 6,000 7,000 8,000 9,000 10,000
2014-152015-16
Other Services
Information
Financial Activities
Construction
Government
Manufacturing
Leisure & Hospitality
Education & Health Services
Trade, Transportation & Utilities
Professional & Business Services
Source: U.S. Department of Labor: Bureau of Labor Statistics. Current Employment Statistics. Employment, Hours, and Earnings - State and Metro Area. http://www.bls.gov/sae/data.htm.
2
That 2.6 percent growth rate still outpaced the national average for metro areas, which was 1.7 percent. Overall, 165,950 new jobs have been added to Portland-metro since the recovery began in earnest in 2011.
Employment: Construction industry rebounds
Looking at individual industry sectors, jobs grew at a faster pace than the previous year in the professional/business services, construction, education/health services, financial activities and information sectors. Together, these sectors account for more than 26,500 new jobs in the region in the past year. Leisure/hospitality and trade/transportation/utilities also had significant gains with 8,500 new jobs, though this increase was less than the year before for these sectors.
A particular bright spot is in the construction sector. Until this year, construction jobs had failed to recover from recessionary job losses. This year’s report shows that 6,055 new construction jobs were added in the region in the last year, meaning construction has finally recovered all jobs lost since the recession low point. This job recovery is a by-product of in-migration and a resulting building boom in apartments, primarily concentrated in close-in Portland neighborhoods, that has occurred in recent years.
Manufacturing remains the only significant industry sector that has not recovered the jobs lost during the recession, which is in line with national trends. That sector’s job growth slowed substantially between September 2015 and September 2016, leaving it short of the 2008 job total, despite strong gains in previous years. This is due in part to a strong U.S. dollar, which has dampened exports, putting more pressure on domestic consumers to carry the economic expansion. On the other hand, pent-up demand in the U.S. after a slow recovery is helping to drive growth. See Figure 2.
Looking at cumulative employment change since 2008, the professional/business services and the education/health services sectors each have had the largest gains. Leisure/hospitality and trade/transportation/utilities also have experienced strong gains. Combined, all these industries have contributed 97,409 new jobs to the economy in the last seven years, leading Portland-metro’s post-recession economic recovery and ongoing growth.
A healthy economy has a crucial mix of traded- and local-sector jobs. All jobs are important, but it is particularly important to grow the traded-sector – businesses that produce goods and services sold outside of the region – because they bring new dollars into the region and help support local-sector jobs. Traded-sector jobs were hard hit in the recession, but by 2015 Portland-metro had recovered all of the jobs lost in that sector. In 2016, the region added 8,700 traded-sector jobs, putting the total 8 percent more than the pre-recession high.
3
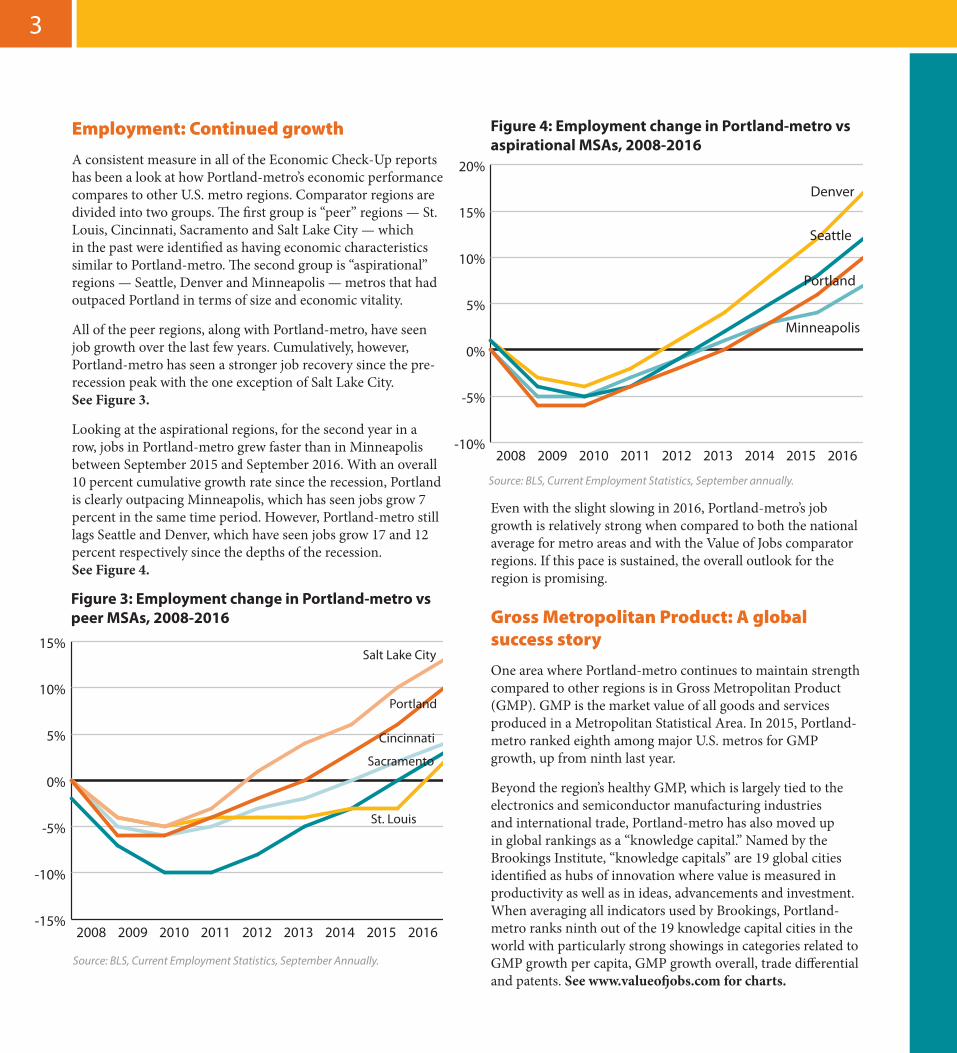
Employment: Continued growth
A consistent measure in all of the Economic Check-Up reports has been a look at how Portland-metro’s economic performance compares to other U.S. metro regions. Comparator regions are divided into two groups. The first group is “peer” regions — St. Louis, Cincinnati, Sacramento and Salt Lake City — which in the past were identified as having economic characteristics similar to Portland-metro. The second group is “aspirational” regions — Seattle, Denver and Minneapolis — metros that had outpaced Portland in terms of size and economic vitality.
All of the peer regions, along with Portland-metro, have seen job growth over the last few years. Cumulatively, however, Portland-metro has seen a stronger job recovery since the pre-recession peak with the one exception of Salt Lake City. See Figure 3.
Looking at the aspirational regions, for the second year in a row, jobs in Portland-metro grew faster than in Minneapolis between September 2015 and September 2016. With an overall 10 percent cumulative growth rate since the recession, Portland is clearly outpacing Minneapolis, which has seen jobs grow 7 percent in the same time period. However, Portland-metro still lags Seattle and Denver, which have seen jobs grow 17 and 12 percent respectively since the depths of the recession. See Figure 4.
Even with the slight slowing in 2016, Portland-metro’s job growth is relatively strong when compared to both the national average for metro areas and with the Value of Jobs comparator regions. If this pace is sustained, the overall outlook for the region is promising.
Gross Metropolitan Product: A global success story
One area where Portland-metro continues to maintain strength compared to other regions is in Gross Metropolitan Product (GMP). GMP is the market value of all goods and services produced in a Metropolitan Statistical Area. In 2015, Portland-metro ranked eighth among major U.S. metros for GMP growth, up from ninth last year.
Beyond the region’s healthy GMP, which is largely tied to the electronics and semiconductor manufacturing industries and international trade, Portland-metro has also moved up in global rankings as a “knowledge capital.” Named by the Brookings Institute, “knowledge capitals” are 19 global cities identified as hubs of innovation where value is measured in productivity as well as in ideas, advancements and investment. When averaging all indicators used by Brookings, Portland-metro ranks ninth out of the 19 knowledge capital cities in the world with particularly strong showings in categories related to GMP growth per capita, GMP growth overall, trade differential and patents. See www.valueofjobs.com for charts.
Figure 3: Employment change in Portland-metro vs peer MSAs, 2008-2016
-15%
-10%
-5%
0%
5%
10%
15%
Cincinnati
Sacramento
St. Louis
Salt Lake City
Portland
201620152014201320122011201020092008
Source: BLS, Current Employment Statistics, September Annually.
Figure 4: Employment change in Portland-metro vs aspirational MSAs, 2008-2016
-10%
-5%
0%
5%
10%
15%
20%
Denver
Minneapolis
Seattle
Portland
201620152014201320122011201020092008
Source: BLS, Current Employment Statistics, September annually.

4
Incomes: Finally on the rise
An important measure of a region’s economic health, as well as that of the individuals and families living in the region, is Median Household Income (MHI.) For the past four years, the Value of Jobs Coalition has reported that Portland-metro’s MHI has been largely stagnant, especially for low- to middle-income families. In a significant turnaround, Portland-metro in 2016, saw strong gains in household incomes across all income levels mirroring a national trend.
In 2015, Portland-metro’s MHI grew 5.9 percent from $60,320 to $63,850, outpacing all peer and aspirational regions in percentage annual growth. However, Portland-metro still has not regained all of the ground lost in household incomes during the recession years, with the 2015 MHI falling just 1.3 percent below the inflation-adjusted equivalent for 2008. Among peer regions, Salt Lake has experienced better cumulative income recovery since 2008. Looking at cumulative MHI growth in comparison to the aspirational regions, Portland-metro’s growth outpaced Minneapolis. However, Denver and Seattle – two regions that started with incomes significantly higher than Portland-metro’s – have experienced growth that has outpaced Portland, resulting in a 2015 MHI that exceeds the 2008 levels. See Figures: 5 and 6.
When adjusting Portland-metro’s MHI against the regional cost of living, the picture is much bleaker. A national measure called Regional Price Parity (RPP) shows the real spending power of income against the cost associated with a certain region. After adjusting for RPP, the buying power in Portland-metro is lowest among all comparator regions. Because the RPP data available for this Economic Check-Up is in 2014 dollars, Portland-metro’s recent strong household income growth is not reflected. On the other hand, more recent data reflecting a rise in cost of living, particularly for housing, will likely offset any income gains.
Figure 6: Real MHI for Portland-metro compared to aspirational MSAs, 2008-2015 (2015 $)
$55,000
$60,000
$65,000
$70,000
$75,000
$80,000
Minneapolis
Denver
Seattle
Portland
20152014201320122011201020092008
Source: U.S. Census Bureau, American Community Survey, MSA Median Household Income B19013; Bureau of Labor Statistics, CPI-U.
Figure 5: Real MHI for Portland-metro compared to peer MSAs, 2008-2015 (2015 $)
$50,000
$55,000
$60,000
$65,000
$70,000
Cincinnati
Sacramento
St. Louis
Salt Lake City
Portland
20152014201320122011201020092008
Source: U.S. Census Bureau, American Community Survey, MSA Median Household Income B19013; Bureau of Labor Statistics, CPI-U.
Nationally, median household income
grew faster on an annual basis
than any time since 1967; Portland-
metro’s 5.9 percent income growth
outpaced that national average, but
affordability is still an issue
5
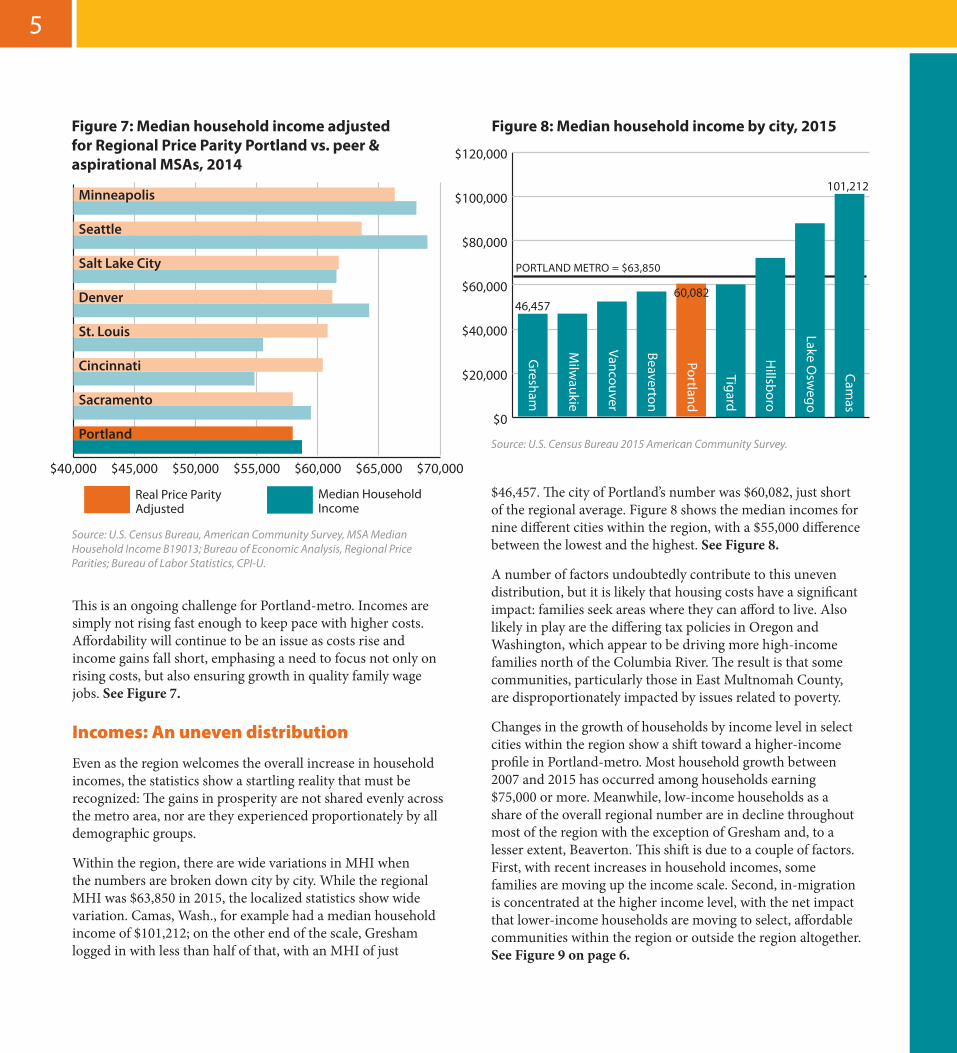
This is an ongoing challenge for Portland-metro. Incomes are simply not rising fast enough to keep pace with higher costs. Affordability will continue to be an issue as costs rise and income gains fall short, emphasing a need to focus not only on rising costs, but also ensuring growth in quality family wage jobs. See Figure 7.
Incomes: An uneven distribution
Even as the region welcomes the overall increase in household incomes, the statistics show a startling reality that must be recognized: The gains in prosperity are not shared evenly across the metro area, nor are they experienced proportionately by all demographic groups.
Within the region, there are wide variations in MHI when the numbers are broken down city by city. While the regional MHI was $63,850 in 2015, the localized statistics show wide variation. Camas, Wash., for example had a median household income of $101,212; on the other end of the scale, Gresham logged in with less than half of that, with an MHI of just
$46,457. The city of Portland’s number was $60,082, just short of the regional average. Figure 8 shows the median incomes for nine different cities within the region, with a $55,000 difference between the lowest and the highest. See Figure 8.
A number of factors undoubtedly contribute to this uneven distribution, but it is likely that housing costs have a significant impact: families seek areas where they can afford to live. Also likely in play are the differing tax policies in Oregon and Washington, which appear to be driving more high-income families north of the Columbia River. The result is that some communities, particularly those in East Multnomah County, are disproportionately impacted by issues related to poverty.
Changes in the growth of households by income level in select cities within the region show a shift toward a higher-income profile in Portland-metro. Most household growth between 2007 and 2015 has occurred among households earning $75,000 or more. Meanwhile, low-income households as a share of the overall regional number are in decline throughout most of the region with the exception of Gresham and, to a lesser extent, Beaverton. This shift is due to a couple of factors. First, with recent increases in household incomes, some families are moving up the income scale. Second, in-migration is concentrated at the higher income level, with the net impact that lower-income households are moving to select, affordable communities within the region or outside the region altogether. See Figure 9 on page 6.
Figure 7: Median household income adjusted for Regional Price Parity Portland vs. peer & aspirational MSAs, 2014
$40,000 $45,000 $50,000 $55,000 $60,000 $65,000 $70,000
Median HouseholdIncome
Real Price ParityAdjusted
Portland
Sacramento
Cincinnati
St. Louis
Denver
Salt Lake City
Seattle
Minneapolis
Source: U.S. Census Bureau, American Community Survey, MSA Median Household Income B19013; Bureau of Economic Analysis, Regional Price Parities; Bureau of Labor Statistics, CPI-U.
Figure 8: Median household income by city, 2015
$0
$20,000
$40,000
$60,000
$80,000
$100,000
$120,000
Camas
Lake Osw
ego
Hillsboro
Tigard
Portland
Beaverton
Vancouver
Milw
aukie
Gresham
46,45760,082
101,212
PORTLAND METRO = $63,850
Figure 8: Median household income by city, 2015
Source: U.S. Census Bureau 2015 American Community Survey.

6
Affordability: More outward displacement
With in-migration and rising incomes driving demand, an insufficient housing supply is putting unprecedented pressure on rents and family budgets. This year’s Economic Check-Up report found that, for the first time, the average rent for a one bedroom apartment in Portland, at $1,280 a month plus utility expenses, is not affordable for families who earn 100 percent or less of the region’s Median Family Income (MFI.) The dotted lines in Figure 10 show what level of rent is affordable, by federal standards, for families earning 60 percent and 100 percent of the median family income relative to actual rent growth within select cities in Portland-metro.
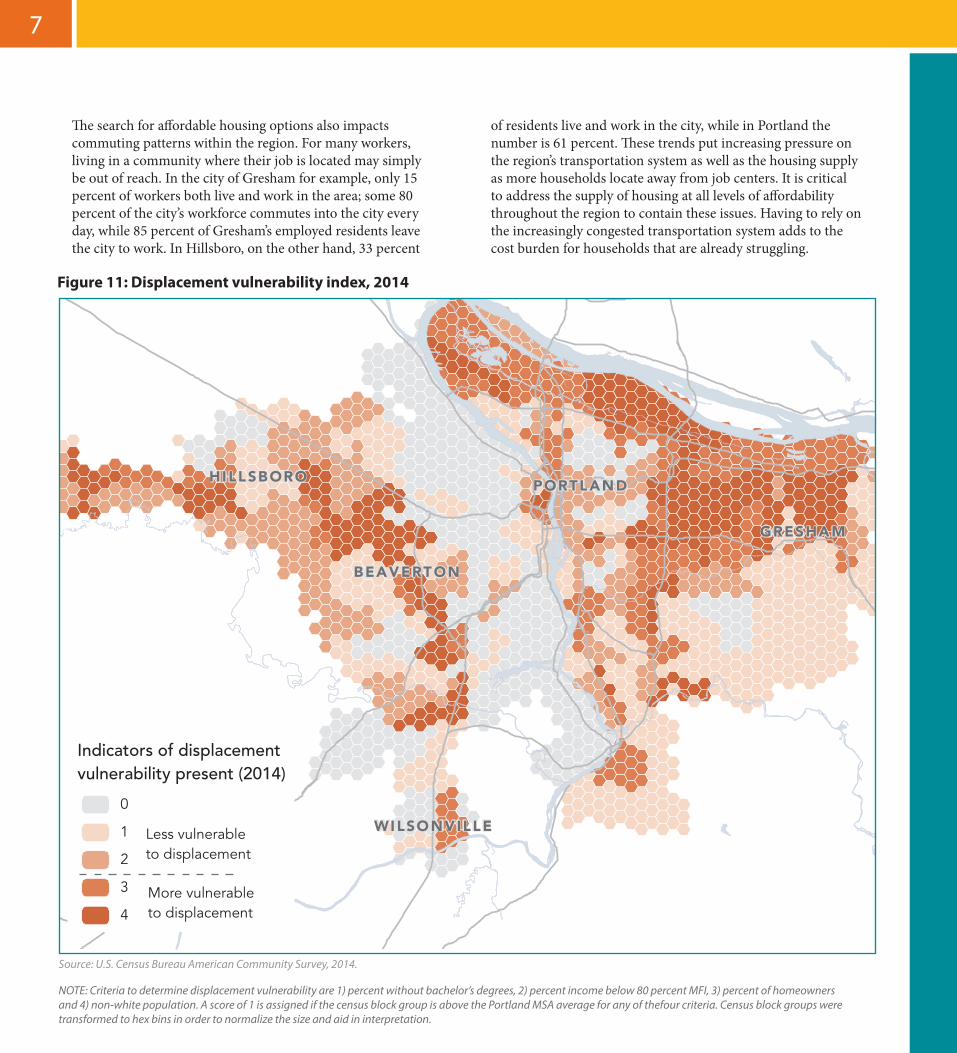
In the years leading up to the recession, there was an adequate supply of apartments that were affordable for households earning 60 percent of MFI. Since 2000, rents have increased substantially making an average one-bedroom apartment out of reach for families at 60 percent MFI. In Portland, Gresham and Beaverton, average rents have increased 106 percent, 70 percent and 61 percent respectively, making it more difficult for lower- and middle-income families to find homes in those communities that fit their household incomes. A greater number of households are pushed to the fringes of the region with an increased risk of displacement as more low- and middle-income families are forced to reconsider where they can afford to live. See Figure 11.
Figure 9: Percentage household growth by income, 2007-2015Figure 9: Household growth by income, 2007-2015
-50%
-25%
0%
25%
50%
75%
100%
125%
150%
175%
200%
225%
250%G
reshamVancouverBeaverton
Hillsboro
Portland
>$150K$100-150K$75-100K$50-75K$25-50K<$25K
Source: U.S. Census Bureau American Community Survey, 2007-2015.
Figure 10: One-bedroom apartment affordability by city compared to 60% and 100% MFI, 2000-2016
$400
$500
$600
$700
$800
$900
$1,000
$1,100
$1,200
$1,300
$1,400
Beaverton
Gresham
Portland
60% MFI Rent
100% MFI Rent
201620142012201020082006200420022000
Source: CoStart and affordability calculations through U.S. Department of Housing and Urban Development (HUD) and the Portland Housing Bureau.
NOTE: Rather than Median Household Income (MHI), which is used earlier in this report, the U.S. Department of Housing and Urban Development (HUD) uses Median Family Income (MFI) to determine housing affordability, which is based on household size and tied to number of apartment bedrooms. For a one-bedroom apartment in Portland-metro to be affordable according to HUD, a median family income would have to be $55,000.
6 7
PORTLAND
WILSONVILLE
BEAVERTON
GRESHAM
HILLSBORO
Indicators of displacementvulnerability present (2014)
0
1
2
3
4More vulnerableto displacement
Less vulnerableto displacement
Figure 11: Displacement vulnerability index, 2014
Source: U.S. Census Bureau American Community Survey, 2014.
NOTE: Criteria to determine displacement vulnerability are 1) percent without bachelor’s degrees, 2) percent income below 80 percent MFI, 3) percent of homeowners and 4) non-white population. A score of 1 is assigned if the census block group is above the Portland MSA average for any of thefour criteria. Census block groups were transformed to hex bins in order to normalize the size and aid in interpretation.
The search for affordable housing options also impacts commuting patterns within the region. For many workers, living in a community where their job is located may simply be out of reach. In the city of Gresham for example, only 15 percent of workers both live and work in the area; some 80 percent of the city’s workforce commutes into the city every day, while 85 percent of Gresham’s employed residents leave the city to work. In Hillsboro, on the other hand, 33 percent
of residents live and work in the city, while in Portland the number is 61 percent. These trends put increasing pressure on the region’s transportation system as well as the housing supply as more households locate away from job centers. It is critical to address the supply of housing at all levels of affordability throughout the region to contain these issues. Having to rely on the increasingly congested transportation system adds to the cost burden for households that are already struggling.
8
Affordability: Concerns of equity
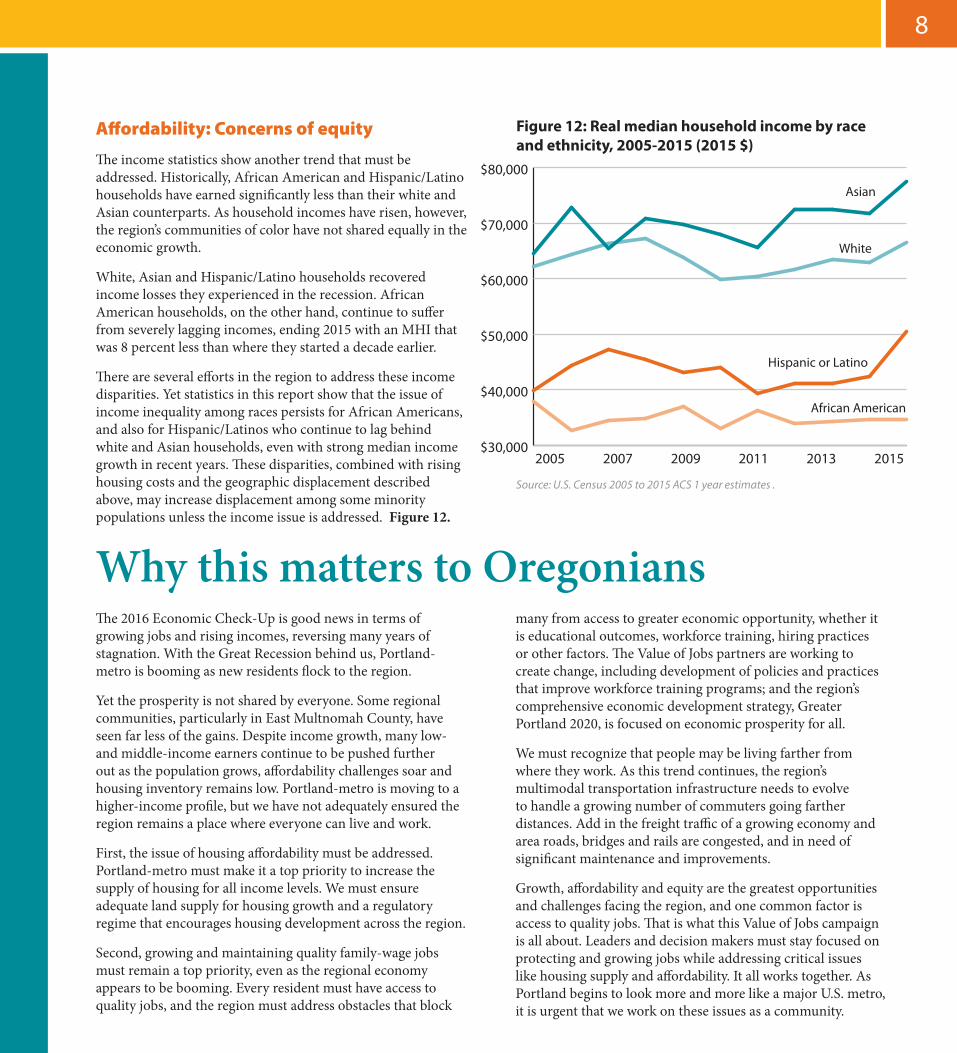
The income statistics show another trend that must be addressed. Historically, African American and Hispanic/Latino households have earned significantly less than their white and Asian counterparts. As household incomes have risen, however, the region’s communities of color have not shared equally in the economic growth.
White, Asian and Hispanic/Latino households recovered income losses they experienced in the recession. African American households, on the other hand, continue to suffer from severely lagging incomes, ending 2015 with an MHI that was 8 percent less than where they started a decade earlier.
There are several efforts in the region to address these income disparities. Yet statistics in this report show that the issue of income inequality among races persists for African Americans, and also for Hispanic/Latinos who continue to lag behind white and Asian households, even with strong median income growth in recent years. These disparities, combined with rising housing costs and the geographic displacement described above, may increase displacement among some minority populations unless the income issue is addressed. Figure 12.
Why this matters to OregoniansThe 2016 Economic Check-Up is good news in terms of growing jobs and rising incomes, reversing many years of stagnation. With the Great Recession behind us, Portland-metro is booming as new residents flock to the region.
Yet the prosperity is not shared by everyone. Some regional communities, particularly in East Multnomah County, have seen far less of the gains. Despite income growth, many low- and middle-income earners continue to be pushed further out as the population grows, affordability challenges soar and housing inventory remains low. Portland-metro is moving to a higher-income profile, but we have not adequately ensured the region remains a place where everyone can live and work.
First, the issue of housing affordability must be addressed. Portland-metro must make it a top priority to increase the supply of housing for all income levels. We must ensure adequate land supply for housing growth and a regulatory regime that encourages housing development across the region.
Second, growing and maintaining quality family-wage jobs must remain a top priority, even as the regional economy appears to be booming. Every resident must have access to quality jobs, and the region must address obstacles that block
many from access to greater economic opportunity, whether it is educational outcomes, workforce training, hiring practices or other factors. The Value of Jobs partners are working to create change, including development of policies and practices that improve workforce training programs; and the region’s comprehensive economic development strategy, Greater Portland 2020, is focused on economic prosperity for all.
We must recognize that people may be living farther from where they work. As this trend continues, the region’s multimodal transportation infrastructure needs to evolve to handle a growing number of commuters going farther distances. Add in the freight traffic of a growing economy and area roads, bridges and rails are congested, and in need of significant maintenance and improvements.
Growth, affordability and equity are the greatest opportunities and challenges facing the region, and one common factor is access to quality jobs. That is what this Value of Jobs campaign is all about. Leaders and decision makers must stay focused on protecting and growing jobs while addressing critical issues like housing supply and affordability. It all works together. As Portland begins to look more and more like a major U.S. metro, it is urgent that we work on these issues as a community.
Figure 12: Real median household income by race and ethnicity, 2005-2015 (2015 $)
$30,000
$40,000
$50,000
$60,000
$70,000
$80,000
African American
Hispanic or Latino
White
Asian
201520132011200920072005
Source: U.S. Census 2005 to 2015 ACS 1 year estimates .

IntroductionBy a number of economic measures, Portland-metro’s regional economy continued to rebound in 2016. A growing economy, increasing jobs and wages and high productivity are significant strengths. As Portland-metro continues to grow, it is undergoing fundamental economic shifts that are good news for some, but prosperity is not equally spread across the region. That is the challenge ahead: How can we better share prosperity across all corners and among all residents of Portland-metro?
The Value of Jobs Coalition has tracked the health of Portland-metro’s economy in an annual Economic Check-Up report since 2010 — through the dark years of the Great Recession and into a slow-moving job recovery that finally picked up pace in 2014. Today, the Portland-metro job market remains strong with a total of 165,950 new jobs added since the depth of the recessionary losses. In a change from last year’s Economic Check-Up, nearly every industry, with the exception of manufacturing, has recovered the total number of jobs lost in the recession.
With improvements in the job market, more people are going to work. Past Value of Jobs reports have shown that Median Household Income (MHI) in Portland-metro, along with the nation, stagnated for low- and middle-income workers over the last several years. By contrast, this year’s report shows that income gains were broadly shared across all levels and poverty declined. Though Portland-metro’s incomes have not risen back to pre-recession levels, the region’s income growth between 2015 and 2016 outpaced the U.S. average as well as all comparator regions.
Another continued bright spot for Portland-metro is Gross Metropolitan Product (GMP,) which ranks 8th among major U.S. metro areas. While other regions have stronger job growth, Portland-metro continues to be a productivity powerhouse due to historic strength in electronics and semiconductor manufacturing.
This year’s report also suggests that Portland-metro is separating from some of its peer comparator regions. In terms of job and income growth, Portland-metro is inching closer to the larger metro areas that were once considered aspirational comparators, and with that comes challenges with being a more populous region.
If we are to create a strong Portland-metro and economic prosperity for everyone, tackling the following challenges must be a priority:
� Household income varied dramatically by city, and household growth by income shows disparities are on the rise. Long-term, the region is drifting toward a higher-income profile with net in-migration concentrated at the high end. Lower-income households are moving further from the region’s center, and some may be exiting Portland-metro altogether. These statistics underscore that the primary goal of the Value of Jobs Coalition — growing quality family-wage jobs — must continue so all residents have the opportunity to share the prosperity.
� An insufficient housing supply continues to impact affordability. Household displacement is rising across the region except for gentrified areas in inner Portland. Failure to address these interregional affordability challenges may impact economic mobility and opportunity, stressing the region’s infrastructure as households move farther from job centers and the city core.
� Communities of color are not equitably sharing in the region’s growing prosperity. As Portland-metro continues to grow and become more diverse, ensuring widely available opportunities for all residents will be critical for the region to thrive.
This report is an annual point-in-time look at the Portland-metro economy. It provides a foundation that can be used to address the issues raised above. The Value of Jobs Coalition is committed to finding solutions to these challenges, bringing the strength of the private sector to bear to create opportunities for everyone.
REPORT SOURCESThe data and analysis of this report were compiled by ECONorthwest for the Value of Jobs Coalition. Portland-metro in this report refers to the Metropolitan Statistical Area of Portland-Vancouver-Hillsboro, OR-WA MSA.
Data in the employment section is drawn primarily from BLS State and Area Employment files, which draws from the Current Employment Statistics survey (also known as the establishment survey). A detailed description of the State and Area data is available here: http://www.bls.gov/sae/790over.htm. In order to use the most currently available data, the data are presented for September annually (for example, 2015 data is from September 2016). This is different than the approach used in previous Value of Jobs Coalition reports, where data were reported for December of all years, except for the most recent year, which was reported for September. All periods are now equally represented as 12 month increments.
Data in the income section is drawn from two sources. Median household income data come from the U.S. Census Bureau, American Community Survey (ACS) 1-year files for 2008-2015. Income distributions were calculated using the 2013 ACS Public Use Microdata Sample (PUMS). Personal income per capita comes from BEA regional data. Note that differences exist in observed income and employment estimates between the Census Bureau and BEA data. The differences between median household income and personal income per capita reflect a variety of factors, including growing income inequality, changing demographics, differences in unreported income, and different definitions of income. In the Affordability section, Regional Price Parities provided by the BEA adjust regional incomes for cost of living.
GMP data was drawn from the Bureau of Economic Analysis and the Brookings Institution’s Metro Monitor. Exports data is drawn from the Brookings Institution’s Export Monitor 2015. Both Brooking’s reports are available at: http://www.brookings.edu/research/interactives/. Knowledge capitol data was drawn from the Redefining Global Cities Report at: http://brookings.edu/research/redefining-global-cities/.
In the jobs section, data are provided by the BEA and the U.S. Census Bureau.
Housing rent data was obtained through CoStart with affordability calculations through HUD and the Portland Housing Bureau.
Work and live data was obtained through the U.S. Census Bureau, Center for Economic Studies “on the map.”
Sandra McDonough, President & CEO, Portland Business Alliance
Jay M. Clemens, President & CEO, Associated Oregon Industries
Duncan Wyse, President, Oregon Business Council
Bill Wyatt, Executive Director, Port of Portland
Ryan Deckert, President, Oregon Business Association
Janet LaBar, President & CEO, Greater Portland, Inc.

PORTLAND BUSINESS ALLIANCE200 SW Market St., Suite 150Portland, Oregon 97201www.valueo�obs.com
PUBLISHED BY:
a check-up on the PORTLAND-REGION’S ECONOMIC HEALTH2016
MULTNOMAH
CLACKAMAS
WASHINGTON
CLARK
YAMHILL
SKAMANIACOLUMBIA
Sandra McDonough, President & CEO, Portland Business Alliance
Jay M. Clemens, President & CEO, Associated Oregon Industries
Duncan Wyse, President, Oregon Business Council
Bill Wyatt, Executive Director, Port of Portland
Ryan Deckert, President, Oregon Business Association
Janet LaBar, President & CEO, Greater Portland, Inc.
For more information about this report or other Value of Jobs studies, go online to www.valueofjobs.com.
� 2016 Check-up on the Portland-Region’s Economic Health
� 2015 Check-up on the Portland-Region’s Economic Health
� 2015 Middle-Income Jobs
� 2014 Economic Impacts of Congestion
� 2014 Check-up on the Portland-Region’s Economic Health
� 2014 Portland-Metro’s Health Care
� 2013 Check-up on the Portland-Region’s Economic Health
� 2013 International Trade & the Portland Harbor’s Impact
� Higher Education & Regional Prosperity
� 2012 Check-up on the Portland-Region’s Economic Health
� Portland-Metro’s Manufacturing Sector study
� Land Availability: Limited Options study
� Portland-Metro’s Traded Sector study
� 2011 Check-up on the Portland-Region’s Economic Health
� 2010 International Trade study
� 2010 Check-up on the Portland-Region’s Economic Health
About the Value of Jobs Coalition
The Value of Jobs Coalition is based on the premise that in order to have a prosperous, healthy Portland region with a good quality of life, we need more private-sector jobs. The coalition began with an economic study in the fall of 2010, which showed important trends about the Portland-metro economy. A number of other studies have followed that highlight the region’s economic opportunities and challenges. Find out more at:
www.valueofjobs.com.