above and beyond: the influence of hierarchical level and gender
TRANSCRIPT
71
Chapter 3
Above and Beyond:
The Influence of Hierarchical Level and Gender on
Perceptions of Leadership
72
Abstract
Two crucial characteristics of individuals in organizations, hierarchical position and gender,
and their effect on ratings of leadership styles were examined. Based on the reasoning that
leadership is an interpersonal phenomenon, it was hypothesized that hierarchical position
and gender would have an influence on how leadership styles are rated. In one
comprehensive study, ratings of leadership were collected from 360 degrees sources. First,
the influence of the hierarchical role of the rater on ratings of leadership styles was
examined. Because of the different hierarchical role each rater had towards the leader, it
was argued that different raters experience a different behavioral interaction with the
individual being rated. Compared with subordinates, supervisors rated leaders higher on
coaching, yielding, and withdrawn leadership, and lower on inspirational, directive, and
authoritarian leadership. Surprisingly, peers provided higher ratings of distrustful leadership
and lower ratings of participative leadership compared to both supervisors and
subordinates. Second, the influence of gender of both the rater and the leader was
investigated. Compared to male leaders, female leaders were rated higher on coaching,
inspirational, directive, and participative leadership, and lower on distrustful, withdrawn,
and yielding leadership. Compared to female raters, male raters provided higher ratings for
inspirational, directive, authoritarian, and distrustful leadership and lower ratings for
withdrawn and participative leadership. Finally, the interaction effect between gender of the
rater and gender of the leader was examined. Although an interaction effect was found for
coaching and inspirational leadership, it did not support our hypothesis.

Providing feedback based on multisource ratings of leadership behaviors has become
increasingly popular over the past years. Multisource ratings, or 360 degrees ratings, are
ratings obtained from subordinates, peers, and supervisors on one and the same focal
person. There are both empirical and practical reasons for this increased preference for
multisource ratings. Empirically, one of the most important reasons to use multisource
ratings is that single self-ratings of leadership behaviors have been shown to be invalid and
inaccurate (e.g., Fleenor, Smither, Atwater, Braddy, & Sturm, 2010; Harris & Schaubroeck,
1988). From a practical point of view, multisource ratings may increase a leader’s awareness
of its behaviors as seen by the people surrounding them (London & Smither, 1995).
However, multisource ratings are also not free of disadvantages. The most notable of these
disadvantages is the lack of agreement between raters from different hierarchical levels
(Atkins & Wood, 2002; Fleenor, et al., 2010; Harris & Schaubroeck, 1988; Ostroff, Atwater, &
Feinberg, 2004; Solansky, 2010). That is, ratings by subordinates are often different from
ratings by supervisors and/or peers. This begs the question why different raters have
different perceptions of their leaders. What are possible determinants of these differences
and how can these be theoretically explained? In this paper we focus on two potential
causes for these different ratings, namely the hierarchical perspective of the rater and the
gender of the rater.
In this paper, we build on role theory to explain why these two characteristics are so
important in multisource rating of leaders. Central to role theory is the notion that
individuals are in a social position and hold expectations about their own and other people’s
behavior, in relation to this position or role (Biddle, 1986). Two of the most important
elements in organizations shaping the behavioral expectations are 1) someone’s hierarchical
position and 2) someone’s gender. With respect to hierarchical position, in multisource (or
360 degrees) feedback, the individual being rated is in a different hierarchical role towards
each of the rating sources. Accordingly, this hierarchical role is likely to shape behavioral
expectations, prescribing different behaviors from the individual being rated towards each of
the rating sources and vice versa. Second, gender is one of the most discussed variables in
social role theory. Eagly (1987) has argued that differences in social behaviors might be
caused by the tendency of men and women to behave according to their gender role. These
gender roles prescribe highly gender stereotypic behaviors for both men and women, raters
74
and ratees (Eagly, 1987). In sum, the present paper will investigate the influence of 1) the
hierarchical perspective of the rater, and 2) the gender of both the rater and the leader on
differences in leadership ratings.
Circumplex Leadership Scan
To examine this question, the present study will use a recently developed leadership model.
This model is based on the interpersonal circumplex and is named the leadership circumplex
(Redeker, De Vries, Rouckhout, Vermeren, & De Fruyt, 2012, Chapter 2). The leadership
circumplex uses similar dimensions as the interpersonal circumplex, namely agency and
communion, to summarize leadership behaviors (Figure 1 shows a visualization of the
leadership circumplex). In this model leadership behaviors are located on the circumference
of a circle, spanned by the two dimensions. The circumplex is divided into eight octants,
describing eight different leadership styles. Starting at the positive pole of the communion
axis and going counterclockwise, the leadership styles are named coaching, inspirational,
directive, authoritarian, distrustful, withdrawn, yielding, and participative leadership (see
Table 1 for definitions of the leadership styles). Each leadership style differs in their degree
of agency and communion. The benefit of using this model is that it uses a continuous,
overarching set of leadership behaviors. Furthermore, using a model similar to the
interpersonal circumplex provides the opportunity to compare our findings to studies
examining interpersonal behaviors (e.g., Markey, Funder, & Ozer, 2003; Moskowitz, Jung
Suh, & Desaulniers, 1994). Finally, the leadership circumplex model helps to paint a fine-
grained picture of the many possible differences between raters resulting from the social
roles of both raters and ratees.
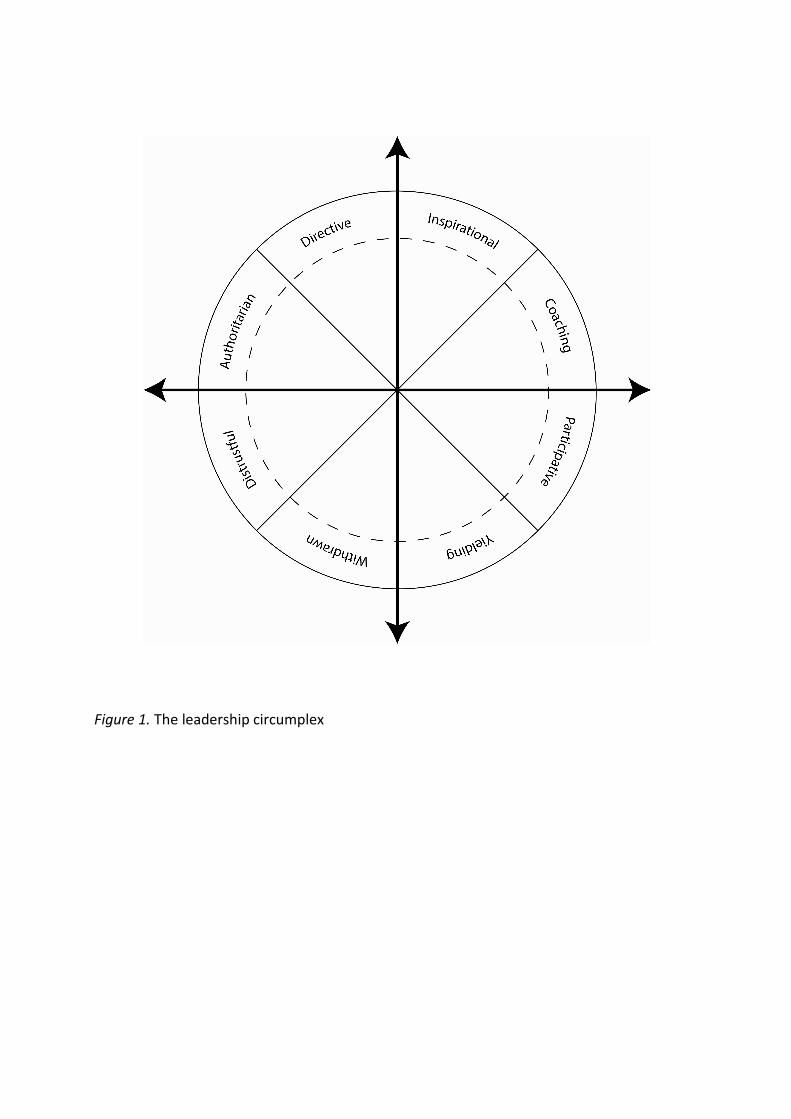
Figure 1. The leadership circumplex
76
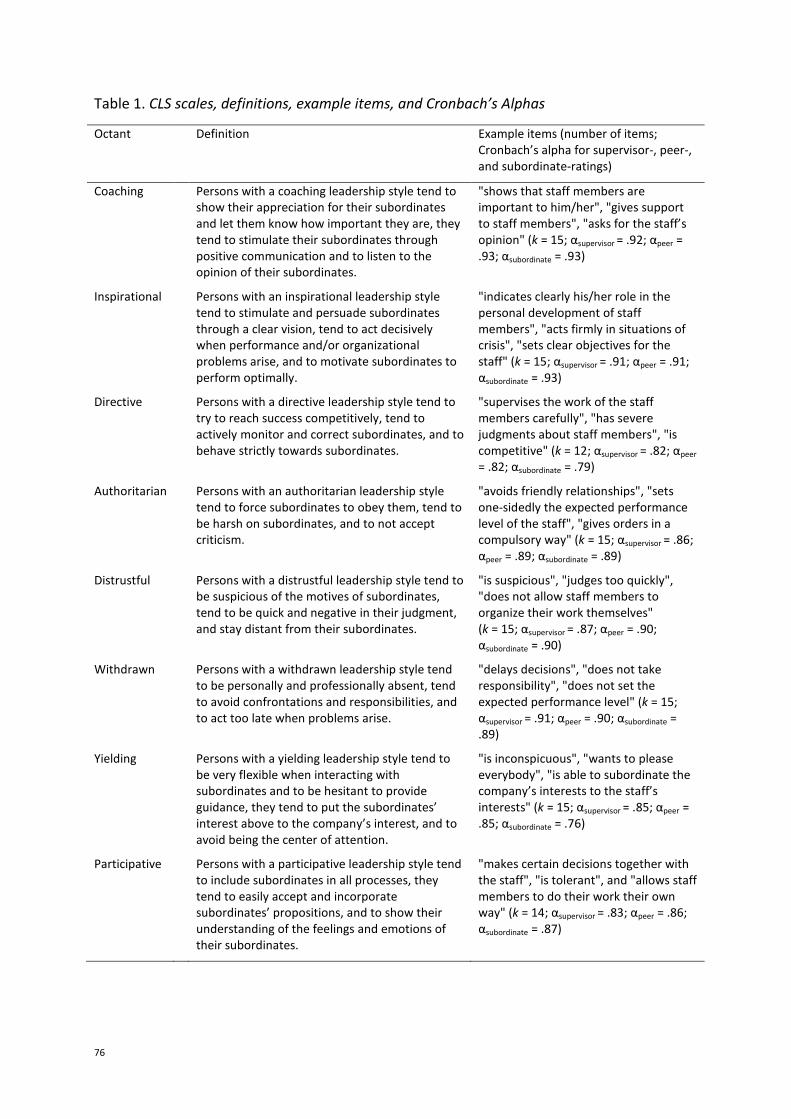
Table 1. CLS scales, definitions, example items, and Cronbach’s Alphas
Octant Definition Example items (number of items;
Cronbach’s alpha for supervisor-, peer-,
and subordinate-ratings)
Coaching Persons with a coaching leadership style tend to
show their appreciation for their subordinates
and let them know how important they are, they
tend to stimulate their subordinates through
positive communication and to listen to the
opinion of their subordinates.
"shows that staff members are
important to him/her", "gives support
to staff members", "asks for the staff’s
opinion" (k = 15; αsupervisor = .92; αpeer =
.93; αsubordinate = .93)
Inspirational Persons with an inspirational leadership style
tend to stimulate and persuade subordinates
through a clear vision, tend to act decisively
when performance and/or organizational
problems arise, and to motivate subordinates to
perform optimally.
"indicates clearly his/her role in the
personal development of staff
members", "acts firmly in situations of
crisis", "sets clear objectives for the
staff" (k = 15; αsupervisor = .91; αpeer = .91;
αsubordinate = .93)
Directive Persons with a directive leadership style tend to
try to reach success competitively, tend to
actively monitor and correct subordinates, and to
behave strictly towards subordinates.
"supervises the work of the staff
members carefully", "has severe
judgments about staff members", "is
competitive" (k = 12; αsupervisor = .82; αpeer
= .82; αsubordinate = .79)
Authoritarian Persons with an authoritarian leadership style
tend to force subordinates to obey them, tend to
be harsh on subordinates, and to not accept
criticism.
"avoids friendly relationships", "sets
one-sidedly the expected performance
level of the staff", "gives orders in a
compulsory way" (k = 15; αsupervisor = .86;
αpeer = .89; αsubordinate = .89)
Distrustful Persons with a distrustful leadership style tend to
be suspicious of the motives of subordinates,
tend to be quick and negative in their judgment,
and stay distant from their subordinates.
"is suspicious", "judges too quickly",
"does not allow staff members to
organize their work themselves"
(k = 15; αsupervisor = .87; αpeer = .90;
αsubordinate = .90)
Withdrawn Persons with a withdrawn leadership style tend
to be personally and professionally absent, tend
to avoid confrontations and responsibilities, and
to act too late when problems arise.
"delays decisions", "does not take
responsibility", "does not set the
expected performance level" (k = 15;
αsupervisor = .91; αpeer = .90; αsubordinate =
.89)
Yielding Persons with a yielding leadership style tend to
be very flexible when interacting with
subordinates and to be hesitant to provide
guidance, they tend to put the subordinates’
interest above to the company’s interest, and to
avoid being the center of attention.
"is inconspicuous", "wants to please
everybody", "is able to subordinate the
company’s interests to the staff’s
interests" (k = 15; αsupervisor = .85; αpeer =
.85; αsubordinate = .76)
Participative Persons with a participative leadership style tend
to include subordinates in all processes, they
tend to easily accept and incorporate
subordinates’ propositions, and to show their
understanding of the feelings and emotions of
their subordinates.
"makes certain decisions together with
the staff", "is tolerant", and "allows staff
members to do their work their own
way" (k = 14; αsupervisor = .83; αpeer = .86;
αsubordinate = .87)
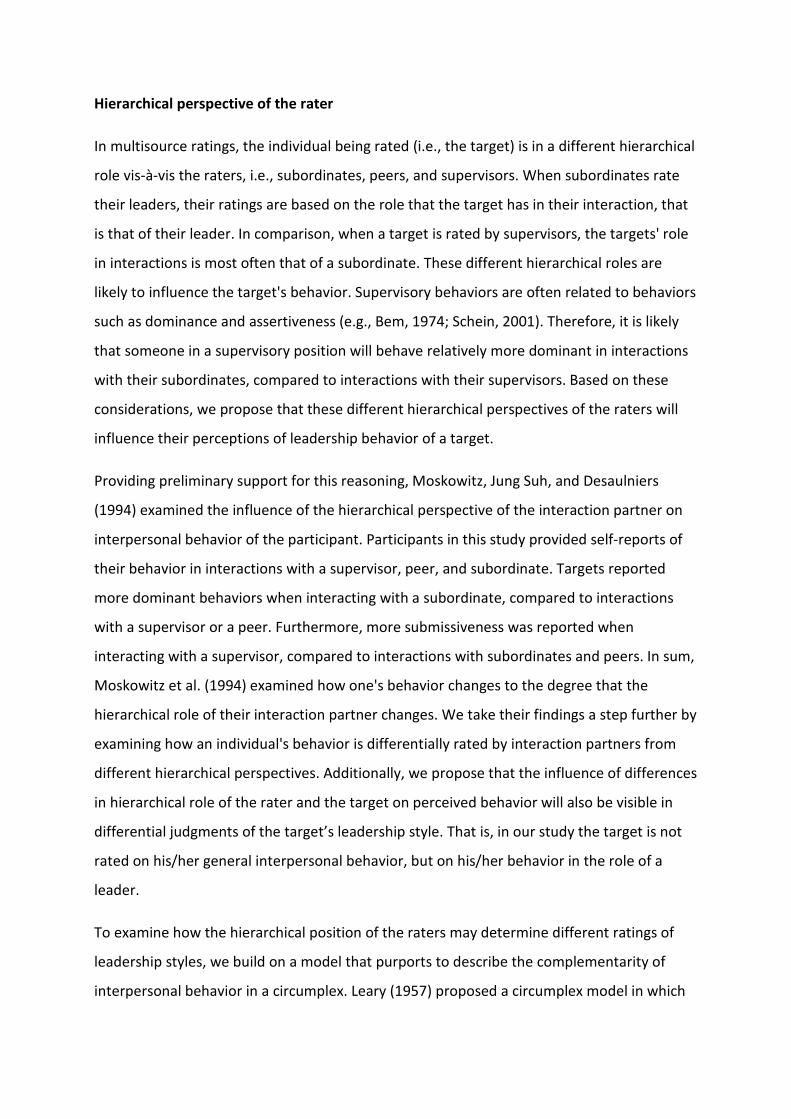
Hierarchical perspective of the rater
In multisource ratings, the individual being rated (i.e., the target) is in a different hierarchical
role vis-à-vis the raters, i.e., subordinates, peers, and supervisors. When subordinates rate
their leaders, their ratings are based on the role that the target has in their interaction, that
is that of their leader. In comparison, when a target is rated by supervisors, the targets' role
in interactions is most often that of a subordinate. These different hierarchical roles are
likely to influence the target's behavior. Supervisory behaviors are often related to behaviors
such as dominance and assertiveness (e.g., Bem, 1974; Schein, 2001). Therefore, it is likely
that someone in a supervisory position will behave relatively more dominant in interactions
with their subordinates, compared to interactions with their supervisors. Based on these
considerations, we propose that these different hierarchical perspectives of the raters will
influence their perceptions of leadership behavior of a target.
Providing preliminary support for this reasoning, Moskowitz, Jung Suh, and Desaulniers
(1994) examined the influence of the hierarchical perspective of the interaction partner on
interpersonal behavior of the participant. Participants in this study provided self-reports of
their behavior in interactions with a supervisor, peer, and subordinate. Targets reported
more dominant behaviors when interacting with a subordinate, compared to interactions
with a supervisor or a peer. Furthermore, more submissiveness was reported when
interacting with a supervisor, compared to interactions with subordinates and peers. In sum,
Moskowitz et al. (1994) examined how one's behavior changes to the degree that the
hierarchical role of their interaction partner changes. We take their findings a step further by
examining how an individual's behavior is differentially rated by interaction partners from
different hierarchical perspectives. Additionally, we propose that the influence of differences
in hierarchical role of the rater and the target on perceived behavior will also be visible in
differential judgments of the target’s leadership style. That is, in our study the target is not
rated on his/her general interpersonal behavior, but on his/her behavior in the role of a
leader.
To examine how the hierarchical position of the raters may determine different ratings of
leadership styles, we build on a model that purports to describe the complementarity of
interpersonal behavior in a circumplex. Leary (1957) proposed a circumplex model in which
78
control behaviors by one individual are complemented with contradictory behaviors (i.e.,
submissive behaviors) of the interaction partner, and vice versa. Whereas the
complementarity principle is associated with opposite behaviors on the control axis, it is
associated with similar behaviors on the communion axis. That is, an individual showing
behaviors on the positive side of the communion axis will most likely evoke similar positive
communal behavior in his/her interaction partner. Similarly, behaviors on the negative side
of the communion axis will most likely evoke negative communal behaviors.
Complementarity of behaviors is not without reason. Complementarity of behaviors on the
right side of the circumplex are related to both more positive perceptions of the interaction
and to more positive outcomes of the interaction (e.g., Markey, Lowmaster, & Eichler, 2010).
Based on these considerations, we expect differences between ratings of individuals from
different hierarchical perspectives to be especially visible on the agency axis of the
leadership circumplex. We expect leaders to show different interpersonal behaviors towards
individuals that have a different hierarchical role towards them. More specifically, we predict
that a focal person in a leadership position will exhibit more agentic and less submissive
behaviors towards a subordinate, compared to the behavior that s/he shows towards a
supervisor. That is, we expect supervisors to rate leaders lower on styles high in agency,
namely directive and inspirational leadership, and higher on styles low in agency, namely
withdrawn and yielding leadership. On the other hand, we expect subordinates to rate
leaders higher on directive and inspirational leadership and lower on withdrawn and yielding
leadership. Based on Leary’s (1957) model, in which behaviors on the communion axis are
complemented with similar behaviors, we expect no differences between raters of a
different hierarchical perspective on leadership styles that are close to the communion axis,
namely coaching, participative, authoritarian, and distrustful leadership.
Gender of leader and rater
A second potentially major influence on the ratings of leadership is the gender of both the
leader and the rater. Gender differences have been extensively studied in the past decades
(e.g., Eagly & Johnson, 1990; Eagly, Johannesen-Schmidt, & Van Engen, 2003). Often
differences between men and women have been ascribed to differences in the masculine
and feminine gender role. The feminine gender role has been related to communal and
warm behaviors, such as being gentle, compassionate, and sympathetic. Contrarily, the
masculine gender role is related to agentic and dominant behaviors, such as being forceful,
competitive, and individualistic. Although perceptions of effective leadership have
frequently been related to the masculine gender role (Bem, 1974; Cann & Siegfried, 1990;
Powell, Butterfield, & Parent, 2002; Schein, 1973, 1975; Schein, Mueller, Lituchy, & Liu,
1996), it has been demonstrated that women often show the more effective leadership
styles. Female leaders have been found to be more transformational and communal than
male leaders. Male leaders are usually rated higher on the styles transactional leadership,
management by exception (both passive and active), laissez faire leadership, and are
perceived as more agentic. However, when solely focusing on organizational settings, these
differences between male and female leaders tend to be small (Carless, 1998; Eagly & Carli,
2003; Eagly, Johannesen-Schmidt, & Van Engen, 2003; Eagly & Johnson, 1990).
The lack of larger findings in organizational settings have been ascribed to the salience of
gender in different settings. In organizational settings, the functional role (or the roles
associated with the occupation) of the individual might be more prominent. However, in
stereotype or laboratory studies, in which this functional role is less evident, the gender of
the person being studied might be more salient (Moskowitz et al., 1994). In line with these
findings, some researchers have suggested that the composition of the group in which a
person is interacting may be of influence on the salience of gender (e.g., Maccoby, 1990).
This indicates that the gender composition of the interaction dyad may be of influence on
the rating of behaviors. In other words, when raters judge a leader's style, their own gender
and well as the gender of the leader may influence their ratings.
In sum, as a result of gender roles, prescribing different behaviors to men and women, we
expect female leaders to behave more according to the female gender role and therefore be
rated higher on leadership styles that have been related to transformational leadership and
communal leadership, namely participative, coaching, and inspirational leadership (Redeker,
De Vries, Rouckhout, Vermeren, & De Fruyt, 2012, Chapter 2). Furthermore, we expect
female leaders to be rated higher on leadership styles that are low in agency, namely
yielding and withdrawn leadership. We expect male leaders to behave more in line with the
male gender role and therefore be rated higher on leadership styles that are related to
80
transactional, management by exception and laissez faire leadership, namely directive,
authoritarian, and distrustful leadership (Redeker et al., 2012, Chapter 2).
We expect an interaction effect between the gender of the leader and the gender of the
rater; that is, in gender diverse rater-ratee dyads, gender will be more salient and therefore
the ratings of the leadership styles of the different gender will be more similar to the
stereotype when compared to ratings of the same gender leader. Specifically we expect the
differences between male and female leaders to be larger when they are rated by a rater
from the opposite sex, compared to same-sex ratings.
In order to test these hypotheses, we collected multisource or 360 degree feedback.
Specifically, we collected leadership style ratings of leaders from both their supervisors and
their subordinates. Additionally, peer-ratings were collected to serve as a control condition
to examine possible differences in ratings from different hierarchical perspectives. Although
we did not expect an interaction between the hierarchical perspective of the rater and the
gender of either the rater or the leader, we will explore the presence of interaction effects in
our analyses.
Method
Participants
For the sake of clarity, participants are discussed categorized by function, which is defined
here as their hierarchical position compared to the leader, which can either be the leader’s
subordinate, a peer, or the leader’s supervisor. Leaders were 220 individuals (157 male, 63
female) holding a supervisory position in a company in The Netherlands or Belgium. Leaders’
age ranged from 28 to 66 years (M = 44.87, SD = 8.35). Leaders were rated by 1065
subordinates, of which 681 were male and 359 female (25 unknown). Subordinates’ age
ranged from 20 to 70 years (M = 42.25, SD = 9.64). Furthermore, leaders were rated by 677
peers (482 male, 195 female; age range 26 to 71 years, M = 44.78, SD = 8.28) and 257
supervisors (200 male, 57 female; age range 27 to 67 years, M = 46.37, SD = 7.41).
Procedure
All leaders took part in a training program organized by one and the same consultancy
organization. As part of the training, leaders were asked to complete a questionnaire
measuring their leadership styles (see ‘materials’ below). Furthermore, they were asked to
approach as many of their colleagues as possible, but at least 8 individuals, to complete the
leadership questionnaire about them. Leaders were instructed to ask raters from all levels
around them, namely subordinates, peers, and supervisors. All subjects who took part in the
training gave their consent to use the data from the questionnaire for research purposes.
The data provided by the different raters were used as an input to the training.
Material
CLS. The questionnaire used to measure leadership styles is the Circumplex Leadership
Scan (CLS). The CLS is an operationalization of the Leadership Circumplex developed by
Redeker, De Vries, Rouckhout, Vermeren, and De Fruyt (2012; Chapter 2). The questionnaire
contains 116 items. The 116 items of the questionnaire each describe a leadership behavior
located on the circumference of the leadership circumplex (a circle spanned by two
orthogonal, unrelated dimensions very similar to the interpersonal dimensions agency and
communion). Items are located on the circle based on the strength of their relationship. The
distance between variables increases when the strength of the association decreases. Items
are equally spaced on the circumference, therefore creating a circular continuum of
leadership behaviors. The circumplex is divided into eight octants representing eight
different leadership styles. The circumplex leadership scan has demonstrated to be a valid
and reliable questionnaire, complying with the strict criteria of a true circumplex (Redeker et
al., 2012, Chapter 2). The leadership styles, their definitions, exemplar items, and Cronbach’s
alphas for supervisor-, peer-, and subordinate-ratings can be found in Table 1. Overall,
Cronbach’s alphas ranged from .76 to .93.
To analyze the dimensionality of the data, we used Multidimensional Scaling (MDS). MDS
uses a matrix of similarity ratings between all pairs of items entered in the analysis. These
similarity ratings are transformed into distances represented in a multidimensional space,
meaning that the distance between items in a multidimensional space increases when
similarity of items decreases (Fabrigar et al., 1997). The two-dimensional solution generated
the following values: Kruskal’s Stress I = .02, DAF = 1.00 (supervisor); Kruskal’s Stress I = .02,
DAF = 1.00 (peer); Kruskal’s Stress I = .02, DAF = 1.00 (subordinate). This indicates that a two
dimensional solution summarizes the scales. Additionally the data was entered in CIRCUM
82
(Browne, 1992), which is a covariance structuring technique and was developed specifically
to evaluate circumplex correlation models (Gurtman & Pincus, 2000). This approach assesses
whether the underlying structure of the correlation matrix has a circumplex nature (Fabrigar
et al., 1997). To assess the model fit we calculated the root mean square error of
approximation (RMSEA). A lower RMSEA-value indicates a better fit of the model. The
following RMSEA-values were found: RMSEAsupervisor = .08; RMSEApeer = .14; RMSEAsubordinate =
.17. Previous studies, with leader’s self- and subordinate-ratings resulted in a similar RMSEA-
value as the supervisor-ratings (Redeker et al., 2012, Chapter 2). Peer and subordinate
ratings generated a somewhat poorer fit.
Results
Although we did not expect to find an interaction between the hierarchical perspective of
the rater and the gender of both the rater and the leader, we first analyzed the full factorial
model with all possible interactions in one model. No interactions were found between the
hierarchical perspective of the leader and the gender of the leader and the rater.1 Therefore,
we decided to not include these interactions in the analyses reported below. In line with our
hypotheses, we focused our analyses on the model containing the three main effects of
hierarchical perspective, gender of the rater, and gender of the leader. Furthermore, we
included the interaction effect of the gender of the rater and the gender of the leader in the
analyses. Results of these analyses are described below.
The data were organized by leader. Each leader had a number of raters, namely supervisors,
peers, and subordinates. The number of raters per leader was not the same for each leader.
We analyzed the data using two different techniques. First, we conducted a MANOVA with
the hierarchical perspective and the gender of the leader and rater as independent factors
and the eight CLS leadership styles as the dependent factors (Wilks’ Λ for each main effect p
< .001; for the interaction between gender of leader and rater p < .10). Second, we
conducted a mixed model ANOVA, controlling for the leader that is being rated. Both
techniques generated similar results, therefore, we decided to describe the results of the
1 Results of these analyses can be obtained from the first author.
mixed model ANOVA’s, because this analysis controls for the number of raters per leader
and the ratings within a leader.
Hierarchical perspective
Differences in ratings between hierarchical perspectives of the rater were found for all eight
leadership styles. Means and standard errors for each hierarchical perspective’s ratings can
be found in Table 22. Leaders were rated higher on coaching by their supervisor and
subordinates, compared to ratings of their peers (F [2, 931.103] = 4.55, p = .01). Supervisors
rated the leaders lower on inspirational leadership, compared to ratings of subordinates (F
[2, 727.22] = 5.32, p = .005). On average, supervisors also provided lower ratings on directive
leadership, compared to subordinates and peers (F [2, 707.14] = 7.36, p = .01). Authoritarian
leadership was rated lower by supervisors, compared to subordinates, who – in turn –
provided lower ratings on authoritarian leadership than peers (F [2, 1115.60] = 12.40, p <
.001). Peers gave higher ratings of distrustful leadership, compared to both supervisors and
subordinates (F [2, 872.75] = 9.92, p < .001). Subordinates rated their leaders lower on
withdrawn leadership, compared to ratings of both peers and supervisors (F [2, 1053.93] =
12.61, p < .001). Subordinates also gave lower ratings of yielding leadership, compared to
peers, who gave marginally lower ratings when compared to supervisors (F [2, 713.96] =
14.54, p < .001). Both subordinates and supervisors gave higher ratings of participative
leadership, compared to peer-ratings (F [2, 1070.53] = 13.62, p < .001). In sum, in line with
our hypothesis leaders were rated lower on styles high in agency by their supervisor,
compared to subordinates, and higher on styles low in agency.
2 Due to the methodology used to analyze the data, tables present standard errors
instead of standard deviations.
3 The mixed model ANOVA’s controlled for the leader being rated. The denominator’s
degrees of freedom reflect this control condition.
84
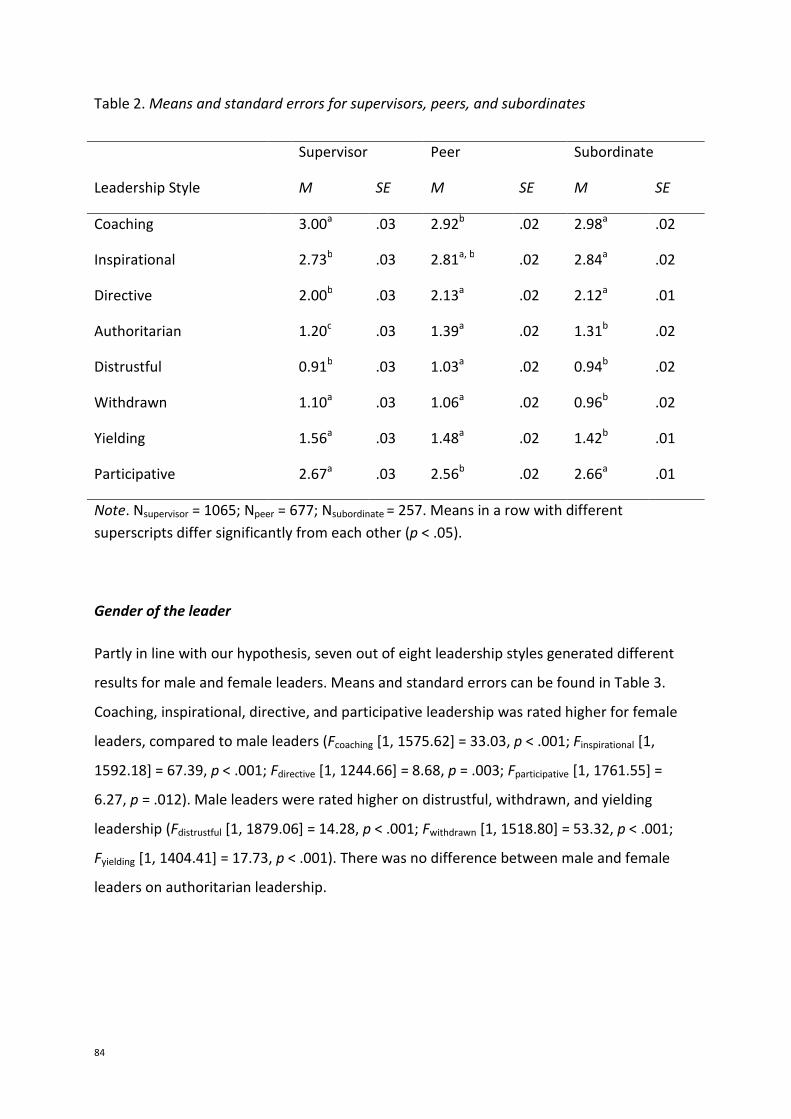
Table 2. Means and standard errors for supervisors, peers, and subordinates
Supervisor Peer Subordinate
Leadership Style M SE M SE M SE
Coaching 3.00a
.03 2.92b
.02 2.98a
.02
Inspirational 2.73b
.03 2.81a, b
.02 2.84a
.02
Directive 2.00b
.03 2.13a
.02 2.12a
.01
Authoritarian 1.20c
.03 1.39a
.02 1.31b
.02
Distrustful 0.91b
.03 1.03a
.02 0.94b
.02
Withdrawn 1.10a
.03 1.06a
.02 0.96b
.02
Yielding 1.56a
.03 1.48a
.02 1.42b
.01
Participative 2.67a
.03 2.56b
.02 2.66a
.01
Note. Nsupervisor = 1065; Npeer = 677; Nsubordinate = 257. Means in a row with different
superscripts differ significantly from each other (p < .05).
Gender of the leader
Partly in line with our hypothesis, seven out of eight leadership styles generated different
results for male and female leaders. Means and standard errors can be found in Table 3.
Coaching, inspirational, directive, and participative leadership was rated higher for female
leaders, compared to male leaders (Fcoaching [1, 1575.62] = 33.03, p < .001; Finspirational [1,
1592.18] = 67.39, p < .001; Fdirective [1, 1244.66] = 8.68, p = .003; Fparticipative [1, 1761.55] =
6.27, p = .012). Male leaders were rated higher on distrustful, withdrawn, and yielding
leadership (Fdistrustful [1, 1879.06] = 14.28, p < .001; Fwithdrawn [1, 1518.80] = 53.32, p < .001;
Fyielding [1, 1404.41] = 17.73, p < .001). There was no difference between male and female
leaders on authoritarian leadership.
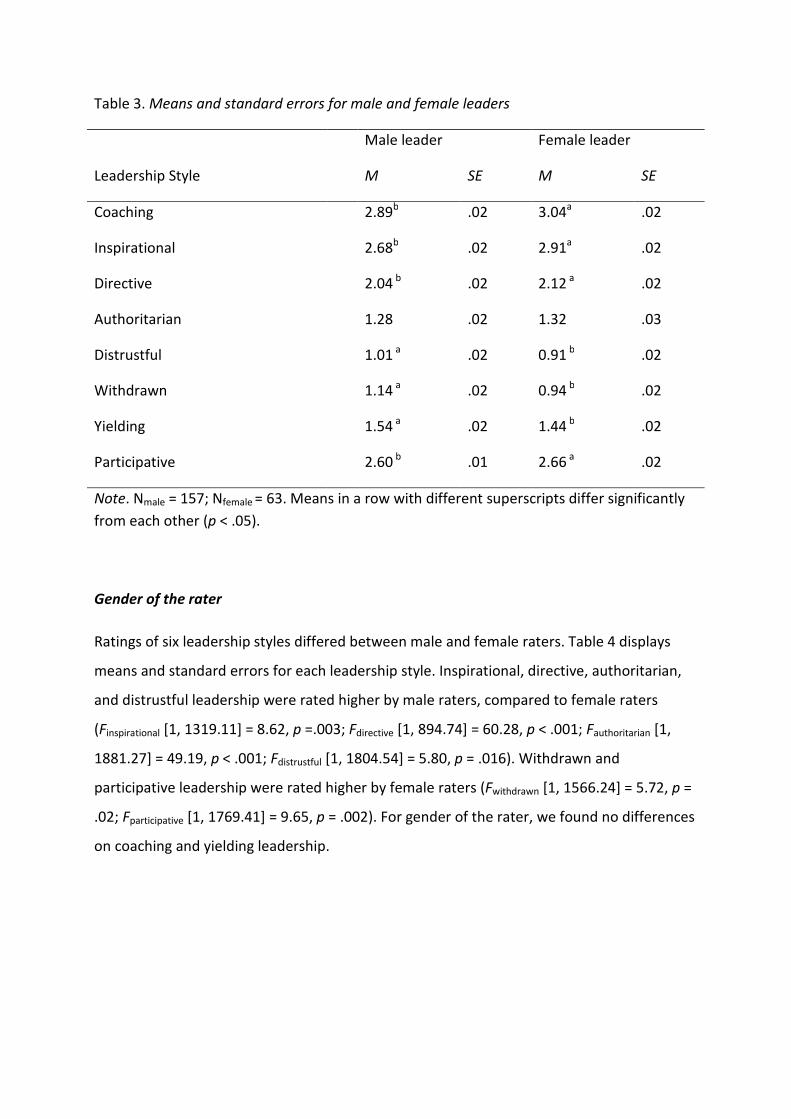
Table 3. Means and standard errors for male and female leaders
Male leader Female leader
Leadership Style M SE M SE
Coaching 2.89b
.02 3.04a
.02
Inspirational 2.68b
.02 2.91a
.02
Directive 2.04 b
.02 2.12 a
.02
Authoritarian 1.28 .02 1.32 .03
Distrustful 1.01 a
.02 0.91 b
.02
Withdrawn 1.14 a
.02 0.94 b
.02
Yielding 1.54 a
.02 1.44 b
.02
Participative 2.60 b
.01 2.66 a
.02
Note. Nmale = 157; Nfemale = 63. Means in a row with different superscripts differ significantly
from each other (p < .05).
Gender of the rater
Ratings of six leadership styles differed between male and female raters. Table 4 displays
means and standard errors for each leadership style. Inspirational, directive, authoritarian,
and distrustful leadership were rated higher by male raters, compared to female raters
(Finspirational [1, 1319.11] = 8.62, p =.003; Fdirective [1, 894.74] = 60.28, p < .001; Fauthoritarian [1,
1881.27] = 49.19, p < .001; Fdistrustful [1, 1804.54] = 5.80, p = .016). Withdrawn and
participative leadership were rated higher by female raters (Fwithdrawn [1, 1566.24] = 5.72, p =
.02; Fparticipative [1, 1769.41] = 9.65, p = .002). For gender of the rater, we found no differences
on coaching and yielding leadership.
86
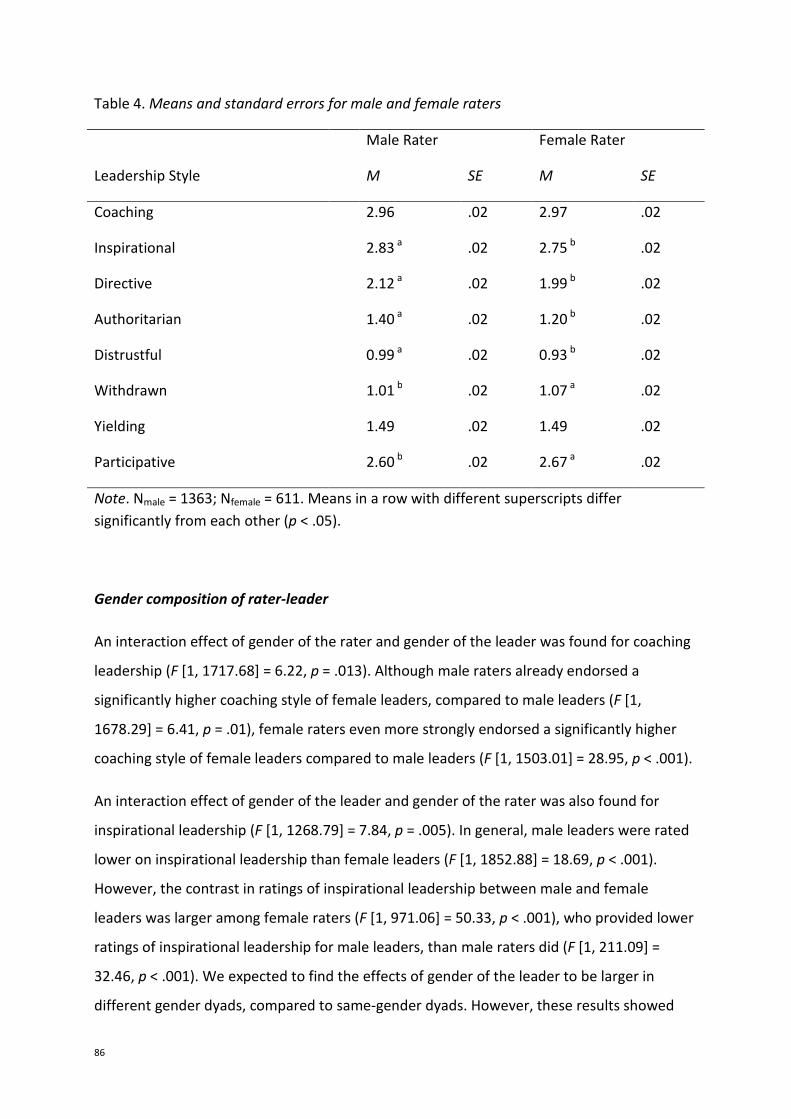
Table 4. Means and standard errors for male and female raters
Male Rater Female Rater
Leadership Style M SE M SE
Coaching 2.96 .02 2.97 .02
Inspirational 2.83 a
.02 2.75 b
.02
Directive 2.12 a
.02 1.99 b
.02
Authoritarian 1.40 a
.02 1.20 b
.02
Distrustful 0.99 a
.02 0.93 b
.02
Withdrawn 1.01 b
.02 1.07 a
.02
Yielding 1.49 .02 1.49 .02
Participative 2.60 b
.02 2.67 a
.02
Note. Nmale = 1363; Nfemale = 611. Means in a row with different superscripts differ
significantly from each other (p < .05).
Gender composition of rater-leader
An interaction effect of gender of the rater and gender of the leader was found for coaching
leadership (F [1, 1717.68] = 6.22, p = .013). Although male raters already endorsed a
significantly higher coaching style of female leaders, compared to male leaders (F [1,
1678.29] = 6.41, p = .01), female raters even more strongly endorsed a significantly higher
coaching style of female leaders compared to male leaders (F [1, 1503.01] = 28.95, p < .001).
An interaction effect of gender of the leader and gender of the rater was also found for
inspirational leadership (F [1, 1268.79] = 7.84, p = .005). In general, male leaders were rated
lower on inspirational leadership than female leaders (F [1, 1852.88] = 18.69, p < .001).
However, the contrast in ratings of inspirational leadership between male and female
leaders was larger among female raters (F [1, 971.06] = 50.33, p < .001), who provided lower
ratings of inspirational leadership for male leaders, than male raters did (F [1, 211.09] =
32.46, p < .001). We expected to find the effects of gender of the leader to be larger in
different gender dyads, compared to same-gender dyads. However, these results showed
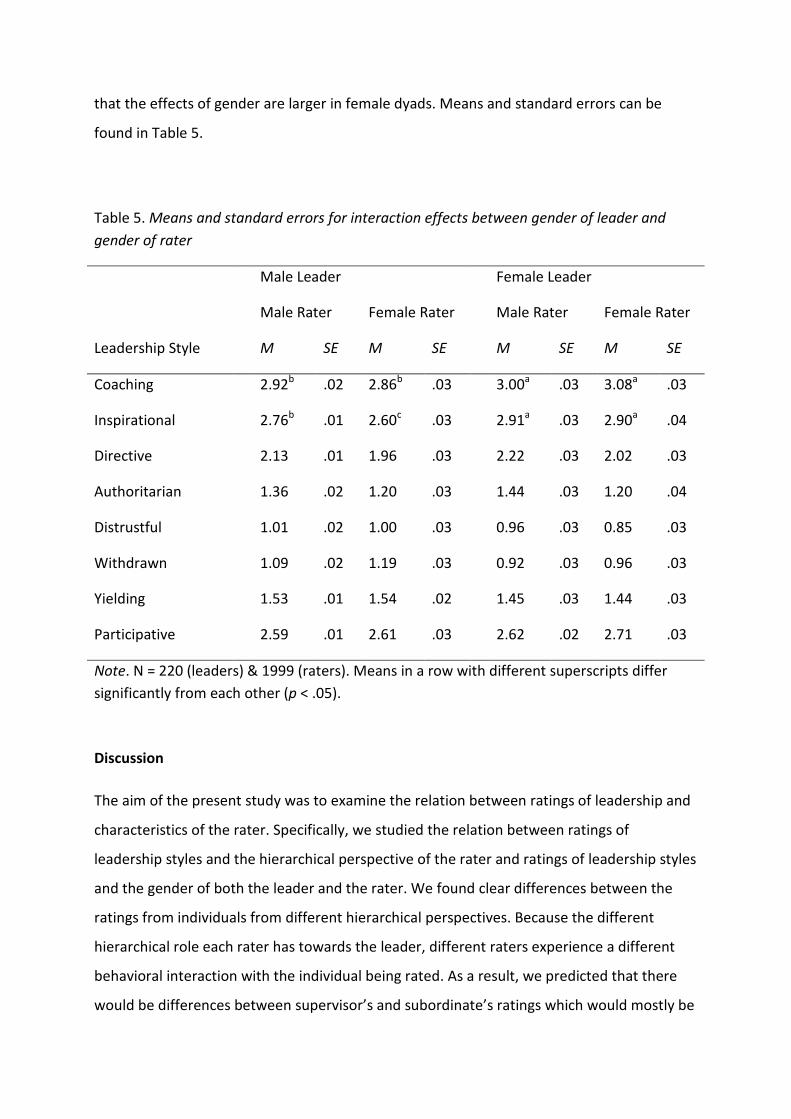
that the effects of gender are larger in female dyads. Means and standard errors can be
found in Table 5.
Table 5. Means and standard errors for interaction effects between gender of leader and
gender of rater
Male Leader Female Leader
Male Rater Female Rater Male Rater Female Rater
Leadership Style M SE M SE M SE M SE
Coaching 2.92b
.02 2.86b
.03 3.00a
.03 3.08a
.03
Inspirational 2.76b
.01 2.60c
.03 2.91a
.03 2.90a
.04
Directive 2.13 .01 1.96 .03 2.22 .03 2.02 .03
Authoritarian 1.36 .02 1.20 .03 1.44 .03 1.20 .04
Distrustful 1.01 .02 1.00 .03 0.96 .03 0.85 .03
Withdrawn 1.09 .02 1.19 .03 0.92 .03 0.96 .03
Yielding 1.53 .01 1.54 .02 1.45 .03 1.44 .03
Participative 2.59 .01 2.61 .03 2.62 .02 2.71 .03
Note. N = 220 (leaders) & 1999 (raters). Means in a row with different superscripts differ
significantly from each other (p < .05).
Discussion
The aim of the present study was to examine the relation between ratings of leadership and
characteristics of the rater. Specifically, we studied the relation between ratings of
leadership styles and the hierarchical perspective of the rater and ratings of leadership styles
and the gender of both the leader and the rater. We found clear differences between the
ratings from individuals from different hierarchical perspectives. Because the different
hierarchical role each rater has towards the leader, different raters experience a different
behavioral interaction with the individual being rated. As a result, we predicted that there
would be differences between supervisor’s and subordinate’s ratings which would mostly be
88
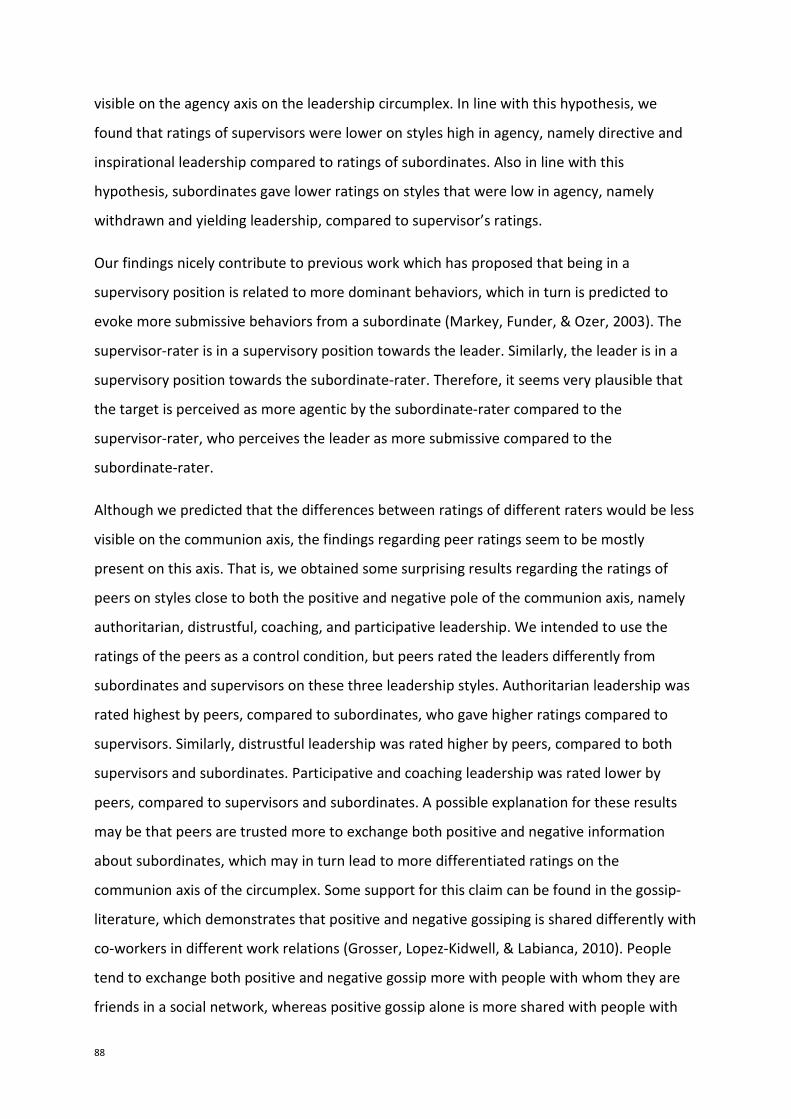
visible on the agency axis on the leadership circumplex. In line with this hypothesis, we
found that ratings of supervisors were lower on styles high in agency, namely directive and
inspirational leadership compared to ratings of subordinates. Also in line with this
hypothesis, subordinates gave lower ratings on styles that were low in agency, namely
withdrawn and yielding leadership, compared to supervisor’s ratings.
Our findings nicely contribute to previous work which has proposed that being in a
supervisory position is related to more dominant behaviors, which in turn is predicted to
evoke more submissive behaviors from a subordinate (Markey, Funder, & Ozer, 2003). The
supervisor-rater is in a supervisory position towards the leader. Similarly, the leader is in a
supervisory position towards the subordinate-rater. Therefore, it seems very plausible that
the target is perceived as more agentic by the subordinate-rater compared to the
supervisor-rater, who perceives the leader as more submissive compared to the
subordinate-rater.
Although we predicted that the differences between ratings of different raters would be less
visible on the communion axis, the findings regarding peer ratings seem to be mostly
present on this axis. That is, we obtained some surprising results regarding the ratings of
peers on styles close to both the positive and negative pole of the communion axis, namely
authoritarian, distrustful, coaching, and participative leadership. We intended to use the
ratings of the peers as a control condition, but peers rated the leaders differently from
subordinates and supervisors on these three leadership styles. Authoritarian leadership was
rated highest by peers, compared to subordinates, who gave higher ratings compared to
supervisors. Similarly, distrustful leadership was rated higher by peers, compared to both
supervisors and subordinates. Participative and coaching leadership was rated lower by
peers, compared to supervisors and subordinates. A possible explanation for these results
may be that peers are trusted more to exchange both positive and negative information
about subordinates, which may in turn lead to more differentiated ratings on the
communion axis of the circumplex. Some support for this claim can be found in the gossip-
literature, which demonstrates that positive and negative gossiping is shared differently with
co-workers in different work relations (Grosser, Lopez-Kidwell, & Labianca, 2010). People
tend to exchange both positive and negative gossip more with people with whom they are
friends in a social network, whereas positive gossip alone is more shared with people with
whom they have merely instrumental relations. Because friendship ties are more likely
among peers, peers may obtain a more differential image of the rated leader.
With the exception of authoritarian leadership, we found differences between male and
female leaders on their rated leadership styles. Female leaders were rated higher on
participative, coaching, inspirational, and directive leadership. Male leader were seen as
more distrustful, withdrawn, and directive when compared to female leaders. This is in line
with previous findings demonstrating that female leaders show more transformational
leadership and that male leaders show more management by exception and laissez faire
leadership (Eagly & Carli, 2003; Eagly, Johannesen-Schmidt, & Van Engen, 2003; Eagly &
Johnson, 1990). It may be that these results are caused by a selection effect. The styles that
were rated higher for female leaders are also rated as more effective (Redeker et al., 2012).
The number of women in leadership positions is still small compared to the number of men.
It may be that only those women are promoted into leadership positions that show these
highly effective leadership styles, while men are more easily promoted into these positions.
Male and female raters were also found to differ in their ratings independent of the gender
of the leader that was being rated. Male raters, from all hierarchical perspectives, tended to
provide higher ratings of inspirational, directive, authoritarian, and distrustful leadership.
Withdrawn and participative leadership was rated higher by female raters. These ratings are
most closely related to gender stereotypical beliefs about leadership styles. Redeker,
Homan, and De Vries (2012; Chapter 4) demonstrated that inspirational, directive,
authoritarian, and distrustful leadership are stereotypically believed to be more masculine.
Withdrawn and participative leadership are perceived to be more feminine leadership styles.
These results show that raters, independent of the gender of the leader, gave ratings of
these leadership styles related to stereotypical beliefs about their own gender. An
explanation for these results might be that raters more easily differentiate between
behaviors that are close to their own gender role and possibly project this difference in
differentiation on their ratings of the behaviors of others. Support for this suggestion can be
found in the ingroup/outgroup literature. It is demonstrated that individuals differentiate
more between members of their ingroup and perceive outgroup members as being more
homogeneous. Building on this ingroup and outgroup difference, one would expect that
people more easily differentiate between the behaviors linked to their own gender role, or
90
the ingroup, than between the behaviors of the other gender, or the outgroup (Mullen & Hu,
1989).
We did expect to find interaction effects between the gender of the rater and the gender of
the leader, because differences in gender composition of the rater-leader dyad were
predicted to influence the salience of the gender of the leader. However, we only found an
interaction for two of the eight leadership styles. Although male raters endorsed a higher
coaching style of female leaders, female raters even more strongly endorsed a higher
coaching style of female leaders. Furthermore, female raters endorsed a lower inspirational
leadership style to male leaders compared to female leaders. Female raters endorsed even
lower inspirational leadership style to male leaders both compared to female leaders and
compared to male raters.
Styles both high in agency and communion, coaching and inspirational leadership, are
generally stereotypically perceived as more effective and are also related positively to
positive leadership outcome variables (Redeker et al., 2012, Chapter 2; Redeker, Homan, &
De Vries, 2012, Chapter 4). The interaction effects, therefore, show a tendency of women to
more positively rate female leaders than male leaders. This is in line with studies on
leadership stereotypes that find that women, compared to men, are more likely to attribute
successful manager characteristics to female managers (Duehr & Bono, 2006). In line with
our findings, Duehr and Bono (2006) found these results especially in the studies focusing on
transformational and communal characteristics, which are found to be more feminine in
general. Other studies also demonstrated this same-sex bias in stereotypes among women
(Boyce & Herd, 2003; Rudman & Goodwin, 2004). The number of women in leadership
positions is still much smaller, compared to men in leadership positions. Being a female
leader may cause her gender to be more salient, resulting in an emphasis on the female
gender ingroup. This may lead to an ingroup bias, defined as the positive evaluation of
members of the ingroup, compared to the outgroup. Mullen, Brown, and Smith (1992)
showed that the effects of an ingroup bias are stronger when the ingroup is made salient.
Therefore, the results of women rating female leaders more positively may be the result of
an ingroup bias.
Our results may be specifically valuable for practitioners. Practitioners often use multisource
- or 360 degrees - feedback, to diagnose the individual’s leadership styles as a starting point
for training and coaching. The present study shows that it is beneficial to segregate these
ratings into different groups, both on hierarchical role and on gender of the rater. Not only
will this enhance the variance in the scores, it may also provide valuable information about
the differences between ratings of their colleagues that may be useful in training and
coaching-settings for both the practitioner and the leader.
As with all studies, this study also has some limitations, two of which are mentioned below.
First, the present study exclusively focused on leadership styles and therefore did not
measure any leadership outcome variables. Previous studies on self-other agreement in
ratings of different perspectives have shown that different levels of agreement have
different relations with leadership outcome variables (e.g., Fleenor et al., 2010). The present
study sheds light on the content of the differences between raters. Therefore, it may be
interesting for future studies to focus on the effect these differences have on ratings of
outcome variables. Furthermore, it may also be interesting for future studies to examine the
influence of other characteristics, such as the gender composition within a team or
organization on ratings of leadership. Second, leaders were motivated to collect as many
ratings as possible from their subordinates, peers, and supervisors. However, we were not
able to collect a dataset that provided both male and female ratings from all hierarchical
perspectives for each leader. Although we did not find indication for an interaction effect
between hierarchical perspective and gender of the leader and/or the rater, it may be of
interest to more extensively study this with a larger, more complete dataset.
Nevertheless, the present study sheds light on the content differences of ratings of raters
with varying characteristics. As a result of using a comprehensive leadership questionnaire it
was possible to demonstrate the influence of different characteristics on an overarching set
of leadership behaviors. The present study nicely showed the relation of both roles with the
agency and the communion axis. Specifically, differences in hierarchical role were shown to
be closely related to differences in dominant and submissive behaviors in leader, while
gender differences were found to have an effect on the behaviors linked to both the
communion and the agency axes of the leadership circumplex.