abrupt sea surface ph change at the end of the younger dryas in
TRANSCRIPT

Biogeosciences, 7, 2445–2459, 2010www.biogeosciences.net/7/2445/2010/doi:10.5194/bg-7-2445-2010© Author(s) 2010. CC Attribution 3.0 License.
Biogeosciences
Abrupt sea surface pH change at the end of the Younger Dryas inthe central sub-equatorial Pacific inferred from boron isotopeabundance in corals (Porites)
E. Douville1, M. Paterne1, G. Cabioch2, P. Louvat3, J. Gaillardet3, A. Juillet-Leclerc1, and L. Ayliffe 4
1Laboratoire des Sciences du Climat et de l’Environnement, Institut Pierre Simon Laplace (LSCE/IPSL) Domaine du CNRS,UMR 8212, Av. de la Terrasse, 91198 Gif/Yvette, France2Institut de Recherche pour le Developpement (IRD), UMR IPSL/LOCEAN, UPMC/CNRS/IRD/MNHN, 32 avenue HenriVaragnat, 93143 Bondy CEDEX, France3Institut Physique du Globe de Paris (IPG-Paris), Laboratoire de Geochimie et de Cosmochimie, Place Jussieu,75252 Paris, France4Research School of Earth Sciences, Australian National University, ACT 0200, Canberra, Australia
Received: 24 February 2010 – Published in Biogeosciences Discuss.: 18 March 2010Revised: 6 July 2010 – Accepted: 20 July 2010 – Published: 16 August 2010
Abstract. The “δ11B-pH” technique was applied to mod-ern and ancient coralsPorites from the sub-equatorial Pa-cific areas (Tahiti and Marquesas) spanning a time intervalfrom 0 to 20.720 calendar years to determine the ampli-tude of pH changes between the Last Glacial Period andthe Holocene. Boron isotopes were measured by Multi-Collector – Inductively Coupled Plasma Mass Spectrometry(MC-ICPMS) with an external reproducibility of 0.25‰, al-lowing a precision of about±0.03 pH-units for pH valuesbetween 8 and 8.3. The boron concentration [B] and isotopiccomposition of modern samples indicate that the tempera-ture strongly controls the partition coefficient KD for differ-ent aragonite species. Modern coralδ11B values and the re-constructed sea surface pH values for different Pacific areasmatch the measured pH expressed on the seawater scale andconfirm the calculation parameters that were previously de-termined by laboratory calibration exercises. Most ancientsea surface pH reconstructions near Marquesas are higherthan modern values. These values range between 8.19 and8.27 for the Holocene and reached 8.30 at the end of thelast glacial period (20.7 kyr BP). At the end of the YoungerDryas (11.50±0.1 kyr BP), the central sub-equatorial Pacificexperienced a dramatic drop of up to 0.2 pH-units from theaverage pH of 8.2 before and after this short event. Usingthe marine carbonate algorithms, we recalculated the aque-ous pCO2 to be 440±25 ppmV at around 11.5 kyr BP forcorals at Marquesas and∼500 ppmV near Tahiti where it
Correspondence to:E. Douville([email protected])
was assumed thatpCO2 in the atmosphere was 250 ppmV.Throughout the Holocene, the difference inpCO2 betweenthe ocean and the atmosphere at Marquesas (1pCO2) in-dicates that the surface waters behave as a moderate CO2sink or source (−53 to 20 ppmV) during El Nino-like condi-tions. By contrast, during the last glacial/interglacial transi-tion, this area was a marked source of CO2 (21 to 92 ppmV)for the atmosphere, highlighting predominant La Nina-likeconditions. Such conditions were particularly pronounced atthe end of the Younger Dryas with a large amount of CO2released with1pCO2 of +185±25 ppmV. This last findingprovides further evidence of the marked changes in the sur-face water pH and temperature in the equatorial Pacific at theYounger Dryas-Holocene transition and the strong impact ofoceanic dynamic on the atmospheric CO2 content.
1 Introduction
The acidity of the ocean surface is increasing because of an-thropogenic emission of CO2 into the atmosphere. This in-crease may have severe consequences for those organismswhich build their external skeleton out of calcium carbon-ate (CaCO3) (Orr et al., 2005). During the last 200 years,roughly fifty percent of the anthropogenic CO2 (IPCC, 2005)contributed to the acidification of the superficial ocean by0.1 pH-units. Models suggest that the sea surface pH coulddrop by∼0.4 units by the year 2100 if the present-day trendof carbon dioxide increase continues (Caldeira and Wick-ett, 2003). Today, the oceanic sources and sinks of CO2show a high degree of spatial and annual to inter-annual
Published by Copernicus Publications on behalf of the European Geosciences Union.

2446 E. Douville et al.: Abrupt sea surface pH change at the end of the Younger Dryas
Figure 1 - Douville et al. (2010 - submitted)
ENSO
Fig. 1. Geographical locations of the study sites, including Moorea (close to Tahiti), Marquesas, Ishigaki, New Caledonia and the FanningIslands. The location of the ERDC-92 box core (Palmer and Pearson, 2003) is also shown. The sea surface pH from modern corals are plottedon a seawater scale pH map modified from Pelejero et al. (2005). Theδ11B data of corals:(a) Gaillardet and Allegre, 1995;(b) Hemming etal., 1998;(c) Pelejero et al., 2005; the foraminiferaδ11B data:(d) Palmer and Pearson, 2003.
variability. For instance, the wind is strengthening, and up-take of CO2 in the Southern Ocean is reduced (Le Quere etal., 2007). Changes in the marine biological pump controlcarbon removal from the upper ocean into the deep ocean(McGillicuddy et al., 2007). Changes have taken place in theoceanic circulation (Feely et al., 1999; Inoue et al., 2001),and these changes may counteract the anthropogenic acid-ification of the ocean. In the past, the atmosphericpCO2changed by∼80 to 100 ppmV between glacial and inter-glacial periods (Honisch and Hemming, 2005; Honisch et al.,2009; Monnin et al., 2001, 2004; Petit et al., 1999). Thosevariations are commonly ascribed to changes in the oceanicuptake of CO2 because the ocean is the largest carbon reser-voir in the atmosphere-hydrosphere-biosphere system. How-ever, the CO2 exchange and related mechanisms have not yetbeen fully understood and quantified (Archer et al., 2000;Kohfeld et al., 2005; Sigman and Boyle, 2000). Quantifyingchanges in the oceanicpCO2 over the centennial and mil-lennial time scales will elucidate the role of the oceanic car-bon cycle and the links between the oceanic and atmosphericchanges ofpCO2and their consequences on ecosystems.
Ocean acidification and past sea surface pH orpCO2 maybe deduced from the boron isotopic composition (δ11B) ofbiogenic carbonates (Hemming and Hanson, 1992; Spivacket al., 1993). During the past decade, numerous studies eval-uated the “δ11B–pH” relationship using experimental stud-ies or laboratory cultures of foraminifera and corals (Hem-ming et al., 1995; Honisch et al., 2004; Reynaud et al., 2004;Sanyal et al., 1996, 2000). Only a few studies based on tropi-cal corals focused on the past hundreds or thousands of years.These first studies investigated the western Pacific Ocean(Pelejero et al., 2005; Wei et al., 2009) and more recently theSouth China Sea (Liu et al., 2009). These studies revealed
pronounced sea surface pH changes by 0.2–0.3 during theHolocene. These changes were strongly controlled by cli-mate (monsoon) or oceanographic patterns (Pacific DecadalOscillation).
First we describe in detail the modern “pH – Sea SurfaceTemperature” relationships for surface waters of thesub-Equatorial Pacific Ocean and the protocols used here to re-construct the pH andpCO2 properties of surface waters. Wealso present theδ11B-pH relationship and partition coeffi-cient for boronKD obtained from modernPoritescollectedin tropical areas of various sea surface temperatures (SSTs).Then, we use the derived relationships to investigate ancientcorals recovered from drowned reefs off the Marquesas andfrom modern reefs near the Tahiti Islands in the central equa-torial Pacific (Fig. 1) to reconstruct past pH, SST andpCO2levels of these areas. These new results are compared toprevious results from modern or ancient corals of the gen-eraAcroporaandPorites(Gaillardet and Allegre, 1995) andfrom planktonic foraminifera (Palmer and Pearson, 2003).The deduced changes in the sea surface pH and SST areevaluated against oceanographic patterns, and the estimatedoceanicpCO2 values are compared to atmospheric valuesmeasured in Antarctic ice cores (Monnin et al., 2001, 2004).
2 Hydrological setting of the central tropical PacificOcean: “pH–SST” relationships
The pH and SST data show that in the modernequatorial Pacific, the sea surface pH and SST be-tween 5◦ S and 20◦ S are highly negatively corre-lated (Fig. 2), data fromhttp://www.nodc.noaa.gov/OC5/SELECT/dbsearch/dbsearch.html) (Lefevre et al., 1994).
Biogeosciences, 7, 2445–2459, 2010 www.biogeosciences.net/7/2445/2010/

E. Douville et al.: Abrupt sea surface pH change at the end of the Younger Dryas 2447
Figure 2 - Douville et al. (2010 - submitted)
a)
b)
Fig. 2. (a)The present day sea surface pH in the sub-Equatorial Pacific Ocean as function of the geographical location (left axe). 0.07 pH-units are added to the present day pH on the pre-industrial era pH axe (see text). The month (values in parenthesis) of the water sampling andthe averaged SSTs are also indicated.(b) Sea surface pH in the sub-Equatorial Pacific Ocean plotted against SST between 150◦ E and 80◦W.Similar pH-SST correlations were observed for surface waters between 80◦W and 170◦W at three different ranges of latitude (sources fromhttp://www.nodc.noaa.gov/OC5/SELECT/dbsearch/dbsearch.html; measurement years: 1980–1998; depths: 0–50 m).
This correlation is especially strong between 80◦W and170◦W because of the cold and CO2-rich waters comingfrom the major deep water upwelling along the eastern coastsof the sub-Equatorial Pacific Ocean. In the eastern Pacific,the nutrient-rich surface waters are characterised by low pHand cool SST (Fig. 2a). The pH ranges from∼7.98 to about8.01–8.06, as reported as present day pH (Fig. 2a, left axis),and the SST varies from 20.4◦C to 23.1◦C. At latitudes be-tween 15◦ S and 20◦ S, the pH increases slightly by about0.05 pH-units, and the SST increases by 3◦C from 80◦Wto 170◦W. The increase is more than 0.07 pH-units between5◦ S and 10◦ S (Fig. 2b). In the western Pacific, high pHvalues of 8.22± 0.03 and warm SSTs are observed during
the boreal summer. During the boreal winter, the pH dropsby 0.1 pH-unit. The SSTs are uniformly around 29.5◦C be-tween 5◦ S and 15◦ S and lower by about 4◦C between 15◦ Sand 20◦ S. In the central Pacific between 130◦W and 150◦Wand at latitudes higher than 15◦ S, warm surface waters witha SST of 28.6◦C and a pH of∼8.22 were observed during1994, an El Nino year. These waters show pH-SST prop-erties similar to those of the western Pacific surface waters(Fig. 2).
Most present day pH values for Marquesas and Tahiti (5–17◦ S) between 130◦W and 150◦W range from 8.10 to 8.15(Fig. 2). This east-west pH-SSTs pattern corresponds to thewell-known seasonal variation of the zonal distribution of
www.biogeosciences.net/7/2445/2010/ Biogeosciences, 7, 2445–2459, 2010

2448 E. Douville et al.: Abrupt sea surface pH change at the end of the Younger Dryas
water masses along the equator. This pattern is modified bychanges in the wind strength. During El Nino years, west-ward water transport through the South Equatorial CurrentSEC decreases in the central Pacific because of eastwardtransport of warmer water from the western Pacific (Taft andKessler, 1991). The sea surface pH increases under theseconditions. When strong easterlies return, the westwardSEC flow increases, and the equatorial thermocline shoalsand favours contribution of more CO2-rich waters. Conse-quently, during La Nina-like conditions, more acidic coldwaters are advected from the east toward the central Pacific(Taft and Kessler, 1991).
3 Materials and methods
3.1 Geographical setting and regional modern SST
The “δ11B–pH” indicator was applied to modernPoritescol-lected from New Caledonia (2001–2004), Moorea (1950)and Ishigaki Islands (Fig. 1). The New Caledonia sampleused in this paper comes from outside the lagoon on the up-per part of the barrier reef slope. This site is called Faussepasse d’Uitoe. The SST was measured at this site everymonth since 2000 and had a mean value of 24.4±1.9◦C (Ta-ble 1). The coral skeleton spans the period from 2001–2004.Porites from Ishigaki Island is the coral reference materialJCp-1 prepared by the Geological Survey of Japan (Inoue etal., 2004). The regional SST over the last two decades in thisarea is close to 26.1±2.1◦C. The average SST of a samplefrom Moorea (MOO3A-1-02) was 27.1±0.5◦C (Boiseau,1998). Another modern sample is COM3 from the Red Sea.This sample grew at annually averaged SST of 22.5±1.5◦C(Gertman and Brenner, 2004; Heiss et al., 1999). Ac-cording to modern observations (http://www.nodc.noaa.gov)(Henin, 1999), the Marquesas area has a mean annual SST of28±1◦C. The ancientPoritessamples studied here were col-lected from submerged reefs off the Marquesas and TahitiIslands in the Equatorial Pacific. Coral ages, which spanfrom 20.72±0.20 kyr BP to 0.25±0.03 kyr BP, were obtainedby mass spectrometric U-Th dating (Paterne et al., 2004;Cabioch et al., 2008).
3.2 Chemical preparation
The mean annual growth bands ofPoritesare about 10 mmin our samples. About 400 mg of the coral skeleton were cutalong the growth axis systematically. Each of these samplesrepresents one or two years. It is most important to care-fully collect a piece of coral integrating both low and highdensity bands in order to smooth out the effect of seasonalpH changes and to keep always the same sampling strat-egy. The coral fragments were crushed in an agate mortar,and the resulting carbonate powder was washed three timeswith ultra-pure water in an ultrasound bath (Gaillardet and
All egre, 1995). Then, the powder was dissolved in dilute ul-trapure Merck’s 1N HNO3 before chemical purification. Thesolutions were purified on the anion exchange resin Amber-lite IRA 743 using the batch method developed by Lecuyer etal. (2002). In 50ml polypropylene corning centrifuge tubes,the solutions were neutralised to a pH of 7–8. Resin, previ-ously cleaned using 4N HNO3, was added in sufficient quan-tity (500 mg) to extract 100% of boron from solution for eachstandard and sample. The tubes, up to 25 including sam-ples and standards, were shaken for more than four hours be-fore the resin was rinsed three times with MQ water. Then,boron was eluted by three successive volumes of 5 ml of0.1N HNO3. Extraction yields of close to 100% and accu-rate purification (level of residual Ca and major cations) wereverified for each standard or sample by Inductively CoupledPlasma – Quadrupole Mass Spectrometry (ICP-QMS). Fi-nally, the boron concentration was adjusted to 200 ppb in 2%nitric acid for MC-ICPMS analyses.
3.3 Boron isotope measurements
The boron isotope composition was determined with double-focusing sector-field multi-collector inductively coupledplasma mass spectrometers (MC-ICPMS Neptune of Ther-moFisher Scientific) both in the Advanced Mass Spectrome-try Laboratory of Thermo Fisher Scientific in Bremen (Ger-many) and at the Institut de Physique du Globe in Paris(France). Common introduction in Bremen was by a quartzdouble-pass spray chamber, and in Paris we used a directinjection high efficiency nebuliser (d-DIHEN). Mass driftof the 11B/10B ratio with time was systemically controlledby standard-sample bracketing. Most of theδ11B valuespresented here were determined using the direct injectiontechnique, which allows a strong reduction of the analyti-cal blank contributions. These contributions were lower than0.5‰ for each isotope with a rinse time of 3 min or less(Louvat et al., 2010). Using direct injection (d-DIHEN) andconventional introduction, comparison of repeated analysesfor four different samples (DW1281c78a1; DW126168a1;DW128175a2; MOO 3A-1-02) yields excellent agreementwithin the analytical uncertainty of 0.25‰ given here (Fig. 3,Table 1). The reproducibility and accuracy of the11B/10Bratios were calculated from repeated analyses of the boricacid standard NBS-951 and the North Atlantic SeawaterStandard NASS-II. The measured external reproducibility of0.25‰ (2σ ) is similar to the reproducibility that was recentlypublished for MC-ICPMS analyses by Neptune (Foster,2008; Louvat et al., 2010). A meanδ11B of 39.9‰ (n=20,2 σ ) was measured for NASS-II. This value is also withinthe external precision range of 39.7–40.2‰ previously pub-lished for thermal ionization mass spectrometry (TIMS) orMC-ICPMS measurements (Gaillardet and Allegre, 1995;Hemming and Hanson, 1992; Honisch et al., 2004; Wei etal., 2009; Louvat et al., 2010). The external reproducibil-ity of 0.25‰ (2 σ ) represents our analytical precision for
Biogeosciences, 7, 2445–2459, 2010 www.biogeosciences.net/7/2445/2010/

E. Douville et al.: Abrupt sea surface pH change at the end of the Younger Dryas 2449
Table 1. Isotopic composition of boronδ11B (‰) and boron concentrations measured for coral and seawater samples. The1pCO2 calcula-tion is detailed in the text. The previously publishedδ11B data for corals includesa Gaillardet and Allegre, 1995;b Hemming et al., 1998; andc Pelejero et al., 2005.The230Th/U ages of the corals from Tahiti and Marquesas are from Bard et al. (1996), Cabioch et al. (2008), Paterne et al. (2004).∗ 230Th/U age of the sample Ta-3 is the former date published by Gaillardet and Allegre (1995).SST sources: (http://www.nodc.noaa.gov(Boiseau, 1998; Gertman and Brenner, 2004; Heiss et al., 1999; Henin and Cresswell, 2005).
Samples, mean SST 230Th/U Boron LSCE δ11B (‰) Salinity Ak pH pC02 1pCO2age cal. (ppm) number (2σ , n) (Sea level) µM (±0.03) (ppmV) (ppmV)
Marquesas Islands, 28±1.0◦C
Nuku Hiva DR6(1) 250±30 40.0 B33di 26.2±0.2 (2) 35.6 2401 8.21 264 −16DW1281c 78a1 3230±30 63.2 B01, 02, 03, 04 26.5±0.2 (6) 35.6 2401 8.25 238 −36
B20di 26.8±0.3 (1) 35.6 2401 8.27 221 −53DW126168a1 3260±30 60.0 B15, 16 26.3±0.3 (3) 35.6 2401 8.22 260 −14
B18di 26.1±0.1 (4) 35.6 2401 8.21 269 −5Eiao DR16(3) 8◦990±130 37.4 B31di 26.0±0.3 (2) 35.9 (−30 m) 2420 8.19 281 20Eiao DR16(5) 9◦110±130 53.4 B32di 26.3±0.5 (2) 35.9 (−30 m) 2420 8.22 259 −5Eiao DR12(1) 9◦590±180 43.5 B30di 26.2±0.2 (3) 35.9 (−30 m) 2420 8.21 270 6DW1281 75a2 11 470±90 45.3 B13, 14 24.8±0.1 (4) 36.2 (−60 m) 2440 8.06 420 164
B19di 24.5±0.2 (2) 36.2 (−60 m) 2440 8.02 464 209Hiva Oa DR10(2) 12 420±100 51.9 B27di 26.2±0.2 (3) 36.2 (−65 m) 2443 8.21 273 34Eiao DR11bis(4) 13 410±190 n.d. B53di 25.6±0.3 (1) 36.3 (−75 m) 2449 8.14 330 92Eiao DR8(1) 14 560±180 42.1 B29di 26.1±0.2 (2) 36.5 (−90 m) 2459 8.19 284 49Hiva Oa DR14bis(1) 15 450±150 40.0 B28di 26.1±0.3 (3) 36.6 (−105 m) 2469 8.20 281 57Hiva Oa DR8bis(1) 15 460±110 43.8 B26di 26.4±0.2 (2) 36.6 (−105 m) 2469 8.23 256 33Hiva Oa DR5 20 720±200 63.6 B25di 27.1±0.3 (3) 36.8 (−125 m) 2482 8.30 209 21
Moorea-Tahiti Islands, 27.1±0.5◦C
Porites:
COM2a 1991(AD) 51.0 25.3±0.2 (3) 35.6 2401 8.13 340 −15MOO 3A-1-02 1950 (AD) 51.9 B11, 12 25.8±0.2 (3) 35.6 2401 8.18 294 −16
B17di 25.8±0.2 (3) 35.6 2401 8.18 292 −18Ta P8-348 12 910±30 n.d. B56di 25.9±0.3 (3) 36.3 (−75 m) 2449 8.19 287 53Ta P8-353 13 335±30 n.d. B57di 26.6±0.2 (3) 36.3 (−75 m) 2449 8.26 231 −7
Acroporaa:
Ta-1 8520±40 50.0 25.7±0.3 (2) 35.9 (−30 m) 2420 8.23 251 −10Ta-2 9260±50 49.0 25.4±0.2 (3) 35.9 (−30 m) 2420 8.21 273 12Ta-3 9850∗ 51.0 25.6±0.2 (2) 35.9 (−30 m) 2420 8.22 259 −4Ta-4 10 250±40 52.0 25.9±0.3 (1) 36.0 (−40 m) 2427 8.25 237 −30Ta-5 10 575±50 41.0 24.6±0.3 (1) 36.0 (−45 m) 2430 8.11 357 91Ta-6 10 850±50 50.0 26.6±0.2 (2) 36.1 (−50 m) 2433 8.32 196 −69Ta-7 11 000±40 50.0 25.3±0.2 (2) 36.1 (−50 m) 2433 8.19 290 26Ta-8 11 280±30 41.0 24.4±0.2 (3) 36.1 (−55 m) 2436 8.09 387 123Ta-9 11 495±30 41.0 23.6±0.2 (3) 36.2 (−60 m) 2440 7.99 508 254
Ishigaki Island, 26.1±2.1◦C
Porites JCp-1 (standard) modern 47.7 9 samplings 24.5±0.2 (17) 35 8.06
New Caledonia, 24.4±1.9◦C
NC a 2001–2002 (AD) 55.0 B84di, 85di 24.3±0.2 (2) 35 8.04NC b 2002–2003 (AD) 54.6 B86di, 87di 24.5±0.6 (2) 35 8.06NC c 2003–2004 (AD) 54.4 B89di, 90di, 91di, 92di 24.8±0.5 (4) 35 8.10
Red Seaa, 22.5±2.0◦C
COM3 1970–80 (AD) 57.0 23.7±0.5 (2) 35 7.98
Fanning Islandb, 25–28◦C
Porites Lobata mean 50.5 Seasonal 24.8 35 8.07Two year range 46.1–53.9 microsamplings 23.9–26.2 35 7.96–8.23
Flinders Reefc
FLO2A 1990s (AD) – 23 35 ∼7.91950s (AD) – 24.5 35 ∼8.11700–2000 (AD) – 23.0–25.0 35 7.9–8.1
www.biogeosciences.net/7/2445/2010/ Biogeosciences, 7, 2445–2459, 2010
2450 E. Douville et al.: Abrupt sea surface pH change at the end of the Younger Dryas
Figure 3 - Douville et al. (2010 - submitted)
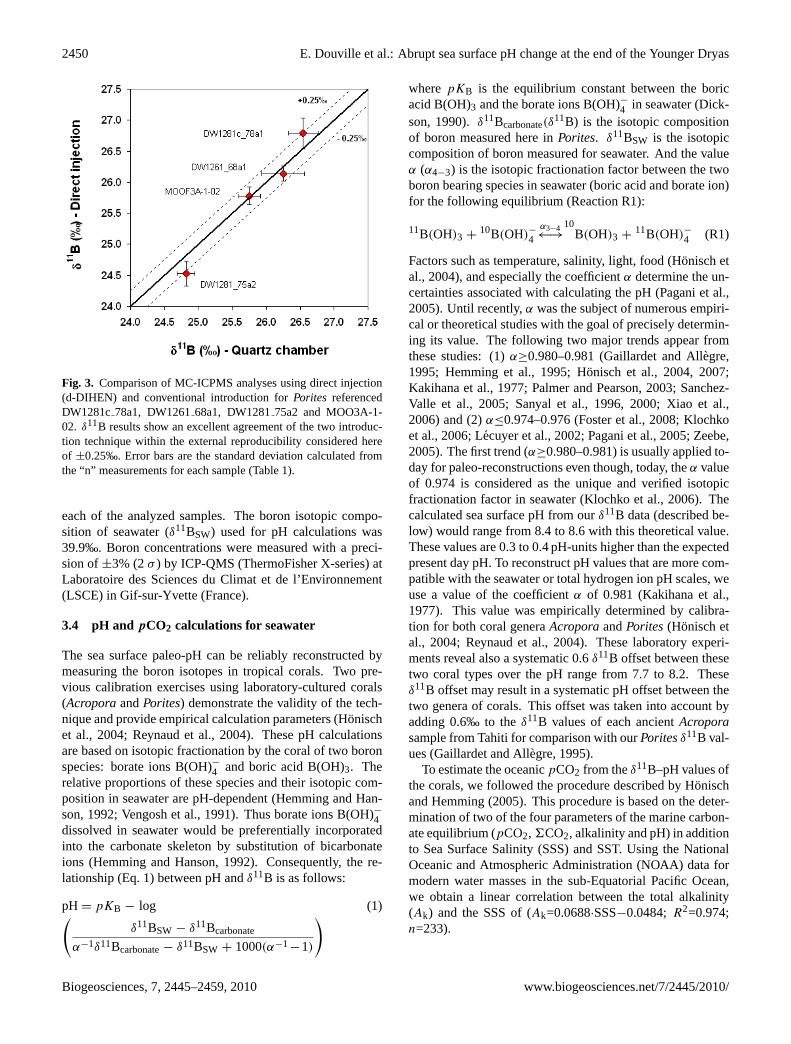
Fig. 3. Comparison of MC-ICPMS analyses using direct injection(d-DIHEN) and conventional introduction forPorites referencedDW1281c78a1, DW126168a1, DW128175a2 and MOO3A-1-02. δ11B results show an excellent agreement of the two introduc-tion technique within the external reproducibility considered hereof ±0.25‰. Error bars are the standard deviation calculated fromthe “n” measurements for each sample (Table 1).
each of the analyzed samples. The boron isotopic compo-sition of seawater (δ11BSW) used for pH calculations was39.9‰. Boron concentrations were measured with a preci-sion of±3% (2σ ) by ICP-QMS (ThermoFisher X-series) atLaboratoire des Sciences du Climat et de l’Environnement(LSCE) in Gif-sur-Yvette (France).
3.4 pH andpCO2 calculations for seawater
The sea surface paleo-pH can be reliably reconstructed bymeasuring the boron isotopes in tropical corals. Two pre-vious calibration exercises using laboratory-cultured corals(AcroporaandPorites) demonstrate the validity of the tech-nique and provide empirical calculation parameters (Honischet al., 2004; Reynaud et al., 2004). These pH calculationsare based on isotopic fractionation by the coral of two boronspecies: borate ions B(OH)−4 and boric acid B(OH)3. Therelative proportions of these species and their isotopic com-position in seawater are pH-dependent (Hemming and Han-son, 1992; Vengosh et al., 1991). Thus borate ions B(OH)−
4dissolved in seawater would be preferentially incorporatedinto the carbonate skeleton by substitution of bicarbonateions (Hemming and Hanson, 1992). Consequently, the re-lationship (Eq. 1) between pH andδ11B is as follows:
pH= pKB − log (1)(δ11BSW− δ11Bcarbonate
α−1δ11Bcarbonate− δ11BSW+ 1000(α−1−1)
)
wherepKB is the equilibrium constant between the boricacid B(OH)3 and the borate ions B(OH)−4 in seawater (Dick-son, 1990).δ11Bcarbonate(δ
11B) is the isotopic compositionof boron measured here inPorites. δ11BSW is the isotopiccomposition of boron measured for seawater. And the valueα (α4−3) is the isotopic fractionation factor between the twoboron bearing species in seawater (boric acid and borate ion)for the following equilibrium (Reaction R1):
11B(OH)3 +10B(OH)−4
α3−4←→
10B(OH)3 +
11B(OH)−4 (R1)
Factors such as temperature, salinity, light, food (Honisch etal., 2004), and especially the coefficientα determine the un-certainties associated with calculating the pH (Pagani et al.,2005). Until recently,α was the subject of numerous empiri-cal or theoretical studies with the goal of precisely determin-ing its value. The following two major trends appear fromthese studies: (1)α≥0.980–0.981 (Gaillardet and Allegre,1995; Hemming et al., 1995; Honisch et al., 2004, 2007;Kakihana et al., 1977; Palmer and Pearson, 2003; Sanchez-Valle et al., 2005; Sanyal et al., 1996, 2000; Xiao et al.,2006) and (2)α≤0.974–0.976 (Foster et al., 2008; Klochkoet al., 2006; Lecuyer et al., 2002; Pagani et al., 2005; Zeebe,2005). The first trend (α≥0.980–0.981) is usually applied to-day for paleo-reconstructions even though, today, theα valueof 0.974 is considered as the unique and verified isotopicfractionation factor in seawater (Klochko et al., 2006). Thecalculated sea surface pH from ourδ11B data (described be-low) would range from 8.4 to 8.6 with this theoretical value.These values are 0.3 to 0.4 pH-units higher than the expectedpresent day pH. To reconstruct pH values that are more com-patible with the seawater or total hydrogen ion pH scales, weuse a value of the coefficientα of 0.981 (Kakihana et al.,1977). This value was empirically determined by calibra-tion for both coral generaAcroporaandPorites(Honisch etal., 2004; Reynaud et al., 2004). These laboratory experi-ments reveal also a systematic 0.6δ11B offset between thesetwo coral types over the pH range from 7.7 to 8.2. Theseδ11B offset may result in a systematic pH offset between thetwo genera of corals. This offset was taken into account byadding 0.6‰ to theδ11B values of each ancientAcroporasample from Tahiti for comparison with ourPoritesδ11B val-ues (Gaillardet and Allegre, 1995).
To estimate the oceanicpCO2 from theδ11B–pH values ofthe corals, we followed the procedure described by Honischand Hemming (2005). This procedure is based on the deter-mination of two of the four parameters of the marine carbon-ate equilibrium (pCO2, 6CO2, alkalinity and pH) in additionto Sea Surface Salinity (SSS) and SST. Using the NationalOceanic and Atmospheric Administration (NOAA) data formodern water masses in the sub-Equatorial Pacific Ocean,we obtain a linear correlation between the total alkalinity(Ak) and the SSS of (Ak=0.0688·SSS−0.0484;R2=0.974;n=233).
Biogeosciences, 7, 2445–2459, 2010 www.biogeosciences.net/7/2445/2010/
E. Douville et al.: Abrupt sea surface pH change at the end of the Younger Dryas 2451
We hypothesise that the present-day “Ak–SSS” relation-ship was also valid in the past. Past salinities can be esti-mated from sea-level changes through the past (Bard et al.,1996). For example, a reduction of 60 m occurred during theYounger Dryas (YD) over a mean oceanic depth of 3800 m.This estimate takes into account the modern salinity nearTahiti and the Marquesas Islands of 35.6±1 as a reference(Delcroix et al., 1996). From this calculation, the salinity inthe past was about 36.2 in the central Pacific and about 34.8in the eastern Pacific during the YD (Table 1). We considertoday’s mean seasonal salinity variability of±1 (Delcroix etal., 1996) in the calculation. The oceanicpCO2 calculationwas performed from pH and total alkalinity values listed inTable 1 using the guide to best practices for ocean CO2 mea-surements by Dickson et al. (2007) withK1 and K2 fromLueker et al. (2000),KW from (Millero, 1995), K0 fromWeiss (1974) and pH values on the total hydrogen ion pHscale (close to the seawater one).
4 Results and discussion
To verify the reliability of pH reconstruction from boron iso-topes in corals, we first analyzed theδ11B and pH data formodernPorites samples collected from various areas andcompared our results with the present day pH measured inthe Pacific. Those areas cover a range of SST values and al-low us to further elucidate the influence of the temperatureon the incorporation of boron and its isotopic composition incorals. For each area, the measured or previously publishedvalues ofδ11B and [B] inPoritesare evaluated against a the-oretical curve that illustrates the preferential incorporation ofborate ions in corals by substituting for the bicarbonate ions(Hemming and Hanson, 1992). This approach allows us todetermine the various values of the partition coefficientKDand to establish a link between the SST andKD. Similarexercises were done for the ancient corals from Marquesasand Tahiti to obtain information about the past SST. Finally,the changes in the pH and thepCO2 as a function of timewill be discussed in the central sub-equatorial Pacific by us-ing the results of the “δ11B–pH” calculation for bothPoritesnear Marquesas (this study) andAcroporanear Tahiti (Gail-lardet and Allegre, 1995). This analysis takes into accountthe observed SST data.
4.1 Reconstruction of the pH and SST fromδ11B and[B] data in modern Porites
4.1.1 pH deduced fromδ11B in modern Porites
The meanδ11B values measured in modernPorites (Ta-ble 1) were about 25.8±0.2‰ (n=6) for Moorea (1950 AD),24.6±0.3‰ (n=8) for New Caledonia (2001–2004 AD) and24.5±0.2‰ (n=17) for the Ishigaki Island (JCp-1). Thesevalues are similar to the modern value of 24.8‰ pub-lished for the Fanning Island (Hemming et al., 1998) and
higher than the values of 23.6‰ and 23‰ found for theRed Sea (Gaillardet and Allegre, 1995) and Flinders Reef(∼1990 AD) along the Great Barrier Reef (Pelejero et al.,2005), respectively. According to the regional SST and SSSof 35 psu, the deduced sea surface pH was 7.98 for the RedSea, 8.06 for the Ishigaki area, 8.07 for Fanning Island,8.07±0.3 for New Caledonia and 8.13 and 8.18 for Mooreain 1991 AD and 1950 AD, respectively. Theδ11B value forMoorea was higher by +0.5‰ than the previous measure-ment in 1991 (Gaillardet and Allegre, 1995). This changecorresponds to the pH change of 0.05 pH-unit. These valuesfrom modernPorites off the Moorea match the pH valuesmeasured in this area (Fig. 2). The inter-decadal variabil-ity linked, for example, to the Pacific Decadal Oscillation(PDO), could explain the difference observed in the west-ern Pacific (Pelejero et al., 2005), but thisδ11B change couldalso reflect the consequences of surface water acidificationduring the industrial era given our own recent description ofthe last century at Fiji (Douville et al., 2009). Finally, the pHvalues deduced from the modernPoritesfor various areas ofthe Pacific Ocean match well with the present day pH map(Fig. 1) that was calculated on the seawater scale. These re-sults corroborate the analyses that were based on empiricalα values and previous lab calibrations on the tropical coralPorites(Honisch et al., 2004; Reynaud et al., 2004).
4.1.2 SST and the partition constantKD for aragonitecorals
All of the δ11B values versus [B] obtained here (Table 1) formodernPorites from Moorea, Ishigaki and New CaledoniaIslands in the Pacific Ocean were compared to available pub-lished values for Moorea, Fanning Island and the Red Sea(Gaillardet and Allegre, 1995; Hemming et al., 1998) andplotted (Fig. 4a) to verify the model of a unique incorpora-tion of boron (as borate ions) into the corals by substitutionof bicarbonates ions (Hemming and Hanson, 1992; Sanyal etal., 2000; Yu and Elderfield, 2007; Foster, 2008). This modelsuggests that the [B] (or B/Ca) in corals increases togetherwith the δ11B and is controlled by the borate/bicarbonateabundance ratio in seawater according to the following re-lationship (Eq. 2):
[B/Ca]corals= KD · [B(OH)−4 /HCO−3 ]seawater (2)
whereKD is the partition coefficient for boron. For variouspH conditions, the theoreticalδ11B or [B(OH)−4 /HCO−3 ] ra-tios for seawater and the [B] for corals can be calculated andplotted by setting aKD value. This model curve can be di-rectly compared and fitted to points that correspond to theδ11B and the [B] values measured in corals for each studiedarea. Model curves were generated with empirical values ofα=0.981 (Kakihana et al., 1977),δ11BSW=39.9‰ (this work)andpKB=8.56 (Dickson, 1990) at 28◦C and 35 psu. Fig-ure 4a does not validate the model for a one and unique par-tition coefficientKD but shows scattered points that represent
www.biogeosciences.net/7/2445/2010/ Biogeosciences, 7, 2445–2459, 2010
2452 E. Douville et al.: Abrupt sea surface pH change at the end of the Younger Dryas
Figure 4 - Douville et al. (2010 - submitted)
a)
b)
Modern corals
Ancient corals
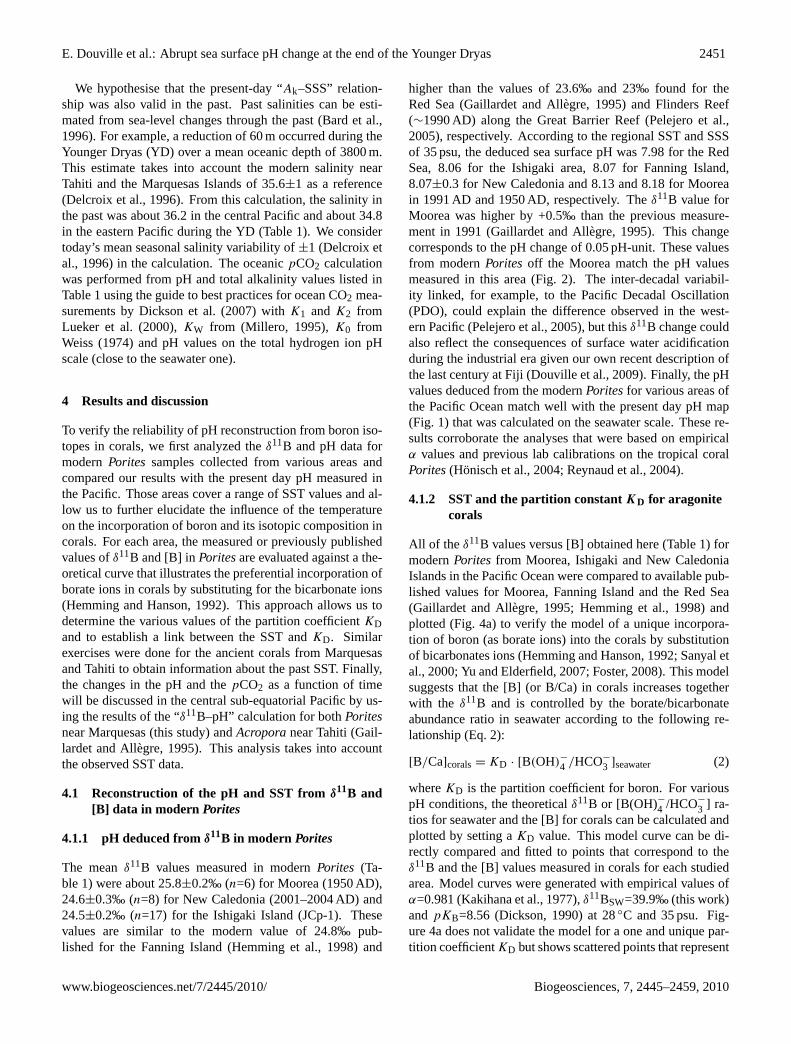
Fig. 4. Theδ11B values plotted against the boron concentrations(a) for modernPoritesfrom various geographical areas and(b) for ancientPorites and Acropora near Marquesas and the Tahiti Islands. The theoretical curves for different partition coefficientKD values werecalculated assumingT =28◦C; S=35‰;α=0.981; andδ11BSW=39.9‰. Seawater values used were [B]seawater=416 µM andT CO2=2 mM.
various values of the partition coefficientKD ranging be-tween 0.0068 (Moorea) and 0.0125 (Red Sea). In contrast, asimilar graph for ancient corals shows values better validat-ing the model with averageKD values of 0.0057 and 0.0068for the Marquesas and Tahiti samples, respectively (Fig. 4b).The highest values are observed for the corals that grew atthe end the Younger Dryas with values up to 0.0095 (Tahiti).
To evaluate the potential effect of the SST on this co-efficient, the borate/bicarbonate molar ratios for seawa-ter [B(OH)−4 /HCO−3 ]seawater were first re-calculated fromthe measuredδ11B–pH values using the regional SST andthen compared to the measured boron/calcium molar ratios
([B/Ca]coral) for all of the corals studied here (Fig. 5). Thisgraph shows that the regional SST strongly controls the par-tition coefficientKD, which is 0.0057 or less for the highesttemperature (in the Marquesas area or Fanning Island dur-ing the winter season and the influence of warm and high pHwaters, see below) and 0.0125 for the lowest SST (close to22.5◦C in the Red Sea). TheKD values are plotted versusthe SST for modernPorites in Figure 6a. This figure showsa strong linear relationship with a regression coefficient (R2)
of 0.99. This linear dependence confirms that the boron incorals is more easily incorporated in aragonite at low temper-atures, as previously observed inPorites(Fallon et al., 2003).
Biogeosciences, 7, 2445–2459, 2010 www.biogeosciences.net/7/2445/2010/

E. Douville et al.: Abrupt sea surface pH change at the end of the Younger Dryas 2453
Figure 5 - Douville et al. (2010 - submitted)
Fig. 5. B/Ca molar ratio in coral plotted against the borate/bicarbonate molar ratio in seawater. Theoretical curves for different partitioncoefficientKD values were calculated assumingT =28◦C; S=35‰;α=0.981; andδ11BSW=39.9‰. Regional SSTs was used to calculate theborate/bicarbonate ratios for each of the corals. The temperature strongly influences the partition coefficientKD. Poritesnear Marquesasshowed aKD of ∼0.0057. The seawater values used to calibrate the partition coefficient were [B]seawater=416 µM andT CO2=2 mM.
To test whether this linear temperature dependence ofKD applies (i) to ancient aragonite corals near Marquesasand (ii) to a wider temperature range that affects cold-wateraragonite corals such as deep sea coralLophelia pertusa,we extrapolated the regression towards SSTs of 28–29◦Cand temperatures of 5.5 to 11◦C (Fig. 6b). This low tem-perature range covers the North Atlantic intermediate wa-ters, which today have pH values approximately 7.95±0.05.For pH 7.95, theKD deduced from boron concentrations inLophelia pertusa(Douville et al., 2007) at local temperatureagrees with the established regression (Fig. 6b). The averageKD of ancient Marquesas corals was 0.0057 (Fig. 4b). Thisvalue fits the linear temperature dependence described abovewell with deviations of no more than±1◦C at 28◦C (Fig. 5).These reconstructed temperatures match the mean SST ob-served today near Marquesas. However, the lowest SSTs areestimated at the end of the Younger Dryas (YD) or during theglacial period, and higher SSTs are suggested by Fig. 5 forthe Marquesas corals that are about 9 and 14–15 kyr BP old,respectively.
Similar trends are observed for the oldAcropora nearTahiti. These corals have a meanKD of 0.0068 (SST# 27◦C)and a pronounced and unique SST decrease of 2.5◦C around11.5 kyr BP ago. Another example of the influence of theSST on the partition coefficientKD is from the seasonal datapublished at Fanning Island (Figs. 4a and 5). The seasonal
SSTs in the Fanning Islands vary by 3◦C. The highest tem-peratures are close to 28◦C and correspond to surface wa-ters of high pH recorded by the high density bands of themodernPorites(http://www.nodc.noaa.gov; Hemming et al.,1998; Honisch et al., 2004). This amplitude of seasonalSST changes matches the temperature (24.5◦C–27.5◦C) de-scribed in Fig. 5. Thus, at Fanning Islands the highest SSTof about 27.5◦C corresponds to a lowKD close to∼0.006(Fig. 5), and points close to a highKD of ∼0.0095 corre-sponding to 24.5◦C.
4.2 Variations of “δ11B-pH” as a function of time
In fossil Porites from Marquesas (Table 1), theδ11B valuesvary from 26.0 to 26.6‰ during the Holocene, drastically fallto 24.7±0.2‰ at the end of the Younger Dryas, and then riseagain to values between 25.6 and 26.4‰ during the begin-ning of the Younger Dryas and Bolling Allerød. The highestvalue (27.1‰) was observed during the last glacial period(20.7 kyr BP). During the Holocene, all of the deduced valuesfor the sea surface pH from Marquesas and Tahiti are simi-lar at 8.23±0.04 (Table 1, Fig. 7). These values are equiv-alent to modern pH (∼8.15) (Fig. 2a) when accounting forthe model prediction for anthropogenic acidification on theorder of 0.07 pH-units (Sabine et al., 2004). At the end of theYD at∼11.5 kyr BP, uniformly low pH values (∼7.99–8.06)
www.biogeosciences.net/7/2445/2010/ Biogeosciences, 7, 2445–2459, 2010

2454 E. Douville et al.: Abrupt sea surface pH change at the end of the Younger Dryas
Figure 6 - Douville et al. (2010 - submitted)
Fig. 6. Linear correlation between the mean regional SST and thepartition coefficientKD obtained from modernPoritessamples col-lected from various SST areas. This regression shows the influenceof the temperature onKD and is valid for various aragonite species.The tropical corals arePorites, Acropora, and the cold sea coral isLophelia pertusa. The expected area for cold sea corals (6–11◦C)was determined from pH 7.95 and from the high boron concentra-tions (78–100 ppm) measured in North AtlanticLophelia pertusasamples collected between 40◦ N and 70◦ N (Douville et al., 2007).
are observed close to both islands (Fig. 7). These low pHvalues are preceded by high pH values (8.14 to 8.30) dur-ing the Bolling Allerød and the last glacial/interglacial tran-sition (Fig. 7). From foraminifera in the “western” Pacific(ERDC-92), pH reconstruction using theδ11B method yields∼8.23, ∼8.13, and∼8.20 for the early, middle, and lateHolocene. During the YD, pH-values were∼8.16, and dur-ing the Bolling Allerød, they were between 8.1 and 8.2. Dur-ing the last glacial period, the highest pH values are esti-mated at∼8.3 (Palmer and Pearson, 2003). The central equa-torial Pacific experienced larger pH changes (0.2 pH-units)than the western Pacific (∼0.1 pH-units) during the transi-tion between the YD and the Holocene. This difference may
be attributed to the temporal resolution obtained using coralsand foraminifera. In corals, the sampling represents one ortwo years of growth, while the 1 cm-thick samples in thewestern Pacific deep-sea sediment core ERDC-92, due to thelow sedimentation rate of 1.4 cm/kyr (Palmer and Pearson,2003), include numerous foraminifera covering several hun-dred years. Bioturbation probably smoothed the amplitudeof the pH variations.
Variations of the sea surface pH are related to changes insurface waterpCO2, which is controlled by the CO2 up-take by surface water through ocean-atmosphere CO2 gasexchange. This gas exchange is modulated by the temper-ature, wind intensity, photosynthesis, lateral or vertical ad-vection and mixing of different water masses. During theYD, the SSTs were slightly lower than the modern SSTs by∼1◦C to∼3◦C in the eastern Pacific (Kienast et al., 2006;Koutavas et al., 2002). These values were either similar(Palmer and Pearson, 2003) or lower by 3◦C to 4.5◦C inthe western part of the Pacific (Beck et al., 1997; Correge etal., 2004; Gagan et al., 2004) and lower by 1.5◦C in the cen-tral part at Tahiti (Asami et al., 2009). If the SST dropped by∼3◦C (25◦C), the calculated pH would be about 8.07 ratherthan 8.04 because of the temperature dependence ofpKB(Dickson, 1990). As previously observed and especially forTahiti (Fig. 5), a change in the SST of±1–3◦C has a minimaleffect on the calculation of the pH.
This temperature effect cannot account for the calculatedchange of∼0.2 pH-units observed at the transition betweenthe YD and the Holocene. Estimates of the pH fromPoritescollected on the Flinders reef system in the southwestern Pa-cific reveal inter-decadal changes of∼0.3 pH-units over thepast 300 years (Pelejero et al., 2005). These changes wereattributed to local effects caused by the large lagoon plat-form structure of the Flinders reef, the waterpCO2 build-up through coral calcification and the renewal rate of lagoonwater by the South Equatorial current pulsed by the PDO(Pelejero et al., 2005). In the central equatorial Pacific, theimpact of these local effects cannot be completely excluded.However, the probability of detecting the extreme changesof 0.2 pH-units from corals collected in the two distant is-lands Tahiti and Marquesas is low given that the samplesonly provide information for a few years in the Holocene,which began around 11.5 kyr BP ago. A recent sea surfacepH-δ11B study at the Fiji Islands showed a slight pH changebecause of the PDO (Douville et al., 2009). In addition, allancient corals during the Holocene and until the last glacialperiod show relatively stable pH values close to 8.19–8.23,and 15 years of recent observations indicate a stable1pCO2in this area (see below, Fig. 8). These observations indicatemajor and rapid changes in the Pacific oceanic patterns dur-ing the transition between the YD and Holocene.
The estimated pH drop near Tahiti and Marquesas at theend of the YD could be accounted for by an intensifiedupwelling and westward advection of cooler eastern watermasses to the central Pacific. These eastern water masses
Biogeosciences, 7, 2445–2459, 2010 www.biogeosciences.net/7/2445/2010/

E. Douville et al.: Abrupt sea surface pH change at the end of the Younger Dryas 2455
Figure 7 - Douville et al. (2010 - submitted)
Fig. 7. Comparison of the sub-Equatorial Pacificδ11B-pH of marine biogenic carbonates over the last 21 000 cal yr. Sources are(a) thisstudy; (b) Gaillardet and Allegre, 1995; and(c) Palmer and Pearson, 2003. Filled black diamond: modern Moorea-TahitiPoritesvaluepublished by Gaillardet and Allegre (1995). The calculation parameters for the pH areα=0.981;δ11BSW=39.9‰;S=35‰; andT =27◦Cfor Tahiti (Moorea) andT =28◦C for the Marquesas Islands and for ERDC-92. Deduced1pCO2 values (Table 1, see text) and atmosphericpCO2 data (Monnin et al., 2001, 2004) are also plotted to illustrate the synchronization between the abrupt changes to the sea surface pHand1pCO2 in the central sub-Equatorial Pacific and the atmospheric CO2 increase of 15–20 ppmV at the end of the YD event.
are characterised today by low pH and also low SST, es-pecially for latitudes between 15◦ S and 20◦ S (Tahiti’s lat-itudes, Fig. 2b). Sustained La Nina-like conditions prevailedat the end of the YD. This interpretation is supported by thepresence of a strong east-west SST gradient in the equatorialPacific around 11 500 years ago (Koutavas et al., 2006). ThepH change from 8.04 to 8.23 at the YD-Holocene transitionin the Marquesas area indicates a rapid change to more fre-quent El Nino-like climatic conditions in the equatorial SouthPacific. Such changes are also observed in the east-west Pa-cific SST reconstruction (Koutavas et al., 2006).
4.3 Estimates of the atmosphere-ocean1pCO2
In the central sub-equatorial Pacific (Tahiti and Marque-sas), twelve Holocene values ofpCO2 have an averageof about ∼250±30 ppmV for a pH of 8.23±0.04 (Ta-ble 1). At the end of the YD, thepCO2 estimated for apH of 8.04 was∼440 ppmV (SSS: 36.2; SST: 28◦C) or∼450 ppmV (SSS: 34.8; SST: 25◦C) when considering anintensified westward advection of the eastern Pacific wa-ter masses of low salinity and temperature. According tothe past atmosphericpCO2 from EPICA Dome C ice coresfrom Antarctica (Monnin et al., 2001, 2004), the ocean-atmosphere1pCO2 differences were between−53 and+20 ppmV during the Holocene, between +21 and +91 ppmVbefore the YD with five pronounced positive values during
www.biogeosciences.net/7/2445/2010/ Biogeosciences, 7, 2445–2459, 2010
2456 E. Douville et al.: Abrupt sea surface pH change at the end of the Younger Dryas
Figure 8 - Douville et al. (2010 - submitted)
-200
-100
0
100
200
300
400
March -
May
1992
Setp. -
Oct. 19
92
Aug. -
Nov. 1
992
March -
May
1993
April -
June
1994
Aug. -
Nov. 1
994
April -
Aug 1
996
Aug. -
Dec. 1
996
Dec. 9
5 - Ju
ne 96
June
- Oct.
1996
Nov. 9
7 - A
pril 9
7May
- Oct.
97
Nov. 9
7 - M
ay 98
June
- Oct.
98
Oct. 98
- May
99
Oct. - D
ec 20
04
Δp
CO
2 (pp
mV)
Marquesas areas
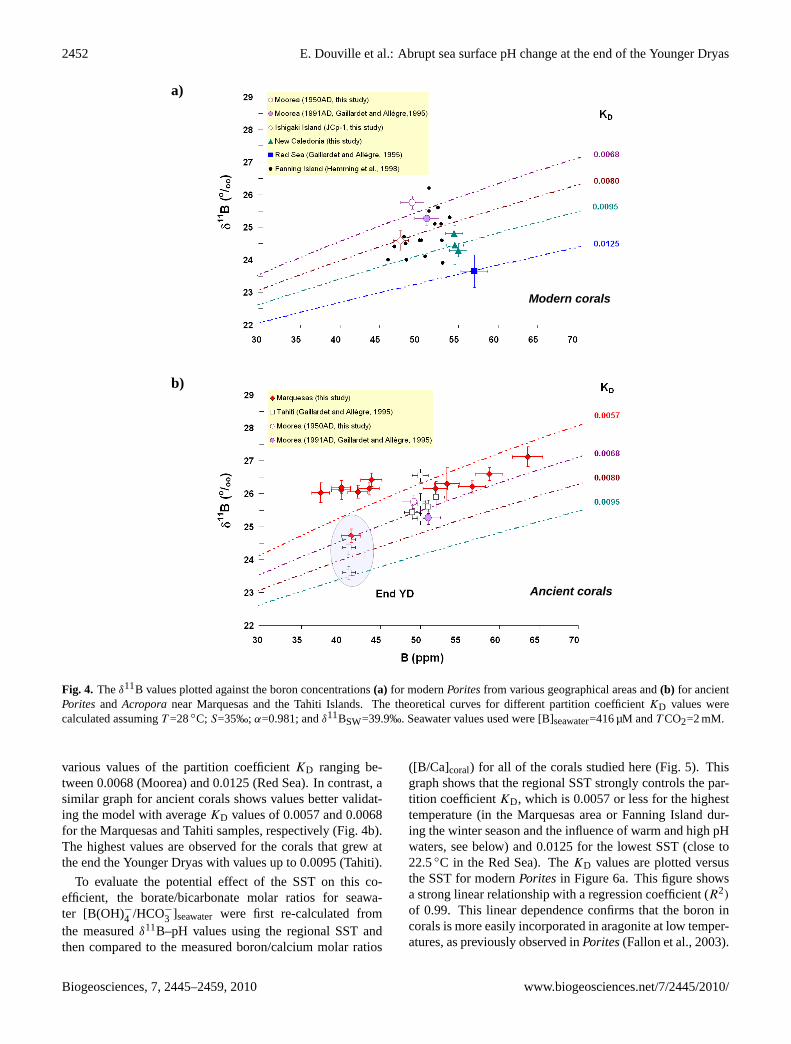
Fig. 8. The relative stability of modern1pCO2 values close toequilibrium in the Tahiti – Marquesas area between 1992 AD and2004 AD (Dandonneau, 1995; Feely et al., 1999, 2002; Goyet et al.,2009; Goyet and Peltzer, 1997).
the last deglaciation and +185±25 ppmV at the end of theYD (pCO2 atm=250 ppmV). From similar calculations, the1pCO2 (∼−15 ppmV) for the two modern corals (1950 AD,1991 AD) from Tahiti (Fig. 7) are close to equilibrium asrecently described by Takahashi et al. (2009) for this area.This trend is also in agreement with modern1pCO2 mea-surements (Fig. 8), which are either close to zero or slightlypositive (Dandonneau, 1995; Feely et al., 1999, 2002; Goyetet al., 2009; Goyet and Peltzer, 1997).
Since the early Holocene until today, surface waters in thecentral sub-equatorial Pacific have mainly served as a mod-erate sink or source of CO2 for the atmosphere in the vicin-ity of both Tahiti and the Marquesas Islands (Figs. 7 and 8).Our slight negative or positive1pCO2 values agree with pre-vious suggestions that more frequent El Nino-like oceano-graphic conditions occurred during the Holocene (Gaganet al., 2004; Koutavas et al., 2006). In contrast, the sub-equatorial sea surface waters in the central Pacific were amore pronounced source of CO2 to the atmosphere duringthe last glacial/interglacial transition. This source of CO2strongly intensified around 11.5 kyr BP at the end of the YDand quickly reversed during the transition between the YDand the Holocene.
Such feature is connected first to the rapid rise of the at-mosphericpCO2 of ∼15 ppmV (Fig. 7). This rise was ob-served quasi-synchronously in the EPICA Dome C ice core(EDC) (Monnin et al., 2001, 2004) by using refined chronol-ogy (Marchitto et al., 2007). Once the chronology of TLDand EDC ice cores is adjusted, this rise is also accompa-nied by a rapid increase of the atmosphericδ13CO2 val-ues. This connection was observed in the Taylor Dome icecore (TLD) in Antarctica (Smith et al., 1999) and more re-cently also in EPICA Dome C (Lourantou et al., 2010). Mar-chitto et al. (2007) showed that the14C ages of the interme-diate waters in the Eastern Pacific decreased rapidly during
YD-Holocene transition. These authors suggest that the ag-ing of the intermediate waters was caused by northward pen-etration of the Antarctic Intermediate Water (AAIW) thatwas greater than the penetration occurring today (Marchittoet al., 2007), and the AAIW had old14C ages and depletedδ13C values. The high1pCO2 at the end of the YD, thatwas deduced from theδ11B-pH indicator provides further ev-idence of the marked changes in the properties of the watermasses in the equatorial Pacific and demonstrates the impactof these changes on the atmospheric CO2 content.
5 Conclusions
The pH variations of surface waters in the equatorial Pacificwere determined from the isotopic composition of boron inthe ancient coralsPorites from reefs at Tahiti and Marque-sas by MC-ICPMS analyses with an analytical uncertainty of±0.025 pH-units. Ourδ11B, [B] and pH results obtained withthe empirical isotopic fractionation factor close to 0.981 formodern corals agree with previous observations from labora-tory calibration experiments. Modern aragonitePoritesweresampled from different geographical areas characterized bylocal SSTs ranging between 22.5◦C and 27◦C. The resultsreveal that the temperature strongly controls both the parti-tion constantKD and the incorporation of boron inPoritesbut also in various aragonite coral species. More boron is in-corporated in the aragonite skeleton at lower SST. Theδ11B-pH values were close to∼8.23 during the Holocene in thesurface waters of both Marquesas and the Tahiti Islands. Thisresult is in agreement with the modern or pre-anthropogenicvalues. Theδ11B-pH values ranged from 8.14 to 8.30 duringthe last deglaciation, and the highest value measured was at20.7 kyr BP.
An abrupt pH drop to∼8.04 was observed at the end ofthe Younger Dryas around 11.5 kyr BP. The deducedpCO2values were relatively equilibrated with the atmosphere dur-ing the Holocene and the last deglaciation, but during thisevent, thepCO2 increased to up to∼440 ppmV near bothTahiti and the Marquesas islands. The sea surface watersin the central equatorial Pacific (Tahiti, Marquesas) were amoderate sink or source of CO2 to the atmosphere duringthe Holocene as today. They were a more important sourceduring the last glacial/interglacial transition, and they were amajor source at the end of the YD with a1pCO2 of at least+185 ppmV. This last finding provides further evidence of themarked changes in the properties of the water masses in theequatorial Pacific (Marchitto et al., 2007) and demonstratesthe impact of these changes on the atmospheric CO2 content.These results highlight the great potential of the “δ11B–pH”methodology to precisely reconstruct past oceanic fluxes ofCO2 to the atmosphere from well-dated sea surface coralssuch asPoritesandAcropora.
Biogeosciences, 7, 2445–2459, 2010 www.biogeosciences.net/7/2445/2010/

E. Douville et al.: Abrupt sea surface pH change at the end of the Younger Dryas 2457
Acknowledgements.We are greatly indebted to Helene Isnard andFrederic Chartier of the CEA laboratory LANIE in Gif /Yvette(France) and Claudia Bouman of the Advanced Mass SpectrometryLaboratory of Thermo Fisher Scientific in Bremen for our fruitfuldiscussions and the use of their instruments during an early stageof the work presented here. We are also grateful to Norbert Frankand Eline Salle for providing accurate U-series dates for the coralsand to Michel Fontugne for constructive discussions. This workreceived the financial support of the national INSU LEFE/CYBERproject PHARE, the Comissariata l’Energie Atomique (CEA),the French Centre National de la Recherche Scientifique (CNRS)and the Institut de Recherche pour le developpement (IRD). Ourthanks are extended to John Butscher for his help collecting themodern coral samples in New Caledonia and to the ProvinceSud of New Caledonia for the permit to collect these corals. Weare grateful to David Varillon from IRD “IMAGO”, LEGOSlaboratory, IRD Noumea and the French Zoneco program forproviding the Thermosalinograph datasets monitored at Uitoe(New Caledonia). Gratitude is expressed to the captain, R. Pronerand the crew of the R/V IRD “Alis‘” for their efficiency duringthe cruises in Marquesas. The manuscript has greatly improvedduring the review process by constructive comments made by twoanonymous reviewers.
Edited by: S. W. A. Naqvi
The publication of this article is financed by CNRS-INSU.
References
Archer, D., Winguth, A., Lea, D., and Mahowald, N.: What causedthe Glacial/Interglacial atmosphericpCO2 cycles?, Rev. Geo-phys., 38(2), 159–189, 2000.
Asami, R., Felis, T., Deschamps, P., Hanawa, K., Iryu, Y., Bard, E.,Durand, M., and Murayama, M.: Evidence for tropical South Pa-cific climate change during the Younger Dryas and the Bølling-Allerød from geochemical records of fossil Tahiti corals, EarthPlanet. Sc. Lett., 288, 96–107, 2009.
Bard, E., Hamelin, B., Arnold, M., Montaggioni, L., Cabioch, G.,Faure, G., and Rougerie, F.: Deglacial sea-level record fromTahiti corals and the timing of global melt water discharge, Na-ture, 382, 241–244, 1996.
Beck, J. W., Recy, J., Taylor, F., Edwards, R. L., and Cabioch, G.:Abrupt changes in early Holocene tropical sea surface tempera-ture derived from coral records, Nature, 385, 705–707, 1997.
Boiseau, M.: Etude de la variabilite climatique liee a l’ENSOdans l’Ocean Pacifique Central Sud (Moorea)a partir de traceursgeochimiques contenus dans le squelette d’un Scleractiniairea zooxanthelles (Porites Lutea), pH’D thesis, University ofParis VII, Paris, 202 pp., 1998.
Cabioch, G., Montaggioni, L., Frank, N., Seard, C., Salle, E., Payri,C., Pelletier, B., and Paterne, M.: Successive reef depositionalevents along the Marquesas foreslopes (French Polynesia) since26 ka, Mar. Geol., 254, 18–34, 2008.
Caldeira, K. and Wickett, M. E.: Anthropogenic carbon and oceanpH, Nature, 425, 365, 2003.
Correge, T., Gagan, M. K., Beck, J. W., Burr, G. S., Cabioch, G.,and Le Cornec, F.: Interdecadal variation in the extent of SouthPacific tropical waters during the Younger Dryas event, Nature,428, 927–929, 2004.
Dandonneau, Y.: Sea-surface partial pressure of carbon dioxide inthe eastern equatorial Pacific (August 1991 to October 1992): Amultivariate analysis of physical and biological factors, Deep-Sea Res. Pt. II, 42(2–3), 349–364, 1995.
Delcroix, T., Henin, C., Porte, V., and Arkin, P.: Precipitation andsea surface salinity in the tropical Pacific Ocean, Deep-Sea Res.Pt. I, 73(7), 1123–1141, 1996.
Dickson, A. G., Sabine, C. L., and Christian, J. R.: Guide to bestpractices for ocean CO2 measurements, PICES Special Publica-tion 3, 191 pp., 2007.
Dickson, A. G.: Thermodynamic of the dissociation of boric acid insynthetic seawater from 273.15 to 318.15 K, Deep-Sea Res., 37,755–766, 1990.
Douville, E., Juillet-Leclerc, A., Cabioch, G., Louvat, P., Gaillardet,J., Gehlen, M., Bopp, L., and Paterne, M.: Boron isotopes inFiji corals and precise ocean acidification reconstruction, AGUFall Meeting, San Francisco, California, USA, 14–18 Decem-ber 2009, GC24A-04, 2009.
Douville, E., Copard, K., Colin, C., and Frank, N.: Major and traceelements in deep sea coralsLophelia pertusafrom the easternNorth Atlantic, ICP-9, Shanghai, China, 3–7 September 2007,P1-28, 45, 2007.
Fallon, S. J., McCulloch, M. T., and Alibert, C.: Examining wa-ter temperature proxies inPoritescorals from the Great BarrierReef: a cross-shelf comparison, Coral Reefs, 22, 389–404, 2003.
Feely, R. A., Boutin, J., Cosca, C. E., Dandonneau, Y., Etcheto, J.,Inoue, H. Y., Ishii, M., Le Quere, C., Mackey, D. J., McPhaden,M., Metzl, N., Poisson, A., and Wanninkhof, R.: Seasonal andinterannual variability of CO2 in the equatorial Pacific, Deep-Sea Res. Pt. II, 49, 2443–2449, 2002.
Feely, R. A., Wanninkhof, R., Takahashi, T., and Tans, P.: Influenceof El Nino on the equatorial Pacific contribution to atmosphericCO2 accumulation, Nature, 398, 597–601, 1999.
Foster, G. L.: Seawater pH,pCO2 and [CO2−3 ] variations in the
Caribbean Sea over the last 130 kyr: A boron isotope and B/Castudy of planktic foraminifera, Earth Planet. Sc. Lett., 271, 254–266, 2008.
Gagan, M. K., Hendy, E. J., Haberle, S. G., and Hantoro, W.S.: Post-glacial evolution of the Indo-Pacific Warm Pool andEl Nino-Southern oscillation, Quatern. Int., 118–119, 127–143,2004.
Gaillardet, J. and Allegre, C. J.: Boron isotopic compositions ofcorals: seawater or diagenesis record?, Earth Planet. Sc. Lett.,136, 665–676, 1995.
Gertman, I. and Brenner, S.: Analysis of water temperature vari-ability in the Gulf of Eilat, Report of Israel Oceanogr. Limnol.Res., 13 pp., 2004.
Goyet, C., Ito Goncalves, R., and Touratier, F.: Anthro-pogenic carbon distribution in the eastern South Pacific Ocean,
www.biogeosciences.net/7/2445/2010/ Biogeosciences, 7, 2445–2459, 2010

2458 E. Douville et al.: Abrupt sea surface pH change at the end of the Younger Dryas
Biogeosciences, 6, 149–156, doi:10.5194/bg-6-149-2009, 2009.Goyet, C. and Peltzer, E. T.: Variation of CO2 partial pressure in
surface seawater in the equatorial Pacific Ocean, Deep-Sea Res.Pt. I, 44(9–10), 1611–1625, 1997.
Heiss, G. A., Dullo, W. C., Joachimski, M. M., Reijmer, J. J. G., andSchumacher, H.: Increased Seasonality in the Gulf of Aqaba,Red Sea, Recorded in the Oxygen Isotope Record of aPoriteslutea Coral, Senck. Marit., 30, 17–26, 1999.
Hemming, N. G., Guilderson, T. P., and Fairbanks, R. G.: Seasonalvariations in the boron isotopic composition of coral: A produc-tivity signal?, Global Biogeochem. Cy., 12(4), 581–586, 1998.
Hemming, N. G. and Hanson, G. N.: Boron isotopic compositionand concentration in modern marine carbonates, Geochim. Cos-mochim. Ac., 56, 537–543, 1992.
Hemming, N. G., Reeder, R. J., and Hanson, G. N.: Mineral-fluidpartitioning and isotopic fractionation of boron in synthetic cal-cium carbonate, Geochim. Cosmochim. Ac., 59(2), 371–379,1995.
Henin, C.: Surveillance Thermohaline de la ZEE en 1997 et 1998,Zoneco Report, IRD, Noumea, New Caledonia, 16 pp., 1999.
Henin, C. and Cresswell, G. R.: Upwelling along the western barrierreef of New Caledonia, Mar. Freshwater Res., 56(7), 1005–1010,2005.
Honisch, B. and Hemming, N. G.: Surface ocean pH response tovariations inpCO2 through two full glacial cycles, Earth Planet.Sc. Lett., 236, 305–314, 2005.
Honisch, B., Hemming, N. G., Archer, D., Siddall, M., andMcManus, J. F.: Atmospheric Carbon Dioxide ConcentrationAcross the Mid-Pleistocene Transition, Science, 324, 1551–1554, 2009.
Honisch, B., Hemming, N. G., Grottoli, A. G., Amat, A., Hanson,G. N., and Bijma, J.: Assessing scleractinian corals as recodersfor paleo-pH: Empirical calibration and vital effects, Geochim.Cosmochim. Ac., 68(18), 3675–3685, 2004.
Honisch, B., Hemming, N. G., and Loose, B.: Comment on “Acritical evaluation of the boron isotope-pH proxy: The accuracyof ancient ocean pH estimates” by Pagani, M., Lemarchand, D.,Spivack, A., and Gaillardet, J., Geochim. Cosmochim. Ac., 71,1636-1641, 2007.
Inoue, H. Y., Ishii, M., Matsueda, H., Saito, S., Aoyama, M., Tok-ieda, T., Midorikawa, T., Nemoto, K., Kawano, T., Asanuma, I.,Ando, K., Yano, T., and Murata, A.: Distributions and variationsin the partial pressure of CO2 in surface waters (pCO2w) of thecentral and western equatorial Pacific during the 1997/1998 ElNino event, Mar. Chem., 76(1–2), 59–75, 2001.
Inoue, M., Nohara, M., Okai, T., Suzuki, A., and Kawahata,H.: Concentrations of Trace Elements in Carbonate ReferenceMaterials Coral JCp-1 and Giant Clam JCt-1 by InductivelyCoupled Plasma-Mass Spectrometry, Geostand. Geoanal. Res.,28(3), 411–416, 2004.
IPCC: Carbon dioxide Capture and Storage, IntergovernmentalPanel on Climate Change Special Report, edited by: Metz, B.,de Coninck, O. D. H., Loos, M., and Meyer, L., 2005.
Kakihana, H., Kotoka, M., Satoh, S., Nomura, M., and Okamoto,M.: Fundamental studies on the ion-exchange separation ofboron isotopes, B. Chem. Soc. Jpn., 50, 158–163, 1977.
Kienast, M., Kienast, S. S., Calvert, S. E., Eglinton, T. I., Mollen-hauer, G., Francois, R., and Mix, A. C.: Eastern Pacific coolingand Atlantic overturning circulation during the last deglaciation,
Nature, 443, 846–849, 2006.Klochko, K., Kaufman, A. J., Yao, W., Byrne, R. H., and Tossell, J.
A.: Experimental measurement of boron isotope fractionation inseawater, Earth Planet. Sc. Lett., 248, 276–285, 2006.
Kohfeld, K. E., Le Quere, C., Harrison, S. P., and Anderson, R.F.: Role of marine biology in glacial-interglacial CO2 cycles,Science, 38, 74–78, 2005.
Koutavas, A., deMenocal, P. B., Olive, G. C., and Lynch-Stieglitz,J.: Mid-Holocene El Nino-Southern Oscillation (ENSO) attenu-ation revealed by individual foraminifera in eastern tropical Pa-cific sediments, Geology, 34(12), 993–996, 2006.
Koutavas, A., Lynch-Stieglitz, J., Marchitto, T. M., and Sachs, J.P.: El Nino-like pattern in ice age tropical Pacific sea surfacetemperature, Science, 297, 226–230, 2002.
Le Quere, C., Rodenbeck, C., Buitenhuis, E. T., Langenfelds,R., Gomez, A., Labuschagne, C., Ramonet, M., Nakazawa, T.,Metzl, N., Gillett, N., and Heimann, M.: Saturation of the South-ern Ocean CO2 sink due to recent climate change, Science, 316,1735–1738, doi:10.1126/science.1136188, 2007.
Lecuyer, C., Grandjean, P., Reynard, B., Albarede, F., andTelouk, P.:11B/10B analysis of geological materials by ICP-MSPlasma 54: Application to the boron fractionation between bra-chiopod calcite and seawater, Chem. Geol., 186, 45–55, 2002.
Lefevre, N., Andrie, C., Dandonneau, Y., Reverdin, G., and Rodier,M.: pCO2, chemical properties, and estimated new production inthe equatorial Pacific in January–March 1991, J. Geophys. Res.,99, 12639–12654, 1994.
Liu, Y., Liu, W., Peng, Z., Xiao, Y., Wei, G., Sun, W., He, J., Liu,G., and Chou, C. L.: Instability of seawater pH in the SouthChina Sea during the mid-late Holocene: Evidence from boronisotopic composition of corals, Geochim. Cosmochim. Ac., 73,1264–1272, 2009.
Lourantou, A., Lavric, J. V., Kohler, P., Barnola, J. M., Paillard, D.,Michel, E., Raynaud, D., and Chappellaz, J.: Constraint of theCO2 rise by new atmospheric carbon isotopic measurements dur-ing the last deglaciation, Global Biogeochem. Cy., 24, GB2015,doi:10.1029/2009GB003545, 2010.
Louvat, P., Bouchez, J., and Paris, G.: MC-ICP-MS isotope mea-surements with direct injection nebulization (d-DIHEN): opti-mization and application to boron in seawater and carbonate sam-ples, Geostand. Geoanal. Res., in press, 2010.
Lueker, T. J., Dickson, A. G., and Keeling, C. D.: OceanpCO2calculated from dissolved inorganic carbon, alkalinity, and equa-tions for K1 andK2 : validation based on laboratory measure-ments of CO2 in gas and seawater at equilibrium, Mar. Chem.,70, 105–119, 2000.
Marchitto, T. M., Lehman, S. J., Ortiz, J. D., Fluckiger, J., andvanGeen, A.: Marine radiocarbon evidence for the mechanism ofdeglacial atmospheric CO2 rise, Science, 316, 1456–1459, 2007.
McGillicuddy, D. J., Anderson, L. A., Bates, N. R., Bibby, T., Bues-seler, K. O., Carlson, C. A., Davis, C. S., Ewart, C., Falkowski,P. G., Goldthwait, S. A., Hansell, D. A., Jenkins, W. J., Johnson,R., Kosnyrev, V. K., Ledwell, J. R., Li, Q. P., Siegel, D. A., andSteinberg, D. K.: Eddy/wind interactions stimulate extraordinarymid-ocean plankton blooms, Science, 316, 1021–1026, 2007.
Millero, F. J.: Thermodynamics of the carbon dioxide system in theoceans, Geochim. Cosmochim. Ac., 59, 661–677, 1995.
Monnin, E., Indermuhle, A., Dallenbach, A., Fluckiger, J., Stauffer,B., Stocker, T. F., Raynaud, D., and Barnola, J. M.: Atmospheric
Biogeosciences, 7, 2445–2459, 2010 www.biogeosciences.net/7/2445/2010/

E. Douville et al.: Abrupt sea surface pH change at the end of the Younger Dryas 2459
CO2 concentrations over the last glacial termination, Science,291, 112–114, 2001.
Monnin, E., Steig, E. J., Siegenthaler, U., Kawamura, K., Schwan-der, J., Stauffer, B., Stocker, T. F., Morse, D. L., Barnola, J.M., Bellier, B., Raynaud, D., and Fischer, H.: Evidence forsubstantial accumulation rate variability in Antarctica during theHolocene, through synchronization of CO2 in the Taylor Dome,Dome C and DML ice cores, Earth Planet. Sc. Lett., 224, 45–54,2004.
Orr, J. C., Fabry, V. J., Aumont, O., Bopp, L., Doney, S. C., Feely,R. A., Gnanadesikan, A., Gruber, N., Ishida, A., Joos, F., Key,R. M., Lindsay, K., Maier-Reimer, E., Matear, R., Monfray, P.,Mouchet, A., Najjar, R. G., Plattner, G. K., Rodgers, K. B.,Sabine, C. L., Sarmiento, J. L., Schlitzer, R., Slater, R. D., Tot-terdell, I. J., Weirig, M. F., Yamanaka, Y., and Yool, A.: Anthro-pogenic ocean acidification over the twenty-first century and itsimpact on calcifying organisms, Nature, 437, 681–686, 2005.
Pagani, M., Lemarchand, M. D., Spivack, A., and Gaillardet, J.:A critical evaluation of the boron isotope-pH proxy: The accu-racy of ancient ocean pH estimates, Geochim. Cosmochim. Ac.,69(4), 953–961, 2005.
Palmer, M. R. and Pearson, P. N.: A 23 000-Year record of surfacewater pH andpCO2 in the Western Equatorial Pacific Ocean,Science, 300, 480–482, 2003.
Paterne, M., Ayliffe, L. K., Arnorld, M., Cabioch, G., Tisnerat-Laborde, N., Hatte, C., Douville, E., and Bard, E.: Paired14Cand230Th dating of surface corals from the Marquesas and Van-uatu (Sub-Equatorail Pacific) in the 3000 to 15 000 cal yr interval,Radiocarbon, 46(2), 551–566, 2004.
Pelejero, C., Calco, E., McCullogh, M. T., Marshall, J. F., Gagan,M. K., Lough, J. M., and Opdyke, B. N.: Preindustrial to Moderninterdecadal variability in Coral Reef pH, Science, 309, 2204–2207, 2005.
Petit, J. R., Jouzel, J., Raynaud, D., Barkov, N. I., Barnola, J.-M.,Basile, I., Benders, M., Chappellaz, J., Davis, M., Delayque, G.,Delmotte, M., Kotlyakov, V. M., Legrand, M., Lipenkov, V. Y.,Lorius, C., Pepin, L., Ritz, C., Saltzman, E., and Stievenard, M.:Climate and atmospheric history of the past 420,000 years fromthe Vostok ice core, Antarctica, Nature, 399, 429–436, 1999.
Reynaud, S., Hemming, N. G., Juillet-Leclerc, A., and Gattuso, J.P.: Effect ofpCO2 and temperature on the boron isotopic com-position of the zooxanthellate coral Acropora sp., Coral Reefs,23, 539–546, 2004.
Sabine, C. L., Feely, R. A., Gruber, N., Key, R. M., Lee, K., Bullis-ter, J. L., Wanninkhof, R., Wong, C. S., Wallace, D. W. R.,Tilbrook, B., Millero, F. J., Peng, T. H., Kozyr, A., Ono, T., andRios, A. F.: The Oceanic Sink for Anthropogenic CO2, Science,305, 367–371, 2004.
Sanchez-Valle, C., Reynard, B., Daniel, I., Lecuyer, C., Martinez,I., and Chervin, J. C.: Boron isotopic fractionation betweenminerals and fluids: new insights from in situ high pressure-high-temperature vibrational spectroscopic data, Geochim. Cos-mochim. Ac., 69, 4301–4313, 2005.
Sanyal, A., Hemming, N. G., Broecker, W. S., Lea, D. W., Spero,H. J., and Hanson, G. N.: Oceanic pH control on the boron iso-topic composition of foraminifera: Evidence from culture exper-iments, Paleoceanography, 11(5), 513–517, 1996.
Sanyal, A., Nugent, M., Reeder, R. J., and Bijma, J.: Seawater pHcontrol on the boron isotopic composition of calcite: Evidencefrom inorganic calcite precipitation experiments, Geochim. Cos-mochim. Ac., 64(9), 1551–1555, 2000.
Sigman, D. M. and Boyle, E. A.: Glacial/interglacial variations inatmospheric carbon dioxide, Nature, 407, 859–869, 2000.
Smith, H. J., Fischer, H., Wahlen, M., Mastroianni, D., and Deck,B.: Dual modes of the carbon cycle since the Last Glacial Maxi-mum, Nature, 400, 248–250, 1999.
Spivack, A. J., You, C. F., and Smith, H. J.: Foraminiferal boron iso-tope ratios as a proxy for surface ocean pH over the past 21 Myr,Nature, 363, 149–151, 1993.
Taft, B. A. and Kessler, W. S.: Variations of zonal currents in thecentral tropical Pacific during 1970 to 1987: sea-level and dy-namic height measurements, J. Geophys. Res., 96, 12599–12618,1991.
Takahashi, T., Sutherland, S. C., Wanninkhof, R., Sweeney, C.,Feely, R. A., Chipman, D. W., Hales, B., Friederich, G., Chavez,F., Watson, A., Bakker, D. C. E., Schuster, U., Metzl, N.,Yoshikawa-Inoue, H., Ishii, M., Midorikawa, T., Nojiri, Y.,Sabine, C., Olafsson, J., Arnarson, T. S., Tilbrook, B., Johan-nessen, T., Olsen, A., Bellerby, R., Kortzinger, A., Steinhoff,T., Hoppema, M., de Baar, H. J. W., Wong, C. S., Delille, B.,and Bates, N. R.: Climatological mean and decadal changes insurface oceanpCO2, and net sea-air CO2 flux over the globaloceans, Deep-Sea Res. Pt. II, 56, 554–577, 2009.
Vengosh, A., Kolodny, Y., Starinsky, A., Chivas, A. R., and McCul-logh, M. T.: Coprecipitation and isotopic fractionation of boronin modern biogenic carbonates, Geochim. Cosmochim. Ac., 55,2901–2910, 1991.
Wei, G., McCulloch, M. T., Mortimer, G., Deng, W., and Xie, L.:Evidence for ocean acidification in the Great Barrier Reef ofAustralia, Geochim. Cosmochim. Ac., 73, 2332–2346, 2009.
Weiss, R. F.: Carbon dioxide in water and seawater: the solubilityof a non-ideal gas, Mar. Chem., 2, 203–215, 1974.
Xiao, Y. K., Shirodkar, P. V., Zhang, C. G., Wei, H. Z., Liu, W.G., and Zhou, W. J.: Isotopic fractionation of boron in growingcorals and its palaeoenvironmental implication, Curr. Sci. India,90(3), 414–420, 2006.
Yu, J., Elderfield, H., and Honisch B.: B/Ca in planktonicforaminifera as a proxy for surface seawater pH, Paleoceanog-raphy, 22, PA2202, doi:10.1029/2006PA001347, 2007.
Zeebe, R. E.: Stable boron isotope fractionation between dissolvedB(OH)3 and B(OH)−4 , Geochim. Cosmochim. Ac., 69(11),2753–2766, 2005.
www.biogeosciences.net/7/2445/2010/ Biogeosciences, 7, 2445–2459, 2010