abstract br errors their are - scholarsarchive@osu
TRANSCRIPT

ABSTRACT OF THE THESIS OF
MELVEN RAYMOND LINDBECK for the Ph. D, in Chemistry (Name) (Degree) (Major)
Date thesis is presented August 31, 1965
Title CONTROLLED POTENTIAL COULOMETRY IN NONAQUEOUS SOLVENTS -- APPLICATION TO THE KARL FISCHER DETERMINATION OF WATER AND TO AROMATIC NITRO COMPOUNDS IN DIMETHYLSULFOXIDE
Abstract approved
Aromatic Nitro Compounds. The n- values for the reduction of
the isomers of nitrophenol and nitrobenzoic acid and for several
other nitro compounds are determined in dimethylsulfoxide by con-
trolled potential coulometry. A procedure is given in which one
mole of nitro compound may be determined with errors of less than
one percent. The associated background currents are quantitatively
evaluated:, and electrolysis conditions for their minimization are
discussed. Controlled potential polarographic determinations are
given for these nitro compounds in dimethylsulfoxide, and reaction
schemes are proposed for the stepwise reductions.
Water. Microgram quantities of water are determined by
rapid, controlled potential coulometry.. Excess iodine is produced
and removed coulometrically in a Karl Fischer system. By means
of a special cell design, two µmoles of iodine in methanol may be
(Ma' br prof'essor)
±

reduced in 96 seconds. Ten to 74 µg. of water in methanol and 18
to 82 µg. of water in dimethylsulfoxide may be determined with an
absolute standard deviation of ± O. 2 and 0.3 µg. of water,
res pectively.

CONTROLLED POTENTIAL COULOMETRY IN NONAQUEOUS SOLVENTS APPLICATION TO THE KARL FISCHER DETERMINATION OF WATER AND TO AROMATIC
NITRO COMPOUNDS IN DIMETHYLSULFOXIDE
by
MELVEN RAYMOND LINDBECK
A THESIS
submitted to
OREGON STATE UNIVERSITY
in partial fulfillment of the requirements for the
degree of
DOCTOR OF PHILOSOPHY
June 1966

APPROVED:
Professor 'f Chemistry B.i
In Charge of Major
Head óf Department of Chemistry
Dean of Graduate School
Date thesis is presented August 31, 1965
Typed by Susan Carroll

ACKNOWLEDGMENT
The author sincerely wishes to express his gratitude to
Dr. Harry Freund for his guidance and encouragement.
The author is deeply indebted to his wife, Nancy, for her
patience and understanding.

TABLE OF CONTENTS
PART I. THE CONTROLLED POTENTIAL COULOMETRIC AND CONTROLLED POTENTIAL POLAROGRAPHIC
DETERMINATIONS OF SUBSTITUTED AROMATIC NITRO COMPOUNDS IN DIMETHYLSULFOXIDE
Chapter Page
I. INTRODUCTION 1
II. EXPERIMENTAL 5
Apparatus Reagents Procedure for Coulometry Procedure for Polarography
Controlled Potential
Controlled Potential
III. EXPERIMENTAL RESULTS AND DISCUSSION
Controlled Potential Polarography Controlled Potential Coulometry
5 10
12
16
18
18 30
IV. CONCLUSIONS 47
V. BIBLIOGRAPHY 49

PART II. MICROANALYSIS FOR WATER, USING RAPID CONTROLLED POTENTIAL COULOMETRY
IN A KARL FISCHER SYSTEM
Chapter Page
I. INTRODUCTION 55
II. EXPERIMENTAL 60
Apparatus 60 Preparation of Reagents 62
III. EXPERIMENTAL RESULTS AND DISCUSSION . . . 65
Iodine Coulometry in Methanol 65 Iodine Coulometry in Karl Fischer Reagents . . 73
IV. CONCLUSIONS 82
V. BIBLIOGRAPHY 84

LIST OF FIGURES
Figure Page
PART I
Controlled potential coulometry and polarography cell 6
1.
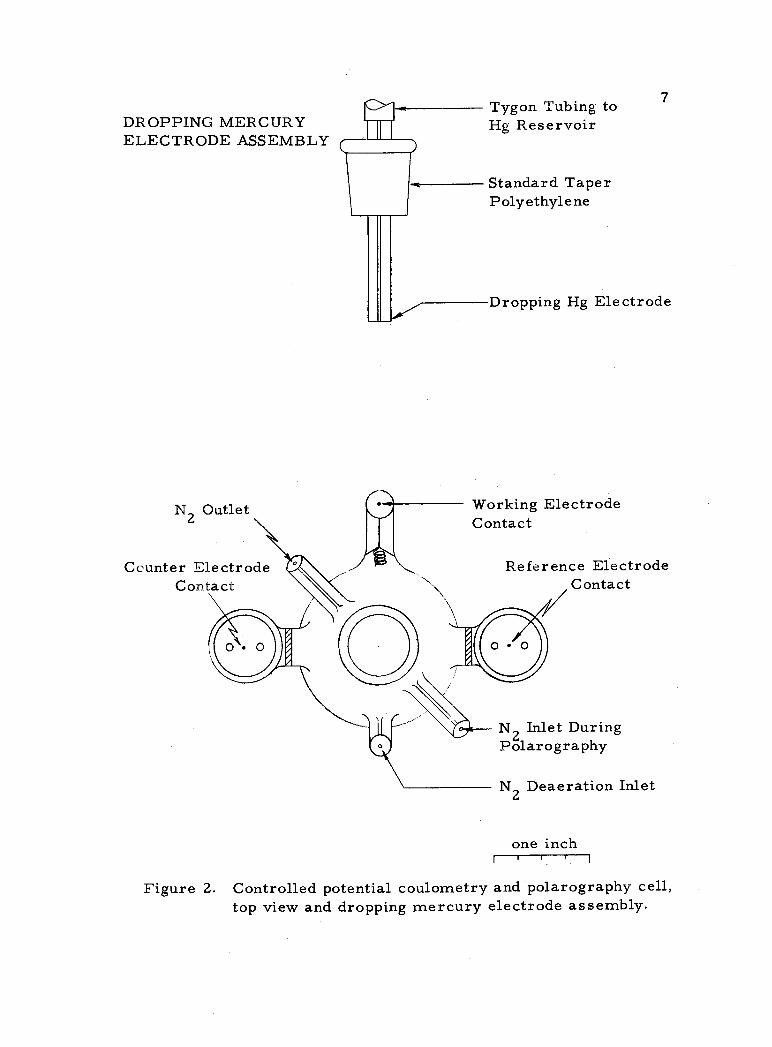
2. Controlled potential coulometry and polarography cell, top view and dropping mercury electrode assembly 7
3. Typical Chronocoulograms 14
4. Polarograms of dimethylsulfoxide solutions, which are 1. 0 mM in nitrophenol and 0. 5 M in lithium chloride 19
5. Polarograms of dimethylsulfoxide solutions, which are 1. 0 mM in nitrobenzoic acid and 0. 5 M in lithium chloride 20
6. Polarograms of dimethylsulfoxide solutions, which are 1. 0 mM in nitro compound and 0. 5 M in lithium chloride 21
7. Polarograms of dimethylsulfoxide solution, which are air saturated with oxygen 29
PART II
1. Electrolysis Cell 61
2. Variation of electrolysis current with applied Potential 66
3. Ratio of coulombs for iodine reduction to iodide oxidation as a function of the iodine reduction potential 68
4. Effect of nitrogen stirring on the time necessary to reduce 2 µmoles of iodine 71
5. Effect of the cell solution volume on the time necessary to reduce 2 µmoles of iodine 72

Figure Page
6. Standard addition determinations of water in O. 1 ml. solvent samples 80

LIST OF TABLES
Table Page
1. Summary of Polarographic Half -wave Potentials 22
2. Coulometric n- Values for the Reduction of the Isomers of Nitrophenol in Dimethylsulfoxide 31
3. Coulometric n- Values for the Reduction of the Isomers of Nitrobenzoic Acid in Dimethylsulfoxide . . . . . . . . . . . . . . . . . . . . . . . 32
4. Coulometric n- Values for the Reduction of Nitroterephthalic Acid and 3- Nitrophthalic Acid in Dimethylsulfoxide 33
5. Coulometric n- Values for the Reduction of p- Nitroanisole and the Sodium Salts of m- Nitrobenzoic Acid and p- Nitrophenol in Dimethylsulfoxide 34
6. Variation of the Continuous Faradiac Background Current with Stirring Rate 40
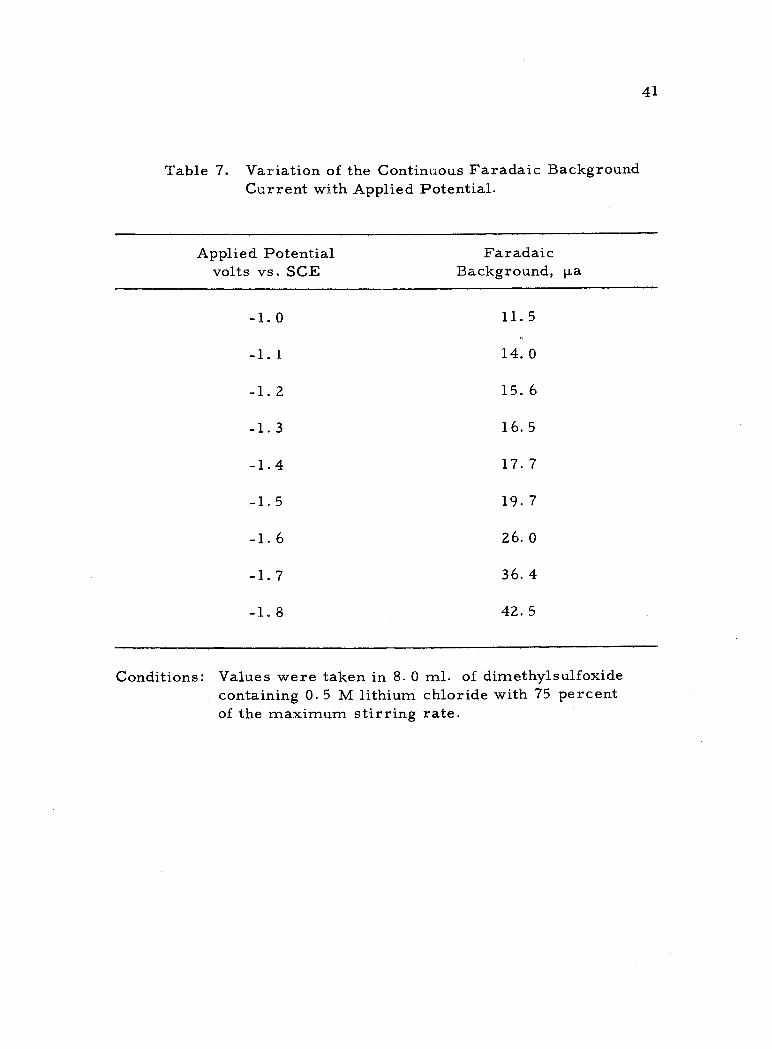
7. Variation of the Continuous Faradaic Background Current with Applied Potential 41
8. Effect of the Initial Cell Concentration on the Continuous Kinetic Background Current 43
9 Effect of the Initial Cell Concentration on the Induced Background 45

CONTROLLED POTENTIAL COULOMETRY IN NONAQUEOUS SOLVENTS -- APPLICATION TO THE KARL FISCHER
DETERMINATION OF WATER AND TO AROMATIC NITRO COMPOUNDS IN DIMETHYLSULFOXIDE
PART I. THE CONTROLLED POTENTIAL COULOMETRIC AND CONTROLLED POTENTIAL POLAROGRAPHIC
DETERMINATIONS OF SUBSTITUTED AROMATIC NITRO COMPOUNDS IN DIMETHYLSULFOXIDE
I. INTRODUCTION
Electroanalysis of organic compounds in organic nonaqueous
media has become more important with recent interest in electro-
chemical synthesis of organic compounds. There is a need for
methods of analysis which allow in situ determinations and thereby
offer a better understanding of the electrochemical processes that
take place.
Coulometry supported by polarography is an invaluable method
of electroanalysis in aqueous media. These methods, however, when
applied to organic nonaqueous systems, are beset with many addi-
tional complications due to the need for special cell design, high
electrical resistance of the solvent- electrolyte systems, the lack
of suitable reference electrodes, and high background currents.
Recent developments in electronic control systems have paved
the way for the development of new instrumentation for electroanaly-
sis. Instruments have been developed which advantageously use the

2
"three- electrode" system for controlled potential coulometry
(5, 6, 48) and controlled potential polarography (16, 28, 29, 46).
Although these instruments have a great potential for electroanalysis
in organic nonaqueous systems, there has been very little application
to this field as yet.
Coulometry in general has been reviewed (2, 10, 11), and the
theory of controlled potential coulometry has been discussed (14, 35,
43). The application of the latter method to analyses in organic
nonaqueous media consists of determinations in acetonitrile (7, 37),
dimethylformamide (37, 21), absolute methanol (15, 54), and
dimethylsulfoxide (9, 34).
Only a few applications of controlled potential coulometry have
been reported for the determination of aromatic nitro compounds.
Kruse (33) employed the method for the determination of aromatic
nitro compounds in methanol -water solvent. He reported that the
major difficulty was the high background currents obtained during
the determinations. Meites and Meites (39) reported a controlled
potential coulometric method for the determination of picric acid in
aqueous media. Ehlers and Sease (15) described a controlled poten-
tial coulometric determination of aromatic nitro compounds in
absolute methanol. They were, however, unable to determine ortho
and para nitrophenol in this solvent. Lindbeck and Young (34) have
used dimethylsulfoxide as a solvent for the controlled potential

3
coulometric determination of the nitric acid oxidation products of
humic acids.
Considerable attention has been given to secondary electrode
processes and background currents associated with controlled poten-
tial coulometry in aqueous media (4, 5, 17, 18, 19, 27, 37, 38, 40,
41, 49). As yet there has been no study reported for these back-
ground currents in organic nonaqueous media.
Organic polarography in general has been reviewed (51, 53),
and a review is given for organic nonaqueous polarography (23).
Tensammetry and a. c. polarography have been investigated in organ-
ic nonaqueous media (8). The polarography of aromatic nitro com-
pounds has been studied in dimethylformamide (26, 30), acetonitrile
(20, 25, 26), and methanesulfonic acid (52). Dimethylsulfoxide has
been employed as a solvent in polarography (12, 13, 24, 32, 34, 45,
47). However, the polarography of aromatic nitro compounds has
not been investigated in this solvent.
Controlled potential coulometry and controlled potential
polarography have not, as yet, been used for the electroanalysis
of aromatic nitro compounds in dimethylsulfoxide. This investigation
is concerned with the use of these methods for the determination of
the electrochemical processes involved in the reduction of several
substituted aromatic nitro compounds, including the isomers of
nitrophenol and nitrobenzoic acid at a mercury electrode, using

4
dimethylsulfoxide as a solvent.
The research includes the use of this information in the devel-
opment of a controlled potential coulometric procedure for the
quantitative determination of these nitro compounds and a quantitative
evaluation of the background currents associated with the determina-
tions.

II. EXPERIMENTAL
Apparatus
Cell Design
5
The cell used for controlled potential coulometry and controlled
potential polarography is shown schematically in Figures 1 and 2.
The working electrode compartment is constructed from a 50 ml.
glass stoppered Erleyneyer. The counter and reference electrode
side -cells are made from 14/20 standard taper ground joint units,
which are sealed at the bottom. The side -cells are connected to
the center compartment by fine porosity frits. Nitrogen deaeration
tubes are provided in each side -cell compartment for removal of
dissolved oxygen. The mercury level of the working electrode is
determined by the connection height of the capillary deaeration
side -arm; any excess mercury is removed by vacuum. The max-
imum stirring rate as referred to in this work is defined as the
rate at which any increase in the rate of the stirring motor
causes the magnetic stirring bar to fall out of synchronization
and stop. The maximum rate is dependent on the size of the mag-
netic stirring bar, cell solution volume, mercury volume, and the

N2 Outlet N_ Deaeration
Pt Counter Electrode
Magnetic Stirring Bar
6
N2 Inlet During Polar og raphy
Hg Reference Electrode
Plastic Vent Partition
MAGNETIC STIRRER
Hg Working Electrode
one inch
Figure 1. Controlled potential coulometry and polarography cell.
I i
N
DROPPING MERCURY ELECTRODE ASSEMBLY
N2 Outlet
Tygon Tubing to Hg Reservoir
Standard Taper Polyethylene
Dropping Hg Electrode
Working Electrode Contact
Counter Electrode Y sd \ Reference Electrode Contact Contact
N2 Inlet During Polarography
Deaeration Inlet
one inch
Figure 2. Controlled potential coulometry and polarography cell, top view and dropping mercury electrode assembly.
-.
I I
7
O. N.
N2

8
inside cell constrictions. For this particular cell and conditions, the
maximum stirring rate was obtained at approximately 50 percent of
the maximum dial adjustment on a Cenco magnetic stirrer (catalog
no. 18851). The stirring bar is one and 1/8 inches long and 5/16
inch in diameter. It was found that stirring bars of shorter length
fell out of synchronization at slower stirring rates.
Several different electrolysis cells were designed and con-
structed for this work. The first attempts were with relatively
large cells which held 75 to 150 ml. of solvent and 25 to 30 ml. of
mercury. This size of cell is commonly used in aqueous coulometry.
The continuous faradaic background currents from the nonaqueous
system were 0. 5 to one ma. This background is considerably higher
than would be expected in an aqueous system; however, this is not
uncommon for nonaqueous systems. The high background and the
time necessary for analysis of a nitro compound, approximately
45 minutes, made it necessary to design a smaller cell. The elec-
trolysis cell illustrated in Figures 1 and 2 is designed to handle
small solution volumes of eight to ten ml. with a large mercury
electrode area -to- solution- volume ratio for rapid electrolysis. The
background currents are typically from 20 to 40 µa. , depending on
the applied potential and stirring rate. The time necessary for
analysis of a nitro compound is approximately eight minutes.

9
Electrodes
The dropping mercury electrode assembly is shown in Figure
2. Typical capillary characteristics at open circuit in 0. 5 molar
lithium chloride solution in dimethylsulfoxide with 27.5 cm. mercury
are: m = 0. 820 mg. /sec. and t = 8. 35 sec.
The working electrode consists of 12.3 ml. of distilled mer-
cury.
The mercury pool reference electrode in DMSO - electrolyte
solvent (see Figure 1) was used for both controlled potential coulo-
metry and controlled potential polarography. The potential of the
mercury pool was measured against an aqueous saturated calomel
electrode by means of an agar -potassium chloride salt bridge. The
mercury pool reference was used during the determinations in order
to prevent water contamination of the DMSO -electrolyte solvent.
The increase in stability of mercury pool reference electrodes in
halide -nonaqueous solvents is discussed by Given (22).
The counter electrode is made of heavy gauge platinum foil.
The dimensions of the counter electrode are not important as long
as the area is sufficient to carry the current.

10
Instruments
The controlled potential coulometer used was constructed by
Caton (6) and is similar to that described by Scott and Peekema
(48). The instrument's electronic current integrator was continu-
ously monitored by a 50 -mv. recorder.
The controlled potential polarograph used is essentially the
same as that described by Enke and Baxter (16).
Reagents
Solvent -Electrolyte System
In the early stages of this work both dimethylformamide and
dimethylsulfoxide were considered for use as a solvent in the con-
trolled potential coulometric determination of substituted aromatic
nitro compounds. Preliminary determinations revealed that
dimethylformamide gave a larger continuous faradaic background
current than did dimethylsulfoxide when subjected to the same
coulometric conditions. It was noted that a gray film formed on
the surface of the mercury when dimethylformamide was allowed to
stand in contact with the mercury for several days. The mercury
was unchanged when allowed to remain in contact with dimethyl-
sulfoxide for several weeks. From these preliminary results and
the fact that dimethylsulfoxide is non -toxic, whereas

11
dimethylformamide is toxic, the former was chosen for this work.
The choice of lithium chloride as the supporting electrolyte
was based on its availability and the fact that it had been used suc-
cessfully for controlled potential coulometry in dimethylformamide
(21). Tetrabutylammonium iodide was tried and found to give higher
background currents than lithium chloride under the same coulo-
metric conditions in dimethylsulfoxide.
It was observed that 0.5 molar tetrabutylammonium iodide
solution in dimethylsulfoxide slowly turned yellow on standing. This
is probably caused by the formation of iodine, which possibly accounts
for the higher background currents.
The water content of the DMSO- electrolyte solvent was deter-
mined for each quantity prepared and several times during its usage.
The water content was found to vary between 0. 02 and 0. 04 percent.
The determinations were made by the controlled potential coulo-
metric method described in Part II of this thesis.
Chemicals
Lithium chloride, Baker and Adams, reagent grade.
Dimethylsulfoxide, Crown Zellerbach Chemical Products
Division, spectro grade 40823.
Nitrogen, Matheson Co. , Inc. , prepurified; the nitrogen was
passed through anhydrous magnesium perchlorate drying trains

12
before entering the electrolysis cell.
o- Nitrophenol, p- nitrophenol, and p- nitrobenzoic acid,
Matheson Coleman and Bell Division, The Matheson Co. , Inc. , one
degree melting point range.
o- Nitrobenzoic acid, m- nitrophenol, m- nitrobenzoic acid,
p- nitroanisole, p- nitrobenzaldehyde, 3- nitrophthalic acid, and
nitroterephthalic acid, Eastman Kodak Co. , white label; where
necessary these compounds were recrystallized from ethanol -
water mixtures until the nitro compounds gave approximately one
degree melting point range.
m- Nitrobenzoic acid sodium salt and p- nitrophenol sodium
salt, Eastman Kodak Co. , white label, used without further
purification.
Procedure for Controlled Potential Coulometry
At the beginning of a series of determinations, the counter and
reference electrode side -cells of the electrolysis cell, Figures 1
and 2, were charged with fresh O. 5 molar lithium chloride solution
in dimethylsulfoxide (DMSO- electrolyte solvent). The solution level
of the side -cells was maintained just above the level of the solution
in the working compartment. Both side -cells were deaerated for
ten minutes with nitrogen to remove the dissolved oxygen. Eight ml.
of DMSO- electrolyte solvent was added to the working electrode

13
compartment. The magnetic stirrer was activated and the solution
deaerated with nitrogen for five minutes. It was found by coulo-
metric reduction of residual oxygen that the oxygen could be removed
in less than two minutes. This fast deaeration was probably due to
the added mixing of the nitrogen and solvent by the stirring. The
faradaic reducible impurities in the 8. 0 ml. of DMSO- electrolyte
solvent were determined coulometrically. The controlled potential
coulometric reduction was made at the same applied potential as
that required for the nitro compound which was to be determined.
An example of a chronocoulogram obtained from the recorder read-
out of the instrument integrated current is given in Figure 3,
curve 5. The extrapolation back to zero time gives the quantity of
electricity due to the solvent impurities that are reducible at this
applied potential. The DMSO -electrolyte solvent was removed from
the electrolysis cell by means of a vacuum liquid trap which was
attached to the nitrogen deaeration capillary side -arm. This
capillary is attached at the bottom of the cell such that the solution
was removed, leaving the mercury electrode in the cell. An 8. 0
ml. DMSO- electrolyte solution which contained 1.00 mole of the
nitro compound was then added to the working compartment, and
the solution was deaerated for five minutes. After deaeration, the
nitro compound was determined coulometrically at the same applied
potential as the solvent impurities. Examples of chronocoulograms

0. 6
0. 5
0. 2
0. 1
1 o- Nitrophenol 2 p- Nitrobenzaldehyde 3 p- Nitroanisole 4 p- Nitrobenzoic Acid 5 Solvent System
5
8 10
TIME, minutes
12 14
Figure 3. Typical Chronocoulograms.
16
Conditions: The results represent the determination of 1. 00 mole of the nitro compound in 8. 0 ml. of dimethylsulfoxide containing 0. 5M lithium chloride at an applied potential of -1. 6 volts vs. SCE.
------ - - - - -- - -- --
0.4 -
O
ó 0 3

15
obtained for the reduction of some of the nitro compounds are given
in Figure 3. The quantity of electricity given by the reduction of
the nitro compound was determined by extrapolating back to zero
time and subtracting from this value the value found for the im-
purities in 8. 0 ml. of DMSO -electrolyte solution.
The above demonstrates the procedure that would be necessary
for an unknown nitro compound in dimethylsulfoxide at a low con-
centration such that an 8. 0 ml. sample would be necessary for
determination. For the n -value determinations, however, the pro-
cedure employs pre -electrolysis. This eliminated the necessity of
correcting for the quantity of electricity due to the solvent impurities.
After deaeration of the 8. 0 ml. of DMSO -electrolyte solvent, it
was pre -electrolyzed at the applied potential required for deter-
mination of the nitro compound until a continuous faradaic back-
ground current was attained. This continuous faradaic current
corresponds to the final slope of curve 5 in Figure 3. After the pre -
electrolysis, a 0.100 ml. sample of DMSO -electrolyte solvent con-
taining 1.00 µmole of the nitro compound was added by syringe.
This was achieved by placing the needle of the syringe through one
of the nitrogen outlet capillaries. One minute was allowed for
nitrogen deaeration, and then the nitro compound was determined
at the same applied potential as the pre -electrolysis. The quantity
of electricity necessary for the reduction of the nitro compound was

16
obtained from the resulting chronocoulogram by extrapolation to
zero time. The DMSO -electrolyte solvent containing the reduced
nitro compound was then removed by vacuum and the cell rinsed
with two 10 ml. volumes of fresh solvent by addition and removal.
The mercury was changed only occasionally when the cell had re-
mained unused for several weeks.
Procedure for Controlled Potential Polarography
The polarographic determinations were made in the same cell,
Figures 1 and 2, used for the controlled potential coulometric
determinations. The only changes were that the magnetic stirring
bar was removed and the dropping mercury electrode assembly was
placed in the top of the cell. The side -cells were filled to just
above the frits with DMSO- electrolyte solvent, and deaerated with
nitrogen for ten minutes to remove the oxygen. The 12. 3 ml. of
mercury comprising the coulometric working electrode was left in
the cell so that the sample solution could be removed by vacuum
through the nitrogen deaeration capillary side -arm after completion
of the determination. Approximately ten ml. of the sample solution
was added to the center compartment of the cell from a ten ml.
syringe by placing the needle through one of the nitrogen outlets.
The sample solution was deaerated for 15 minutes with nitrogen
which had previously passed through DMSO -electrolyte solvent.

17
During the determination, the nitrogen stream was passed over the
sample by means of the upper capillary nitrogen inlet. The height
of the mercury surface in the reservoir was adjusted to exactly
27. 5 cm. above the tip of the dropping mercury electrode and main-
tained at this height for all determinations. After completion of the
determination, the sample solution was removed by vacuum, and the
cell was rinsed with two consecutive ten ml. portions of DMSO-
electrolyte solvent. These rinse additions were also made with a
ten ml. syringe.

18
III. EXPERIMENTAL RESULTS AND DISCUSSION
Controlled Potential Polarography
The results from the controlled potential polarographic deter-
minations of several substituted aromatic nitro compounds in
dimethylsulfoxide are shown in Figures 4 -6, and the half -wave
potentials are summarized in Table 1. The polarograms are deter-
mined from millimolar solutions of the nitro compounds. The sup-
porting electrolyte consisted of 0.5 molar lithium chloride. The
polarograms are taken as the envelope of the maximum current. All
half -wave potentials are versus a saturated calomel electrode. A
plot of the residual current given by the DMSO- electrolyte solvent
only is shown in Figure 5, curve 5. The overall n- values are taken
from the controlled potential coulometric results.
On the basis of the experimentally determined n- values, along
with existing information given for the electrochemical reduction of
nitrobenzene in other media, the following electrochemical steps are
proposed for the polarographic reduction of each nitro compound in
dimethyls ulf oxide.
The first one -electron electrochemical reduction for nitro-
benzene and substituted nitrobenzene has been studied in
acetonitrile and dimethylformamide (20, 30, 31, 36, 44).
It has been shown that this reduction is reversible and is due to the

CURRENT,
14. 0
12. 0
1 o- Nitrophenol 2 m- Nitrophenol 3 p- Nitrophenol 4 p- Nitrophenol Sodium Salt
6. 0
4. 0
2. 0
-0.6 -0.8 -1.0 -1.2 -1.4 -1.6 -1.8 -2.0 APPLIED POTENTIAL, volts vs. SCE
Figure 4. Polarograms of dimethylsulfoxide solutions, which are 1. 0 mM in nitrophenol and 0. 5 M in lithium chloride.
I I I
.o
p,10.0
0
E
N z
á x
8. 0
O
4

7. 0
m
rii.; 6.0 cd 0
5.0 .,
H 4. 0 z w P4 c4 3. 0
U 2. 0
1.0
1 o- Nitrobenzoic Acid 2 m- Nitrobenzoic Acid 3 p- Nitrobenzoic Acid 4 m- Nitrobenzoic Acid
Sodium Salt 5 Residual
-0.6 -0.8 -1.0 -1.2 -1.4 -1.6 -1.8 -2.0 APPLIED POTENTIAL, volts vs. SCE
Figure 5. Polarograms of dimethylsulfoxide solutions, which are 1. 0 mM in nitrobenzoic acid and 0. 5 M in lithium chloride.
5 t i I 1

7. 0
6. 0
° 5.0 0
E 4. 0
E-7
3.0
2. 0
1.0
1 p- Nitroanisole 2 3- Nitrophthalic Acid 3 Nitroterephthalic Acid 4 p- Nitrobenzaldeh de
-0.6 -0.8 -1.0 -1.2 -1.4 _1.6 -1.8 -2.0 APPLIED POTENTIAL, volts vs. SCE
Figure 6. Polarograms of dimethylsulfoxide solutions, which are 1. 0 mM in nitro compound and 0. 5 M in lithium chloride.
n.
as
U
-
2
3

22
Table 1. Summary of Polarographic Half -wave Potentials
Nitro Compounds
-Ei vs. SCE i 1st. 2nd. 3rd.
o- Nitrophenol 0. 785 1. 223 1. 502
m- Nitrophenol 0. 943 1. 146 1. 405
p- Nitrophenol
p- Nitrophenol
1. 025 1. 485
Sodium Salt 1. 500
p- Nitroanisole
o- Nitrobenzoic
1. 035 1. 345
Acid
p- Nitrobenzoic
0. 678 1. 055
Acid
m- Nitrobenzoic
0. 634 0. 908 1. 18
Acid
m- Nitrobenzoic
0. 697 0. 942 1. 246
Acid Sodium Salt 0. 955 1. 247
p-Nitrobenzaldehyde 0.680 0.931

23
formation of an anion radical. It is assumed here that the same
process takes place in dimethylsulfoxide.
The polarographic results for the p- nitrophenol sodium salt
and the isomers of nitrophenol are shown in Figure 4.
m- Nitrophenol, curve 2, gives an overall four -electron reduction.
The first wave at an E of -0. 943 volt is due to a one -electron z
reduction of m- nitrophenol to the corresponding anion radical. The
second wave at an E1 of -1.146 volts is due to a one -electron z
reduction of the anion radical to m- nitrosophenol. The third wave
at an E1 of -1.405 is due to a two- electron reduction of z
m-nitrosophenol to m-hydroxylaminophenol.
OH
OH
1=- OH OH
o- Nitrophenol, curve 1, gives an overall six -electron reduc-
tion. The first wave at an E1 of -0. 785 is due to a one -electron
02 + e + 2H+
N=0 + 2e + 2H+
OH
OH
(1)
N=0 + HO (2)
NHOH (3)
2
reduction of o- nitrophenol to the corresponding anion radical. The
second wave at an E1 of -1.223 is due to a three - electron reduction z
of the anion radical to o- hydroxylaminophenol. The third wave at
02 Q NO2 + e

24
an E1 of -1. 502 volts is due to a two- electron reduction of z
o- benzoquinoneimine to o- aminophenol. The o- benzoquinoneimine
is formed by a chemical reaction involving the dehydration of
o- hydroxylaminophenol.
-NHOH
OH
NH + 2e + 2H+
O
-H2O (4)
(5)
A chemical reaction which takes place between two electron transfer
reactions is referred to as the ECE mechanism (50) and has been
established for the reduction of p- nitrosophenol in an aqueous
system (1, 42).
p- Nitrophenol, curve 3, also gives an overall six -electron
reduction. The first wave at an E1 of -1. 025 volts is due to a one- z
electron reduction to the p- nitrophenol anion radical. The second
wave at an E1 of -1. 485 volts is due to a five -electron reduction to z
p- aminophenol. This is probably due, as with o- nitrophenol, to the
chemical reaction which produces p- benzoquinoneimine, which in
turn gives a two -electron reduction to p- aminophenol.
HO \ / NHOH NH (6)
i (\ -NH
iNH2 OH
-H20

O NH + 2e + 2H > HO
25
The p- nitrophenol sodium salt gives an overall six -electron reduc-
tion. The polarographic curve 4 shows only one wave at an E1 of
-1. 500 volts. The reduction mechanism is probably the same as
that proposed for p- nitrophenol, equations 6 and 7.
The polarographic results for the m- nitrobenzoic acid sodium
salt and the isomers of nitrobenzoic acid are shown in Figure 5.
These compounds all yield an overall four -electron reduction.
p- Nitrobenzoic acid, curve 3, gives a wave at an E1 of -0. 634 z
volt which is due to a one -electron reduction to the anion radical.
The second wave at an E1- of -0. 908 volt is due to a one - electron 2
reduction of the anion radical to p- nitrosobenzoic acid. The third
wave at an E1 of -1.18 volts is due to a two- electron reduction of z
p- nitrosobenzoic acid to p- hydroxylaminobenzoic acid.
m- Nitrobenzoic acid, curve 2, follows the same stepwise process,
producing the same corresponding reduction products as
p- nitrobenzoic acid. The first, second, and third waves are shown
at E1 values of -0. 697, -0. 942, and -1. 246 volts respectively. i The polarographic reduction of p- nitrobenzoic acid and of
m- nitrobenzoic acid probably follow the same stepwise reduction
as shown in equations 1, 2, and 3 for m- nitrophenol.
H2 (7)

26
o- Nitrobenzoic acid, curve 1, gives a one -electron reduction
wave at an El of -0. 678 volt, which is due to the formation of the z
corresponding anion radical. The second wave at an E1 of -1. 055 z
volts is due to a three -electron reduction of the anion radical to
o- hydroxylaminobenzoic acid.
The m- nitrobenzoic acid sodium salt, curve 4, produces a
wave at an E1 of -0. 955 volt which is due to a one -electron reduction z
to yield the anion radical. The second wave at an E1 of -1. 247 volts i is due to a three -electron reduction of the anion radical to the cor-
responding hydroxylamine benzoic acid sodium salt.
The polarographic results for 3- nitro -and terephthalic
acids are shown in Figure 6, curves 2 and 3. Both acids give an
overall four -electron reduction. The polarograms show what appear
to be two 2- electron reduction waves for each compound, with
maxima at the beginning of the second waves. It appears that the first
one -electron reduction, which is given for the monoacids, coincides
with the one -electron reduction to the corresponding nitrosophthalic
acid. The final reduction product, as in the case of the monoacids,
is the corresponding hydroxylaminophthalic acid. The diffusion
coefficients of the diacids are probably smaller, which accounts for
the smaller diffusion currents given by the diacids compared to the
diffusion currents given by the monoacids.
p- Nitroanisole yields an overall four -electron reduction.

27
The polarographic results are shown by curve 1 in Figure 6. The first
wave at an E1 of -1. 035 is due to a one -electron reduction to the anion ï
radical. The second wave at an E1 of -1. 345 is due to a three-
electron reduction of the anion radical to p- hydroxylaminoanisole.
p- Nitroanisole gives a relatively higher diffusion current compared
to those produced by the other nitro compounds.
The polarographic results shown by the nitrophenols, nitro
benzoic acids, nitrophthalic acids, and p- nitroanisole indicate that
for a substituted aromatic nitro compound to be reduced to the amine
in dimethylsulfoxide, the corresponding hydroxylamine compound
must be able to undergo a chemical reaction to produce a quinonei-
mine as in equations 4, 5, 6 and 7.
p- Nitrobenzaldehyde appears to yield an overall two- electron
reduction. On this basis the polarographic results shown by curve
4 in Figure 6 are interpreted as giving a one -electron reduction at
an E1 of -0. 680, which is due to the formation of the i p- nitrobenzaldehyde anion radical. The second wave at an E1 of i -0. 931 is possibly caused by a one -electron reduction of the anion
radical to p- nitrosobenzaldehyde. The latter reduction was not
established by identification of the p- nitrosobenzaldehyde. Because
of the peculiar coulometric results and the lack of an explanation for
why the o- nitrosobenzaldehyde should not be polarographically
reduced to the corresponding hydroxylamino compound, it appears
-

28
that a dimer or a nonelectroactive species may possibly be formed
by a chemical reaction under these conditions.
Polarograms for the reduction of oxygen in air - saturated
dimethylsulfoxide are shown in Figure 7. It was found that when
0. 5 molar lithium chloride was used as the supporting electrolyte,
only one wave is produced at an Ei of -0. 585 volt. When 0. 5 molar i tetrabutylammonium iodide was used as the supporting electrolyte,
two waves are produced at Ei of -0. 510 and -0. 735 volt. Kolthoff i and Reddy (32) reported two drawn -out oxygen waves at El values
of -0. 72 and -1.13 volts versus a saturated calomel electrode ob-
tained in dimethylsulfoxide using 0. 1 molar sodium perchlorate as
the supporting electrolyte. These results indicate that the support-
ing electrolyte has a considerable effect on the half -wave potentials
given by the reduction of oxygen in dimethylsulfoxide.
It was found experimetally that the rate of scan, concentration
of the electroactive species, and the drop time are considerable
factors in obtaining well- defined polarograms in dimethylsulfoxide.
If the scan rate is greater than 0. 1 volt per minute, large maxima
are observed. Quite often these maxima appear on the rising por-
tion of the wave. Very erratic drop times and drop growths are
observed when the concentration of the nitro compound exceeds
5X10⁻³ molar. The drop time of 8. 35 seconds at open circuit, which
is somewhat longer than employed in aqueous systems, is necessary
i

7. 0
6. 0
1.0
Supporting Electrolyte 1 0. 51\"/1 Lithium Chloride 2 0. 5M Tetrabutylamrnoniurn Iodide
-0.6 -0.8 -1.0 -1.2 -1.4 -1.6 -1.8 -2.0 APPLIED POTENTIAL, volts vs. SCE
Figure 7. Polarograms of dimethylsulfoxide solutions, which are air saturated with oxygen.
ó 5. 0
U .r4
E 4.0 E-7
á 3.0
2. 0
z
30
because of the rate at which the drop time decreases during the
polargraphic determination. Erratic drop times are observed when
the drop time is less than about four seconds. An electrocapillary
curve for dimethylsulfoxide containing 0.1 molar sodium perchlorate
is given by Kolthoff and Reddy (32).
Controlled Potential Coulometry
n -Value Determinations
The results for the controlled potential coulometric determina-
tion of the n- values for the reduction of several substituted aromatic
nitro compounds are given in Tables 2 -5. The determinations were
made from the reduction of 1. 00 µmole of the nitro compound in
8. 0 ml. of dimethylsulfoxide containing 0. 5 molar lithium chloride.
The applied potentials employed for the reductions are given in
Tables 2 -5. Current -versus -potential curves were determined for
the reduction of several of the nitro compounds at the mercury pool
working electrode in the absence of stirring. The resulting curves
were found to agree reasonably well with the polarograms given by
the same nitro compounds. The choice of applied potential was
made on the basis of the polarogram produced by the nitro compound
(see Figures 4-6).
The n- values were calculated by the use of Faraday's law:

31
Table 2. Coulometric n- Values for the Reduction of the Isomers of Nitrophenol in Dimethylsulfoxide.
Nitrophenol Experimental Average Applied Potential
n -Value Deviation volts vs. SCE
o- Nitrophenol 5.92 5. 98 5.96 5. 98 5.96
-1.6
mean
m- Nitrophenol
6. 00 ±0.02
-1.6
5. 97
3. 99 4.08 3. 90 4.03 4.01 4.05
mean 4.01 *0.04
p- Nitrophenol 6. 15 -1.8 5. 98 6. 14 6. 01
5. 99 6. 06
mean 6. 06 ±0.06

32
Table 3. Coulometric n- Values for the Reduction of the Isomers of Nitrobenzoic Acid in Dimethylsulfoxide.
Nitrobenzoic Experimental Acid n -Value
Average Applied Potential Deviation volts vs. SCE
o- Nitrobenzoic Acid 3.94 4.06 3. 92 4.02 4.01
-1.4
mean 3. 99
±0.04 3. 99
m- Nitrobenzoic Acid 3.94 -1.4 4.03 3. 92 3.92 4.06 3. 96
mean 3.97 *0.05
p- Nitrobenzoic Acid 4. 19 -1.4 4.12 4. 15 4.03 4. 15 4.10
mean 4.12 t0.04

33
Table 4. Coulometric n- Values for the Reduction of Nitroterephthalic Acid and 3- Nitrophthalic Acid in Dimethylsulfoxide.
Nitrophthalic Experimental Average Applied Potential Acid n- Value Deviation volts vs. SCE
Nitroterephthalic Acid
3. 96 3. 85 4. 01 4. 01
-1. 4
3. 4. 01
99
mean 3. 97 ±0. 05
3- Nitrophthalic 3. 92 -1. 4 Acid 3. 96
4. 06 4. 06
mean
4.05 4. 03 4. 01 ±0. 05

34
Table 5. Coulometric n- Values for the Reduction of p- Nitroanisole and the Sodium Salts of m- Nitrobenzoic Acid and p- Nitrophenol in Dimethylsulfoxide.
Nitro Compound
Experimental n -Value
Average Deviation
Applied Potential volts vs. SCE
m- Nitrobenzoic Acid 4.05 -1.4 Sodium Salt 4.10
4. 19 4.10 3.99 4.07
mean 4.08 *0.05
p- Nitrophenol 6. 22 -1.8 Sodium Salt 6. 24
6. 01 6. 10 5.96 6. 01
mean 6. 09 ±0.10
p-Nitroanisole 4. 08 -1. 6
4.01 3. 96 3. 96 4. 03 4. 06
mean 4. 02 *0.04

35
Q =nFN (8)
where Q is the quantity of electricity (number of coulombs) con-
sumed in the reduction of the nitro compound, n is the number of
equivalents per mole for the reduction of the nitro compound (n-
value or number of electrons appearing in the halfreaction), F is
the Faraday of electricity (96493 coulombs per equivalent), and
N is the number of moles of the nitro compound.
The reductions of the isomers of nitrophenol, Table 2, do not
yield the same n- value, m- Nitrophenol gives an n- value of four,
which indicates that this compound is reduced to the
m- hydroxylaminophenol. m- nitrophenol produces a slight yellow -
brown color in the solvent and the reduction product is colorless.
Ortho and para nitrophenols give n- values of six, which indicate that
these compounds are reduced to the corresponding aminophenols.
This further two- electron reduction is probably due to a chemical
reaction which yields the corresponding benzoquinoneimine, which
in turn is reduced to the corresponding aminophenol. Ortho and para
nitrophenol are yellow in the solvent and the reduction products are
colorless.
Reduction of the isomers of nitrobenzoic acid, Table 3, give
n- values of four, indicating that these nitro compounds are reduced
to the corresponding hydroxlyaminobenzoic acids. The nitrobenzoic
acids are colorless both in the oxidized and reduced states in the

36
solvent.
The reduction of 3- nitrophthalic and nitroterephthalic acids,
Table 4, both give n- values of four, which indicate that these
compounds are reduced to the corresponding hydroxylamine corn -
pound. As with the nitrobenzoic acids, these compounds are also
colorless in both the oxidized and reduced form.
The n- values for the reduction of the sodium salts of
m- nitrobenzoic acid and p- nitrophenol, Table 5, are four and six,
respectively, which agree with the n- values given for the reduction
of the corresponding acids. The sodium salts were determined
primarily for the purpose of comparing the continuous kinetic
background currents with those produced by the acids. It was
found that the sodium salts also give approximately the same kinetic
background currents. This comparison made it possible to rule
out the proton donation from the acids as the cause of the kinetic
background currents.
The n -value for the reduction of p- nitroanisole, Table 5, is
four, which indicates that this compound is reduced to
p- hydroxylaminoanisole. p- Nitroanisole is colorless in the solvent,
turning slightly purple during reduction, and colorless after complete
reduction.
An attempt was made to determine the n -value for the reduction

37
of p- nitrobenzaldehyde, but this compound was found to yield results
which differed considerably from the other nitro compounds. An
example is shown in Figure 3 by chronocoulogram 2, which on
extrapolation to zero time appears to give an n -value of two. How-
ever, because of the large background, which very slowly decreases
with time, the quantitative determination is questionable. An attempt
to improve these results by a change in applied potential, addition of
benzoic acid as a proton donor, and concentration variations was
unsuccessful. p- Nitrobenzaldehyde is colorless in the DMSO-
electrolyte solvent, but as soon as the reduction is initiated, the
solution turns bright blue. The blue color is followed by inter-
mediate shades of blue - green. After approximately five minutes of
reduction, the solution is bright green; this color very slowly changes
to a light yellow after several hours of reduction.
The analytical significance of the results given in Tables 2 -5
is that integral values of four or six, depending on the nitro com-
pound being determined, can be used for n in equation 8. The
precision in the measurement would then apply to the determination
of the quantity of the nitro compound. This means that under these
conditions one µmole of the nitro compound can be determined with
an approximate precision of ± one percent.

38
Background
The background quantity of electricity consumed in a controlled
potential coulometric analysis may be defined as the difference be-
tween the theoretical and the actual quantity consumed. This differ-
ence is considered to arise from the passage of currents that can be
classified as charging, impurity faradaic, continuous faradaic,
kinetic, and induced. These phenomena are discussed in detail by
Meites and Moros (40). All five types of background quantities of
electricity are observed in the controlled potential coulometric re-
duction of substituted aromatic nitro compounds in DMSO -electrolyte
solvent.
The quantity of electricity related to the charging current is
that quantity required to charge the working electrode and the
electrical double layer at its surface. It is determined by the extra-
polation to zero time of a chronocoulogram of the DMSO -electrolyte
solvent taken after removal of the trace impurities by pre
electrolysis. For the cell and conditions used in this work, the
charging background is insignificant.
The impurity faradaic quantity of electricity is consumed by the
reduction of trace impurities. It is determined by the extrapolation to
zero time of a chronocoulogram of the DMSO- electrolyte solvent.
An example of this determination is given by chronocoulogram 5
-

39
in Figure 3. Eight ml. of DMSO- electrolyte solvent typically gave
impurity faradaic backgrounds of from O. 01 to O. 02 coulomb,
depending on the applied potential.
The continuous faradaic quantity of electricity is that quantity
continuously consumed by the reduction of lithium ions. The con-
tinuous current is determined from the slope of the plateau of a
chronocoulogram of the DMSO -electrolyte solvent (see Figure 3,
chronocoulogram 5). This background is dependent on the area of
the working electrode and the applied potential. The dependence on
the former is shown in Table 6. The larger increase in current at
the higher stirring rates is due to the larger mercury surface area
which is caused by the magnetic stirring bar spinning closer to the
bottom of the cell, spreading the mercury up the sides of the cell.
The dependence on applied potential is shown in Table 7.
The kinetic quantity of electricity is that quantity consumed by
reduction of an electroactive species which is produced by a slow
chemical reaction of the -reduced product with the solvent or some
constituent of the solvent. The kinetic quantity of electricity being
consumed is dependent on the concentration of the reduced product
and increases during the reduction. The continuous kinetic current,
after complete reduction of the nitro compound, is determined by
the increase in slope of the plateau of a chronocoulogram of the
nitro compound compared to a chronocoulogram of the

40
Table 6. Variation of the Continuous Faradaic Background Current with Stirring Rate.
Percent Maximum Stirring Rate
Faradaic Background, µa
0 2. 0
25 7.1
50 18. 8
75 42. 5
100 73. 0
Conditions: Values were taken in 8. 0 ml. of dimethylsulfoxide containing 0. 5 M lithium chloride at an applied potential of -1. 8 volts vs. SCE.
41
Table 7. Variation of the Continuous Faradaic Background Current with Applied Potential.
Applied Potential volts vs. SCE
Faradaic Background, µa
-1. 0 11.5
-1.1 14. 0
-1. 2 15. 6
-1. 3 16.5
-1.4 17.7
-1. 5 19. 7
-1. 6 26. 0
-1. 7 36. 4
-1.8 42. 5
Conditions: Values were taken in 8. 0 ml. of dimethylsulfoxide containing 0. 5 M lithium chloride with 75 percent of the maximum stirring rate.

42
DMSO -electrolyte solvent, all other parameters being the same.
It was found that the continuous kinetic background for the nitro
compounds is independent of the applied potential and stirring rate
changes between 50 and 75 percent of the maximum stirring rate.
The process that occurs probably involves the following steps:
O + ne
R + mS
R (1)
--> O' + mS' (2)
O' + me R (3)
Where (2) is the rate determining step, O is the nitro compound,
and R is the corresponding reduced compound. O' may or may not
be the original oxidized state, and S may be dimethylsulfoxide or
hydrogen ion.
The magnitude of the continuous kinetic current is different for
different substituted aromatic nitro compounds, and also varies
among different isomers. This variation and the increase in con-
tinuous kinetic current with increase in the cell concentration of
the reduced product is given in Table 8. The cell concentration of
the reduced product is assumed to correspond to the initial cell
concentration of the nitro compound. The ortho isomers of nitro -
phenol and nitrobenzoic acid give smaller continuous kinetic back-
ground currents compared to those given by the corresponding para and
meta nitro compounds. This may be caused by a steric hindrance
in the case of the ortho isomers, which causes a slower chemical
>
>

43
Table 8. Effect of the Initial Cell Concentration on the Continuous Kinetic Background Current.
Initial Cell Concentration Nitro 0. 125mM 0. 250mM 0. 375mM 0.500mM Compound Background Current, µa
o- Nitrophenol
m- Nitrophenol
p- Nitrophenol
p- Nitrophenol Sodium Salt
p- Nitroanisole
o- Nitrobenzoic Acid
p- Nitrobenzoic Acid
m- Nitrobenzoic Acid
m- Nitrobenzoic Acid Sodium Salt
Nitroterephthalic Acid
3- Nitrophthalic Acid
12 12 12 19
23 38 49 60
20 50 79 162
15 42 57 84
135 195 212 227
19 27 38 42
88 110 125 144
79 105 124 143
76 121 140 162
27 34 56 68
27 42 53 68

44
regeneration of the elctroactive species.
The induced quantity of electricity is that quantity consumed by
a secondary reduction which is induced by the reduction of the nitro
compound, and is dependent on the rate of the latter. It is deter-
mined by the increase in total quantity of electricity consumed over
the theoretical quantity required for reduction of the nitro compound
after the other background quantities of electricity have been
accounted for. The effect of the rate of reduction of different nitro
compounds on the induced background is given in Table 9. The
increase in rate of reduction is achieved by increase in initial cell
concentration, all other parameters being the same. Different
values of induced background are found for different nitro compounds
and, in the case of the isomers of nitrobenzoic acid and of nitro -
phenol, the ortho isomers give the smallest and the para isomers
give the largest. A smaller value than expected is given by
p- nitroanisole, which is probably due to cancellation by a kinetic
background. The most important observation, however, is that no
induced background is found at the lower rates of reduction.
The kinetic and induced backgrounds cannot be completely
corrected for by extrapolation of the chronocoulograms to zero
time, which gives an overcorrection in the case of the kinetic
background and an under correction in the case of the induced back-
ground. These errors were, however, decreased by careful choice

45
Table 9. Effect of the Initial Cell Concentration on the Induced Background.
Initial Cell Concentration* Nitro 0. 125mM 0. 250mM 0. 375mM 0. 500mM Compound Induced Background, coulomb
o- Nitrophenol
m- Nitrophenol
p- Nitrophenol
p- Nitrophenol Sodium Salt
p- Nitroanisole
o- Nitrobenzoic Acid
p- Nitrobenzoic Acid
m- Nitrobenzoic Acid
m- Nitrobenzoic Acid Sodium Salt
Nitroterephthalic Acid
3- Nitrophthalic Acid
0. 003 0. 014
0. 127
0. 017
0. 027
0. 266
0. 069
0. 139
0. 428
0.004
0.007
0.062
0. 007
0.019
0.007
0.023
0.024
0.054
0. 031
0.073
0.042
0.104
0. 024
0.062
0.135
0. 101
0. 019
0.134
0.116
0.205
0. 069
0.093
*Cell solution volumes are 8. 00 ml.

46
of electrolysis conditions. The electrolysis cell parameters were
adjusted such that the time necessary for complete reduction was
as short as possible. This shortens the extrapolation and thus
decreases the error due to the kinetic background. The initial
cell concentration of the nitro compound was kept low enough to
avoid any detectable induced background. The lower intial cell
concentration also decreases the error from kinetic background.

47
IV. CONCLUSIONS
It is possible to obtain well- defined controlled potential polar -
ograms of the isomers of nitrophenol and nitrobenzoic acid in
dimethylsulfoxide, provided that the scan rate is not greater than
0. 1 volt per minute, the concentration of the nitro compound is less
than 5X10 -3 molar, and the initial drop time is not less than eight
seconds.
One µmole of nitro compound can be determined by controlled
potential coulometry from cell concentrations of approximately 10-4
molar in nitro compound in dimethylsulfoxide solution, with errors
of less than ± 1 percent. The nitrobenzoic acids and m- nitrophenol
give a four - electron reduction, which indicates that these compounds
are reduced to the corresponding hydroxylaminobenzoic acids. Ortho
and para nitrophenol both give a six- electron reduction, which
indicates that the corresponding hydroxylaminophenol undergoes a
chemical reaction to give the corresponding benzoquinoneimine
which in turn is reduced to the corresponding aminophenol.
The nitrophenols and nitrobenzoic acids give both kinetic and
induced backgrounds when determined by controlled potential coulo-
metry. The ortho isomers give smaller backgrounds than do the
meta and para isomers. This may be caused by a steric hindrance
in the case of the ortho isomers. The backgrounds can be decreased

48
to insignificant values by proper choice of the electrolysis conditions,
of which the most important are a shorter electrolysis time and
lower initial cell concentrations.

49
V. BIBLIOGRAPHY
1. Alberts, Gene S. and Irving Shain. Electrochemical study of kinetics of a chemical reaction coupled between two charge transfer reactions. Potentiostatic reduction of p- nitrosophenol. Analytical Chemistry 35:1859 -1866. 1963.
2. Bard, Allen J. Electroanalysis and coulometric analysis. Analytical Chemistry 34:57R -64R. 1962; 36:70R -80R. 1964.
3. Bard, Allen J. and Jaspal S. Mayell. Secondary reactions in controlled potential coulometry. II. Secondary electrode reactions. Journal of Physical Chemistry 66:2173 -2179. 1962.
4. Bard, Allen J. and Emanuel Solon. Secondary reactions in controlled potential coulometry. H. Preceding and simul- taneous chemical reactions. Journal of Physical Chemistry 67:2326 -2330. 1963.
5. Booman, Glenn L. Instrument for controlled potential electrolysis and precision coulometric integration. Analytical Chemistry 29:213 -218. 1957.
6. Caton, Roy Dudley, Jr. Controlled potential coulometric and polarographic investigation of metallic ions in fused salts. Ph. D. thesis. Corvallis, Oregon State University, 1963. 129 numb. leaves.
7. Cokal, E. J. and E. M. Wise. Determination of sodium by controlled - potential coulometry. Analytical Chemistry 35:914 -915. 1963.
8. Cupta, S. L. , M. K. Chatterji and S. K. Sharma. Organic a. c. polarography and tensammetry in non -aqueous media. Journal of Electroanalytical Chemistry 7:81 -84. 1964.
9. Dapo, Roland F. and Charles K. Mann. Anodic oxidation of triethylamine. Analytical Chemistry 35:677 -680. 1963.
10. DeFord, Donald D. Electroanalysis and coulometric analysis. Analytical Chemistry 30:613 -619. 1958; 32:31R -37R. 1960.
11. Electroanalysis. Analytical Chemistry 28:660 -666. 1956.

50
12. Dehn, H. et al. Gaspolarographie. Monatshefte für Chemie 93:1348 -1352. 1962.
13. Dehn, H. , V. Gutmann und G. Schöber. Polarographische Untersuchungen in wasserfreiem Dimethylsuloxid. Monatshefte für Chemie 93:453 -454. 1962.
14. Delahay, Paul. New instrumental methods in electrochemistry. New York, Interscience, 1954. 437 p.
15. Ehlers, Vivian B. and John W. Sease. Constant - potential coulometric reduction of organic nitro and halogen compounds. Analytical Chemistry 31:16 -22. 1959.
16. Enke, C. G. and R. A. Baxter. A versatile and inexpensive controlled potential polarographic analyzer. Journal of Chemical Education 41 :202 -209. 1964.
17. Gelb, Robert I. and Louis Meites. Polarographic character- istics and controlled - potential electror eduction of a -furildioxime. -furildioxime. Journal of Physical Chemistry 68:2599 -2607. 1964.
18. Geske, David H. The electrooxidation of the tetraphenylborate ion; an example of a secondary chemical reaction following the primary electrode process. Journal of Physical Chemistry 63 :1062 -1070. 1959.
19. Geske, David H. and Allen J. Bard. Evaluation of the effect of secondary reactions in controlled potential coulometry. Journal of Physical Chemistry 63:1057 -1062. 1959.
20. Geske, David H. and August H. Maki. Electrochemical generation of free radicals and their study by electron spin resonance spectroscopy; the nitrobenzene anion radical. Journal of the American Chemical Society 82:2671 -2676. 1960.
21. Given P. H. and M. E. Peover. Investigation of carbonyl groups in solvent extracts of coals. Journal of the Chemical Society, 1960, p 394 -399.
22. . Polarography of iodide and chloride ions in dimethylformamide. Journal of the Chemical Society, 1959, p. 1602 -1607.

51
23. Gutmann V. and G. Schöber. Die Polarographie in nichtwässrigen Lösungen. Angewandte Chemie 70:98 -104. 1958.
24. . Polarographische Untersuchungen in wasserfreiem Dimethylsulfoxyd. Zeitschrift für Analytische Chemie 171 :339 -343. 1959.
25. Holleck, L. , R. Schindler and O. Lahr. Polarographische Unters uchungen meta - substituierter Nitrobenzolderivate in wasserfreiem Acetonitril. Die Naturwissenschaften 46: 625 -626. 1959.
26. Holleck, Ludwig und Dieter Becher. Untersuchungen aber den Einfluss der Leitsalzionen auf die Polarographische reduktion aromatischer Nitroverbindungen in Acetonitril und Dimethylformamid. Journal of Electroanalytical Chemistry 4:321 -331. 1962.
27. Karp, Stewart and Louis Meites. The voltammetric charac- teristics and mechanism of electrooxidation of hydrazine. Journal of the American Chemical Society 84:906 -912. 1962.
28. Kelley, M. T. , D. J. Fisher and H. C. Jones. Controlled potential Polarographic polarizing unit with electronic scan and linear residual current compensation. Analytical Chemistry 32:1262 -1265. 1960.
29. Kelley M. T. , H. C. Jones and D. J. Fisher. Controlled - potential and derivative polarograph. Analytical Chemistry 31:1475 -1485. 1959.
30. Kemula, Wiktor and Roman Sioda. Electrochemical generation and visible spectrum of nitrobenzene free radical anion in dimethylformamide. Nature 197:588-589. 1963.
31. Kitagawa, Toyokichi, Thomas P. Layloff and Ralph N. Adams. Voltammetry and electron paramagnetic resonance spectra of halonitrobenzene anion radicals. Analytical Chemistry 35:1086 -1087. 1963.
32. Koltoff, I. M. and T. B. Reddy. Polarography and voltam- metry in dimethylsulfoxide. Journal of the Electrochemical Society. 108:980 -985. 1961.
-

52
33. Kruse, Jurgen M. Determination of organic nitro compounds by controlled - potential coulometry. Analytical Chemistry 31:1854 -1857. 1959.
34. Lindbeck, M. R. and J. L. Young. Polarography and coulo- metry in dimethylsulfoxide of nitric acid oxidation products from soil humic acid. Soil Science (Accepted for publication June 29, 1965).
35. Lingane, James J. Electroanalytical chemistry. 2d ed. New York, Interscience, 1958. 669 p.
36, Maki, August H. and David H. Geske. Electron spin resonance and polarographic investigation of substituted nitrobenzene negative ions. Journal of the American Chemical Society 83:1852 -1860. 1961.
37. Mayell, Jaspal S. and Allen J. Bard. The electroreduction of quaternary ammonium compounds. Journal of the American Chemical Society 85:421 -425. 1963.
38. Meites, Louis. Experimental evaluation of rate constants for dimerization of intermediates formed in controlled - potential electrolysis. Journal of Electroanalytical Chemistry 5:270 -280. 1963.
39. Meites, Louis and Thelma Meites. Assay of picric acid by coulometry at controlled potential. Analytical Chemistry 28:103 -106. 1956.
40. Meites, Louis and Stephen A. Moros. Background corrections in controlled- potential coulometric analysis. Analytical Chemistry 31:23 -28. 1959.
41. Moros, Stephen A, and Louis Meites. Electrochemical characteristics of manganese in cyanide solutions. II. Background corrections in controlled - potential coulometric determination of manganese (II). Kinetics of the oxidation of manganese (I) by hydrogen cyanide. Journal of Electro- analytical Chemistry 5:103 -113. 1963.

53
42. Nicholson, Richard S. and Irving Shain. Experimental verification of an ECE mechanism for the reduction of p- nitrosophenol, using stationary electrode polarography. Analytical Chemistry 37:190 -195. 1965.
43. Rechnitz, Garry A. Controlled -potential analysis. New York, Pergamon, 1963. 85 p.
44. Rieger, Philip H. and George K. Fraenkel. Analysis of the electron spin resonance spectra of aromatic nitrosubstituted anion radicals. Journal of Chemical Physics 39 :609 -629. 1963.
45. Roberts, J. L. , Jr. and D. T. Sawyer. Voltammetric determination of carbon dioxide using dimethylsulfoxide as a solvent. Journal of Electroanalytical Chemistry 9:1 -7. 1965.
46. Schaap, Ward B. and Peter S. McKinney. Resistance compensation in polarography. Application to high resistance nonaqueous systems and to high current -density aqueous systems. Analytical Chemistry 36:1251 -1258. 1964.
47. Schöber, G. und G. Rehak. Polarographische Untersuchungen in wasserfreiem Dimethylsulfoxid. Monatshefte für Chemie. 93 :445 -452. 1961.
48. Scott, F. A. and R. M. Peekema. Analysis for plutonium by controlled potential coulometry. In: Proceedings of the Second United Nations International Conference on the Peaceful Uses of Atomic Energy, Geneva, 1958. Vol. 28. Geneva, United Nations, 1958. p. 573 -578. (Paper no. 914).
49. Spritzer, Michael and Louis Meites. Polarographic charac- teristics and controlled- potential electro- reduction of dimethylglyoxime. Analytica Chimica Acta 26 :58 -65. 1962.
50. Testa, A. C. and W. H. Reinmuth. Stepwise reactions in chronopotentiometry. Analytical Chemistry 33:1320 -1324. 1961.
51. Wawzonek, S. Organic polarography. Analytical Chemistry 28 :638 -649. 1956; 30:661 -674. 1958; 32:144R -161R. 1960; 34 :182R -200R. 1962.

54
52. Wawzonek, S.., R. Berkey and D. Thomson. Polarographic behavior of organic compounds in methanesulfonic acid. Electrochemical Society Journal 103 -513 -518. 1956.
53. Wawzonek, S. and D. J. Pietrzyk. Organic polarography. Analytical Chemistry 36:220R -239R. 1964.
54. Wise, Edward N. and Edward J. Cokal. Coulometric determination of europium and ytterbium at controlled potential. Analytical Chemistry 32:1417 -1419. 1960.

55
PART II. MICROANALYSIS FOR WATER, USING RAPID CONTROLLED POTENTIAL COULOMETRY
IN A KARL FISCHER SYSTEM
I. INTRODUCTION
The Karl Fischer method is, without question, the most
widely applied technique for the quantitative determination of water
in organic materials. The method was first developed by Karl
Fischer (4) primarily for the determination of moisture in petroleum
chemicals and sulfur dioxide. The method is based on the reaction
of water with a solution of sulfur dioxide, pyridine, and iodine in
methanol. The stoichiometry of the reaction was established by
Smith, Bryant, and Mitchell (14) and requires one mole of water for
each mole of iodine consumed. They proposed the following two -
step reaction:
C5H5N I2 + C5H5N. SO2 + C5H5N + H2O
2C5H5N HI+ C5H5N SO3
C H 5 5N- S03 + CH3OH > C5H5N(H)SO4CH3 (2)
The quantitative determination of water is accomplished
volumetrically, with a methanol titrant containing a known concen-
tration of iodine and an excess of pyridine and sulfur dioxide. The
equivalence point is taken as the visual appearance of iodine or by
electrometric methods.
The Karl Fischer method has proven extremely useful in
(1)

56
determining moisture in both organic and inorganic materials and
in quantitatively determining functional groups in organic systems.
The latter is achieved by determining the water liberated or con-
sumed in a stoichiometric organic reaction. There are several
publications (7, 8, 19) which cover these applications in detail.
Perhaps the most perplexing problem associated with the Karl
Fischer method is the instability of the reagent. The iodine concen-
tration decreases with time, even in the absence of moisture, and
the reagent must be standardized just prior to usage. The parasitic
reaction or reactions responsible for the consumption of iodine have
not as yet been elucidated. Many modifications of the reagent have
been proposed for increasing its stability, yet, the instability prob-
lem remains. An example of such a modification is given by Peters
and Jungnickel (11). They found that a Karl Fischer reagent pre-
pared with methanol as the major constituent lost 22 percent of its
iodine concentration over a period of 30 days, whereas. a reagent
in which methyl cellosolve was substituted for methanol lost only
nine percent of its iodine concentration over the same period.
A coulometric method in which the Karl Fischer reagent is
produced in situ at the time of analysis has the advantage of elimi-
nating the necessity for preparation, storage, and standardization
of the reagent. The use of coulometry in the Karl Fischer water
determination has only recently been considered. A constant

57
current coulometric titration method in which electrolytic generation
of iodine provides the titrant in a depleted Karl Fischer reagent was
first developed by Meyer and Boyd (6). It was necessary, however,
to provide a supplementary generating current that could be adjusted
to maintain the depleted Karl Fischer reagent at the end -point before
addition of the sample. This was reported as necessary because of
side - reactions which continuously consumed the iodine. The abso-
lute standard deviation was reported as approximately ± 2 pg. of
water. Swensen and Keyworth (16) employed the coulometric titra-
tion method to determine water below 10 ppm. in benzene and
related solvents. However, they used from one to five gram sam-
ples, and no evaluation of ;the precision of the method was given.
Pribyl and Slovák (12) reported a coulometric titration method
which gave an approximate error in determination of -F 2 pg. of water
in the range from 10 to 550 pg. of water.
It is very difficult to achieve a precision of only ± 2 pg. of
water in a conventional Karl Fischer microdetermination. Bastin,
Siegel, and Bullock (2) developed a direct microtitration method
which was scaled down to 1 /100 of the conventional Karl Fischer
macromethod. They determined from 10 to 3000 pg. of water, with
a standard deviation of ± 3 pg. for determinations of samples con-
taining less than 300 pg.

58
Otterson (10) has described a spectrophotometric method for
determination of microgram quantities of water. He used the color
of the Karl Fischer reagent to determine from 11 to 26 µg. of water
in BaC12 2H 0, 2
reporting an average error of about ± 2µg. of
water.
An advantage of controlled potential coulometry for micro -
determinations is that an end -point determination is not necessary.
The determination is terminated by the completion of the oxidation
or reduction, and assuming 100 percent current efficiency, the
addition of excess titrant (electrons) is not possible. The precision
of the method is not limited by the absolute error in reproduction
of an end - point. A disadvantage, however, is that controlled
potential coulometric determinations usually require from twenty
minutes to several hours. Bard (1), by taking advantage of a large
electrode area -to- solution volume, ultrasonic and nitrogen stirring,
designed a high speed electrolysis cell. He has determined from
2. 5 to 25 p.moles of silver (I) and iodide by electrodeposition of
silver and silver iodide, respectively, in less than 100 seconds.
This research applies rapid, controlled potential coulometry
to the microdetermination of water in liquid solvents, in which
coulometric control of iodine is achieved in a Karl Fischer reagent.
The absolute standard deviation is decreased to ± 0. 2µg. of water,
a substantial improvement over existing methods. In addition, a

59
rapid electrolysis method is given, and some of the related para-
meters are discussed.

II. EXPERIMENTAL
Apparatus
Electrolysis Cell
60
The three - compartment cell used for controlled potential
electrolysis is illustrated in Figure 1. The reference and isolated
side -cells are connected by fine porosity frits. The nitrogen inlet
frit at the bottom of the working compartment is of medium porosity.
The working compartment is closed to the atmosphere by a Teflon
top with a silicone rubber seal. The sample inlet system consists
of a silicone rubber septum held in position by a 5/16 inch stainless
steel cap screw with a 1/8 inch hole through the center. The nitro-
gen outlet connection may be removed from the Teflon top for addi-
tion and removal of the cell solution. The cell solution is added
with a 10 ml. graduated syringe fitted with 0. 03 inch diameter
Teflon tubing, and removed with a 0. 03 inch diameter Teflon tubing
by means of vacuum.
Electrodes
The working electrode is shaped into a tightly wound spiral
consisting of 7. 6 g. of 52 mesh platinum gauze. The counter elec-
trode is made of heavy guage silver foil. The dimensions of the
counter electrode are not important as long as the area is sufficient

Liquid Level
Ag Counter Electrode
l
Septum
fN2
Tr I L r
Pt Working Electrode
N2
Liquid Level
Figure 1. Electrolysis Cell
61
SCE Ref. Electrode
Sat. KC1 (aq.)
// Liquid Level
Agar -KC1
one inch

62
to carry the current. The reference electrode is a saturated
calomel electrode. All voltages reported are versus this electrode.
The electrolytic continuity from aqueous to nonaqueous systems is
established by an agar -potassium chloride salt bridge and frit, as
shown in Figure 1.
Controlled Potential Coulometer
The instrument used was constructed by Caton (3) similar to
that described by Scott and Peekema (13). The instrument's elec-
tronic current integrator was continuously monitored by a 50 -mv.
recorder.
Preparation of Reagents
Karl Fischer Reagents
These reagents are prepared in volumetric flasks by addition
of sodium iodide, sulfur dioxide, and pyridine to give the desired
concentration when the system is made to volume with methanol.
The sulfur dioxide is added through addition of a standard sulfur
dioxide solution in methanol which in turn is prepared by adding
200 g. of gaseous anhydrous sulfur dioxide to one liter of methanol.
The water in the system is removed by addition of iodine. An
excess of iodine is added to yield a solution 0. 01 molar in iodine.
A premixed stabilized Karl Fischer reagent (Matheson Coleman and

63
Bell, catalog no. KX10, B806) was made to approximately 0. 01 molar
in iodine by careful addition of water. At the time of use, the rea-
gents are converted to spent Karl Fischer reagents inside the
electrolysis cell by controlled potential reduction of the excess
iodine.
Standard Additions
Standards containing as little as 0. 01 percent water in methanol
and dimethylsulfoxide cannot be prepared feasibily by a quantitative
addition of water to the solvents because of the difficulty of con-
veniently preparing anhydrous solvents. A common practice in
preparing water standards is to add water to the solvent to approxi-
mate the desired concentration and to standardize the resulting
solution with a Karl Fischer reagent which has previously been
standardized against sodium tartrate dihydrate or pure water. It is
felt, however, that because of the low level of water concentrations
involved, the standard addition method is a more suitable approach.
The methanol and dimethylsulfoxide solutions with standard additions
of water are prepared inside volumetric flasks and in the absence of
air by fitting the volumetric flasks with serum -type rubber septums,
and performing additions and removals with gas -tight syringes.
The volumetric flasks are filled to the top and sealed with the rubber
septums, leaving no air inside the flasks. Then the initial water

64
content of the solvent is determined on samples removed from the
volumetric flasks by syringe. This technique is employed so that
the determinations at zero water addition are not subject to errors
from water picked up in solvent handling -i. e. , from the flasks,
transfer, etc. Dry nitrogen is added by syringe to replace the
volume of liquid removed. After the initial water content of the
solvent is determined, each solvent volume is adjusted by further
removal of solvent until the addition of the water brings the final
volume to the calibrated volume of the flask. Water is added by
syringe, either as pure water, ten percent water in methanol, or
ten percent water in dimethylsulfoxide, depending on the volume
being prepared.
Chemicals
Pyridine, Baker and Adamson, reagent grade.
Methanol, Baker and Adamson, reagent grade absolute.
Dimethylsulfoxide, Crown Zellerbach Chemical Products Division, spectro grade 40823.
Nitrogen, Matheson Co. , Inc. , prepurified; the nitrogen was passed through anhydrous magnesium perchlorate drying trains before entering the electrolysis cell.
Sodium Iodide, Baker and Adamson, reagent grade.
Sulfur Dioxide, Matheson Co. , Inc. , Anhydrous grade, purity 99. 99 percent.

65
III. EXPERIMENTAL RESULTS AND DISCUSSION
Iodine Coulometry in Methanol
A current versus potential plot showing the oxidation of iodide
to iodine at positive potentials versus a saturated calomel electrode
and the decomposition of methanol at negative potentials in a 0.1
molar sodium iodide solution in methanol is given in Figure 2,
curve 4. The measurements were made in the electrolysis cell
described above. The solution was first deaerated by nitrogen, after
which the measurements were made in the absence of stirring. The
applied potential was adjusted to give the desired value, and the
current recorded after a ten second interval.
Induced Background Current
Theoretically it should be possible to oxidize iodide to iodine
at a controlled potential to give a quantity of iodine corresponding to
a readout in coulombs, and to reduce that quantity of iodine at a
controlled potential to give the same readout in coulombs. It was
found, however, that this was the case only when the applied poten-
tial was maintained at potentials more positive than -0. 08 volt. If
the reduction was carried out at more negative applied potentials,
there was an increase in the number of coulombs required for
reduction with respect to the number of coulombs required for

6. 0
á 4.0
.'., -1 2.0 .'.,
E-7 0.0 z w
á -2.0 o
-4. 0
66
0.2 0.0 -0.2 -0.4 -0.6 -0.8 -1.0 APPLIED POTENTIAL, volts vs. SCE
-1.2
Figure 2. Variation of electrolysis current with applied potential.
(1) 0. 1 M Nal, 0. 15 M SO2 solutions in methanol.
(2) M. C. & B. stabilized Karl Fischer reagent.
(3) 0. 1 M Nal, 0. 15 M SO2, and 0.6M pyridine solutions in methanol.
(4) 0. 1 M Nal solution in methanol.
ro

67
oxidation. This increase in the coulombs ratio for reduction over
oxidation corresponding to reductions at more negative applied
potentials is shown in Figure 3. The increase in the number of
coulombs for reduction was found to be more a function of the initial
current (initial rate of reduction) than the applied potential. The
ratio of coulombs remained at unity if the initial current was not
allowed to exceed ten ma. , regardless of the applied potential. This
was demonstrated by adjusting the applied potential from -O. 05 to
-0. 32 volt during the reduction at a rate such that the current never
exceeded ten ma. Another approach was to reduce the nitrogen
stirring such that the reduction at -O. 2 volt gave an initial current
below ten ma.
It seems reasonable to suspect the reduction step as causing
the deviation of the coulombs ratio from unity because the system
contains 0.1 molar iodide and any secondary oxidation should be
insignificant. However, the possibility of the oxidation step causing
the deviation was checked by making all reductions at an applied
potential of -0. 05 volt and the oxidations were made at applied poten-
tials between +0. 2 volt (with an initial current of five ma. ) and +0. 7
volt (with an initial current of 25 ma. ). No deviation from unity was
observed for the ratio of the number of coulombs given by the reduc-
tion and oxidation processes.
These results indicate that at higher initial currents a different

1. 2
1, 0
INITIAL CURRENT, milliamps 8. 5 11,0 13.5 16,0 18,5 21,0 23,5
I ' I
-0, 1 -0. 2 -0. 3
APPLIED REDUCTION POTENTIAL, volt -vs. SCE Figure 3. Ratio of coulombs for iodine reduction to iodide oxidation as a function of the iodine
reduction potential. Conditions: Iodide oxidations were maintained at +0, 4 volt to give 2p. moles of iodine in 5 ml. of methanol containing 0, 1 M NaI.
I , I
ro m

69
reduction mechanism for iodine occurs, or an induced reduction of
some other substance also takes place. A localized voltage ex-
cursion at the working electrode was considered unlikely. If this
were the case, the Karl Fischer reagent would be expected to show
a greater reduction - oxidation coulombs ratio change, because this
reagent contains substances which are reduced more easily than
methanol. However, it was found that the Karl Fischer reagent did
not show any change in the reduction- oxidation coulombs ratio when
subjected to the same applied potential variations described for
iodine in methanol. There may have been an induced hydrogen
reduction at the higher initial currents. This seems plausible in
view of the fact that the 0. 1 molar sodium iodide solution in methanol
contained 0. 05 percent water, whereas the Karl Fischer reagent
was absolutely water -free. Background currents involving the
induced reduction of hydrogen in controlled potential coulometry of
aqueous systems have been discussed by Meites and Moros (5).
Rapid Controlled Potential Coulometry
The electrolysis cell (see Figure 1) was designed to provide
a large electrode area -to- solution volume ratio and efficient nitrogen
stirring in order to decrease the time necessary for electrolysis.
The nitrogen stirring efficiency was evaluated by noting the change
in the time necessary for complete iodine reduction at different

70
nitrogen flow rates, maintaining the other parameters constant.
The results are given in Figure 4. The time of complete reduction
was taken as the time at which the current had decayed to 0. 1 per-
cent of its initial value. No significant amount of iodine was lost
from the solution due to nitrogen stirring. This was established by
subjecting two µmoles of iodine in five ml. of methanol containing
0. 1 molar sodium iodide to nitrogen stirring with 20 ml. /min. for
ten minutes before reduction. No change in iodine concentration
was observed. The loss of iodine was expected to be less likely
from a Karl Fischer reagent because, in addition to the 0. 1 molar
sodium iodide, the system also contains pyridine which forms an
addition compound with iodine. The effect of pyridine addition on
the redox potential of iodine in methanol can be seen by comparing
curve 3 with curve 4 in Figure 2. The oxidation of iodide to iodine
with pyridine present was easier, and consequently the reduction of
iodine was more difficult.
Figure 5 illustrates the effect of change in the electrolysis
cell solution volume upon the time necessary to completely reduce
2. 0 µmoles of iodine in a 0. 1 molar sodium iodide solution in
methanol. The cell solution was just level with the top of the work-
ing electrode at a volume of 3.5 ml. The relatively small increase
in iodine reduction time with increase in the cell solution volume
demonstrates the high efficiency of nitrogen stirring from a large

71
10 20 30 40 50 60
NITROGEN FLOW, milliliters /minute
Figure 4. Effect of nitrogen stirring on the time to reduce 2 µ moles of iodine. Conditions: Reductions were made at applied potential in 5 ml. of methanol 0. 1 M NaI.
necessary
-0. 1 volt containing

REDUCTION TIME, minutes
3
2
1
72
4 5 6 7 8 9 10
CELL SOLUTION VOLUME, milliliters
Figure 5. Effect of the cell solution volume on the time necessary to reduce 2 µ moles of iodine. Conditions: Reductions were made at -0. 1
volt applied potential in cell solutions of methanol containing 0. 1 M NaI, and with a nitrogen stirring rate of 20 ml. /min.

73
frit placed in the bottom of the cell.
Determinations in which 2. 04 µmoles of iodine were produced
by oxidation gave an iodine reduction of 2. 05 ± O. 002 µmoles. The
standard deviation is based on ten determinations which were made
in five ml. of 0.1 molar sodium iodide solution in methanol with a
nitrogen stirring flow of 20 ml. /min. Oxidations and reductions
were made at controlled potentials of +0. 4 and -O. 08 volt, respec-
tively. Each reduction of 04 µmoles of iodine was accomplished
in 96 seconds. This rapid controlled potential electrolysis time
compares closely with those reported by Bard (1). The reduction
time could have been decreased by reducing the iodine at more
negative applied potentials; however, as pointed out above, because
of the induced background current the results were not quantitatively
reliable.
Iodine Coulometry in Karl Fischer Reagents
Current versus potential curves resulting from spent Karl
Fischer reagents are shown in Figure 2, curves 2 and 3. The con-
ditions and procedure for the measurements were the same as those
reported above for iodine in methanol. Oxidation at positive applied
potentials corresponds to the oxidation of iodide to iodine, and the
reduction at negative potentials was probably due to the reduction of
pyridinium ion. Spritzer, Costa, and Elving (15) have shown that

74
pyridinium ion undergoes polarographic reduction at a dropping
mercury electrode in a pyridine system.
Reagent Stability
It was found that when 2. 04 µmoles of iodine was produced by
oxidation at +0. 4 volt, the reduction at -O. 2 volt gave 1. 98* O. 004
µmoles recovered. The standard deviation is based on 15 determina-
tions. The oxidation and reduction times were 27 and 92 seconds,
respectively. The loss of iodine was found to be continuous and
constant throughout a series of determinations in the same cell
solution reagent. Determinations were made after 2. 04 moles of
iodine had remained in the system for five minutes, and the loss of
iodine was found to correspond to 0.53 t 0. 01 µg. of water per
minute. Approximately the same loss was observed when the iodine
was not produced in the system until just before the end of the five
minute waiting period. This indicated that the cause of the iodine
loss was continuous even in the absence of iodine. The loss was no
doubt due to both water getting into the system and to side- reactions
which continuously produced water or a product which could reduce
iodine.
Changes in the nitrogen flow rate had very little effect on the
amount of iodine lost per minute. A further check was made on the
possible water contribution from the nitrogen by placing a dummy

75
cell immediately ahead of the electrolysis cell. The dummy cell
contained 20 ml. of Karl Fischer reagent approximately O. 01 molar
in iodine with a bubbling path four times that of the electrolysis cell.
There was very little decrease in the loss of iodine per minute when
this nitrogen pretreatment by the dummy cell was employed. This
indicated that the nitrogen was not contributing a significant amount
of water. A contribution of water from the isolated and reference
cell compartments was eliminated by maintaing the Karl Fischer
reagent in these cells at a slight iodine concentration. A contribu-
tion of oxidizable or reducible species from the cell containing the
isolated electrode was not possible because the silver (I) oxidation
product was insoluble in the iodide system, and the reduction pro-
duct was iodide from the slight excess of iodine in the cell solution.
The loss of iodine was observed to vary considerably with the
Karl Fischer reagent composition and age. Karl Fischer reagents
gave a greater loss of iodine with increasing concentrations of sul-
fur dioxide. The reagent purchased from Matheson Coleman and
Bell (see Figure 2, curve 2) and other stabilized reagents containing
large ratios of pyridine -to- methanol were found to give somewhat
smaller losses of iodine per minute; however, the iodine reduction
time was greatly increased. This lack of improvement from the
stabilized reagents, coupled with the tendency for them to plug the
nitrogen inlet frit of the electrolysis cell, discouraged the use of

76
these reagents. Many Karl Fischer reagents with different compo-
sitions were checked, and the one found most satisfactory consisted
of 0.1 molar sodium iodide, 0. 15 molar sulfur dioxide, and 0. 6
molar pyridine solutions in methanol. The loss of iodine from this
reagent was found to be constant and did not interfere with the analy-
sis for water, as the loss of iodine per minute was treated as a
blank which was determined before and after each analysis.
Water Determination Procedure
The controlled potential coulometric procedure for determina-
tion of water, employing spent Karl Fischer reagent, closely
resembles the Karl Fischer back titration procedure. In the back
titration procedure a known excess of iodine is added to the sample
in the form of Karl Fischer reagent, whereas in the controlled
potential coulometric procedure a known excess of iodine is produced
coulometrically in a spent Karl Fischer reagent containing the
sample. In the back titration procedure the excess iodine is deter-
mined by titrating with a standard water -methanol titrant. In the
controlled potential coulometric procedure the excess iodine is
determined coulometrically.
Procedure:
(a) Add five ml. of Karl Fischer reagent containing
approximately 0. 01 molar in iodine and adjust

77
the nitrogen flow rate to 20 ml. /rain.
(b) After several minutes reduce the excess iodine
at -O. 2 volt applied potential.
(c) Adjust the applied potential to +0. 4 volt and oxidize
2. 00 µmoles of iodide to iodine.
(d) Add the 0.1 ml. sample which should contain less
than one µmole of water. Allow one -half minute
for complete reaction.
(e) Reduce the excess iodine at -O. 2 volt applied
potential and subtract this value from the original
2. 00 ',moles.
(f) Determine the system loss of iodine (blank) by
oxidation of iodide and reduction of iodine in the
absence of a sample, maintaining the iodine
quantity and time the same as above. The deter-
mination time can be obtained from the distance
that the recorder chart paper travels. Add this
loss of iodine to the value found in (e).
(g) Convert the p.moles of iodine consumed by the
water in the sample to µgrams of water on a one-
to-one mole basis.

78
For samples which contained in excess of 20 µg. of water, a
change in procedure is necessary in order to maintain a sufficient
excess of iodine in step (d) after addition of the sample. This is
accomplished by producing a recorded amount of iodine after the
sample addition, equal approximately to the iodine consumed by the
sample. The increase in value for iodine produced is added to the
original 2. 00 µmoles of iodine produced. The remaining procedure
is the same.
Maintaining an excess of iodine was found to be necessary in
the determination of water in dimethylsulfoxide in order to obtain
complete recovery. Also, the reaction time in (d) was increased
to three minutes. This lack of complete recovery was demonstrated
by determining consecutive blanks after a water determination. The
blank immediately after a water determination, in which the reaction
time in (d) was only one -half minute, would be considerably larger
than the following blanks. This effect was not observed for water
determinations in methanol.
If the electrolysis cell was not used for several days, the time
in (b) was increased by 15 or 20 minutes. If moisture came into
contact with the frits, the absorbed moisture was removed very
slowly, yielding larger blanks which decreased with time. This
problem was eliminated by keeping the frits in contact with Karl
Fischer reagent when the cell was not in use. In consecutive sample

79
determinations the overall time of determination was kept constant,
and a blank was determined before and after the sample.
Water Determination Results
The results of standard additions are given in Figure 6. The
intersection at zero water.. addition agreed with the water content
found for the solvents before standard water additions. This demon-
strates that the method was absolute in that one mole of iodine con-
sumed corresponded to one mole of water.
Tenth milliliter samples of methanol containing ten to 74 µg.
of water were determined. The absolute standard deviation was
t 0.2 µg. of water. Tenth milliliter samples of dimethylsulfoxide
containing from 18 to 82 µg. of water were determined. The abso-
lute standard deviation was t 0.3 µg. of water. The number of
samples of dimethylsulfoxide determined in the same electrolysis
cell solution reagent had a considerable effect on the reaction time
necessary in (d) for 100 percent recovery. For three minute reac-
tion times only four 0.1 ml. samples could be determined per cell
solution reagent. This number was increased to eight 0.1 ml.
samples by increasing the reaction time in (d) to five minutes. This
effect was not observed for methanol, and from ten to twenty O. 1 ml.
samples were determined for each cell solution reagent.

90
80
m
70 o
.1
60
W z 1-1 50
W E-1
(ai 40
W 30
20
10
80
10 20 30 40 50
WATER ADDED, micrograms 60
Figure 6. Standard addition determinations of water in 0. 1 ml. solvent samples.
;-. U
E
a
A a
DMSO
-
METHANOL
i

81
The dimethylsulfoxide appears to have a greater affinity for
water than methanol. This demonstrates the advantage of a back
titration type of procedure for solvents which release water slowly
to the Karl Fischer reagent. Also, this shows that such solvents
should be determined in a manner such that the sample volume to
reagent volume is kept as small as possible.

82
IV. CONCLUSIONS
In comparison with other water determination methods devel-
oped on the basis of the Karl Fischer reaction, the proposed control-
led potential coulometric method appears to have the greatest
sensitivity. The method is not limited by the sensitivity of a
conventional end -point detection. The ability to measure microgram
quantities of water and thus decrease the solvent sample size is not
only important where sample availability is limited, but also a small
solvent sample size should decrease the effect of interfering side
reactions given by the solvent and the Karl Fischer reagent. The
method has the advantage of permitting excess iodine to remain in
the system a predetermined time, thereby assuring complete reac-
tion in the case of solvents which slowly give up the last traces of
water. The development of a rapid electrolysis system allows the
method to be competitive with other methods as far as overall time
of analysis is concerned.
The results from iodine coulometry in Karl Fischer reagents
demonstrate the utility of a rapid, controlled potential coulometric
method for precise, controlled in situ addition and removal of a
species for evaluating the parameters of a complicated system. The
method has proven valuable for rapid evaluation of the stability of
Karl Fischer reagents of different composition and age.

83
It should also prove useful for establishing the reaction kinetics
and effect of interfering side reactions for different solvent- reagent
systems.

84
V. BIBLIOGRAPHY
1. Bard, Allen J. High speed controlled potential coulometry. Analytical Chemistry 35:1125-1128. 1963.
Bastin, E. L. Herbert Siegel and A. B. Bullock. Micro - determination of water by titration with Fischer reagent. Analytical Chemistry 31:467 -473. 1959.
3. Caton, Roy Dudley, Jr. Controlled potential coulometric and polarographic investigation of metallic ions in fused salts. Ph. D. thesis. Corvallis, Oregon State University, 1963. 129 numb. leaves.
4. Fischer, Karl. Neues Verfahren zur massanalytischen Bistimmung des Wassergehaltes von Flüssigkeiten und festen Körpern. Angewandte Chemie 48:394 -396. 1935.
5. Meites, Louis and Stephen A. Moros. Background correc- tions in controlled- potential coulometric analysis. Analytical Chemistry 31:23 -28. 1959.
Meyer, A. S. Jr. and C. M. Boyd. Determination of water by titration with coulometrically generated Karl Fischer reagent. Analytical Chemistry 31:215-219. 1959.
7. Mitchell, John, Jr. Aquametric methods in organic analysis, Analytical Chemistry 36:2050 -2052. 1964.
8. Mitchell, John, Jr. Karl Fischer reagent titration. Analytical Chemistry 23:1069 -1075. 1951.
9. Mitchell, John, Jr. and M. Donald Smith. Aquametry. New York, Interscience, 1948. 444p.
10. Otterson, Dumas A. Spectrophotometric determination of microgram quantities of vaporizable water from solids using Karl Fischer reagent. Analytical Chemistry 33 :450 -453, 1961.
11. Peters, E. D. and J. L. Jungnickel. Improvements in Karl Fischer method for determination of water. Analytical Chemistry 27:450 -453. 1955.
2. ,
6.

85
12. Pribyl, M. and Z. Slová.k. Coulometrische Bistimmung kleiner Wassermengen nach dem Prinzip der Karl- Fischer- Reaktion. Microchimica et Ichnoanalytica Acta, 1965, no. 2, p. 1097 -1105.
13. Scott, F. A. and R. M. Peekema. Analysis for plutonium by controlled potential coulometry. Proceedings of the Second United Nations International Conference on the Peaceful Uses of Atomic Energy, Geneva, 1958. Vol. 28. Geneva, United Nations, 1958. p. 573-578. (Paper no. 914).
14. Smith, D. M. , W. M. D. Bryant and John Mitchell Jr. Analytical procedures employing Karl Fischer reagent. I.
Nature of the reagent. Journal of the American Chemical Society 61:2407 -2412. 1939.
15. Spritzer, Michael S. , Jose M. Costa and Philip J. Elving. Polarographic reduction of pyridinium ion in pyridine. Application to the determination of Bronsted and Lewis acids. Analytical Chemistry 37:211 -217. 1965.
16. Swensen, R. F. and D. A. Keyworth. Determination of water below 10 p. p. m. in benzene and related solvents, using coulometrically generated iodine. Analytical Chemistry 35 :863 -867. 1963.