abstract - home | kuwait journal of science
TRANSCRIPT

-1-
Kuwait Journal of Science
Evaluation of site amplification factors for shallow rock sites of Islamabad, Pakistan.
Shamsher Sadiq1,2, Muhammad Aaqib2, Saeed-ullah J. Mandokhail3,*, Maqsood-Ur-Rehman4,
Alam Mehtab5, Naik Muhammad3 ,Muhammad B. Adeel2
1 GIK Institute of Engineering Sciences and Technology, Topi, Pakistan
2Hanyang University, Seoul, South Korea 3BUITEMS, Quetta, Blouchistan, Pakistan
4NESPAK, Lahore, Punjab, Pakistan 5Institute of Mountain Hazards and Environment, Chengdu, China
* Corresponding author: [email protected]
Abstract
Current seismic provisions in Building Code of Pakistan (BCP-2007), seismic site classifications,
and corresponding site amplification factors were determined similar to Uniform Building Code
(UBC-1997), which were based on the local site conditions of Western United States with low
impedance contrast, deep sites, and high seismicity conditions. The use of these deep sites based
amplification factors to the shallow sites may not be appropriate to capture shallow sites' response.
In this study, we performed a non-linear site-specific response analysis suite to compute the
amplification factors for the six (06) representative shallow bedrock sites of Islamabad, Pakistan.
The computed amplification factors are compared with BCP-2007 code-based design estimates; it
is found that BCP-2007 code-based guidelines underestimate amplification factors at a short period
whereas overestimating at an extended period. The study's findings highlight the potential
implications of current code-based amplification factors for Islamabad's shallow sites and suggest
improving the current seismic guidelines.
Keywords: BCP, 2007; natural period; response spectra; shear wave velocity; site response
analysis (SRA).
1. Introduction
Pakistan's location is such that it lies in a zone
with collision expression among the Indian
and Eurasian plates (Farah et al., 1984).
Islamabad is the capital of Pakistan, and it lies
right at the edge of the Potohar Plateau.
Islamabad, the capital of Pakistan, is
surrounded by several active faults, making it
prone to earthquakes. Some of these faults are
the Jhelum fault, Rawat fault, Kalabagh fault,
and the Main Mantle Thrust (MMT)
(Mahmood et al., 2015; Sadiq et al., 2018), as
shown in figure 1. One of the most destructive
earthquakes that hit Pakistan in the recent past
was the 8th October 2005 earthquake, with
the epicenter, about 100km north-northeast
from Islamabad killed about 87,350 people
all over Pakistan (Naeem et al., 2005;
Raghukanth, 2008). Figure 2 elaborated the
Margalla tower Islamabad, which also
collapsed during this earthquake (Shoukat et
al., 2015b). In seismically active regions like
the Western US, Taiwan, Japan, a large
magnitude earthquake are more

-2-
Kuwait Journal of Science
Fig. 1. Map showing major fault systems around Islamabad and Kashmir Earthquake,
2005 epicenter location (Mahmood et al., 2015; Sadiq et al., 2018)
Fig. 2. Margalla tower collapse in the 8th October 2005 earthquake (Shoukat et al., 2015a)
frequent, but it is very seldom that the death
toll rate crosses double figures. This is due to
the improved site-specific seismic building
codes in these countries.
Various studies have been published
emphasizing the need for site-specific
amplification evaluation for the shallow
bedrock regions. The variation in the
amplification of the ground motion depends
on the geotechnical characteristics of the
region. Kim & Yoon, 2006, proposed a new
site classification system based on bedrock
depth and average shear wave velocity of soil
for Korea's shallow rock sites and proposed a
new set of amplification factors (AF)
corresponding to the proposed site
classification system. Anbazhagan et al.,
2012, concluded that the site amplification
factors implemented in China's seismic
design codes, India and Australia, represent
stiffer site conditions because of the shallow
nature of soil profiles in the region. Aaqib M,
2018, presented site-specific AF while
emphasizing the need for strength correction
in site response analysis. Pehlivan et al.,
2017, presented site-specific AF for Korea
and concluded that it underestimates the
design spectrum at short periods and

-3-
Kuwait Journal of Science
overestimates at long periods. (Muhammad et
al., 2018; Pehlivan et al., 2017; Sun et al.,
2018) discussed the importance of the site-
specific non-linear AF and the potential
implications of observed differences on the
design building code practices for the shallow
bedrock regions.
Few studies on the site-specific
amplification characteristics of Pakistan have
also been published. Mahmood et al., 2016,
used four ground motions and performed a
1D equivalent linear site response analysis to
study the site-specific amplification
characteristics that lead to the collapse of
Margalla tower in Islamabad during 2005
Muzaffarabad earthquake. Mahmood et al.,
2019, performed a 1D non-linear site-specific
response analysis using seven ground
motions to study the Peshawar district of
Pakistan's amplification characteristics.
However, in these studies, site-specific
amplification spectra were not developed,
and hence no comparison was made with the
seismic provisions in the building code of
Pakistan (BCP, 2007). Also, in the above
studies, very few ground motions were used
to account for the variability of the ground
motions' frequency characteristics. Also, the
studies mentioned above have not highlighted
the shallow nature of the bedrock
encountered in the region. Since site
amplification is directly related to local site
conditions, using site factors derived from the
recorded earthquake that occurred in different
ground conditions may mislead the estimated
seismic response. Therefore, it is essential to
investigate the amplification factors
considering Islamabad's local site conditions,
Pakistan.
This study presents the site-specific
amplification characteristics of Islamabad,
Pakistan. A suite of 1D non-linear site
response analysis was performed to estimate
the AF by utilizing Islamabad's local site
conditions, Pakistan. Six representative sites
from Islamabad were selected. The newly
developed amplification factors and response
spectra are also compared with seismic code-
based design estimates (BCP, 2007).
2. Review of seismic provisions of building
code of Pakistan (BCP, 2007)
Current seismic provisions in the Building
Code of Pakistan (BCP, 2007) presented in
Chapter 5, Section IV has been adopted from
Chapter 16, Division II of Uniform Building
Code (UBC, 1997). There has been no update
made to these mandatory seismic provisions
in practice since 2007. Building Code of
Pakistan (BCP, 2007) defines the seismic
demand in terms of ground motion
compatible with design response spectra. The
required inputs for defining the design
response spectra are listed below;
i. Figure 3 represents five (05) seismic
zone for Pakistan based on the
Probabilistic Seismic Hazard Analysis
(PSHA). Based on the building's
location, it is required to find the site's
seismic zone using Figure 3.
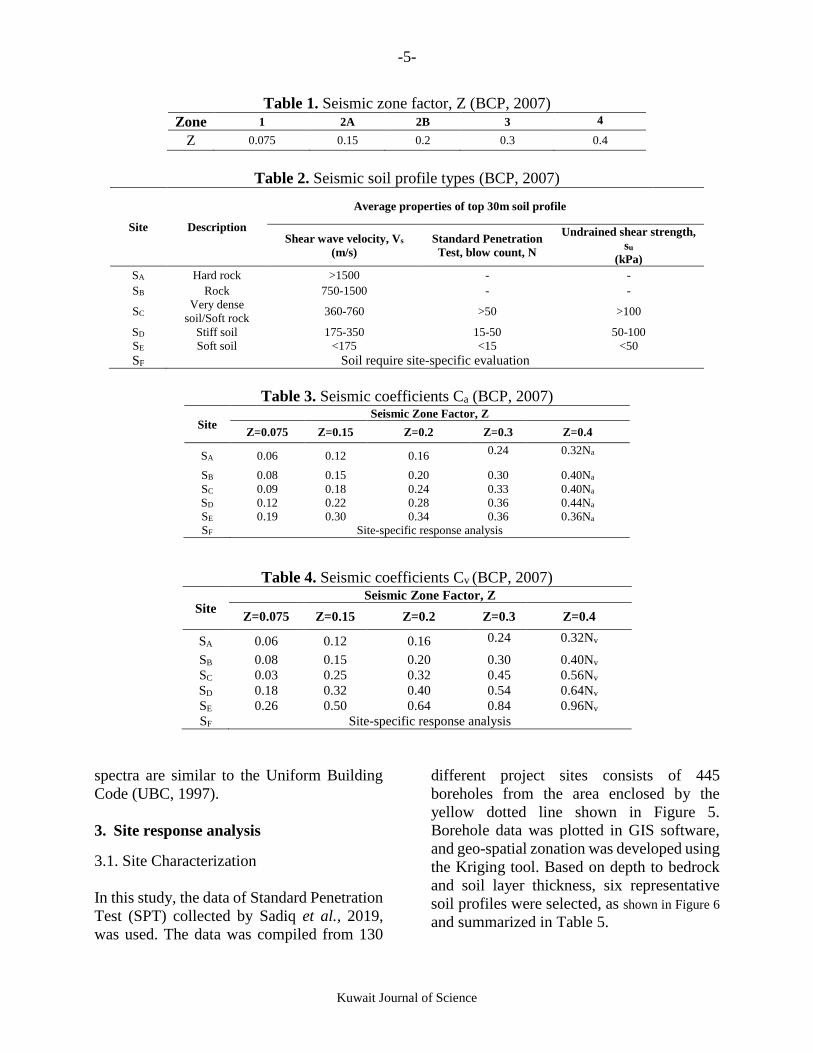
ii. Compute the seismic zone factor, Z, from
Table 1. Z represents the mapped Peak
Ground Acceleration (PGA) having a
10% probability of exceedance in 50
years (475 years' annual return period).
iii. The site is classified based on top 30m
average shear wave velocity, Standard
Penetration Tests (SPT) blow count (N),
or undrained shear strength, as given in
Table 2. This Classification is identical to
Uniform Building Code (UBC, 1997).
iv. Site amplification factors termed seismic
coefficients, Ca (short period
amplification factor), and Cv (long
period amplification factor) are Z and
site class functions. Table 3 and Table 4
presents the short and long period
amplification factors, respectively.
These seismic factors are identical to
Uniform Building Code (UBC, 1997).
v. The Building Code of Pakistan (BCP
2007) defined and presented in Figure 4
that the Building Code's design response

-4-
Kuwait Journal of Science
Fig. 3. Seismic zonation based on seismic hazard analysis (BCP, 2007).
Fig. 4. Definition of design response spectra (BCP, 2007)
Sp
ectr
al a
cc (
g)
Period (s)
T
Ca
2.5Ca
Cv/T
Control periods
Ts=Cv/2.5Ca
To=0.2Ts
To Ts
-5-
Kuwait Journal of Science
Table 1. Seismic zone factor, Z (BCP, 2007)
Zone 1 2A 2B 3 4
Z 0.075 0.15 0.2 0.3 0.4
Table 2. Seismic soil profile types (BCP, 2007)
Site Description
Average properties of top 30m soil profile
Shear wave velocity, Vs
(m/s)
Standard Penetration
Test, blow count, N
Undrained shear strength,
su
(kPa)
SA Hard rock >1500 - -
SB Rock 750-1500 - -
SC Very dense
soil/Soft rock 360-760 >50 >100
SD Stiff soil 175-350 15-50 50-100
SE Soft soil <175 <15 <50
SF Soil require site-specific evaluation
Table 3. Seismic coefficients Ca (BCP, 2007)
Site Seismic Zone Factor, Z
Z=0.075 Z=0.15 Z=0.2 Z=0.3 Z=0.4
SA 0.06 0.12 0.16 0.24 0.32Na
SB 0.08 0.15 0.20 0.30 0.40Na
SC 0.09 0.18 0.24 0.33 0.40Na
SD 0.12 0.22 0.28 0.36 0.44Na
SE 0.19 0.30 0.34 0.36 0.36Na
SF Site-specific response analysis
Table 4. Seismic coefficients Cv (BCP, 2007)
Site Seismic Zone Factor, Z
Z=0.075 Z=0.15 Z=0.2 Z=0.3 Z=0.4
SA 0.06 0.12 0.16 0.24 0.32Nv
SB 0.08 0.15 0.20 0.30 0.40Nv
SC 0.03 0.25 0.32 0.45 0.56Nv
SD 0.18 0.32 0.40 0.54 0.64Nv
SE 0.26 0.50 0.64 0.84 0.96Nv
SF Site-specific response analysis
spectra are similar to the Uniform Building
Code (UBC, 1997).
3. Site response analysis
3.1. Site Characterization
In this study, the data of Standard Penetration
Test (SPT) collected by Sadiq et al., 2019,
was used. The data was compiled from 130
different project sites consists of 445
boreholes from the area enclosed by the
yellow dotted line shown in Figure 5.
Borehole data was plotted in GIS software,
and geo-spatial zonation was developed using
the Kriging tool. Based on depth to bedrock
and soil layer thickness, six representative
soil profiles were selected, as shown in Figure 6
and summarized in Table 5.

-6-
Kuwait Journal of Science
Fig. 5. Map of Islamabad, location of in-situ boreholes.
Fig. 6. Soil profiles with stratigraphy and SPT-N blow count.
Several researchers have proposed
correlations between SPT-N values and shear
wave velocity, Vs. Mahmood et al., 2015,
proposed and discussed that Lee's, 1990,
correlation provides Vs. Profile very close to
the average Vs. Value of the representative
profile for Islamabad. In this study, we also
used the correlation proposed by Lee, 1990,
0
5
10
15
20
25
30
Depth
(m
)
FIL
CL/CL-MLNavg.=8
CL/CL-MLNavg.=12
CL/CL-MLNavg.=15
GM/GCNavg.=40
0
5
10
15
20
25
30
35
40
45
50
Depth
(m
)
FIL
CL/CL-MLNavg.=16
GM/GCNavg.=30
GM/GCNavg.=75
GM/GCNavg.=60
0
2
4
6
8
10
12
14
16
Depth
(m
)
CL/CL-MLNavg.=09
CL/CL-MLNavg.=14
Shale and Sand stone
0
10
20
30
40
50
Depth
(m
)
GM/GCNavg.=50
GM/GCNavg.=65
Shale and Sand stone
FILL0
5
10
15
20
Depth
(m
)
CL/CL-MLNavg.=30
GM/GCNavg.=50
Shale and Sand stone
FILL0
5
10
15
20
25
30
Depth
(m
)
FILL
Shale and Sand stone
P1 P2 P3 P4 P5 P6

-7-
Kuwait Journal of Science
to obtain the shear wave velocity profiles
from the SPT-N values.
The depth of the bedrock was measured
from the borehole reports. All the profiles
compiled in this study have shallow bedrock
depths ranging from 2m to 50m. For
simplicity, the shear wave velocity and unit
weight of the bedrock was assumed to be 780
m/s and 22 kN/m3, respectively, as
recommended by Mahmood et al., 2015. The
developed shear wave velocity profiles of the
six representative sites used in the study are
shown in
Fig. 7 7 Time-weighted average shear wave
velocity of top 30m (Vs30) was calculated by
Eq. (1)
30 30
1
30s
i
Vdi
Vsi
(1)
The time-averaged velocity of soil (Vs., soil)
deposits above the bedrock were calculated
by Equation (2).
1,
1
n
is soil n
i
di
Vdi
Vsi
(2)
The natural period of the soil profile (TG)
corresponds to the fundamental frequency of
the profile was calculated by Equation (3).
1
4n
G
i
diT
Vsi
(3)
The characteristics of selected
representative soil profiles are summarized in
Table 6.
Fig. 7. Developed shear wave velocity
profiles.
Table 5. Selection of six representative soil profiles for Islamabad based on geo-spatial plotted
borehole database shown in Figure 5.
Geo-spatial
zone
Profile name Thickness of soil layer
(m)
No. of boreholes
Zone-1A P1 02 86
Zone-1B P2 10 35
Zone-02 P3 12 80
Zone-3A P4 09 85
Zone-3B P5 50 102
Zone-3C P6 31 57
0
5
10
15
20
25
30
35
40
0 200 400 600 800 1000
De
pth
(m
)
Shear Wave Velocity (m/s)
P1
P2
P3
P4
P5
P6

-8-
Kuwait Journal of Science
Table 6. Summary of the selected site profiles.
Site Site Class
(BCP, 2007)
Vs30
(m/s)
Vs,soil
(m/s)
Site Period
TG, (s)
Depth to bed
rock (m)
P1 SC 600 142 0.056 02
P2 SC 522 315 0.127 10
P3 SC 512 353 0.147 12
P4 SC 465 240 0.150 09
P5 SD 319 357 0.560 50
P6 SD 282 284 0.437 31
3.2. Input ground motions
The ground motion that is considered as an
input for the design of civil engineering
structures is the main unknown of this
analysis. In Pakistan, there are only a few
records that can be used for dynamic analysis.
Therefore, recorded acceleration time
histories as input motion is a better alternative
and appealing in the site response analysis.
Due to the shallow bedrock nature of
Islamabad sites, NGA (Next Generation
Attenuation)-west2 database recorded ground
motions were used as input ground motions
in this study. NGA-West2 ground motion
database includes recorded ground motions
of shallow crustal earthquakes
(https://ngawest2.berkeley.edu/) (Ancheta et
al., 2014). To account for the wide range of
frequency content of earthquake ground
motions, nine recorded input motions were
selected having moment magnitudes (Mw)
ranging from 5.6 to 6.9, rupture distances
between 9.6 km and 40.4 km, and PGA
ranging from 0.1 g to 0.41 g, as shown Figure
8 and summarized in Table 7. The selected
motions were scaled to 0.2 g following the
procedure outlined in ASCE 7-10 (Charney,
2015).
Fig. 8. Response spectra of selected rock outcrop motions.
0
0.5
1
1.5
0.01 0.1 1 10
Sp
ectr
al A
ccele
ration
(g)
Period (s)
Coyote LakeIwateIWT010IwateMYGHKyungjooLoma PrietaNorthridgeSan FernandaTottoriTottori
5% Damping

-9-
Kuwait Journal of Science
Table 7. Input ground motion characteristics.
S.
No
Earthquake
Name Year
Station
Name
Magnitude,
Mw Fault
Rupture
distance,
Rrup
(km)
VS30
(m/s)
PGA
(g)
1 Loma Prieta 1989 Gilroy
Array 1 6.9
Reverse
oblique 9.6 1428 0.11
2 Northridge 1994
LA-
Wonderland
Ave
6.7 Reverse
oblique 20.3 1222 0.28
3 Coyote Lake 1979 Gilroy
Array 1 5.7
Strike
slip 10.7 1428 0.22
4 Tottori 2000 SMNH 10 6.6 Strike
slip 15.6 967 0.41
5 Iwate 2008 IWT010 6.9 Reverse 16.3 825 0.15
6 San Fernanda 1971 Pasadenaold 6.6 Reverse 21.5 969 0.12
7 Tottori 2000 OKYH07 6.6 Strike
slip 15.2 940 0.09
8 Iwate 2008 MYGH04 6.9 Reverse 40.4 849 0.23
9 Kyungjoo Korea 2016 MKL 5.8 Strike
slip 13.0 0.12
3.3. Numerical modeling
1D analysis has been proven through
extensive case studies to provide a reliable
estimate of surface response. Non-linear site
response analysis on the selected
representative soil profiles was performed
using the program DEEPSOIL v6.1 (Hashash
et al., 2016). The Modified Kondner-Zelasko
(MKZ) model (Matasović & Vucetic, 1993)
was used for the non-linear analyses. The
shear modulus ratio (G/Gmax) and damping
ratio (D) curves were defined using the
discrete points model at various confining
pressures. Due to the unavailability of site-
specific dynamic curves and index properties,
widely used modulus reduction and damping
curves of Darendeli (Darendeli, 2001) were
adopted with over-consolidation ratio (OCR)
being assumed as 1, the horizontal at-rest
earth pressure factor (K0) as 0.5, plasticity
index (PI) as zero (0), and the number of
cycles of loading (N) and the excitation
frequency (f) are defined as 10 and 1,
respectively. The modulus reduction and
damping curve fitting procedure, termed
MRDF, matched the non-linear target curves
(Phillips & Hashash, 2009). The small strain
damping was modeled with the Rayleigh
damping formulation. The 1st and 5th modes
were selected to reduce the frequency-
dependent damping, as Kwok et al., 2007,
recommended. The bedrock was modeled as
an elastic half-space because the selected
input motions were recorded as rock outcrop
motions. The non-linear site response
analysis for all the six profiles was performed
with the 9 input motions shown in Figure 8.
4. Results and discussions
For each rock outcrop input motion, surface
acceleration response spectra and associated
AF at each period were calculated for the six
representative profiles. Figure 9 a & b
represents the computed surface acceleration

-10-
Kuwait Journal of Science
spectra and the computed amplification
factors for profile P3. The bold red line
represents the average acceleration spectra
and AF in Figure 9. Maximum amplification
was observed at the natural site period TG, as
shown in Figure 9. a. The short-period
amplification coefficient (Fa) and long period
amplification coefficient (Fv) were calculated
within the integration intervals of 0.1-0.5s
and 0.4-2.0s, respectively, as specified in the
National Earthquake Hazard Reduction
Program (NEHRP) provisions (Borcherdt,
1996; Dobry et al., 2000). The computed
average AF at each period of the six sites is
presented in Fig. 10. It is observed that
amplification at short periods, i.e., Fa is
higher than at a more extended period, i.e., Fv
for all the profiles, which agrees with the
previous studies for the shallow bedrock sites
(Kim & Yoon, 2006; Pehlivan et al., 2017).
One reason for a low computed Fv value
could be that the profiles are shallow, and
there is minimal amplification beyond 1.5s,
while in our study, the long period coefficient
was calculated for an integration interval of
up to 2.0s, which is according to the Building
Code of Pakistan (BCP, 2007). Several
previous studies (Kim & Yoon, 2006) have
suggested adjusting the long period
amplification (Fv) integration interval for
shallow bedrock sites.
Comparison of code-design spectrum
BCP, 2007, and current study design
spectrum for site class C and D are shown in
Figure 11 and Figure 12, respectively. The
comparison shows that the code-based
spectrum significantly predicts the response
at period range 0.01 > T > 0.4s whereas
overpredict for the period range T > 0.4s for
both site classes C and D. This can be
explained by the fact that the code is
generalized on deep sites, which might not be
applicable, as depicted in the current study.
All the profiles used in this study have low
site periods, leading to a high short period
amplification.
The comparison of computed non-linear AF
with those of code-based are summarized in
Table 8 and Table 9. Short period AF, Fa was
underestimated, whereas the long period
amplification factors, Fv, were overestimated
in the seismic provision of BCP, 2007. The
percentage difference calculated by
Equation (4) of short-period amplification
was up to 29.4 % for site class C, with P4
showing the most considerable difference,
while it was up to 25.13% for site class D P6
showing the most considerable difference.
Similarly, the overestimation of long period
amplification was up to 32.5 % for site class
C, with P1 showing the most considerable
difference,
Fig. 9. Profile P3 a) Computed surface response spectra b) Computed non-linear AF factors.
0
1
2
3
0.01 0.1 1 10
Am
plif
ica
tio
n
Period (s)
P3TG
0
0.5
1
1.5
2
0.01 0.1 1 10
Sp
ectr
al a
cc. (g
)
Period (s)
TG P3

-11-
Kuwait Journal of Science
while it was up to 41% for site class D,
with P5 showing the most considerable
difference. The AF's for both short periods
and long periods increase with an increase in
TG.
BCP factor-this studyPercentage difference= ×100
BCP factor (4)
Fig. 10. Calculated site AFs for short and long periods.
0
1
2
3
4
0.01 0.1 1 10
Am
plif
ication
Period (s)
Fa = 1.87 Fv = 1.70
0
1
2
3
4
0.01 0.1 1 10
Am
plif
ication
Period (s)
Fa = 1.7
Fv = 1.66
0
1
2
3
4
0.01 0.1 1 10
Am
plif
ication
Period (s)
Fa = 1.76
Fv = 1.18
0
1
2
3
4
0.01 0.1 1 10
Am
plif
ication
Period (s)
Fa = 1.36Fv = 1.09
0
1
2
3
4
0.01 0.1 1 10
Am
plif
ication
Period (s)
Fa = 1.38
Fv = 1.09
0
1
2
3
4
0.01 0.1 1 10
Am
plif
ication
Period (s)
Fa = 1.28
Fv = 1.08
P1 P2
P3 P4
P5 P6

-12-
Kuwait Journal of Science
Fig. 11. Comparison of code-design BCP-2007 and current study design spectrum for site class
C.
Fig. 12. Comparison of code-design BCP-2007 and current study design spectrum for site class
D.
Table 8. Comparison of short-period amplification factor.
Profile Seismic zone Site
Category
Short-period coefficients
This
study
BCP
(2007)
Percentage
difference
P1
Zone-2B
SC
1.28
1.2
-6.70
P2 1.36 -13.3
P3 1.38 -15.0
P4 1.7 -29.40
P5 SD
1.76 1.4
-25.70
P6 1.87 -25.13
0
0.2
0.4
0.6
0.8
1
0 0.5 1 1.5 2
Sp
ectr
al a
cc (
g)
Period (s)
P1
P2
P3
P4
BCP-2007 (SC)
0
0.2
0.4
0.6
0.8
1
0 0.5 1 1.5 2
Sp
ectr
al a
cc (
g)
Period (s)
P5
P6
BCP-2007 (SD)

-13-
Kuwait Journal of Science
Table 9. Comparison of long period amplification factor.
Profile Seismic zone Site
Category
Short-period coefficients
This
study
BCP
(2007)
Percentage
difference
P1
Zone-2B
SC
1.08
1.6
+32.5
P2 1.09 +31.9
P3 1.09 +31.9
P4 1.66 +-3.75
P5 SD
1.18 2
+41.0
P6 1.70 +15.0
5. Conclusions and recommendation
This study presents the amplification factors
for the shallow sites of Islamabad, Pakistan.
Surface responses were computed by
performing the numerical simulations using
1D-site response analysis software
DEEPSOIL with non-linear MKZ
constitutive model calibrated by generalized
non-linear soil properties of Darendeli, 2001
for the six representative soil profiles with
shallow bedrock from Islamabad.
Following conclusions were drawn from
the study reported in this paper.
1. The short-period amplification was
higher than the extended period due to
shallow bedrock and high impedance
contrast. The AF's for both short periods
and long periods increase with an
increase in TG.
2. The comparison of observed site AF at
the short and long period with the
Building Code of Pakistan (BCP, 2007)
shown that the short period amplification
was underestimated whereas long period
amplification was overestimated, which
can be attributed to the Building Code of
Pakistan (BCP, 2007) being based on
deep sites.
3. There might be a need to adjust the
integration interval for an extended
period of amplification because there is
no significant amplification beyond the
periods of 1.0 or 1.5s in the case of the
shallow sites.
4. The presented amplification factors for
Islamabad's representative sites highlight
the need to revise the Building Code of
Pakistan (BCP, 2007) and develop a new
site classification system and site
amplification factors that account for the
shallow bedrock effect. For the site
conditions similar to the current study's
representative sites, the presented
amplification factors may be used to
develop the design spectrum for the
design of new building structures in
Islamabad; otherwise, it is recommended
to perform site-specific response analysis

-14-
Kuwait Journal of Science
References
Aaqib M. SS; D. Park.; YM.A Hashash. &
M. Pehlivan. (2018) Importance of Implied
Strength Correction for 1D Site Response at
Shallow Sites at a Moderate to Low
Seismicity Region. In: Geotechnical
Earthquake Engineering and Soil Dynamics
V. DOI:doi:10.1061/9780784481462.043
Anbazhagan P; Sheikh MN; Parihar A.
(2012) Influence of rock depth on seismic site
classification for shallow bedrock regions.
Natural Hazards Review 14 (2):108-121.
Ancheta TD; Darragh RB; Stewart JP;
Seyhan E; Silva WJ. et al. (2014) NGA-
West2 database. 30 (3):989-1005.
BCP. (2007) Building Code of Pakistan
2007, Ministry of Housing & Works,
Government of Pakistan.
Borcherdt RD Strong ground motions
generated by the Northridge and Hanshin-
Awaji earthquakes of 17th January (1994)
and (1995); Implications for site-specific
design factors. In: Eleventh World
Conference on Earthquake Engineering,
Procs. (1996).
Charney FA Seismic Loads: Guide to the
Seismic Load Provisions of ASCE 7-10. In,
(2015). American Society of Civil Engineers,
Darendeli MB. (2001) Development of a
new family of normalized modulus reduction
and material damping curves. The University
of Texas at Austin (UTA).
Dobry R; Borcherdt R; Crouse C; Idriss I;
Joyner W. et al. (2000) New site coefficients
and site classification system used in recent
building seismic code provisions. Earthquake
spectra 16 (1):41-67.
Farah A; Abbas G; De Jong KA;
Lawrence RD. (1984) Evolution of the
lithosphere in Pakistan. Tectonophysics 105
(1-4):207-227.
Hashash YMA; Musgrove MI; Harmon
JA; Okan, I; Groholski DR. et al. (2016)
DEEPSOIL, User Manual. 6.1.
Kim D-S; Yoon J-K. (2006) Development of
a new site classification system for the
regions of shallow bedrock in Korea. Journal
of Earthquake Engineering 10 (03):331-358.
Kwok AO; Stewart JP; Hashash YMA;
Matasovic N; Pyke R. et al. (2007) Use of
exact solutions of wave propagation
problems to guide implementation of non-
linear seismic ground response analysis
procedures. Journal of Geotechnical and
Geoenvironmental Engineering 133
(11):1385-1398.
Lee SHHJJotCIoE. (1990) Regression
models of shear wave velocities in Taipei
basin. 13 (5):519-532.
Mahmood I; Qureshi SN; Tariq S; Atique
L; Iqbal MFJPc. (2015) Analysis of
landslides triggered by October 2005
Kashmir earthquake. 7.
Mahmood K; Farooq K; Memon
SAJJoAG. (2016) One-dimensional
equivalent linear ground response analysis—
A case study of collapsed Margalla Tower in
Islamabad during 2005 Muzaffarabad
Earthquake. 130:110-117.
Mahmood K; Iqbal Q; Khan H. (2019) One
Dimensional Non-Linear Ground Response
Analysis-A Site-Specific Case Study of
Peshawar District, Pakistan. Technical
Journal 24 (02).
Matasović N; Vucetic MJJoGE. (1993)
Cyclic characterization of liquefiable sands.
119 (11):1805-1822.
Muhammad A; Shamsher S; Duhee P;
Youssef H; Menzer P. (2018) Importance of

-15-
Kuwait Journal of Science
Implied Strength Correction for 1D Site
Response at Shallow Sites at a Moderate to
Low Seismicity Region. In: Geotechnical
Earthquake Engineering and Soil Dynamics
V. DOI:doi:10.1061/9780784481462.043
Naeem A; Ali Q; Javed M; Hussain Z;
Naseer A. et al. (2005) First report on the
Kashmir earthquake of 8th October 2005.
EERI Special Earthquake Report.
Pehlivan M; Duhee P; Shamsher S;
Hashash Y; Seismic site response of shallow
sites in moderate seismicity regions. In:
Proceedings of the 19th International
Conference on Soil Mechanics and
Geotechnical Engineering, Seoul, Korea.
(2017).
Phillips C; Hashash YMA. (2009) Damping
formulation for non-linear 1D site response
analyses. Soil Dynamics and Earthquake
Engineering, 29 (7):1143-1158.
Raghukanth S. (2008) Ground motion
estimation during the Kashmir earthquake of
8th October 2005. Natural Hazards 46 (1):1-
13.
Sadiq S; Khan U; Alam M; Mandokhail
SJ; Ahmed. (2018) NZ, Ikram A Numerical
Evaluation of Slope Stability measures: A
Case Study of Birham Landslide, Murree,
Pakistan. In: IOP Conference Series:
Materials Science and Engineering. Vol 1.
IOP Publishing, p 012028.
Sadiq S; Mandokhail SJ; Muhammed A.
(2019) Development of Islamabad
Community Geotechnical site database.
(Unpublished).
Shoukat S; Rehman Z; Mahmood K;
Ashraf M. (2015a) Geotechnical Site
Evaluation of Collapsed Margalla Tower in
Islamabad due to October 2005
Muzzafarabad Earthquake. University of
Engineering and Technology Taxila
Technical Journal 20 (3):117.
Shoukat S; Rehman Z; Mahmood K;
Ashraf MJUoE; Journal TTT. (2015b)
Geotechnical Site Evaluation of Collapsed
Margalla Tower Islamabad due to October
2005 Muzzafarabad Earthquake. 20 (3):117.
Sun C-G; Kim H-S; Cho H-I. (2018) Geo-
Proxy-Based Site Classification for Regional
Zonation of Seismic Site Effects in South
Korea. Applied Sciences 8 (2):314.
UBC Uniform building code. In:
International Conference of Building
Officials, Whittier, CA. (1997).
Submitted: 01/05/2019
Revised : 18/03/2020
Accepted : 24/03/2020
DOI : 10.48129/kjsv48i2.7772