research.library.mun.ca · abstract low concentrations of sodium phosphate are added to the boiler...
TRANSCRIPT

CENTRE FOR NEWFOlJNDLAND STUDIES
TOTAL OF 10 PAGES ONLY MAY BE XEROXED
(Without Author's Permission)


1+1 National Library of Canada
Bibliotheque nationale du Canada
Acquisitions and Bibliographic Services
Acquisisitons et services bibliographiques
395 Wellington Street Ottawa ON K1A ON4 Canada
395, rue Wellington Ottawa ON K1A ON4 Canada
The author has granted a nonexclusive licence allowing the National Library of Canada to reproduce, loan, distribute or sell copies of this thesis in microform, paper or electronic formats.
The author retains ownership of the copyright in this thesis. Neither the thesis nor substantial extracts from it may be printed or otherwise reproduced without the author's permission.
In compliance with the Canadian Privacy Act some supporting forms may have been removed from this dissertation.
While these forms may be included in the document page count, their removal does not represent any loss of content from the dissertation.
Canada
Your file Votre reference ISBN: 0-612-93030-0 Our file Notre reference ISBN: 0-612-93030-0
L'auteur a accorde une licence non exclusive permettant a Ia Bibliotheque nationale du Canada de reproduire, preter, distribuer ou vendre des copies de cette these sous Ia forme de microfiche/film, de reproduction sur papier ou sur format electronique.
L'auteur conserve Ia propriete du droit d'auteur qui protege cette these. Ni Ia these ni des extraits substantiels de celle-ci ne doivent etre imprimes ou aturement reproduits sans son autorisation.
Conformement a Ia loi canadienne sur Ia protection de Ia vie privee, quelques formulaires secondaires ont ete enleves de ce manuscrit.
Bien que ces formulaires aient inclus dans Ia pagination, il n'y aura aucun contenu manquant.

SYNTHESIS AND SOLUBILITY OF NICKEL AND IRON "HIDEOUT" REACTION
PRODUCTS WITH AQUEOUS SODIUM AND AMMONIUM PHOSPHATE UNDER
St. John's
STEAM GENERATOR CONDITIONS
by
© Rosemarie Gail Harvey
A thesis submitted to the
School of Graduate Studies
in partial fulfillment of the
requirements for the degree of
Master of Science
Department of Chemistry Memorial University ofNewfoundland
July 2003
Newfoundland
ABSTRACT
Low concentrations of sodium phosphate are added to the boiler water of electric
power stations as a means of controlling pH. Hideout is the phenomenon by which
sodium phosphate is observed to be retained in the boiler during conditions of high
temperature and pressure, only to be released back into the water upon cooling. All
volatile amine treatment is an alternative boiler water pH control method, without the
same adverse effects, but it is not known if problems will arise from a changeover from
congruent phosphate control to all-volatile treatment. The objective of this research was
(i) to develop improved synthetic methods for the known hideout reaction products,
maricite, NaFenP04, and sodium iron hydroxyl phosphate (SIHP), Na3Fe111(P04)z·
(NawH2130), (ii) identify any ammonium-iron-phosphate reaction products that may form
during the changeover, and (iii) measure the solubility of the hideout reaction product
sodium-nickel-hydroxy-phosphate (SNHP), Na2Ni(OH)P04, so that a thermodynamic
database can be derived.
The syntheses ofthe solid reaction products were carried out in 45 mL Parr 4744
Teflon-lined stainless steel reaction vessels which allowed in situ filtration of the
products from solution by inversion ofthe vessel, allowing the remaining solution to
drain through a stainless steel mesh. Maricite was synthesized using previous established
methods, whereas new methods for synthesizing SIHP from thermal decomposition of
iron(III) nitrilotriacetic acid, and chelates, iron oxalate and iron tartrate, have been
developed. A new hydrothermal synthesis for (NH4)FenFem(P04)2 has been developed
11

by thermally decomposing the chelate, iron tartrate. An additional ammonium reaction
product, (NH4)Fe11(P04)·H20, was synthesized from the iron nitrilotriacetic acid
complex. This provided a new synthetic route for this compound and proved that it
formed under boiler conditions. The crystal structure of (NH4)Fe11(P04)·H20 was also
confirmed. The major sodium-nickel-phosphate reaction product Na2Ni(OH)P04, was
synthesized by two separate methods, from nickel oxide and from the thermal
decomposition of the nickel nitrilotriacetic acid complex.
Solubility studies ofNa2Ni(OH)P04, SNHP, were carried out in a modified 450
mL Parr 4562 stirred zirconium reaction vessel, according to the following reaction:
Kinetic experiments were conducted at 250 °C to ensure equilibrium had been reached
and solubility data were collected over the temperature range 235-280 °C at a sodium/
phosphate mole ratio of2.5 that had an initial phosphate concentration of 1.5 mol·kg-1.
The MUL TEQ chemical equilibrium program was used to calculate the composition
concentrations of relevant species at each temperature studied, and experimental
equilibrium constants were calculated from the activity coefficient model used in
MULTEQ. The results were used to create a thermodynamic model for SNHP, consistent
with the Helgeson-Kirkham-Flowers model for the standard partial molar properties of
aqueous phosphate species.
111

In conclusion, the maricite synthesis reported by Quinlan (1996) was reproducible
and SIHP was synthesized from similar conditions as the maricite synthesis and using the
analogous chelate decomposition reaction. Ammonium-iron-phosphate reaction products
can form under boiler conditions; those identified in this study were (NH4)Fe11Fe111(P04) 2
and (NH4)Fen(P04)-H20. The major sodium-nickel-phosphate reaction product
synthesized was Na2Ni(OH)P04 and the data from this study and that previously reported
for this reaction product, were used to create a thermodynamic model for this system,
consistent with the database for sodium-iron hideout reactions.
lV

ACKNOWLEDGEMENTS
I would like to thank Dr. Peter Tremaine foremost for the support, guidance, and
patience over the last three years. Dr. Tremaine's move to a different province this past
year has made things a little more difficult and complicated, but I would like to thank him
for sticking with me and believing that I will come through in the end. My thanks also
goes out to Dr. Liliana Trevani for all the help she gave me during my first year in the
Tremaine group and to Dr. Richard Bartholomew for being there whenever I had
problems with my experiments and analysis, and also for being a friend for the past two
years. Without the friendship and guidance from my fellow co-workers, my time in the
lab would not of been so enjoyable. Thanks to Wanda Aylward, Jenene Roberts, Chris
Collins, Kia Zhang and Dr. Rodney Clarke for all the great times.
I would like to thank my supervisory committee, Dr. Graham Bodwell and Dr.
Raymond Poirier, for all their help and advice. Being a student at Memorial University
during my undergraduate and graduate programs, I've had the pleasure of coming to
know many of the faculty and staff in the Chemistry Department and it has greatly helped
me throughout my time here. I would especially like to mention Dr. Laurie Thompson
for giving me the opportunity to study in his laboratory before moving on into my
Masters program. Thanks to Dr. Peter Golding for sparking my interest in chemistry and
always showing me friendship whenever we had the chance to meet during the years.
You may be retired but you are not forgotten. And I would also like to thank Dr. Brian
v

Gregory for his kindness and making me feel that he was always available whenever I
needed to talk.
I would like to thank a few people who were instrumental in completing my
graduate program. ICP-ES analyses were done by Chris Finch of the Newfoundland
Department of Mines and Energy, and the single crystal X-ray diffraction structure was
solved by Dr. John Bridson and Mr. David Miller. Maggie Piranian provided training
and assistance with the powder X-ray diffraction, and Lisa Lee provided training and
advice in using the scanning electron microscope. I would like to thank Carl Mulcahy for
his help with my electronic equipment and Randy Thome from the MUN Machine Shop
for all his help in any problems that I came across during my experimental runs, for all
the great conversations that we've had, and for the friendship that we now share.
My family has been most supportive during my university career even at times
when they didn't know exactly what I was studying or how to explain what I was doing
to other people. When asked ifl was finished university yet, Mom and Dad would say
no, but soon I hope. So Mom and Dad, I love you and thanks for everything. You can
tell everyone that now, I am finished.
Now for the most important person in my life, my fiancee Jeremy Hughes. I love
you and thank you for all the encouragement and for a shoulder to lean on when things
were not going so well. You gave me the strength to keep going and not give up. This
thesis would not be completed if it wasn't for your love and understanding. I will always
be there for you when you need me just as you have been there for me.
VI

CONTENTS
ABSTRACT .. . ............... . ................................ . ................ . ... . . .. .. ... .. .. .. .. .ii
ACKNOWLEDGEMENTS ........................ . ........ . ....................... ........ .. ...... v
TABLE OF CONTENTS .. ... ....... ...... . ................................ .. . ... . .. .. .. ....... .. vii
LIST OF TABLES . . ........................ ...... .... . ........... .. ... .. . .. ... ... .. .... . .. . .. . .... .. x
LIST OF FIGURES ............ . .. .... ......... . .. ......... .................... .. ... .... . .. . .. . .. ... xi
LIST OF APPENDICES .. .. .. . ..... .. . . .. .......... ... ... .................... . ... . .. ... .. . ...... . xiv
CHAPTER 1.0 INTRODUCTION . ...... .... .... .. ........... . ..... . . ... . .... ... ..... ..... ... .. .... 1 1.1 Hydrothermal Synthesis .... . ......... ... ... .. .. .... ............... .. .. ... .. . ... .. . 1 1.2 Phosphate Hideout in Steam Generators ..... ......... ........ . .. . . ..... .. .. . . .. 3 1.3 Standard State Properties of Aqueous Species and Solids ... .... ...... .... ... 5
1.3.1 Solids . . .. .. ................. . .............. . ........ ........... ... . .. .. . .. .. 5 1.3.2 Aqueous Species ......... .. .. . .. . ......... . ....... . .... ... . . . .. . . . . ...... . 9
1.4 Activity Coefficients in High Temperature Water .. ........ .. ........ .. .. .. . 13 1.5 The Sodium-Phosphate-Water System ...... .... ..... ... . .. .. . . .. . . .. . .. ... . .. 15 1.6 The Sodium-Iron-Phosphate-Water System ....... . .......... .... . . .... .. ... . 20 1. 7 NiO-Sodiurn Phosphate Interactions ........... .. .. . ... . ... . ... . . ......... .. ... 25 1.8 Decomposition of NTA Complexes . .. . .. .... .. .... .. .. ...... .... . .. . ... ... . . 31 1.9 All-Volatile Treatment ..................... . .......... ... .... . .. . . . ... . ... . ..... .33 1.10 Project Objectives .. . ................................ . ......... . .... .. .... . ..... .. 36
CHAPTER 2.0 EXPERIMENTAL . . ............ . ........ . ... . ..... .. ............. . ..... . ... . .... 38 2.1 Chemicals and Materials ... .. ......... . .. . .. . .. . ..... . .. . .. . . . ... . .... ....... ... . 38 2.2 Apparatus ........ ....... . . ... .. ... . ......... ..... . . . .... .. .... ... .. . .... .. . . . .. .... 39
2.2.1 Teflon-Lined Filtration Cells ..... ............. .. ... .. . .. . ... ...... .... 39 2.2.2 Stirred Reaction Vessel . .................................... . .... .. .... .40
2.3 Analytical Methods .... . ........ . .......... .. .. . . . ... . .. . . .. . .. . . .. . .......... .... 45 2.3.1 Powder X-Ray Diffraction . .. . . .. .. . .. . .. .... ........ .. ........ . ... .. . .45 2.3.2 Single Crystal X-Ray Diffraction . ...... .. ...... . .. . . .. . .. . .. ........ .46 2.3.3 ICP Emission Spectroscopy ....... . . . .... . ............... . ........... . .46 2.3.4 Electron Microscopy . . . .......... . . . . . ... .. .... . ... .... .. ... .... .... . . . .47
2.4 Synthesis and Characterization of Hideout Reaction Products .... .. .. .... .48 2.4.1 Experimental Design .. . . . . ..... . ... . . . . . .... ... ... . . . . .. . .... . ..... .. .. .48 2.4.2 Synthesis ofMaricite (NaFenP04) .. ..... . ...... ... .. ..... .... ..... ... . 50
Vll

2.4.3 Syntheses of Sodium Iron Hydrox6. Phosphate ("SIHP") .......... 51 2.4.3 .1 Iron Nitriloacetate (F e1 1NT A) Experiments .... ....... .51 2.4.3.2 Iron Tartrate (Fem2(C4~06)3) Experiments ....... . .... 52 2.4.3.3 Iron Oxalate (Femz(Cz04)3·5H20) Experiments ...... . 53
2.4.4 Syntheses of Ammonium Iron(II,III) Phosphate ((NH4)FenFe111(P04)2) ... . . ... .. . ....... . ... . ....... . . . . .. . ............... 53 2.4.4.1 Hematite Experiments ......................... . ... . ....... 53 2.4.4.2 Iron Tartrate Experiments ... .............. ................ 54
2.4.5 Synthesis of Ammonium Iron Phosphate Hydrate ((NH4)Fe11(P04)·HzO) .. .................. ........ ........... .. ... . ...... 55 2.4.5.1 Iron Nitriloacetate Experiments .......................... 55
2.4.6 Syntheses ofNazNi(OH)P04 ("SNHP") .............. . ............ ... 56 2.4.6.1 Nickel Oxide (NiO) Experiments ......... .............. 56 2.4.6.2 Nickel Nitriloacetate (H+[NiNT A-]) Experiments ..... 57
2.5 Solubility Measurements on Sodium Nickel Hydroxy Phosphate in the Stirred Reaction Vessel ................... .... ............... .. .... .. ..... . . .. ... 57 2.5.1 Kinetics .... ... . ...... .. ..... ... ........... ....... ... .. .. ..... .... .. .... . .. 57 2.5.2 Solubility vs Temperature ..... ............. . ................... ....... . 59 2.5.3 Recovery of the Equilibrium Solid Reaction Product ...... .. ....... 61
CHAPTER 3.0 HYDROTHERMAL SYNTHESIS OF HIDEOUT REACTION PRODUCTS ...................................................................... 63
3.1 Maricite .... .................. . .... . ... . .. . ... .. . .... .. ............................... 63 3.2 SIHP .................................................................... ..... .. ...... 65
3.2.1 The FemNTA Reaction ................................................. 65 3.2.2 The Fe111z(C4H406)3 Reaction ...... ...................... .. . .......... .. 69 3.2.3 The Femz(Cz04)3·5Hz0 Reaction ............. ... ... ..... .............. 70
3.3 (NH4)Fe11Fe111(P04)2 ... . ........... ......... ..... ..... ...... ......... .. ............ 72 3.4 (NH4)Fe11(P04)-HzO . . ................................ . ... ............ .............. 77 3.5 SNHP ............................................ ......... .... ........ ... . ........... 82
3.5.1 The NiO Reaction ......................................... .. ............ 82 3.5.2 The H+[NiNTA-] Reaction ...... . ....... .... .. .... . . ...... ............. 86
CHAPTER 4.0 SOLUBILITY AND REACTION KINETICS OF SODIUM NICKEL HYDROXY-PHOSPHATE .................................... ....... ... . .. ... 90
4.1 Solubility of Nickel Oxide-Sodium-Phosphate Reaction .... ........ .. . ...... 90 4.2 Kinetics ofNa2Ni(OH)P04 Equilibration ...................................... ... 92 4.3 A Thermodynamic Model ..................... .... .... . .. ... .... .. ................ 96
4.3.1 Phosphate Ionization Equilibria .... . ..... . ..................... .... . .. 96 4.3.2 Equilibrium Constants and Thermodynamic Properties of
SNHP ....... . ........ . ...... ... .. .... ...... ...... ...... . ...... . .. . ....... 104 4.4 Comparison with Data From Other Workers .. . ... . . .. .. . ..... . . .. ....... . .. . 115 4.5 Future Work ........................................... . ...... ......................... 119
vm

CHAPTER 5.0 CONCLUSIONS ...... .. . . . ... . .. ..... ........ . . . ...... . ..... . . . ..... . . . . . . ... . 122
CHAPTER 6.0 BIBLIOGRAPHY .... ........ .. .. .. .......... .. ........ ... .... ... ..... .. . .... . 124
APPENDIX 1: Powder X-ray Diffraction Results .... .. .. .. . . ...... . ............. . .... . .. ..... 132
APPENDIX II: X-ray Crystal Structure of(NH4)Feu(P04)·H20 .... .. .. .. .. ...... ..... .... 162
APPENDIX Ill: Kinetic and Solubility Data for Na2Ni(OH)P04 Formation Equilibria with Nickel Oxide . . ... . . . ............. . . ........ . ... .. ..... . . ... .. 172
lX

LIST OF TABLES
Table 1.1 Corrosion rates of Inconel Alloy 600 in high temperature phosphate solutions compared with those of other alloys ......... ........ 35
Table 3.1 Positional parameters for (NH4)Fen(P04)·H20 from single crystal analysis . . . . . . . . . . . . . . . . . . . . . . . . . . . . . . . . . . . . . . . . . . . . . . . ..................... .. . .. ... 80
Table 4.1 Experimental equilibrium constants for the SNHP formation reaction .......... ... . . .. ...................................... ...... . .. .. . . .. . .... . 98
Table 4.2 Standard state properties of the first and second ionizations of phosphoric acid . .. . ..... ........ ...... . .. .. ................................ . . . .. . 99
Table 4.3 Standard state properties of the third ionization of phosphoric acid . .. . . .. . .... ... .. ......................... . ........ .. . . . ... ..... 1 00
Table 4.4 Standard state properties of the dissociation of water ........ . .... .. ...... 1 02
Table 4.5 Standard state properties of aqueous species at 25 °C and 1 bar ........ 106
Table 4.6 HKF equation of state coefficients for aqueous species ..... . ............ 1 07
Table 4.7 Maier-Kelley coefficients for heat capacities of solids ........ . ..... . . . .. 1 08
Table 4.8 Experimental data calculations for the SNHP formation reaction .... . ... 110
Table 4.9 Equilibrium constants for the isocoulombic reaction .. . ............ .. .... 111
Table 4.10 Standard state properties of the SNHP formation reaction ............... 117
X

Figure 1.1
Figure 1.2
Figure 1.3
Figure 1.4
Figure 1.5
Figure 1.6
Figure 2.1
Figure 2.2
Figure 2.3
Figure 2.4
Figure 3.1
LIST OF FIGURES
Two-liquid phase and solution-solid boundaries for aqueous solution mixtures of sodium phosphate salts of mole ratios, Na/P04 from 1.00 to 3.00 at 200-400 °C ............... . ....... ...... ...... .. .... 18
Schematic representation of part of the sodium-phosphate-water isothermal phase diagram near 300 °C ...... .. ...... . ... .. ...... ...... 19
A schematic diagram of the reaction process ofFe"Fem20 4
at 275 °C with varying mole ratios of aqueous Na/P04 solutions .. ...... .23
Approximate stability diagram for the sodium-iron-phosphatewater system, calculated with m(Na +,aq)=0.1 mol·kg-1
,
showing the hideout reaction paths during heating: (a) Na/P04
= 2.0; (b) Na/P04 = 2.2; and (c) Na/P04 = 3.5 ................... . .......... 24
Distribution of nickel(II) ion complexes present in solution at 25 °C (298 K; top) and 287 °C (560 K; bottom) where Na/P04
= 2.3 ....................................................... . ..... . ..... ........... 28
Possible process for dissolution of reaction product formed by NiO and aqueous sodium phosphate (Na/P04 = 2.5) .. . ...... .. . .. ... . . . ... 30
Modified Parr 4744 reaction vessel used for hydrothermal synthesis and in situ filtration ........... .. .......... . ..... . ........... .. .. . .. .41
45 mL Teflon lined cells. On the left, vessels before the reaction, and after the filtration. On the right, vessels during the reaction ........................................................................ 42
Schematic diagram of Parr 450 mL stirred reaction vessel . ........... .... .44
Experimental design for zirconium stirred reaction vessel experiments: Solubility of zirconium oxide reaction products, and nickel oxide reaction products under uncontrolled redox conditions .......... .. ... .. ... ... .... ............... .. ........ ..... . . ... .. ...... .. 60
Scanning electron micrographs of (a) maricite (Quinlan, 1996) and (b) a solid reaction product obtained from FemNTA and aqueous sodium phosphate (Na/P04 = 2.15) at 200 °C for 28 days .... . .......... . . .. .. . . .. .. . . .. . .. . .. . .. . .. . .. ... ... . .. . .. . ... ... ... .... ... 64
Xl

Figure 3.2 Scanning electron micrographs of solid reaction products obtained from FemNTA and aqueous sodium phosphate (Na/P04= 4.0) at 200 °C for 5-14 days [(a) (P04)=0.6 molal, (b) repeat of(a) at a higher Fe/P04 mole ratio, (c) (P04)=l.O molal] ..... 66
Figure 3.3 Scanning electron micrograph of a solid reaction product obtained from iron(III) tartrate and aqueous sodium phosphate (Na/P04 = 2.8) at 200 °C for 3 weeks ......................... ... ............ 71
Figure 3.4 Scanning electron micrograph of a solid reaction product obtained from iron(III) oxalate and aqueous sodium phosphate (Na/P04 = 2.5) at 250 °C for 8 days ........ .. ... .. . . .... ... ............... .. . 73
Figure 3.5 Scanning electron micrograph of solid reaction products obtained from iron(III) tartrate and aqueous ammonium phosphate (NH4/P04 = 1.0) at 250 °C for 1 week [(b) is an enlarged view of(a)] ......... . ... . .............. . . . ...... . ..... . ..... . . . .... . ...... . . . . . .... 75
Figure 3.6 Scanning electron micrograph of a solid reaction product obtained from iron(III) tartrate and aqueous ammonium phosphate (NH4/P04 = 1.0) at 200 °C for 1 week ................... .. .. .... 76
Figure 3.7 Scanning electron micrograph of a solid reaction product obtained from FemNTA and aqueous ammonium phosphate (NH4/P04 = 2.8) at 200 °C for 9 days ......... . ................ .. .. . .. . . ... .. 78
Figure 3.8 Crystal Structure of(NH4)Feu(P04)·H20 ............................ ... .. .. . 81
Figure 3.9 Scanning electron micrograph of a solid reaction product obtained from iron(III) tartrate and aqueous ammonium phosphate (NH4/P04 = 2.8) at 200 °C for 8 days ................... . .. . .. . .. . ....... . .. . 83
Figure 3.10 Scanning electron micrograph of a solid reaction product obtained from nickel oxide and aqueous sodium phosphate (Na/P04 = 2.5) at 250 °C for 1 week .......................................... 85
Figure 3.11 Scanning electron micrograph of a solid reaction product obtained from H+[NiNTA'] and aqueous sodium phosphate (Na/P04 = 2.5) at 250 °C for 4 days .. .. .. ........ .. ........ .. .... .... .. .... .. 87
Figure 3.12 Scanning electron micrographs of solid reaction products obtained from H+[NiNT A'] and aqueous sodium phosphate (Na/P04 = 4.0) for 5 days at (a) 200 °C and (b) 250 °C respectively ..... 89
Xll
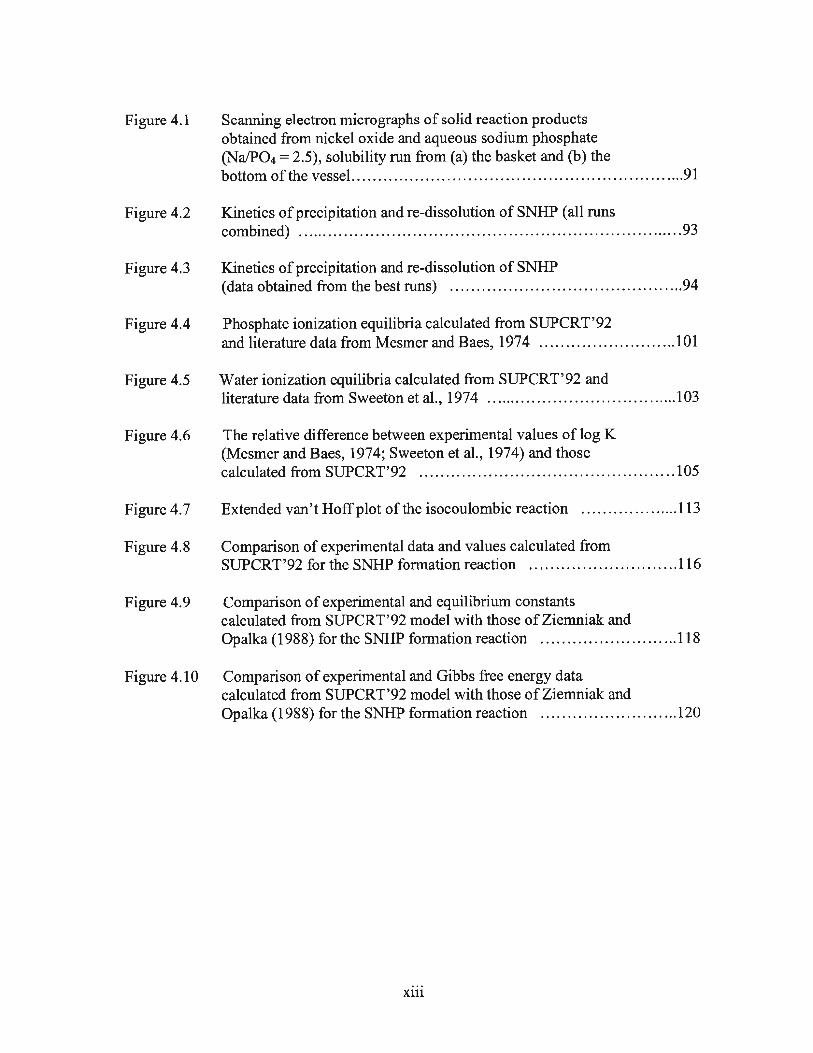
Figure 4.1 Scanning electron micrographs of solid reaction products obtained from nickel oxide and aqueous sodium phosphate (Na!P04 = 2.5), solubility run from (a) the basket and (b) the bottom of the vessel. . ........ ............. ........................ .......... . . .... 91
Figure 4.2 Kinetics of precipitation and re-dissolution of SNHP (all runs combined) .. .... . ........... . ...... ..... . ................. . ... .. .... .. .. . . ...... . .. 93
Figure 4.3 Kinetics of precipitation andre-dissolution of SNHP (data obtained from the best runs) ......... . ............. .. . .. .. .. ......... ... 94
Figure 4.4 Phosphate ionization equilibria calculated from SUPCRT'92 and literature data from Mesmer and Baes, 1974 .. . ... . .... .. . ..... . ...... 101
Figure 4.5 Water ionization equilibria calculated from SUPCRT'92 and literature data from Sweeton et al., 197 4 ....... . ........ ............. . . ...... 1 03
Figure 4.6 The relative difference between experimental values of log K (Mesmer and Baes, 1974; Sweeton et al., 1974) and those calculated from SUPCRT'92 .. ... ............... .. .. . . . . .. .. . .. . .. . .... . . . .. 105
Figure 4.7 Extended van't Hoff plot of the isocoulombic reaction . ... . ........... .. . 113
Figure 4.8 Comparison of experimental data and values calculated from SUPCRT'92 for the SNHP formation reaction .. ... ........ .. . . .. .. ... .. .. 116
Figure 4.9 Comparison of experimental and equilibrium constants calculated from SUPCRT'92 model with those ofZiemniak and Opalka (1988) for the SNHP formation reaction ........ . .. . . .. .. . ... . .. .. 118
Figure 4.10 Comparison of experimental and Gibbs free energy data calculated from SUPCRT'92 model with those of Ziemniak and Opalka (1988) for the SNHP formation reaction .. . .. . ..... . .. .. ... . ...... 120
Xlll

LIST OF APPENDICES
APPENDIX I Powder X-ray Diffraction Results ....................... . ... .. ....... 132
APPENDIX II X -ray Crystal Structure of (NH4)F eu(P04)r H20 .... . .. ..... ........ 162
APPENDIX III Kinetic and Solubility Data for Na2Ni(OH)P04 Formation Equilibria with Nickel Oxide ............. . ................... . . . . . .... 172
XIV

1.0 INTRODUCTION
1.1 Hydrothermal Synthesis
In the last thirty years, the chemistry of inorganic and organic systems under
hydrothermal conditions has received increasing interest from researchers in many
different fields of scientific studies. The first definition for the term "hydrothermal" was
proposed by Sir Roderick Murchison (1840s) who described it as the action of water at
elevated temperature and pressure in bringing about changes in the earth's crust leading
to the formation of various rocks and minerals (Byrappa and Yoshimura, 2001). Byrappa
and Yoshimura (2001) proposed the basic definition that a hydrothermal reaction is "any
heterogeneous chemical reaction in the presence of a solvent (whether aqueous or non
aqueous) above room temperature and at pressure greater than 1 atm in a closed system".
The first use of experimental hydrothermal techniques came from a geological point of
view, to understand natural mineral formation in the presence of water under high
temperatures and pressures. Researchers have now developed a wide variety of pressure
vessel equipment to simulate these natural processes in the laboratory under
hydrothermal conditions (Ulmer and Barnes, 1983).
The first successful commercial application of hydrothermal techniques was the
use ofNaOH to leach bauxite as a process for obtaining pure aluminum hydroxide which
could then be converted to pure A)z03 suitable for processing to metal (Goranson, 1931 ).
Such "pressure leaching" processes were widely used today for a large variety of metals
(Habasi, 1994). Hydrothermal techniques have also been used for the synthesis oflarge
1

single crystals of quartz (Nacken, 1946), zeolites (Barrer, 1948), and other minerals for
use as gemstones or advanced materials. Modem methods for the hydrothermal synthesis
of single crystals are summarized by Byrappa et al. (1994). In the last decade, new
homogeneous precipitation methods have been developed as a means of synthesizing
monodisperse crystallites by decomposing aqueous solutions of metal chelates under
hydrothermal conditions (Booy and Swaddle, 1978; Bridson et al., 1998). In this project,
this method was utilized to synthesize the desired sodium metal phosphate and
ammonium metal phosphate reaction products that can form under boiler conditions.
All hydrothermal systems are closed. Therefore one can study the influence of
temperature, pressure and composition separately which help to understand phase
behaviour, and fundamental solution chemistry in many aqueous inorganic systems.
Interest in this area has also led to many studies in the solubility, kinetics, and
thermodynamics of crystal growth. Advances in apparatus used in this area of research
have contributed to the increasing popularity of the hydrothermal technique, among
physical chemists. Studies on aqueous systems at high temperature and pressure have
been done using conductivity, potentiometric, spectrophotometric, solubility, PVT and
calorimetric, neutron diffraction, EXAFS, and other related methods (Byrappa and
Yoshimura, 2001).
In this work, we want to observe "hideout" behaviour under boiler conditions.
Low concentrations of sodium phosphate are added to the boiler water of electric power
stations as a means of controlling pH. Hideout is the phenomenon by which phosphate in
the water is observed to be retained in the boiler during conditions of high temperature
2

and pressure, only to be released back into the water upon cooling. Several workers have
used boiler tube simulators, flow systems, or batch systems under a range of conditions in
this area of research (Straub, 1950; Pollard and Edwards, 1963; Economy et al. , 1975;
Balakrishnan, 1977; Wetton, 1980; Ziemniak et al., 1981; Connor and Panson, 1983;
Tremaine et al., 1992, 1993, 1996, 1998). In our studies, we incorporated simple acid
digestion bombs for hideout product syntheses and stirred autoclave systems for kinetic
and solubility experiments.
1.2 Phosphate Hideout in Steam Generators
Before the 1970s, sodium-phosphate treatments had been successfully used for
the control of pH and scale formation in steam generating stations with little
understanding of how the physical chemistry of the system worked. In the early 1970s
many power stations were beginning to see thinning of boiler tubes and pressure-tube
denting which eventually led some power stations to replace their current sodium
phosphate treatment with all-volatile treatments (A VT).
What was happening to these boiler tubes could be attributed to phosphate
hideout. Studies by Panson et al. (1975), Broadbent et al. (1977), and Taylor et al. (1979)
have shown that hideout can be caused by the precipitation of sodium phosphate phases
under scale deposits, in crevices, and in other local hot spots. Because of the incongruent
precipitation of acidic phosphate salts, the basicity of the boiler water greatly increased
when hideout occurred at high sodium phosphate mole ratios (Na/P04 > 3.0), eventually
leading to the boiler tube damage described above. The introduction of "congruent"
3

phosphate control in the 1980s was intended to keep low concentrations within an area of
the sodium-phosphate-water phase diagram that would avoid pH excursions, even at
temperatures greater than 300 °C (Panson et al., 1975; Aschoff et al., 1986).
In order to investigate the chemistry involved, Economy et al. (1975) and Conner
and Panson (1983) studied the effects that aqueous sodium phosphate had on metal
oxides at temperatures up to 315 °C. The metals involved were those typically used in
the construction of boiler tubes. However, modem steam generators operate at higher
temperatures and pressures than 315 °C. Tremaine et al. (1993) extended the
experimental temperature range up to 360 °C for magnetite and three of the major
components of sludge, Cu, NiO, and ZnO. The same results were observed in both
studies, the metal oxides reacted with sodium phosphate to produce phosphate-metal
corrosion products.
Two of the major corrosion products that were observed when magnetite, iron,
and carbon steel were exposed to concentrated phosphate at temperatures greater than
200 °C were "maricite", NaFe11P04, and sodium iron(III) hydroxyphosphate "SIHP",
Na3Fem(P04)2-(N~t3H2130). Recent work in our group (Bridson et al., 1998; Tremaine et
al., 1998) resulted in the development of a chemical equilibrium model and database for
predicting the precipitation of these iron compounds.
The objective of this project is to investigate phosphate hideout under conditions
associated with the changeover from congruent phosphate treatment to A VT at the Point
Lepreau nuclear station. Most modem nuclear stations operate at temperatures as high as
300 °C and pressures as high as 200 bars, and use volatile amines as chemical additives to
4

control impurities and pH in boiler water. However, recent experience has shown that
severe corrosion damage can occur during changeover as the result of incongruent release
of sodium-phosphate hideout reaction products, and subsequent reactions with the
protective transition metal oxide layer. Therefore the purpose of this research is to
identify solid reaction products that could form under typical phosphate hideout
conditions with Inconel Alloy 800 in Candu boiler tubes by both powder and single
crystal XRD analysis, and to determine equilibrium constants for sodium nickel
hydroxyphosphate "SNHP", Na2Ni(OH)P04, which is one of the major nickel reaction
products known to form at steam generator temperatures (Ziemniak, 1988).
1.3 Standard State Properties of Aqueous Species and Solids
1.3.1 Solids
Gibbs energies of reaction for the formation and dissolution of solid reaction
products, ~rGr,p0, are calculated from the standard Gibbs energies of formation ofthe
solid, aqueous, gaseous reactants and products. These are represented by the following
equation (Atkins, 1993):
The enthalpies of formation can be represented by a similar equation. Using the
following solubility reaction as an example:
5
(1.1 )

(1.2)
the standard Gibbs energies and enthalpies of formation ofthe species AzB(s) at high
temperature and pressure are calculated from the elements at the same temperature and
the reference pressure, Pr (1 bar):
(1.3)
~ H 0 = H 0 -2H0 -H 0
f A2B,T,p A2B,T,p A,T ,p , B,T ,p, (1.4)
The standard partial molar entropies, isobaric heat capacities, and volumes of
minerals, gases, and aqueOUS Species are designated by S0p,T, C0
p,T, and V0p,T,
respectively. Gibbs energy, enthalpy, and entropy are related through the following well-
known equation:
(1.5)
The heat capacity of formation ~tCp,T o and the volume of formation ~rV0 are used in the
expressions for the high temperature thermodynamic properties in Equation (1 .5). The
standard Gibbs free energy at a specified temperature can be calculated from the
following equation:
6

T T ~ co P
~1G;,p =!'J.1 G;,,p, -!'J.1S;~ ,p, (T-Tr)+ ftJ. 1C;dT-T f ~ p dT+ ftJ.1V0
dp (1.6) Tr Tr Pr
at some reference temperature and pressure. The value for the heat capacity of a solid
can be represented by the Maier-Kelly equation (1932):
c; =a+ bT + cT-2 (1.7)
where a, b, and c are constants. More complex equations are also used (Anderson and
Crerar, 1993), for example:
(1.8)
and
(1.9)
The volume of a solid can be expressed as:
11
vpo T = vpo T + "!'J.V,O ' T'f ~ I
(1.1 0) i=l
where V0 designates the standard molal volume of the specified solid at the subscripted
7

pressure and temperature, and llV1° represents the change in standard molal volume I
associated with the ith of then solid/solid phase transitions (t) that occur along the
straight-line p-T path from Pr,Tr to p,T (Johnson et al, 1992; Helgeson et al., 1978).
However, there are only slight variations in volume with changes in temperature and
pressure. Therefore the volume may be assumed to be constant.
The standard molal Gibbs free energies and enthalpies of minerals, gases, and
aqueous species are more conveniently defmed as apparent standard molar Gibbs free
energies (!laG0p,T) and enthalpies (!laH0
p,T) of formation from the elements at the
reference pressure, Pr = 1 bar, and temperature, Tr = 298.15 K (Benson, 1968; Helgeson
et al., 1978; 1981). Using reaction (1.2) as an example, the apparent Gibbs free energy
and enthalpy of formation are defined as:
(1.11)
(1.12)
where !ltG0 and !lrH0 are the standard molar Gibbs free energy and enthalpy of formation
of the species from the elements in their stable phase at the reference pressure (Pr = lbar)
and the temperature (Tr = 298.15 K). The terms a;,T - a;J, and H;,T - H;J, refer to
differences in the standard molar Gibbs free energy and enthalpy of the species from
8

changes in pressure (p - Pr) and temperature (T - Tr)· In comparison with equation (1.6),
the temperature dependence of l:.aGr,p 0 is expressed by the following equation:
T T co P
t:.aG;,p = t:. 1G;"P' - s;"P' (T- T,) + fc;dT- T f; dT + fvodp T, T, Pr
(1.13)
The Gibbs energies of reaction l:.rGr,p 0 can be calculated from the Gibbs free
energies of the elements incorporating the previous Equation (1.13) for each element by:
t:.rG~ = It:.aG;(products)- L t:.aG; (reactants)
= I t:. 1 G; (products) - L: t:. 1 G; (reactants)
(1.14)
The equilibrium constants of a reaction are related to l:.rGr,p 0 , and can be calculated by
the following well known equation:
t:.rGo = -RTinK (1.15)
1.3.2 Aqueous Species
Models for evaluating the heat capacity (Cp 0 ) and standard molal volumes (V0) of
aqueous species have only been developed in the last twenty years because data for Cp 0
and V0 have only recently been determined at elevated pressure and temperature.
9

Because of the experimental difficulties involved in such measurements, semi-empirical
equations are needed to predict the values of these thermodynamic properties at high
temperatures.
The standard partial molar thermodynamic property of an aqueous species is the
sum of the intrinsic properties of the ions involved and that of the electrostatic
contributions from the ion-solvent interactions present (Helgeson and Kirkham, 1976;
Tanger and Helgeson, 1988). The intrinsic properties are normally referred to as a
"nonelectrostatic" or a "nonsolvation" contribution to the equation of state. The Born
model is used to represent the electrostatic or solvation contribution. SUPCRT'92
(Johnson et al., 1992) is an interactive Fortran 77 program that contains a large
thermodynamic database of many minerals, gases, and aqueous species. The revised
Helgeson-Kirkham-Flowers (HKF) equation of state (Tanger and Helgeson, 1988; Shock
et al., 1991) is used by SUPCRT'92 to calculate thermodynamic properties over a range
of temperatures and pressures.
The revised HKF equation of state for standard molal volumes at varying
temperature and pressure can be expressed as:
(1.16)
o [ a2 a3 a4 J [ ,..>~'~ ( 1 )(am) ] V = a+--+-- + + -~+ --1 -1 If/ + P r- e (If/ + P )(r - e) s ap r
(1.17)
where nand s are the non-solvation and solvation parts of the volume equation
10

respectively, ah a2, a3, and~ are species-dependent fitting parameters, 'I' (2600 bars) and
e (228 K) are solvent-dependent parameters, and Q refers to the solvent Born functions
defined by the following equation (E is the static dielectric constant of water):
(1.18)
The remaining ro term is the conventional Born coefficient defined as:
(1.19)
where Z is the charge of the ion, TJ = 1.6603.10-5 cal·m-1·mor1 = 6.9466.10-5 J·m-1·mor1,
and re is an effective electrostatic radius of the ion. The value for re is different for
cations and anions, defined by the expressions re = rcryst + 0.94Z andre = rcryst respectively
(Shock and Helgeson, 1988).
The standard molal heat capacity at varying temperature and pressure can be
obtained from:
c; +· + (T ~'e)' - ( (T ~Te)' )[ a,(p- p,)+ a, In(;: :J ]] + [ wTX + zrr( ~~), -r(! - I)(~~~) J
11
(1.20)
(1.21)

where X and Y are the Born functions associated with heat capacity which are defined as:
(1.22)
(1.23)
At constant pressure, the revised HKF equations ( 1.17) and ( 1.21) become:
(1.24)
c; = c1 + { c2 2 } + wTX
(T-0) (1.25)
Equations ( 1.16) to ( 1.25) are the theoretical basis for the thermodynamic
modeling code used in SUPCRT'92. The heat capacity and volume functions for
aqueous species become a little more complex as compared to solids, resulting in more
complex formulas for standard partial molar thermodynamic properties of aqueous
species. Shock et al. (1992) gives a summary of the references describing the derivation
of these equations, and examples of the practical application of these theories and data to
model equilibrium processes at high temperatures and pressures.
12

1.4 Activity Coefficients in High Temperature Water
In order to describe solubility equilibria at defined molalities, a model is needed
to calculate the activity coefficients of the aqueous species. Using Equation (1.2) as an
example, the equilibrium quotient, Q, is found in the following way:
Q = m(A+,aq)2 .m(B2-,aq)
a(~B,s)
and the equilibrium constant, K, can be written as:
K = m(A+ ,aq)2 .y(A+ ,aq)2 .m(B2- ,aq).y(B 2
- ,aq)
a(~B,s)
1 K 1 Q 1 [y(A+ ,aq).y(B2
- ,aq)l og = og + og
a(~B,s)
The activity of the solid, a(A2B), is usually unity. Since the aqueous molalities are
(1.26)
(1.27)
(1.28)
known, the only remaining variables are the activity coefficients which represent the ion-
ion interactions in solution. For many high temperature systems, the semi-empirical
model reported by Pitzer (1991) can be used to calculate activity coefficients. When
activity coefficients are not known, Lindsay's model (Lindsay, 1989, 1990) can be used
at temperatures in the range of 150-325 °C. This model relates activity coefficients at a
given ionic strength to those ofNaCl. The EPRI computer code MULTEQ (Lindsay,
13

1989; Baes and Lindsay, 1996; Alexander et al., 1989) incorporates Lindsay's model. As
a result, Lindsay's model was used in this study.
Ionic strength is defined by the following equation:
(1.29)
where Zi is the ionic charge and mi is the molality of the ionic species. Activity
coefficients are calculated as follows, according to the Lindsay model (Lindsay, 1990):
where Zi is the charge of ion i. The expression for Y(NaCI) is taken from the Meisner
equation (Alexander and Luu, 1989):
where
logy(Nact) =F(I)= -A/2
l0.~ 10 +log[1+B(1+0.1l)q -B] 1+CI 2
B = 0.75 + 0.065q
-0.028 /!.. C = 1 + 0.0055qe 2
q = 2.95869- 3.21502x1 o-3 tc -1. 7233x1 o-s t~
14
(1.30)
(1.31)
(1 .32)
(1.33)
(1.34)

A= 0.484582 + 0.00158173tc- 2.14065x10⁻⁵ t~ + 2.56199x10⁻⁷ t~
-1.05332x10⁻⁹ t~ + 1.57603x10-'2 t~
and tc is the Celcius temperature.
(1.35)
The properties of water were an important component of the MUL TEQ database
which was used in our study, to calculate equilibrium speciation at high temperatures.
The most important properties ofwater are the osmotic coefficient (<I>) and the activity
(aw), of water. These two properties, which must satisfy the Gibbs-Duhem equation, are
expressed as follows:
<I> -1 = _l_L L~m; [ d lnri J dLmi "m. . d"m. . L... l I L... l l
sol i x
(1.36)
aw = exp(-0.018015<1> ImJ (1.37) sol
where Isolmi is the total concentration of all dissolved constituents in the solution.
1.5 The Sodium-Phosphate-Water System
The complex phase behaviour of the sodium-phosphate-water system below
100 °C has been determined by Van Wazer (1958) and Wendrow and Kobe (1955). At
room temperature, several hydrated phases of the Na2HP04 and Na3P04 salts are present
15

along with two complex salts, Na3P04·12H20·1/4NaOH and Na2HP04·2NaH2P04·2H20,
but these become less stable as temperature is raised, leaving less hydrated and anhydrous
phases above 100 °C. The major phosphate species present in high temperature water are
H2P04-, HPoi·, and Poi·. A complete review of the aqueous chemistry of phosphates
has been reported by Tremaine et al. (1992).
At high temperatures, the solubility and phase behaviour of the monosodium
phosphate system has been studied by Morey (1953) up to 600 °C, whereas that of the di
sodium phosphate system has been extensively studied by Ravich and Scherbakova
(1955), Panson et al. (1975), Broadbent et al. (1977), and Wetton (1981) up to 350 °C.
The tri-sodium phosphate system differs from the previous two systems in that
solubility decreases with increasing temperature above 120 °C. This has been observed
by Schroeder et al. (193 7) and references therein. It was found in the more recent studies
that the stable phase, at temperatures above 200 °C and up to 350 °C, was the solid
solution Naz.s(H30)o.zP04 and not Na3P04 as originally thought. Ravich and
Scherbakova (1955) also reported that the incongruent precipitation ofNa2.8(H30)o.zP04
caused a dramatic increase in pH in the Na3P04·H20 system at mole ratio of Na/P04 ~
2.8. This conclusion about the tri-sodium phosphate system became an important aspect
in boiler water chemistry control.
Broadbent et al. (1977) and Marshall (1982) reported that aqueous systems with
sodium phosphate mole ratios between 1.0 and 2.1, showed a liquid-liquid phase
separation at 275 °C. Marshall and Begun (1989) showed that these liquid phases mainly
16

consist of orthophosphates. The boundaries of the two phase regions are plotted as a
function of temperature in Figure 1.1 along with the solubilites of di- and tri- sodium
phosphate reported earlier.
Incongruent phosphate precipitation is thought to be the cause of pressure-tube
damage observed in some power stations, because of the high increase in pH that resulted
from the hideout process. Observing this, Marcy and Halstead (1964) first recommended
the use of "congruent phosphate" control in the power industry. Congruent phosphate
control maintains a position in the sodium-phosphate phase diagram at (2.2 < Na/P04 <
2.8) by employing low concentrations of sodium phosphate, which would avoid pH
excursions. Further solubility studies on the sodium-phosphate system at higher
temperatures and a wider range of sodium phosphate compositions were done by Panson
et al. (1975), Broadbent et al. (1977), and Wetton (1981). These new measurements and
those by Taylor et al. (1979), extended the phase diagram to include the equilibrium
solids recovered from dry-out experiments as shown in Figure 1.2. Figure 1.2 illustrates
the complex sodium phosphates and pyrophosphates that can exist under boiler
conditions and the region of liquid-liquid phase separation at sodium-phosphate ratios
around 2.0. All these results showed that no excursions to highly acidic or basic
conditions occurred when pure sodium phosphate solutions (2.2 < Na!P04 < 2.7) are
evaporated to dryness, because the solution composition is trapped between the congruent
composition at 2.8 and the invariant point at 2.15. Panson et al. (1975) suggested that
this feature of the phase diagram could be used as the basis for an improved treatment for
17

400.---------------------------------~
-0 () . -- ~-
::::1 ....
350
~ 300 Q.) a. E Q) ....
Supercritical Fluid - co·nc'd liquid
Na/P04= 1.0 -=--=--=----== -=---..3- .------ -.. ··- ...... ---.·· ../., - ·- -- ·- -"1-·;o..;.--, , . .· ·. I I - --- -----~r---T-,
. I J
1 I I I I
I I I I I
I
2 • LIQUID PHASES
Dissolv~d Solid (wt. %)
Figure 1.1: Two-liquid phase and solution-solid boundaries for aqueous solution mixtures of sodium phosphate salts of mole ratios, Na/P04 from 1.00 to 3.00 at 200-400 °C (Marshall, 1982)
18

100~0
NoH2P04 ·NozHPo4 t
Figure 1.2:
Na2HPO 4 ( 29 O•C)
No4 P20 7 (!OO•c)
Schematic representation of part ofthe sodium-phosphate-water isothermal phase diagram near 300 °C (Taylor et al. , 1979)
19

boiler water chemistry control, and coined the term "invariant point" phosphate
treatment.
1.6 The Sodium-Iron-Phosphate-Water System
Power plant boilers would be able to operate using congruent phosphate treatment
(Na!P04 :::: 2.8) without experiencing caustic conditions in their systems if hideout only
involved sodium-phosphate precipitates. However phosphate has been shown to react
readily with metal oxides (Economy et al., 1975; Balakrishnan, 1977; Broadbent et al. ,
1978; Connor and Panson, 1983) and Na/P04 mole ratios can rise to above 3.0.
Therefore a more complex process for phosphate hideout occurs, that includes transition
metal reactions.
The transition metal phosphate compound ludlamite, Fe11HP04, was identified in
boilers as early as 1939 by Partridge and Hall (1939). Kirsh (1964) observed such
compounds as wolfite and triploideite, both with the formula Fen2P04(0H). Around this
time, researchers were observing other hideout products that contained sodium within the
compound as well. The product Na3Fe11(0H)(HP04h was identified by Broadbent et al.
(1978) whereas a related compound NaFem3(P04h(OH)4-2H20 was identified by Harada
et al. ( 1978). One major sodium-iron-phosphate precipitate identified by various
researchers (Pollard and Edwards, 1963; Marcy and Halstead, 1964; Broadbent et al.,
1978; Jonas and Layton, 1988) was maricite, NaFeiiP04. This iron(II) hideout product
was determined to play a major role in phosphate hideout and more recently in the
corrosion behaviour observed in boiler systems (Dooley and Paterson, 1994; Dooley et
20

al., 1994; Dooley and McNaughton, 1996)). Another major product identified around
this time was a brick-red reaction product (Broadbent et al., 1978; Ziemniak et al., 1981;
Connor and Panson, 1983). This precipitate was later abbreviated as "SIHP" for sodium
iron(III) hydroxy phosphate, and Ziemniak and Opalka (1993) proposed that its formula
was NC4Fe(OH)(P04)2·1/3NaOH, however the correct formula was determined by
Bridson et al. (1998), and found to be Na3Fe(P04)2·(N<413H2;30) or Na3Fe111(P04)2·
(Na2(I-x)H2x0) where x = 0.226. Both formulas are similar but not identical.
Using flow experiments, Tremaine et al. (1993) determined the reaction products
of magnetite, FeuFem20 4, in equilibrium with aqueous sodium phosphate at various
temperatures and Na/P04 mole ratios. Their results were consistent with other research at
temperatures below 320 °C (Economy et al., 1975; Connor and Panson, 1983). When the
solubility threshold has been reached, the magnetite reacts to form one or more reaction
products. During phosphate hideout, the aqueous system becomes more basic, whereas
during reverse reaction product re-dissolution, more acidic. The same observations have
been seen in boilers. At 320 °C and Na/P04 < 2.5, the main hideout reaction products
were maricite and SIHP. When the Na/P04 > 2.5, SIHP was observed, along with a
stable solid solution of cubic Na2.6Feo.2P04. Equations for each process can be found in
work published by Tremaine et al. (1993). The results at 350 °C were similar to those
found at 320 °C however SIHP was the major reaction product. The results at this
temperature showed that iron(II) in magnetite was oxidized to iron(III) found in SIHP
according to the following equation:
21

2 Fe11Fern20 4(s) + 26 Na\aq) + 12 HPO/-(aq) + 2 OH-(aq) ~
6 Na3Fem(P04)2·(N<4;3H2130)(s) + H2(g) +4 H20(l) (1.38)
The schematic diagram of the phosphate hideout processes involved can be seen in
Figure 1.3. Extensive damage to the magnetite film covering the boiler tube is observed
at low Na!P04 mole ratios producing maricite and hematite, and an acidic environment.
In the range 2.0 :S Na!P04 :S 3.0, maricite and SIHP are both produced, whereas, at
Na!P04 > 3.0, SIHP is the only reaction product and the presence ofH2(g) produced very
strong reducing conditions and a more basic environment (Tremaine et al., 1998).
Figure 1.4 is a stability diagram that represents the paths of the hideout reactions.
In other words, the diagrams can be used to identify the hideout reactions that occur when
magnetite is exposed to different temperatures and H2 pressures while in equilibrium with
a given sodium phosphate solution, and to understand the effects of redox conditions
arising from hideout processes. Figure 1.4a shows iron(II) being removed from
magnetite to form maricite, thus oxidizing magnetite to form hematite. Figure 1.4c
shows the formation of SIHP and H2. At Na!P04 = 2.2, a true invariant point is observed
in which the four solid phases co-exist, as seen by Figure 1.4b. At this point, the redox
potential is buffered at much lower reducing conditions. Tremaine et al. (1996)
concluded that the redox chemistry of magnetite in boiler water during hideout is
controlled by the sodium phosphate species concentrations, not those of dissolved 0 2 or
redox buffers which were added.
Several chemical equilibrium models have been developed to describe the
22

Na/P04 (aq) < 2.0
2.0 .s Na/PO_. (aq) s 3.0
3.0 < Na/P04 (aq)
Figure 1.3: A schematic diagram of the reaction process ofFeiiFem20 4 at 275 °C with varying mole ratios of aqueous Na/P0 4 solutions (Tremaine et al., 1998)
23

3
2 1 NaiPO,. 2.0 1
0
Jl .... ~
·1
t ·2 ~
-3
-4
Fe20s N ~5 .J:>.
-8 200 225 250
Figure 1.4:
a b 3 3
2 I Nail>oc: 2.2,
2 I N&'PO. • !.sl
Manclte
0
l 1i 0 - ·1 -='it ...,04
~
I :r:
·2 i:i:' -1 J -3
-2
.... Fe,.o. -3
-5
-8 -4 Z75 3oo 325 350 200 225 250 275 300 325 350 20o 225 250 Z75 300 325 11•c tt•c tl OC
Approximate stability diagram for the sodium-iron-phosphate-water system, calculated with m(Na+,aq) =
0.1 mol·kg·1, showing the hideout reaction paths during heating: (a) Na!P04 = 2.0; (b) Na!P04 = 2.2 and (c) Na!P04 = 3.5 (Tremaine et al., 1998)
c
350

solubility and phase relations of precipitates in high temperature water (Alexander and
Luu, 1989; Lindsay, 1989; Greenberg and Moller, 1989; Pitzer, 1986) but more
information was needed before equilibrium models could be developed for this system.
The main source of iron in a boiler system is magnetite, FeuFem20 4, which acts as a
protective coating on carbon steel components and also exists as loose deposits in the
boiler tube. Ziemniak and Opalka (1992, 1993) reported results for the solubility ofSIHP
with magnetite as the iron source but did not measure the hydrogen concentrations
needed for their thermodynamic calculations. Quinlan (1996) avoided this problem by
using excess hematite, Fem20 3, instead ofmagnetite to measure the solubility of SIHP
according to the reaction:
3 Fem20 3(s) + 26 Na+(aq) + 12 HPO/-(aq) + 2 OH-(aq) ~
6 Na3Fem(P04)z·{N3.413H2130)(s) + 5 HzO(l) (1.39)
Tremaine et al. (1998) obtained solubility data for maricite in equilibrium with
Fe11Fem20 4 and at measured hydrogen pressures, and re-fitted the data for SIHP to derive
a new equilibrium constant model based on the Helgeson-Kirkham-Flowers database and
the Miessner activity coefficient model used in MUL TEQ.
1.7 NiO-Sodium Phosphate Interactions
Nickel has been found to exist along with iron oxide solids in solid sludge
deposits from steam generators (Stodola, 1986; Jonas et al., 1987). Nickel can be
25

introduced from stainless steel vessels and piping, and from Inconel tubing. Ziemniak et
al. (1989) investigated the solubility/phase behaviour of nickel oxide in alkaline sodium
phosphate solutions at elevated temperatures. Nickel oxide becomes soluble in high
temperature aqueous solutions according to the following reaction:
NiO(s) + 2 W(aq) ;= Ni+2(aq) + H20(1) (1.40)
The dissolved nickel(II) ion becomes stabilized in aqueous solutions by the formation of
hydroxo-complexes where the nickel can become surrounded by an inner hydration
sphere of six water molecules. As the pH ofthe solution rises, dissociation occurs as
follows:
Ni+2(aq) + H20(1) ;= Ni(OH)\aq) + H\aq) (1.41)
Ni(OHt(aq) + HzO(l) ;= Ni(OH)z(aq) + H\aq) (1.42)
(1.43)
The overall nickel oxide dissolution reaction becomes the following:
NiO(s) + (2-n)H+(aq) ;= Ni(OH)n2-\aq) + (1-n)HzO(l) (1.44)
26

where n equals the ionic state of hydrolysis and can be 0, 1, 2, 3, or 4. If phosphate is
present in the aqueous solution, the nickel-phosphate complex, Ni(HP04), and multiple,
hydrolyzed forms such as Ni(OH)n(HP04)m(Z-n-Zm)+ (n = 1, 2, 3; n + m ~ 6) are possible.
Figure 1.5 shows the distribution ofnickel(II) ion hydrolytic and phosphate-complex
species present in solution at 25 and 287 °C as a function of sodium phosphate
concentration (Ziernniak et al., 1989). It can be seen that phosphate-complexes are the
major nickel(II) ion species in solution at phosphate concentrations> 5 mmol·kg-1•
Ziemniak et al. (1989) also determined that Ni(II)-H2P04 complexes predominate over
the Ni(II)-OH complexes normally present at elevated temperatures, so much so that a
sodium salt of the phosphato-complex can precipitate, rather than nickel oxide.
The major reaction product of aqueous sodium phosphate with nickel under boiler
conditions has been shown to be sodium nickel hydroxyphosphate, Na2Ni(OH)P04
(Ziernniak and Opalka, 1988). The hideout and release behaviour ofNiO is very similar
to that observed for magnetite (Tremaine et al, 1992). Ziemniak and Opalka (1988) have
reported solubility data and structural data for Na2Ni(OH)P04. Ziemniak and Opalka
(1988) suggest that the transformation of nickel oxide to sodium nickel hydroxy
phosphate proceeds by the following reactions:
(1.45)
(1.46)
27

298 K
.a
.6
.2
5 10 20 50 100 200 500 PHOSPHATE CONCENTRATION, mmollkO
Figure 1.5: Distribution of nickel(II) ion complexes present in solution at 25 °C (298 K; top) and 287 °C (560 K; bottom) where Na/P0 4 = 2.3 (Ziemniak et al., 1989)
28

Combining Equations (1.45), (1.46), and (1.4 7) gives the solubility reaction for
Na2Ni(OH)P04(s):
NiO(s) + 2 Na\aq) + HPO/-(aq) ~ Na2Ni(OH)P04(s)
(1.47)
(1.48)
which is believed to be more soluble than SIHP and maricite under boiler conditions. In
the flow experiments reported in the CEA Report (Tremaine et al., 1992), the dissolution
process involves the formation of nickel phosphate, pyrophosphate, or possibly NaNiP04
(Tremaine et al. 1992) according to the following reaction:
2 Na2Ni(OH)P04(s) ~ NaNiP04(s) + NiO(s) + 3 Na\aq) + HPO/-(aq) + OH-(aq) (1.49)
and is schematically represented by Figure 1.6. Whether Na2Ni(OH)P04(s) can form on
Inconel Alloy 800 during the chemistry excursions that occur during iron hideout
reactions is unclear.
Sanz et al. (1999) have synthesized a mixed-anion phosphate,
N~Nis(P04)z(Pz07)z, and reported a crystal structure for this compound along with X
ray diffraction results. Unlike the hydrothermally synthesized Na2Ni(OH)P04, this
29

w 0
Na/P04 = 1.5
·.
NaNiPO 4
NiO
Figure 1.6: Possible process for dissolution of reaction product formed by NiO and aqueous sodium phosphate (Na/P04 = 2.5) (proposed by Tremaine et al. (1992))
Na/P04 = 0

compound was synthesized in a furnace at 900 °C. Another sodium-nickel-phosphate
compound NaNi4(P04) 3 was synthesized by Daidouh et al. (1999) using a sol-gel method
in aqueous solutions at temperatures of 100-800 °C. A crystal structure and X-ray
diffraction data for this compound were also reported. It remains unclear if either
compound could be a possible corrosion product that forms in boilers under hydrothermal
conditions.
1.8 Decomposition of NTA Complexes
The properties and applications of metal chelates have been widely studied and
reported in the literature (Martell and Calvin, 1956; Bell, 1977; Chang et al., 1983, and
references cited therein). Metal chelates can form in aqueous solutions by simple
reactions (Bell, 1977). The most highly effective chelating ligands are
ethylenediaminetetraacetic acid, EDT A, and nitrilotriacetic acid, NT A; and they form
stable, water-soluble complexes with many metal ions. Chelating agents have primarily
been used for the absorption or dissolution of metal oxides (Chang et al., 1983). The
behavior and usefulness of metal chelate decomposition has also been studied as a means
of synthesizing single crystals under hydrothermal conditions (Booy and Swaddle, 1978;
Bridson et al., 1998).
Martell et al. (1975) reported that at high temperatures, NTA is not stable in
aqueous solutions. NTA decomposes through a stepwise decarboxylation reaction.
Equation (1.50) shows that NTA decomposes to give (a) N-methyliminodiacetic acid, (b)
methylsarcosine and (c) trimethylamine (Martell et al., 1975):
31

/CH2COO-
N -CH2COO- --7 "CH2COO-
/CH2COON- CH3
'-... CH2COO-
(a)
..-/ CH2COO-
~ N-CH3 ~
-........ CH3
(b)
/CH3 N - CH3
""-. CH3
(c)
(1.50)
The carbon-nitrogen bonds in NTA do not break, even at very high temperatures. Bell
(1977) reported that over the pH range 4-8, the acid exists almost entirely as compound
(b) at high temperatures. An important property of metal chelates is their resistance to
hydrolytic breakdown, which would prevent deposition of metal hydroxides in aqueous
solution at elevated temperatures (Martell et al., 1975).
Booy and Swaddle (1978) reported a hydrothermal synthesis for magnetite from
the thermal decomposition ofFerrrNTA in the presence of aqueous alkaline solution. This
method yielded uniform single crystals of magnetite, FeuFem20 4, at relatively low
temperature and pressure. The decomposition of the organic ligand created and
maintained a mildly reducing environment, which resulted in the reduction of iron(III) to
iron(II), in forming the magnetite crystallites.
Using a similar approach to that reported by Booy and Swaddle (1978), Bridson et
al. (1998) reported a novel method for synthesizing maricite from the thermal
decomposition ofFemNTA(aq) at 200 °C in aqueous sodium phosphate solution. The
reducing conditions created by the decomposing NTA, were favorable for the synthesis
of maricite. The reaction is represented by the following equation:
32

FemNTA(aq) + HPO/"(aq) + Na+(aq) ~ NaFe11P04(s) +
decomposition products ofHNTA2-(aq)
(1.51)
This method may provide a foundation for a desirable approach for the hydrothermal
syntheses of other crystalline solids that have low oxidation states. This approach was
also used in an attempt to synthesize SIHP, but no suitable oxidizing medium was found
to produce the iron(III) complex (Bridson et al., 1998).
1.9 All-Volatile Treatment
The use of amines as additives for conditioning the secondary circuit of
pressurized water reactors (PWR) is widespread. Ammonia or other amines can reduce
the corrosion of materials in the steam cycle, particularly in regions subject to two-phase
flow-accelerated corrosion (Bursik, 2002). In other words, amines are used in an effort to
reduce corrosion product transport of iron species from tube components made of carbon
steel, released due to flow-accelerated corrosion, into the steam generator. Consequences
of corrosion deposits are drops in steam pressure and, in case oflarge deposits, a
reduction in power output. Moreover, the production of corrosion products and their
subsequent transport from the feedwater to the steam generator tubing has a detrimental
influence on the risk of intergranular stress corrosion cracking (IGA/SCC) of Inconel
Alloy 600 steam generator tubes. In addition to fouling and a decrease in thermal
transfer, corrosion products may partially plug flow holes, leading to flow instability
(Nordmann et al., 2001). Pessall et al. (1977) tested the corrosion resistance oflnconel
33

Alloy 600 and other alloys in sodium-phosphate at the Point Lepreau generating station.
It was found to exhibit similar corrosion behaviour as Inconel Alloy 800 in high
temperature phosphate solutions. Table 1.1 shows the results obtained by Pessall et al.
(1977). It can be seen that the maximum corrosion weight loss observed in Inconel Alloy
600 in saturated phosphate solutions at Na/P04 = 1.6 was also observed in Incoloy Alloy
800, however Incoloy Alloy 800 appears less resistant than Inconel Alloy 600 in
solutions with Na/P04 S 1.6. Observation of the areas of attack on lnconel Alloy 600 in
boilers, have shown the presence of a greenish scale deposit. Pes sail et al. ( 1977)
reported that in their study, samples immersed in solutions with Na/P04 S 1.6, showed
green scale deposits where the sample corroded. In contrast, yellow and yellow-green
scale deposits were observed in Na/P04 = 2 solutions, and brown and grey-black deposits
in Na/P04 > 2.3 solutions. All scale deposits consisted ofNa, P, Ni, Fe, and Cr, and that
the green and yellow scales contained higher concentrations of Fe and Ni. The
precipitation of phosphate salts and their reaction with the metal in the boilers may
account for the observed localized high corrosion rates. Despite these findings, Point
Lepreau generating station has been operating with phosphate treatment for 20 years,
apparently without corrosion, but it is unclear if any corrosion problems will be
encountered during the changeover.
The initial group of plants that switched from phosphate to A VT had many
problems. Changing to A VT introduces a whole new set of operating parameters and
brings up the question as to whether or not the system should be cleaned before a
changeover and, if so, how thoroughly.
34

w VI
Table 1.1 : Corrosion rates of Inconel Alloy 600 in high temperature phosphate solutions compared with those of other Alloys (Pessall et al. , 1977)
Test En11ironment Corrosion Wt Loss Based on Parabolic Relationship (mg/dm2 in 1 yr)
Maximum Na!P Concentration Temp. Exposure lnconel( 1) lnconel(l) lncoloy(J)
(rl (Molality) (C) Time (Hour) 600 690 800 304 ssC4) Crotoy(S)
1.35 6.0 325 312 680 1600 620 2·139 40000 1.6 6.0 325 480 2800 5600 6400 5989 2.0 5.0 325 504 510 600 600 599 2.2 0.18 325 504 86 43 43 257 1600 2.3 5.0 325 451 470 471 1200 11123 6800
1.6 6.0 275 1344 2400 3000 2.3 5.0 275 1226 86 150 260
2.3 0.4 275 1560 540 340
2.6 0.15 275 1176 43 1000 100
( 1 )Ni-15.4Cr-7 .92Fe-0.22Si-0.17Mn-0.15Cu-0.06C-0.007S
(l)Ni-29.82Cr-9.38Fe-0.15Si·0.17Mn-0.03C-0.007S
( J)Fe-21.81 Cr-31.55Ni-0.32Si-0.81 Mn-0.37Ti-0.28AI-0.23Cu·0.03C-0.007S ( 4
) Fe-18. 22Cr-8.93N i-0.49Si-1.89Mn-0.19Cu-0.06C-0.005S-0.022P-0.29Mo-O .11 Co ( 5
)Fe-2.28Cr-0.89Mo-0.25Si-0.42Mn-0.1 C-0.009P

1.10 Project Objectives
The objectives of this project were two-fold; (i) syntheses ofhydrothermal
reaction products that can form under boiler conditions and (ii) kinetic and solubility
studies on Na2Ni(OH)P04 to develop a chemical equilibrium model for the major nickel
sodium-phosphate reaction product.
The first compounds to be synthesized were from the sodium-iron-phosphate
system. One objective was to prove that the maricite synthesis previously reported by
Quinlan (1996) is reproducible and is a reliable hydrothermal means of synthesizing the
iron(II) reaction product. Another was to develop hydrothermal synthetic methods for
producing a reliable means of obtaining crystalline sodium iron(III) hydroxyphosphate,
SIHP.
The second synthetic objective was to determine whether ammonium-iron
phosphate compounds could be produced under all-volatile amine treatment boiler
conditions. Boudin and Lii (1998) showed that a mixed-valence iron phosphate,
(NH4)FenFem(P04)2, can be synthesized by a hydrothermal method at 500 °C using a
sealed gold ampoule. Our experiments were to determine whether it would form under
boiler conditions, to synthesize it using a more simple method, and to identify any other
ammonium-iron-phosphate compounds that can form hydrothermally.
The final system that was studied was the sodium-nickel-phosphate system.
Sodium nickel hydroxy-phosphate, Na2Ni(OH)P04, ("SNHP"), is known to form under
boiler conditions by the reaction ofNiO with aqueous sodium phosphate; thus one
objective was to synthesize a pure sample for calorimetric measurements. The initial
36

route that was taken to synthesize SNHP was to use the homogeneous thermal
decomposition ofH+[NiNTA-] as a nickel source instead ofNiO, in a process similar to
that used for maricite by Quinlan (1996).
Another objective of this study was to undertake solubility measurements on
Na2Ni(OH)P04, in order to develop a chemical equilibrium model for the sodium-nickel
phosphate system. Kinetic and solubility experiments were conducted at elevated
temperatures using excess NiO and aqueous sodium-phosphate. Solution samples were
taken from the system at each temperature increment and analyzed for total sodium and
phosphorus. The results were used to derive thermodynamic data for SNHP, which was
added to the database for "hideout" reactions that take place between transition metals
and aqueous sodium phosphate under steam-generator conditions.
The experimental designs used throughout this project to meet the above
objectives are listed in the following chapter. The remaining chapters of this thesis
describe the results obtained from our studies and the conclusions that can be made from
this project as a whole.
37

2.0 EXPERIMENTAL
2.1 Chemicals and Materials
The sodium-phosphate solutions were prepared from reagent grade Na2HP04
(Aldrich, ACS Reagent Grade, 99 %), NaH2P04 (Aldrich, 99 %), and NaOH (Fisher
Scientific, 50% w/w solution) with Nanopure water (resistivity> 18 MQ em). The
ammonium-phosphate solutions were prepared from reagent grade (NH4)2HP04 (Aldrich,
99 %), (NH4)H2P04 (Aldrich, ACS Reagent Grade, 98+ %), and NaOH solution with
Nanopure water. The concentrations ofthe sodium- and ammonium-phosphate solutions
were determined by mass (i.e. mol·kg-1).
Fem20 3 (Aldrich, 99+ %), Fe2(C4H406)3 (Sigma, 19.0-21.0% Fe),
Fem2(C20 4)3·5H20 (BDH reagent, no purity given), and ~)Fem(S04)2·l2H20 (BDH,
99.0-102.0 %) were the iron sources used in this study. The FemNTA complex used in
this study was prepared according to the following procedure reported by Booy and
Swaddle (1978). Ammonium ferric sulphate (20 g), (NH4)Fem(S04)r12H20 and
nitrilotriacetic acid (8 g), H3NT A were added to 400 mL of deionized water and brought
to a boil for one hour. The following reaction occurred:
(2.1)
The resulting mixture was suction filtered and washed with deionized water. The yellow-
38

green FemNTA complex isolated was transferred to a Petri dish and allowed to air dry
overnight.
The nickel source in this study was NiO (Fisher Scientific reagent grade).
Ni(OH)z (Aldrich, nickel content ~61 %) was also used but only as a precursor in the
synthesis of another nickel starting material used in this study. H+[NiNT A-] was
prepared much in the same way as FemNTA by boiling 3-5 g of nickel hydroxide,
Ni(OH)z with 9 g of nitrilotriacetic acid (Aldrich, 99 % ), H3NTA, in 400 mL of deionized
water for one hour according to the following reaction:
(2.2)
The resulting purple-blue solid was suction filtered, washed with cold deionized water
and dried in air overnight.
2.2 Apparatus
2.2.1 Teflon-Lined Filtration Cells
Parr 4744 general purpose bombs were used to synthesise the solids at high
temperature, with the modifications to the vessels previously made by Quinlan (1996).
These are 45 mL 316 stainless steel pressure vessels with Teflon liners that were widened
to allow for the insertion of an inner Teflon cup with a removable cap containing a
stainless steel filter; dividing the vessel into separate upper and lower compartments. The
39

filters, for use at high temperatures, were purchased from Small Parts Inc. in Miami
Lakes Florida and were made from 316 stainless steel325 mesh.
A schematic diagram of this vessel is shown in Figure 2.1. The design of the
vessel allows in situ isolation of the solid reaction products from the aqueous phase by
simply inverting the cell while in a high-temperature oven. When the vessel is first
placed in the high temperature oven, the solid starting materials are placed in the filter
separating them from the aqueous starting materials in the bottom of the Teflon liner.
Once the vessel is inverted in the oven, the starting materials are allowed to mix, and
after the reaction has come to completion, re-inverting the vessel permits the liquid to
drain through the stainless steel filter, trapping the solid reaction products in the filter.
Figure 2.2 is a diagram of this filtration step.
In addition to the filtration step, in order to avoid refluxing the filtrate and re
dissolving the reaction product, the cell was cooled to room temperature by placing it on
an aluminium plate in cold flowing water so that the lower compartment of the cell was
colder than the top during the cooling process.
2.2.2 Stirred Reaction Vessel
For the kinetic and solubility experiments, a 450 mL Model4562 Parr Stirred
Mini-Reactor was used. The reaction vessel used previously in our lab was made of
Hastelloy C, an alloy with high nickel content. Thus it could not be used in our
experiments because the solubility equilibria being studied involve nickel-containing
phases. Any corrosion of the Hastelloy C vessel would give unreliable kinetic and
40

Figure 2.1
StMICell
~+r-.+-- T8flon Firter Insert
......_.~,__f.,oC,<,.___ Stait'IIU$
Steel FHter
~~~----~Teflon
Uner
Modified Parr 4744 reaction vessel used for hydrothermal synthesis and in situ filtration (Bridson, 1998)
41

Figure 2.2: 45 mL Teflon lined cells. On the left, vessels before the reaction, and after the filtration. On the right, vessels during the reaction. (Quinlan, 1996)

solubility results. A new zirconium vessel and stirrer head was purchased for this study.
A schematic diagram of the reactor system is presented in Figure 2.3. The Parr
4562 Mini-Reactor is rated for a maximum pressure of 1600 psi at 300 °C. The Parr 4843
temperature controller has a microprocessor-based control module, which provided full
PID control with adjustable tuning parameters, with an operating range of 0 to 750 °C.
The system is accurate to ±2 °C and is equipped with two high temperature cut-offs. If
the temperature exceeds the set limit, an alarm light will appear, the lockout relay will be
tripped, and power to the heater around the vessel will be shut off.
Previously, Quinlan (1996) had made modifications to the Hastelloy C vessel
which increased its suitability for his project. Several of the same modifications were
made to the new zirconium reactor. A wider and lower impeller was added to provide
increased agitation, which was intended to reduce deposition of solids. The reactor head
was equipped with a gold lined rupture disk, which is less vulnerable to corrosion and
thus reduces the chance of premature rupture. Before kinetic and solubility experiments,
the zirconium vessel was treated with dilute NaOH to form a protective oxide layer on
the inside of the cylinder and the stirrer head. A condenser was attached to the autoclave
head just before the liquid sampling valve to allow sampling at high temperature. It
consisted of a valve attached to a length of 0.125 inch stainless steel tube inside a 0.25
inch copper tube, and was cooled by cold flowing water. A filter was connected to the
end of the liquid sampling tube inside the vessel which consisted of several layers of 325
mesh 316 stainless steel filters inside a modified 0.25 inch Swagelok union. Quinlan
(1996) showed that this modification should prevent any solid from clogging up the
43

Cooling Loop
Figure 2.3 : Schematic diagram ofParr 450 mL stirred reaction vessel. (Quinlan, 1996)
44

liquid sampling tube and the condenser. However, some carry-over of solid material was
frequently encountered.
Another addition to the system was a stainless steel mesh basket. It was
connected between the two ends of the cooling loop and its purpose was to isolate any
reaction product during the kinetic and solubility experiments for analysis.
2.3 Analytical Methods
2.3.1 Powder X-Ray Diffraction
X-Ray diffraction studies of solid reaction products were performed using a
Rigaku RU-200 X-ray diffractometer (XRD) which was operated at 40 kV and 180 rnA.
It contained a 12 kW rotating anode Cu Ka X-ray source, that scanned the sample at 10°
(29) per minute, and a diffracted beam monochromator. Samples for analysis were
prepared by grinding them to a fine powder ( <1 0 J..lm) with a mortar and pestle, to which
methanol was added, and the resulting mixture was transferred to a slide via a disposable
pipette and allowed to air dry for 15 minutes. A current software version of the JCPDS
database (i.e. ICDD; International Center for Diffraction Database), equipped with the
MDI Jade+ search-match algorithm, was used to identify the XRD powder patterns from
the samples. X-Ray diffraction results of synthesized reaction products are listed in
Appendix I.
45

2.3.2 Single Crystal X-Ray Diffraction
Dr. John Bridson and Mr. David Miller at the Department of Chemistry/MUN
analyzed the structure of the single crystal isolated in this study with a Rigaku AFC6S
diffractometer and a V AX31 00 workstation and the teXsan crystallographic software
package (Molecular Structure Corporation Inc.). A more detailed report of the analysis
can be found in Appendix II.
2.3.3 ICP Emission Spectroscopy
During the kinetic and solubility experiments, liquid samples were taken from the
autoclave at regular intervals and diluted by mass in order to obtain sodium and
phosphorus concentrations between 50-200 ppm. The diluted samples were analyzed
using a TJA Iris HR ICP-OE spectrometer with a TJA 300 sample changer, at the
Department of Mines and Energy by Mr. Chris Finch. The spectrometer was controlled
by ThermoSpec software.
To calibrate the instrument a blank solution was run that contained 0 ppm sodium
and phosphorus followed by a standard solution of 250 ppm sodium and phosphorus.
Two samples of deionized water were then run for baseline measurement, then another
125 ppm standard solution. Each sample was flushed through the sample line for a
minute to remove any possible contaminants before the concentrations of the sample was
measured, and the 125 ppm standard was re-run after every ten samples to ensure the
instrument was giving accurate readings. Included in each batch of unknown samples
were four known standard solutions which provided a second check for instrument
46

accuracy. The results showed that the ICP ES measurements were within 2.4% of the
expected phosphorus concentrations, and 7 % of the expected sodium concentrations.
Each original sample was diluted to give two aliquots within the range 50-200 ppm in Na
and P, and agreement was within ±3 %.
The results that were received from ICP-ES analysis were the elemental
concentrations (ppm) of the diluted samples. Using a Microsoft Excel spreadsheet and
the mass dilution factors of each diluted sample, the sodium and phosphorus molality
concentrations of each original sample taken from the stirred reactor were calculated.
2.3.4 Electron Microscopy
From the synthesis experiments, the solid reaction products of specific interest to
this study were analyzed by scanning electron microscopy (SEM) at an accelerating
voltage of 20 kV in a Hitachi S570 SEM equipped with a Tracor Northern 5500 energy
dispersive X-ray analyzer and a Microtrace Model 70152 silicon X-ray spectrometer,
located in the Department ofBiology!MUN. Detector/sample positioning gave an
effective takeoff angle of 30° and SEM images were recorded on Polariod Type 655
Positive/Negative film. Samples were placed on double sided sticky tabs on aluminium
stubs and carbon coated in a Denton 502A High Vacuum Evaporator before SEM
analysis.
47

2.4 Synthesis and Characterization of Hideout Reaction Products
2.4.1 Experimental Design
In the sodium-iron-phosphate study conducted previously in our laboratory
(Quinlan, 1996; Bridson et al., 1998), the Parr 4744 reaction vessel was modified in order
to isolate SIHP from the reaction mixture because other workers have reported (Taylor et
al., 1979; Broadbent et al., 1978; Tremaine et al., 1993) that it is unstable at temperatures
lower than 180 °C in the presence of water. The experimental design of the reaction
vessel thus prevented the reaction product from coming in contact with liquid water
during the isolation step and also prevented dehydration of the equilibrium phase. The
same experimental design was applied to all the experiments conducted throughout this
study.
The experimental procedure is as follows. The sodium-phosphate or ammonium
phosphate solution was initially placed in the Teflon liner. Because of the thermal
expansion effect, the vessels were not overloaded with solution in order to prevent a
pressure build up. The solid starting materials were added once the Teflon filter cup was
positioned above the level of the solution and a Teflon lid was put into place. The Teflon
assembly was then placed inside the stainless steel pressure vessel to which a corrosion
disc and a rupture disc were added, followed by a stainless steel pressure vessel lid. The
lid was hand tightened and tightened a further 1/8 revolution by a specially designed
pressure vessel wrench. The vessel was then placed in a high temperature oven at either
200 °C or 250 °C and inverted. As seen in Figure 2.2, the solution passes through the
filter and is allowed to react with the solid starting materials once inverted. The vessels
48

remained in the oven for 5 days - 4 weeks, and were shaken periodically. Before being
removed from the oven, the vessels were set upright to filter any reaction product from
solution. This step was done in the oven to prevent hydration of solid reaction products
during cooling.
After filtering for a day, the vessels were carefully removed from the oven. They
were placed on aluminium plates being cooled by cold running water in a sink. This
prevented the solution in the lower part of the Teflon vessel from refluxing and in tum
preventing any solid reaction product in the filter from coming in contact with
condensation and possibly re-dissolve. Solid reaction products were also prevented from
dehydration due to the presence of unsaturated moisture above the filter. After cooling to
room temperature (approx. 2 hrs), the pressure vessels were opened and the resulting
solids and solutions were collected. The solids recovered from the filter were analyzed
by X-ray diffraction, and samples of further interest were analyzed by SEM.
When the solid and aqueous starting materials were originally placed in the
reaction vessel at room temperature, they were separated thus preventing any reaction at
non-boiler conditions. The solid metal-NTA complexes and other starting reactants were
placed on the screen above the solutions, and only when the vessel had reached the
desired boiler temperature, was the vessel inverted, allowing the contents to mix. Any
reaction product eventually isolated would have formed at the boiler water temperature
and not at room temperature. This gives us a more accurate account of what corrosion
products can form at the higher temperatures at which power stations operate.
49

Several solid starting materials were used as a source of iron, including hematite,
ferric tartrate, ferric oxalate, and iron nitriloacetate (Fe111NTA). Nickel oxide and nickel
nitriloacetate (W[NiNT A-]) were the two different solid starting materials used as a
source of nickel. The following sections summarize the synthetic experiments carried out
with the above mentioned solids.
2.4.2 Synthesis ofMaricite (NaFerrP04)
Quinlan (1996) synthesized single crystals ofmaricite using an adaptation of the
procedure reported by Booy and Swaddle (1978) for synthesizing magnetite crystals.
The reducing conditions created by the thermal decomposition of aqueous FemNTA in
the presence of sodium phosphate solution provided the right conditions for
homogeneous nucleation of maricite. The purpose of synthesizing maricite in this study
was to determine whether Quinlan's synthesis is reproducible.
Maricite was synthesized by the same recipe used by Quinlan (1996), in that 0.6 g
ofFemNTA was reacted with 10 mL of0.6 mol·kg-1 sodium phosphate solution with a
Na!P04 mole ratio of 2.15 at 200 °C, according to the following reaction:
FemNTA(aq) + HPO/-(aq) + Na+(aq) ~ (2.3)
NaFe11P04(s) + decomposition products of HNTA2-(aq)
Two additional experiments were attempted with FemNTA in order to observe if
it is possible to synthesis maricite from an initial sodium phosphate solution with an
50
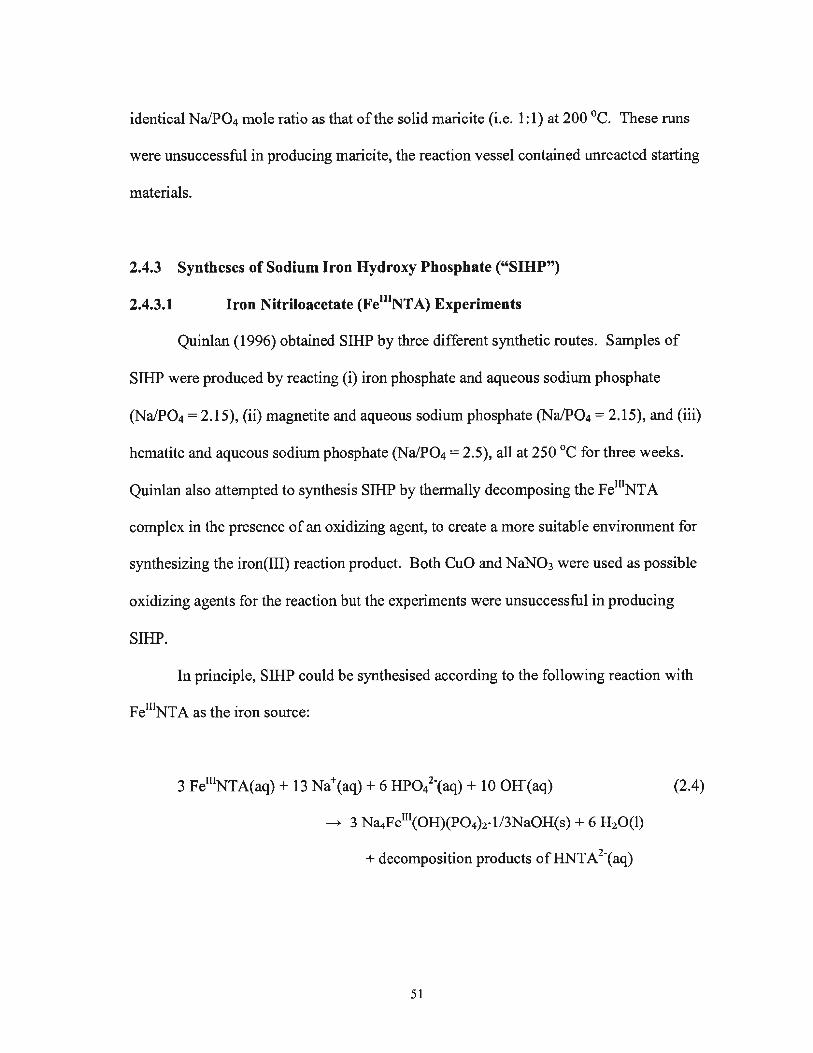
identical N a!P04 mole ratio as that of the solid maricite (i.e. 1: 1) at 200 °C. These runs
were unsuccessful in producing maricite, the reaction vessel contained unreacted starting
materials.
2.4.3 Syntheses of Sodium Iron Hydroxy Phosphate ("SIHP")
2.4.3.1 Iron Nitriloacetate (Fe111NTA) Experiments
Quinlan (1996) obtained SIHP by three different synthetic routes. Samples of
SIHP were produced by reacting (i) iron phosphate and aqueous sodium phosphate
(Na!P04 = 2.15), (ii) magnetite and aqueous sodium phosphate (Na!P04 = 2.15), and (iii)
hematite and aqueous sodium phosphate (Na!P04 = 2.5), all at 250 °C for three weeks.
Quinlan also attempted to synthesis SIHP by thermally decomposing the FemNTA
complex in the presence of an oxidizing agent, to create a more suitable environment for
synthesizing the iron(III) reaction product. Both CuO and NaN03 were used as possible
oxidizing agents for the reaction but the experiments were unsuccessful in producing
SIHP.
In principle, SIHP could be synthesised according to the following reaction with
FemNTA as the iron source:
3 FemNTA(aq) + 13 Na\aq) + 6 HPO/-(aq) + 10 OH-(aq)
--* 3 N~Fem(OH)(P04)r113NaOH(s) + 6 HzO(l)
+ decomposition products of HNT A 2-( aq)
51
(2.4)

In our FemNTA experiments, instead of using oxidizing agents, the sodium-phosphate
mole ratio was increased from 2.15 to 4.0 in order to push the reaction stoichiometry
towards producing the high sodium-phosphate mole ratio observed in SIHP.
Fe111NTA was used as a starting material in 11 runs with sodium-phosphate
mole ratios of 4.0-8.0, and introduced as a solid. The initial masses ofFemNTA were
from 0.16-0.85 g, and the initial concentrations of phosphate were 0.6-1.5 mol·kg-1• Runs
with FemNTA were maintained at 200 or 250 °C for 5-14 days with periodic shaking.
2.4.3.2
It was mentioned in Section 2.4.3 .1, that reactions involving the hydrothermal
decomposition ofF emNT A in the presence of oxidizing agents have been attempted, with
no success in synthesizing SHIP. The next step in our study was to use an iron chelate
source that yielded more oxidizing conditions on decomposition. It was thought that iron
tartrate, Fem2(C4H40 6)3, might be a suitably oxidizing chelate, according to the following
reaction:
Fe111z(C4H406)3(aq) + 9 Na+(aq) + 4 HPO/-(aq) + 2 OH-(aq) ~ (2.5)
2 N<4Fem(OH)(P04)2' 113NaOH(s) + H20(1) + 3 C4H606(aq)
Felll2(C4~06)3 was used as a starting material in 8 runs with sodium-phosphate
mole ratios of 2.15-2.8, and introduced as a solid. The initial masses of iron tartrate
were from 0.39-0.50 g, and the initial concentrations of phosphate were
52

0.6-1.5 mol·kg-1• Runs with Felll2(C4H40 6) 3 were maintained at 200 or 250 °C for 4-22
days with periodic shaking.
2.4.3.3
Iron oxalate was also used as a starting material in order to create a more
oxidizing environment for the synthesis ofSIHP according to the following reaction:
Fem2(C20 4)3·5H20(aq) + 9 Na\aq) + 4 HPO/(aq) + 2 OH-(aq)----+ (2.6)
2 N~Fem(OH)(P04)2·1/3NaOH(s) + 6 HzO(l) + CzHz04(aq)
Fem2(C20 4)r5H20 was used as a solid starting material in 4 runs with sodium
phosphate mole ratios of 2.15-2.8. The initial masses of iron oxalate were from 0.37-
0.41 g, and the initial concentrations of phosphate were 0.6-1.0 mol·kg-1• Runs with
Fem2(C20 4)3·5H20 were maintained at 250 °C, for 8 days with periodic shaking.
2.4.4 Synthesis of Ammonium Iron(II,III) Phosphate ((NH4)Fe11Fe111(P04)2)
2.4.4.1 Hematite Experiments
The first example of a mixed-valence ammonium iron phosphate was synthesised
by Boudin and Lii (1998), and was obtained at very high temperature and high pressure.
This phosphate, ~)Fe11Feiii(P04)2 , was initially synthesized by heating a mixture of
CNH4)H2P04 (0.132 g), (NH4}zHP04 (0.152 g), Fem20 3 (0.032 g), and water (0.3 mL) in a
sealed gold ampule at 500 °C and an estimated pressure of 32000 psi for 24 hours, which
53

was then cooled at 3 °C/h to 250 °C and quenched to room temperature by removing the
autoclave from the furnace. This gave a mixture of black crystals of (NH4)FeiiFem(P04)2
and colorless thin plates. However, hydrothermal treatment of (NH4)H2P04 (0.460 g),
Fem20 3 (0.032 g), FeiiO (0.0288 g), and water (0.65 mL) in a gold ampule under the
same reactions conditions gave a pure product of (NH4)Fe11Fem(P04)2. Boudin and Lii
(1998) obtained a single crystal XRD structure, however they did not report any powder
XRD data for (NH4)FeiiFem(P04)2. Though, through email contact with Dr. Lii, the
complete single crystal XRD data set was provided which was used to generate a powder
XRD spectrum using the SHELXTL software program. No solubility data or
thermodynamic constants were reported however. In this study, attempts to reproduce
ammonium iron phosphate from the hydrothermal methods used in the lab, using roughly
the same starting materials as that ofBoudin and Lii's paper. The purpose was to see if
the mixed valence compound would form under boiler conditions and whether the
synthesis could be done using a more simple method.
(NH4)H2P04 (0.27-0.32 g), (NH4)HP04 (0.30-0.33 g), and Fem20 3 (0.06-0.08 g)
were used as starting materials in 6 runs with varying amounts of deionized water from 2-
10 mL. Syntheses were carried out at 200 °C or 250 °C for 5-7 days with periodic
shaking.
2.4.4.2 Iron Tartrate Experiments
For the same reasons as in the SIHP experiments, similar synthesizes to Boudin
and Lii (1998) were conducted with an alternate iron source, iron tartrate.
54

Syntheses were attempted using ammonium phosphate solutions and iron tartrate,
according to the following reaction:
Fe1112(C4H406)3 (aq) + NH4 + (aq) + 2 HPO/ (aq) + 2 OH- (aq) ---+ (2.7)
(NH4)Fe11Fem(P04)2 (s) + 2 H20 (1) + 3 C4H606 (aq)
CNH4)H2P04 (0.29-0.47 g), (NH4)2HP04 (0.29-0.31 g), and Fem2(C4~06)3 (0.07-
0.08 g) were used as starting materials in 4 runs with varying amounts of deionized water
from 2-10 mL. Runs were maintained at 200 °C for 7 days with periodic shaking.
Fem2(C4H40 6)3 was used as a starting material in 7 runs with ammonium
phosphate mole ratios of 1.00-2.8. The initial masses of iron tartrate were from 0.39-
0.41 g and the initial concentrations of phosphate were 0.6-0.7 mol·kg-1• Runs with
Fe1112(C4H406)3 were maintained at 200 or 250 °C for 4-8 days with periodic shaking.
2.4.5 Synthesis of Ammonium Iron Phosphate Hydrate ((NH4)Fe11(P04)"H20)
2.4.5.1 Iron Nitriloacetate Experiments
Quinlan (1996) synthesized maricite, NaFeiiP04, by thermally decomposing
FemNTA in the presence of sodium phosphate solution. Experiments were conducted by
the same method using ammonium phosphate solution instead; in order to explore the
possibility of synthesizing an ammonium analogue of maricite under boiler conditions,
and obtain a pure compound for calorimetry. The reaction was thought to proceed as
follows:
55

FemNTA(aq) + HPOl(aq) + NH/(aq) ~ (2.8)
(NH4)FenP04(s) +decomposition products ofHNTA 2-(aq)
Fe111NTA was used as a starting material in 13 runs with ammonium-phosphate
mole ratios of 1.0-2.8. The initial masses of iron nitriloacetate were from 0.59-0.75 g,
and the initial concentrations of phosphate were 0.6-0.9 mol·kg-1• Runs with Fe111NTA
were maintained at 200 or 250 °C, for 6-9 days with periodic shaking.
2.4.6 Syntheses ofNa2Ni(OH)P04 ("SNHP")
2.4.6.1 Nickel Oxide (NiO) Experiments
Ziemniak and Opalka (1988) have shown that NiO transforms to a sodium nickel
hydroxy phosphate compound in concentrated sodium phosphate solutions at elevated
temperatures. The following reaction was used for the synthesis of SNHP from nickel
oxide using our experimental design:
(2.9)
Nickel oxide was used as a starting material in 2 runs, with a sodium-phosphate
mole ratios of2.5. The initial masses of nickel oxide were 0.56 and 0.69 g and the
concentration of the phosphate solution were 1.5 mol·kg-1. Both runs were maintained at
250 °C for 1 week with periodic shaking.
56

2.4.6.2 Nickel Nitriloacetate (H+[NiNTA"]) Experiments
An alternate nickel source used in this study was nickel nitriloacetate. The
rationale for using W[NiNTA-] in our experiments was to have a route where Ni(II) was
slowly released into the system and possibly form single SNHP crystals, much like the
studies with Fe111NT A.
Twenty-eight experiments were done with H+[NiNTA-] as a starting material
according to the following reaction:
(2.10)
Na2Ni(OH)P04(s) + H20(l) +decomposition products ofHNTA2-(aq)
The sodium-phosphate mole ratios ranged from 2.0-4.0. The initial masses of
nickel nitriloacetate were from 0.50-1.07 g, and the initial concentrations of phosphate
were 0.6-1.5 mol·kg-1• Runs with H+[NiNTA-] were maintained at 200 or 250 °C for 4-14
days with periodic shaking.
2.5 Solubility Measurements on Sodium Nickel Hydroxy Phosphate in the
Stirred Reaction Vessel
2.5.1 Kinetics
Eight kinetic experiments were attempted in order to determine the time required
for mixtures ofSNHP and NiO to reach equilibrium with aqueous sodium phosphate.
Four of these were stopped due to leaks or clogging of the filter below the sample line.
57

All runs lasted up to 10 days at a time. In two separate runs, the autoclave temperature
was raised to 250 °C, and the kinetics was determined approaching equilibrium from
supersaturated conditions by initiating the precipitation reaction. In the other two runs,
the autoclave temperature was brought up to 275 °C, allowed to reach equilibrium for 4
days and then quickly lowered to 250 °C, in order to determine the kinetics approaching
equilibrium from unsaturated conditions by initiating there-dissolution reaction. The
purpose behind the two different sets of runs was to establish that the reaction was
reversible.
The experiments to determine the kinetics of SNHP formation andre-dissolution
at 250 °C respectively proceeded as follows. An excess of25 g of nickel oxide was
placed in the zirconium cylinder with 240-250 mL of 1.5 mol·kg-1 phosphate solution
with a sodium-phosphate mole ratio of2.5. To ensure that all aqueous nickel species are
in equilibrium with the nickel(II) oxide, an excess of nickel oxide was used in each
experiment. The steam tables ofHaar et al. (1984) were used to calculate the volume of
the solution after thermal expansion, which prevented over-filling of the vessel, and
subsequent pressure release, by the rupture disk. The vessel was then properly
assembled, without over-filling, brought up to the desired temperature, and allowed to
proceed to equilibrium under isothermal conditions. Three samples of 3-4 mL were
withdrawn at regular time intervals, the first of which were discarded to ensure the
sample line was adequately flushed of any previous solution. The remaining samples
were analyzed by ICP ES to determine the molality of aqueous sodium and total
phosphate. In determining the kinetics of SNHP formation at 250 °C, samples were taken
58

regularly over a period of up to 250 hours. For there-dissolution reaction, the pressure
vessel was allowed to remain at 275 °C for 4 days and then the temperature was lowered
to 250 °C, and samples were withdrawn for an additional 240 hours until equilibrium was
reached. The experiments were stopped when sample flow became erratic; indicating the
level of the solution had dropped below the sample tube, or when approximately 140 mL
of solution were calculated to remain in the vessel.
2.5.2 Solubility vs Temperature
Only two temperature-dependant solubility runs were performed. The
temperature was raised in small increments, so that the solutions were supersaturated
with respect to the nickel-phosphate reaction product, but unsaturated with respect to the
zirconium-phosphate reaction product. A schematic plot of equilibrium phosphate
concentration versus temperature for the zirconium oxide-aqueous phosphate and nickel
oxide-aqueous reactions from this study can be seen in Figure 2.4. As shown in the
schematic, large temperature increments could cause the solution to become
supersaturated with respect to the zirconium-phosphate reaction product, and lead to
possible corrosion of the zirconium vessel.
The temperature-dependant solubility experiments were performed in the
following way. As in the kinetic runs, an excess of 25 g of nickel oxide was added to the
zirconium vessel with approximately 250 mL of 1.5 mol·kg-1 sodium phosphate solution
with a sodium- phosphate mole ratio of 2.5. In the first solubility run, the vessel was
raised from room temperature to 235 °C whereas; in the second solubility run the first
59

a.e
) • 0.41 ii .... ~
' 0.2
0.1
Nickel reaction products
0.0 '----L--~--'---'--_....._-.~. __ ..... ___. 180 180 200 220 240 280 280 300
Tempenture/'C
Figure 2.4: Experimental design for zirconium stirred reaction vessel experiments: Solubility of zirconium oxide reaction products, and nickel oxide reaction products under uncontrolled redox conditions. (taken form Quinlan (1996); modified to fit our reaction conditions)
60

temperature approached was 240 °C. The initial analysis of the kinetic data suggested
that 2-2.5 days was sufficient for equilibrium to be achieved. The reaction was allowed
to react for that time with constant stirring at each temperature. Approximately 3-4 mL
of solution was collected to flush the sample line before two 3 mL samples were
withdrawn, and the temperature was raised by 8-10 °C. Again the reaction was allowed
to proceed for 2-2.5 days before the procedure was repeated. As the temperature was
raised, the precipitation of SNHP removed sodium and phosphate from the solution
incongruently, causing the Na/P04 mole ratio to rise. The highest temperature measured
was 280 °C. Higher temperatures were thought to possibly cause corrosion of the
autoclave vessel. Only 5-7 measurements were taken per solubility run because of time
constraints. These temperature-dependant solubility runs typically required two weeks to
complete.
2.5.3 Recovery of the Equilibrium Solid Reaction Product
In each of the four kinetic runs and two solubility runs, it was necessary to
recover some of the solid reaction product for powder XRD analysis in order to confirm
that the correct nickel-sodium-phosphate phase was synthesized and consequently being
measured. A small stainless steel filter basket was placed in between the cooling tubes,
located in the autoclave head. The basket contained NiO which reacted with aqueous
phosphate to form the reaction product. The reaction product was then removed from
contact with the liquid at high temperatures as the removal of samples lowered the level
of the aqueous phase in the vessel below that of the basket. This procedure prevented re-
61

dissolution of SNHP and allowed the equilibrium reaction product to be recovered.
Powder XRD determined the solid was a mixture of SNHP and nickel oxide. Powder
patterns of the solids recovered from the impeller and the bottom of the vessel also
showed SNHP present in high quantities. This confirmed that the correct phase was
produced in all of the kinetic and solubility studies.
62

3.0 HYDROTHERMAL SYNTHESIS OF HIDEOUT REACTION PRODUCTS
3.1 Maricite
The purpose of this set of experiments was to prove that the maricite synthesis
previously done by Quinlan ( 1996) using the hydrothermal decomposition of aqueous
FemNTA, was reproducible.
Product RGH05: The off-white product obtained in this study was analyzed by
powder XRD and identified as maricite. The powder XRD results can be found in Table
A.l.l in Appendix I. The results were compared with powder XRD results for maricite
from Quinlan (1996) and those obtained from the JCPDS database. They were an
excellent match. None of the expected impurities (i.e. NazHP04, Na3P04, Fem20 3,
FeiiFem20 4) were observed (detection limit< 2 %). Figures 3.1a and b show secondary
electron images of Quinlan's maricite product synthesized at 250 °C and the maricite
product obtained in this study at 200 °C, respectively. An identical blossom-like growth
is observed in both figures, indicating the crystals grew out of solution by rapid
homogeneous nucleation. The maricite sample in Figure 3.la was synthesized at 250 °C,
but Quinlan (1996) reported that, single crystals ofmaricite could be isolated when the
reaction was repeated at a lower temperature. In the upper right comer of the SEM image
in Figure 3.1b, a single crystal is observed. It was concluded that single crystals of
maricite can be synthesized at 200 °C.
63

(a)
(b)
Figure 3.1a and b: Scanning electron micrographs of (a) rnaricite (Quinlan, 1996) and (b) a solid reaction product obtained from Fen1NTA and aqueous sodium phosphate (Na/P04 = 2.15) at 200 °C for 28 days.
64

No single crystal XRD was performed on the maricite product since the structure
is known (LePage and Donnay, 1977; Bridson et al., 1998), but the powder XRD analysis
proves that the maricite hydrothermal synthesis is reproducible and that it is a reliable
means of synthesizing maricite.
3.2 SIHP
3.2.1 The FemNTA Reaction
An objective of this study was to develop hydrothermal synthetic methods for
producing a reliable means of synthesizing crystalline sodium iron hydroxy phosphate
(SniP) by decomposing an aqueous complex. FemNTA is known to produce single
crystals of the iron(II) product maricite at 200 °C (Section 3.1). Our first attempt to
synthesize SniP involved decomposing FemNTA(aq) in solutions with a higher sodium
phosphate mole ratio, in order to drive the reaction toward the iron(III) hideout product.
The benefit of using FemNTA is that iron is slowly released into the system over time,
thus providing a better chance of growing single crystals of SIHP large enough for XRD
analysis and to avoid unreacted iron oxide starting materials.
Figures 3.2a, b, and care SEM images of a few of the products obtained from the
attempted syntheses listed in Section 2.4.3. All three experiments produced solids that
were mostly or all red-orange in color, and all were conducted at 200 °C.
Product RGH32B: Figure 3.2a is a SEM image of a sample of SIHP obtained
from reacting FemNTA with aqueous sodium-phosphate (Na!P04 = 4.0, [P04] = 0.6
molal) for 2 weeks. The sample was mostly red-orange solid with traces of black solid
65

(a) (b)
(c)
Figure 3.2a, b, and c: Scanning electron micrographs of solid reaction products obtained from FemNTA and aqueous sodium phosphate (Na/P04 =
4.0) at 200 °C for 5-14 days. [(a) (P04) = 0.6 molal, (b) repeat of (a) at a higher Fe/P04 mole ratio, (c) (P04) = 1.0 molal]
66

throughout the whole sample. No yellow-green starting material could be found visually
or by powder XRD analysis. Table A.I.2 in Appendix I summarizes the powder XRD
results. The powder XRD patterns confirmed that SIHP was the main component, but
showed that magnetite was also present in the sample, which would account for the traces
of black solid observed. The JCPDS database search also identified a few peaks that
matched those found in maricite and Na3P04. But these few matching peaks can also be
found in powder XRD results for SIHP or magnetite. The SEM image showed that the
sample contained thin, needle-like crystals, identified as SIHP. On average the crystals
were 2 jlm thick and 25 jlm long. The SEM elemental analysis confirmed the presence of
iron, sodium, and phosphorus.
The equilibrium reaction between maricite and SIHP that governs which hideout
reaction product will form is as follows:
6 Na3Fem(P04)2·(N34;3H2130)(s) + 2 H20(l) + 3 H2(aq) ;:= (3.1)
6 NaFe11P04(s) + 20 Na\aq) + 6 HPO/-(aq) + 8 OH-(aq)
The equilibrium constant of SIHP reduction to maricite according to the above reaction
IS:
(3.2)
67

and the equilibrium constant for maricite oxidation to SIHP is given by
(3.3)
It was concluded that raising the Na+ concentration was successful in causing SIHP to
precipitate instead of maricite, but it apparently was so high that Na3P04 also
precipitated.
(3.4)
Product RGH59B: In the next set of experiments, the iron to phosphate mole
ratio was increased to Fe/P04 = 4.0 in an attempt to avoid precipitation ofNa3P04 by
reacting more of the phosphate. The reaction conditions listed in the previous paragraph
were kept the same except the reaction time was reduced to 5 days. The recovered
product was a mixture of red-orange, white, and black solids. The powder XRD results
can be found in Table A.l.3 in Appendix I. The powder XRD analysis confirmed that
SIHP was the main component of the sample but maricite and magnetite were also
present, accounting for the white and black solids, respectively. The analysis also
showed that hematite and Na3P04 were again present as minor impurities. Figure 3.2b
shows the SEM image, and the elemental analysis confirmed the presence of iron,
68

sodium, and phosphorus in the reaction product. The SIHP crystals were similar to those
obtained in the previous run, but appear to be about half the size.
Product RGH60A: Another set of experiments was attempted under the same
conditions as the previous synthesis at Na!P04 = 4.0 (Product RGH59B), but this time
with a greater phosphate concentration ([P04] = 1.0 molal). The sample obtained was
red-orange solid with no visible traces of white or black solid and all powder XRD results
are in Table A.I.4 in Appendix I. The powder XRD analysis did not identify maricite,
magnetite, or hematite in the sample, but traces ofNa3P04 and Fe2P05 were identified
from the JCPDS search and match software. The analysis did confirm that SIHP gave an
excellent match. The SEM image (Figure 3.2c), reveals the thin, needle-like SIHP
crystals observed in the other products are not present. However, in the upper right hand
comer of the image, round clumps are found with crystals growing from them in a radial
pattern suggesting that the crystals grew from a fast homogeneous reaction.
Even though the crystals obtained were not large enough to do a single crystal
XRD, it can be concluded from the SEM images and powder XRD analysis, that SIHP
can be synthesized from the thermal decomposition ofFemNTA at a much higher sodium
phosphate mole ratio than in the studies done by Quinlan (1996), but the synthesis yields
a product with a small amount ofNa3P04 precipitate still present as an impurity.
3.2.2 The Fe111z(C4H40 6) 3 Reaction
The second approach used in synthesizing SIHP was an attempt to prevent the
reduction ofFe3+ during decomposition by using a chelate that does not contain amine
69
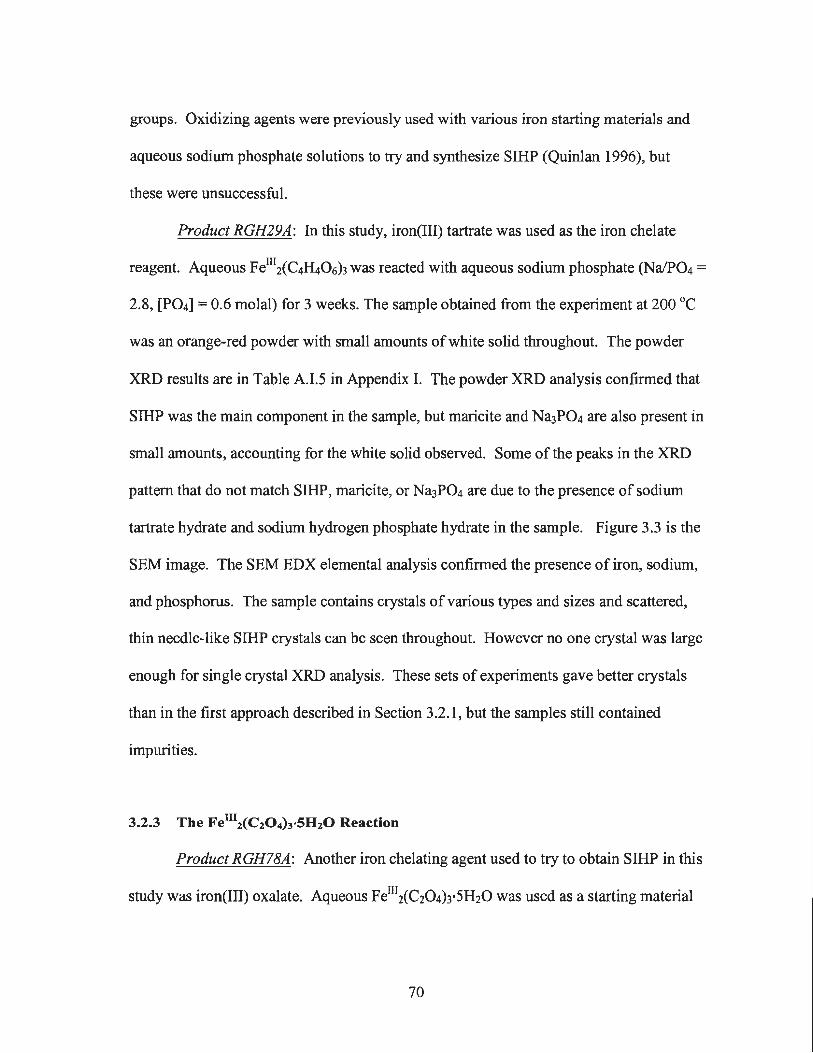
groups. Oxidizing agents were previously used with various iron starting materials and
aqueous sodium phosphate solutions to try and synthesize SIHP (Quinlan 1996), but
these were unsuccessful.
Product RGH29A: In this study, iron(III) tartrate was used as the iron chelate
reagent. Aqueous Fem2(C4H406)3 was reacted with aqueous sodium phosphate (Na!P04 =
2.8, [P04] = 0.6 molal) for 3 weeks. The sample obtained from the experiment at 200 °C
was an orange-red powder with small amounts of white solid throughout. The powder
XRD results are in Table A.I.5 in Appendix I. The powder XRD analysis confirmed that
SIHP was the main component in the sample, but maricite and Na3P04 are also present in
small amounts, accounting for the white solid observed. Some of the peaks in the XRD
pattern that do not match SIHP, maricite, or N a3P04 are due to the presence of sodium
tartrate hydrate and sodium hydrogen phosphate hydrate in the sample. Figure 3.3 is the
SEM image. The SEM EDX elemental analysis confirmed the presence of iron, sodium,
and phosphorus. The sample contains crystals of various types and sizes and scattered,
thin needle-like SIHP crystals can be seen throughout. However no one crystal was large
enough for single crystal XRD analysis. These sets of experiments gave better crystals
than in the first approach described in Section 3.2.1 , but the samples still contained
impurities.
3.2.3 The Femz(Cz04)3-5H20 Reaction
Product RGH78A: Another iron chelating agent used to try to obtain SIHP in this
study was iron(III) oxalate. Aqueous Fe1112(C204)3·SH20 was used as a starting material
70

Figure 3.3: Scanning electron micrograph of a solid reaction product obtained from iron(III) tartrate and aqueous sodium phosphate (Na/P04 = 2.8) at 200 °C for 3 weeks.
71

and reacted with aqueous sodium phosphate (Na/P04 = 2.5, [P04] = 1.0 molal) at 250 °C
for a period of 8 days to produce a red-orange, crystalline solid. The powder XRD
results are listed in Table A.I.6 in Appendix I. No evidence for unreacted starting
material could be found visually or in the powder XRD spectrum. This synthesis seemed
to produce a solid product with little or no impurities however some extra peaks were
observed that are not present in the SIHP XRD powder pattern from Quinlan (1996). The
presence ofNa3P04 and Fe3P05 in the sample accounts for some of the peaks, however
the peaks observed at d-spacings of7.9707 A and 7.8460 A could not be accounted for.
Figure 3.4 is the SEM image ofthe product. The SEM elemental analysis confirmed the
presence of iron, sodium, and phosphorus. Distinct thin, needle-like crystals can be seen,
much like the SIHP products obtained from the FemNTA reactions. While the crystals
were bigger than in previous SIHP syntheses, they were still too small to perform single
crystal XRD. The crystals were not uniform and there appear to be many crystal
fragments scattered throughout the sample. However various areas of the SEM image
show that the crystals grew in layers of smaller parallel crystals.
Again this method gave better crystals than in the first approach, described in
Section 3.2.1 but a few impurities were observed. Future work on this reaction could
include trying the synthesis at a higher Na/P04 mole ratio.
3.3 (NH4)Fe11Fe111(P04)z
The mixed valence compound (NH4)FenFem(P04) 2 was synthesized by Boudin and
Lii (1998) at 500 °C as a black crystalline product. The objective was to see if the mixed
72
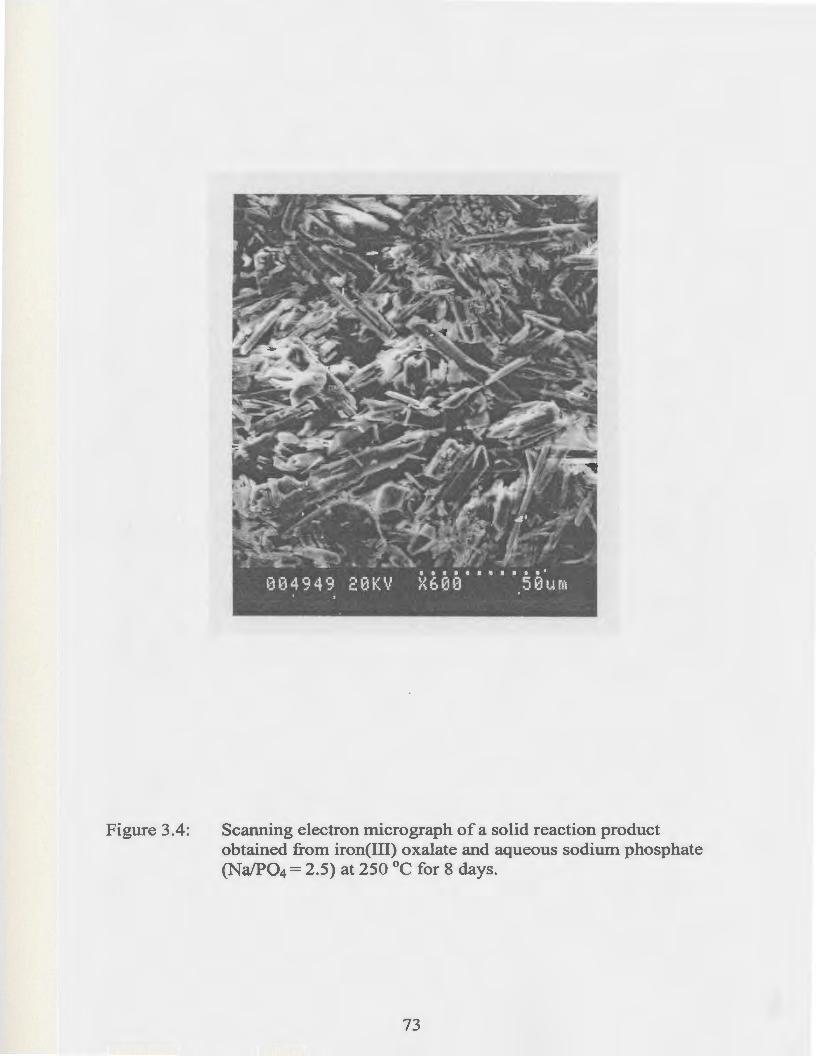
Figure 3.4: Scanning electron micrograph of a solid reaction product obtained from iron(III) oxalate and aqueous sodium phosphate (Na/P04 = 2.5) at 250 °C for 8 days.
73

valence compound would form under boiler conditions and to synthesize it using a more
simple method. The first batch of experiments was done at 250 °C using the starting
materials reported in the paper by Boudin and Lii (1998). The XRD diffraction spectra
showed evidence that unreacted hematite, (NH4)H2P04, and (NH4)2HP04 were still
present in the recovered product. There was no success in obtaining (NH4)Fe11Fe111(P04)2
from this method.
Product RGH51A: Another set of experiments was run, where iron tartrate was used
as the iron source with varying mole ratios of aqueous ammonium phosphate (NHiP04).
One such run at 250 °C for a week (NH4/P04 = 1.0, [P04] = 0.6 molal) produced a small
amount of small black crystals. The powder XRD results are listed in Table A.I.7 in
Appendix I. The powder XRD performed on the synthesized product from this study
matched extremely well with that generated from the supplied by Boudin and Lii (1998)
suggesting that (NH4)FenFem(P04)2 was synthesized. However, hematite was found to
be a major impurity, and there were also traces ofFem(P04)'2H20 and ammonium
hydrogen phosphate hydrate. The peak at ad-spacing of 3.5033 A was due to the
presence ofFeii3(P04)z. Figures 3.5a and bare SEM images of the crystals obtained.
Figure 3.5b is an enlargement ofFigure 3.5a showing that the sample is a mixture of
crystal clusters. Unfortunately, the crystals were not large enough to perform a single
crystal XRD analysis.
Product RGH62A: In an effort to make crystals of(NH4)FeiiFe111(P04)z large
enough to perform a single crystal XRD, the same reaction was repeated at a lower
temperature (i.e. 200 °C). Figure 3.6 is the secondary electron microscopy image of this
74

(a)
(b)
Figure 3.5a and b: Scanning electron micrographs of solid reaction products obtained from iron(III) tartrate and aqueous ammonium phosphate (NH4/P04 = 1.0) at 250 °C for 1 week. [(b) is an enlarged view of (a)]
75

Figure 3.6: Scanning electron micrograph of a solid reaction product obtained from iron(III) tartrate and aqueous ammonium phosphate (NH4/P04 = 1.0) at 200 °C for 1 week.
76

sample. Table A.l.8 in Appendix I summarizes the powder XRD results. Unfortunately,
the black crystals synthesized were still not large enough to perform the analysis but the
powder XRD spectrum pattern confirmed that they gave a good match for
(NH4)Fe11Fem(P04)2. Again, hematite was an impurity along with (NH4)H2P04. The
peaks at 3.123 7 A and 2.1166 A d-spacings are due to F em(P04)-2H20 present in the
sample, while FemO(OH) accounts for the peaks at 6.2460 A and 1.7400 Ad-spacings.
In conclusion, crystals of CNH4)Fe11Fem(P04)z were synthesized however they were
too small for single crystal XRD. The method run at 200 °C gave the "best" sample for
calorimetry however hematite and (NH4)H2(P04) were still present as impurities. This is
a new, simpler synthesis for (NH4)Fe11Fem(P04)2, and its success demonstrate that the
precipitation of (NH4)FenFem(P04)2 can occur under boiler water conditions.
3.4 (NH4)Fe11(P04)·HzO
Product RGHJBB: Attempts to synthesize ammonium iron phosphate hideout
products at 200 °C yielded another product, ammonium iron(II) phosphate monohydrate,
(NH4)Feu(P04)·H20. The sample of (NH4)Feu(P04)·H20 obtained in this study was
synthesized by reacting FemNT A with aqueous ammonium phosphate (NH4/P04 = 2.8,
[P04] = 0. 7 molal) for 9 days at 200 °C. The resulting crystals were clear and colorless.
Figure 3.7 is the secondary electron microscope image and the elemental analysis
confirmed that iron and phosphorus were present in nearly equal amounts. The SEM
image shows that the crystals were stacked in an organized layered fashion. Each layer
77

Figure 3.7: Scanning electron micrograph of a solid reaction product obtained from FenrNT A and aqueous ammonium phosphate (NH4/P04 = 2.8) at 200 °C for 9 days.
78

had crystals lying parallel to the crystals in the layer above and below. It appeared that
the crystals had grown on a surface that subsequently dissolved. The coordinates of the
atoms for the crystal (NH4)Fe11(P04)·H20 obtained from single crystal analysis are given
in Table 3.1 and the structure is shown in Figure 3.8. The details ofthe analysis are in
Appendix II. From the single crystal XRD data for (NH4)Fe11(P04}H20, a powder
pattern was generated using the SHELXTL program and the results are in Table A.l.9 in
Appendix I.
The divalent metal ammonium monophosphate monohydrate,
(NH4)Fen(P04)·H20, can exist in two polymorphs and have been synthesized by Greeden
et al. (1988) and Ivanov et al. (1974, 1976). From these papers, the structure of each
compound indicates a layered arrangement of M06 octahedra separated by ammonium
ions, where the oxygen atoms forming the octahedra about the metal atoms are from the
phosphate groups and the water ofhydration. Polymorph A has octahedra in adjacent
layers with identical orientation whereas polymorph B has layers with inverted
orientation. The space groups for A an Bare Pmn21 and Pnma, respectively, and the unit
cell orientations are such that aA;::: 2(bs), bA;::: as, and cA;::: cs. Greeden et al. (1988)
synthesized only polymorph A and found the unit cell dimensions to be a= 5.684(1), b =
8.803(1), and c = 4.818(5)A. Using these numbers, polymorph B would have calculated
unit cell dimensions of a = 17.606(2), b = 5.684(1), and c = 4.818(5) A. The synthesized
crystal structure in this study was found to have a Pnma space group and a= 17.597, b =
5.667, and c = 4.833 A unit cell dimensions. Thus, it can be concluded that polymorph B
was synthesized in this study.
79

Table 3.1: Positional parameters for (NH4)Fe11(P04)·H20 from single crystal analysis
atom X y z
Fe(1) 0.23902(2) 0.2500 0.6192(1)
P(2) 0.15198(5) -0.2500 0.6851(2)
0(1) 0.1439(1) 0.2500 0.3133(5)
0(3) 0.1651(1) -0.2500 0.3714(5)
0(4) 0.19024(9) -0.0356(3) 0.8242(3)
0(5) 0.0664(1) -0.2500 0.7445(5)
N(1) 0.139(2) 0.2500 0.7593(7)
H(1) -0.0157 0.2500 0.9346
H(2) -0.0153 0.2500 0.5622
H(3) 0.0432 0.1109 0.7685
H(4) 0.1151 0.3868 0.3684
H(5) 0.1493 0.2500 0.1199
80

N 1 N 1 @@
~ 01 01
~1 Nl Gi3 ~ Nl Nl
04
~ 'l7
01 410 01
@)
«> Nl
~ ~
@) N1
Nl
~1
81
Nl ~
05
Qj0 1
N1 @!)

In a set of experiments that were an attempt to synthesize (NH4)FenFelll(P04) 2
(iron tartrate; NH4/P04 = 2.8, [P04] = 0.7 molal; at 200 °C for 8 days), a greenish grey
solid was obtained. Table A.l.9 in Appendix I is a summary of the powder XRD results.
While the results do not match the powder XRD pattern for (NH4)Fe11Fem(P04)2, they do
yield a good match for the calculated pattern of (NH4)Feu(P04)-H20. Hematite was also
present in the sample. There were five peaks in the spectrum that could not be assigned.
While the experiment did not yield (NH4)Fe11Fem(P04)2, it did show that
(~)Fen(P04)-H20 can be synthesized via a different route. The SEM image is shown
in Figure 3.9, and the elemental analysis showed that iron and phosphorus were present in
nearly equal amounts. The crystals were not large enough to perform a single crystal
XRD analysis.
In conclusion, this is a new single crystal synthesis for (NH4)Fe11(P04)-H20, and
the results show that it can form in low-temperature boiler water.
3.5 SNHP
3.5.1 The NiO Reaction
Ziemniak and Opalka (1988) have shown that one reaction product of aqueous
sodium phosphate with nickel under boiler conditions is sodium nickel hydroxyphosphate
(SNHP), Na2Ni(OH)P04. Attempts were made to prepare pure samples of SNHP but
only a few of these syntheses produced SNHP.
Product RGH92A: Utilizing the experimental methods developed in our
laboratory, SNHP was synthesized by reacting NiO with aqueous sodium phosphate
82

Figure 3.9: Scanning electron micrograph of a solid reaction product obtained from iron(III) tartrate and aqueous ammonium phosphate (NHJP04 = 2.8) at 200 °C for 8 days.
83

(Na/P04 = 2.5, [P04] = 1.5 molal) at 250 °C for one week. The powder XRD results of
the resulting green solid are listed in Table A.l.1 0 in Appendix I. The powder XRD
analysis showed that the main component of the sample was SNHP, based on the powder
XRD pattern in the paper by Ziemniak and Opalka (1988), but that unreacted NiO
remained. Other impurities identified in the powder XRD pattern were Na3P04 and
possibly, another sodium-nickel-phosphate, N~Ni(P04)2. However, the peaks in the
sample XRD pattern that match N~Ni(P04)2 were also present in the powder XRD
pattern for Na2Ni(OH)P04. Two of the low intensity peaks could not be accounted for.
In Section 1. 7, it was noted that two additional anhydrous sodium-nickel-phosphate are
known to exist, N~Nis(P04)2(P207 )2 and NaNi4(P04)3 (Sanz et al., 1999; Daidouh et al.,
1999), but they were not identified in the powder XRD results. It can be concluded that
Na2Ni(OH)P04 was the major product, because the powder XRD pattern contained a
greater percentage of matching peaks to that of the sample than the other compounds
present.
The SEM image ofthis product is shown in Figure 3.10. Ziemniak and Opalka
(1988) obtained an image that revealed the crystals have a lath-like shape and the laths
are bundled together in most cases. Figure 3.10 shows many bundles of small (25 by 25
J..tm) crystals that are bundled together. The elemental analysis confirmed the presence of
sodium, nickel, and phosphorus.
Other syntheses were attempted to produce a pure sample of SNHP, but there was
always a NiO impurity and time constraints prevented further reactions from being run.
84
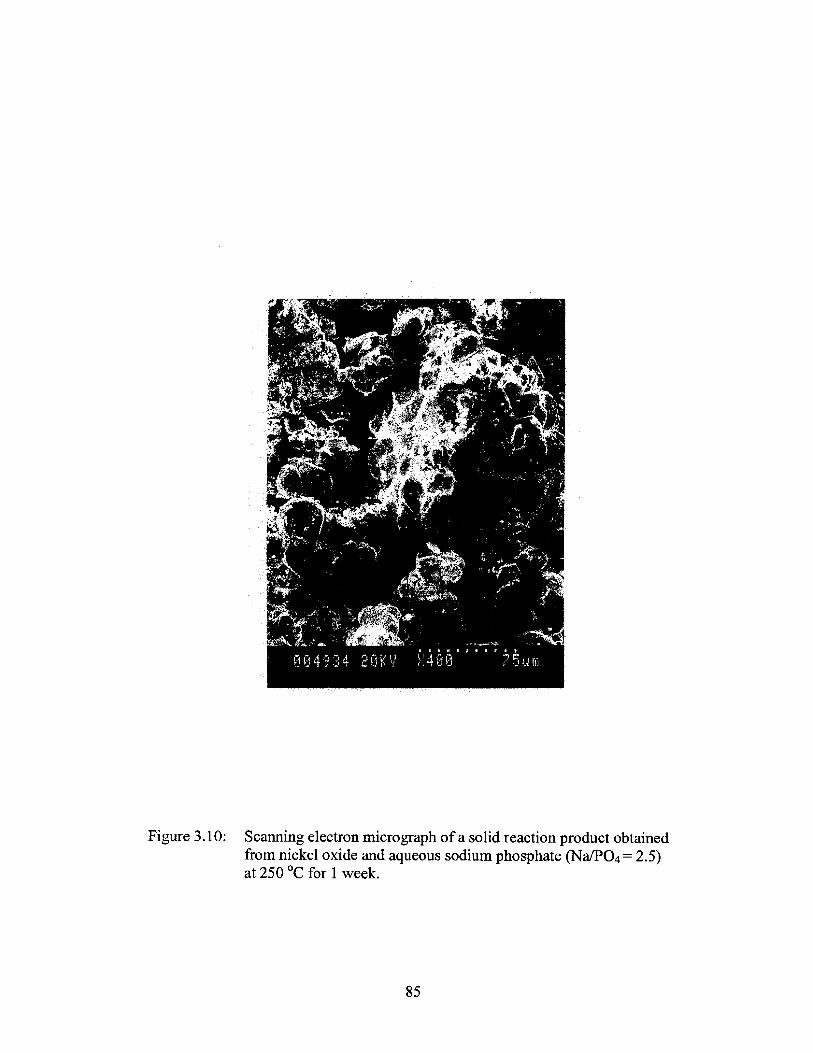
Figure 3.10: Scanning electron micrograph of a solid reaction product obtained from nickel oxide and aqueous sodium phosphate (Na/P04 = 2.5) at 250 °C for 1 week.
85

3.5.2 The H+[NiNT A"] Reaction
Product RGH89A: In one set of experiments, H+[NiNT A-] was reacted with
aqueous sodium phosphate (Na/P04 = 2.5, [P04] = 1.5 molal) at 250 °C for 4 days. The
SEM image is given in Figure 3.11 and the EDX elemental analysis confirmed the
presence of sodium, nickel, and phosphorus in the reaction product. The powder XRD
results for the green crystalline solid are listed in Table A.I.11 in Appendix I. The
powder XRD pattern suggests that the sample was a mixture ofSNHP, H+[NiNTA"] and
sodium hydrogen phosphate. N~Ni5(P04)2(P207)2 and NaNi4(P04)3 were not identified
from the XRD results. Again the JCPDS database identified N~Ni(P04)2 but the same
matching peaks are also seen in SNHP. There were also peaks that could not be
accounted for. Thus there are also other impurities present in the sample that are not
listed in the powder XRD results.
Products RGH66A and RGH73A: In order to try to remove the impurities from
the product, an excess ofNaOH was employed to neutralize the H+ in H+[NiNTAl A
new batch of experiments was performed where less H+[NiNT A"] was reacted with a
solution of a higher sodium to phosphate mole ratio (but lower phosphate concentration;
Na/P04 = 4.0, [P04] = 1.0 molal). The temperature was also lowered to 200 °C. A pale
green powder solid was synthesized whose XRD pattern is presented in Table A.l.12.
The powder XRD suggests that, even though the majority of the sample was SNHP,
Ni(OH)z was also present. N~Ni(P04)2 showed up on the JCPDS database, but the same
peaks are seen in SNHP. When the same run was performed at a higher temperature (i.e.
250 °C), the impurity Ni(OH)z was not present in the solid reaction product. The XRD
86

Figure 3.11: Scanning electron micrograph of a solid reaction product obtained from H+[NiNT A-] and aqueous sodium phosphate (Na/P04 = 2.5) at 250 °C for 4 days.
87

pattern is listed in Table A.l.13. Even though SNHP was still present in the sample, the
JCPDS database identified different impurities than those in the product from the lower
temperature run. Sodium phosphate and sodium phosphate hydrates accounted for most
of the impurities present in the sample, but there were still peaks that could not be
assigned. The SEM images ofboth runs are given in Figures 3.12a and b, respectively.
From SEM, it can be seen the crystals are large enough to perform single crystal XRD
analysis if they can be separated from the impurities. Again, as was the case with the
NiO reactions, the crystals were bundled together. The well-defined crystals are smaller
(5-15 J..tm) in size, too small for single crystal XRD. The elemental analysis confirmed
the presence of sodium, nickel, and phosphorus in the reaction product.
In conclusion, using H+[NiNT A-] as a nickel source did not give a pure sample of
SNHP or large enough crystals to do a single crystal XRD analysis, as originally hoped.
Time constraints prevented further investigation into this area. However, a new synthesis
for SNHP has been developed. The use ofNaNiNTA as a starting material could be
another possible route to synthesizing SNHP for any future work in this area.
88

(a)
(b)
Figure 3.12a and b: Scanning electron micrographs of solid reaction products obtained from H+[NiNT A-] and aqueous sodium phosphate (Na!P04 = 4.0) for 5 days at (a) 200 °C and (b) 250 °C respectively.
89

4.0 SOLUBILITY AND REACTION KINETICS OF SODIUM NICKEL
HYDROXY-PHOSPHATE
4.1 Solubility of the Nickel Oxide-Sodium-Phosphate Reaction
Nickel oxide undergoes reversible reactions with aqueous sodium phosphate
solutions at elevated temperatures and pressures to form sodium nickel hydroxy
phosphate, SNHP, according to the reaction (Ziemniak and Opalka, 1988):
(4.1)
In our solubility runs, samples were taken from different parts of the reaction vessel to
confirm that the reaction product that had formed was indeed SNHP. Firstly, powder
XRD analysis confirmed that both NiO and SNHP were present in the reaction matrix,
and secondly, SEM elemental analysis showed that sodium, nickel, and phosphorus were
indeed present in the crystals of reaction product. Figures 4.1a and b show the SEM
images of a solid sample taken from the basket and the bottom of the vessel, respectively.
Again, as previously observed, bundles or clumps of crystalline solid can be observed in
both images indicating that SNHP is indeed present.
A complete description of the procedures used to determine temperature
dependant solubilities can be found in Section 2.5.2. Two separate runs were performed
to determine the solubility ofSNHP. The sodium-phosphate solution mole ratio was 2.5
90

(a)
(b)
Figure 4.la and b: Scanning electron micrographs of solid reaction products obtained from nickel oxide and aqueous sodium phosphate (Na/P04 = 2.5), solubility run from (a) the basket and (b) the bottom of the vessel.
91

with a phosphate concentration of 1.5 mol·kg-1• The temperature range measured was
between 235-280 °C. The equilibration time used for each step was the same as that
developed by Quinlan (1996) for SIHP, about 48 hours. Table A.III.3 in Appendix III
contains the experimental data for the two solubility runs. The sodium and phosphate
concentrations were measured by ICP-ES in ppm's but all the listed concentrations are
expressed as molalities.
4.2 Kinetics of Na2Ni(OH)P04 Equilibration
The objective of the kinetic runs was to determine the time required for Equation
( 4.1) to reach equilibrium, and to obtain a definitive solubility of SNHP at 250 °C.
Careful studies were performed from conditions of under and over saturation. The rate of
SNHP precipitation was determined by raising the temperature of a vessel containing
NiO and aqueous sodium phosphate (Na!P04 = 2.5) up to 250 °C. To determine the rate
of SNHP re-dissolution, the system was equilibrated at 275 °C to form the reaction
product, and then the temperature was lowered to 250 °C to re-dissolve it. A complete
report of the experimental methods is found in Section 2.5.1. The results of two
precipitation runs and two re-dissolution runs are plotted in Figure 4.2. However due to
clogs in the filter, the first precipitation and the second re-dissolution attempts yielded
erratic results and were discarded, leaving one good run of each. These are shown in
Figure 4.3.
A simple rate equation commonly used in mineral dissolution studies (Stumm and
Morgan, 1970; Blesa et al., 1994) can be used to describe the kinetic data:
92

• 1.0
•
• 0.8 • • • •
.--.. • ' C) • ..!11::
0 E 0.6 • .........
(ij .. 0 1-a_
0.4 ~ .. •• *~
~
• ~
~
0.2
0 25
Figure 4 .2:
• Precipitation at 250 °C, run 1
• Precipitation at 250 °C, run 2 ~ Redissolution at 275-250 °C, run 2
• Redissolution at 275-250 °C, run 1
• • • • • • • •
.... •• • • • • • • • •• • • • • • ~ ~ • ~
~ ~
~
50 75 100 125 150 175 200 225 250 275
Time (hrs)
Kinetics of precipitation andre-dissolution of SNHP (all runs combined)
93

-.... ' 0> ~
0 E -]i
0 1-a.
1 .0~----------------------------------------------~
• 0.9
0.8
0.7
0.6
0.5
0.4
( 0.3
• 0.2
0
Figure 4.3:
•• • •
50
• Precipitation at 250 °C, run 2 + Redissolution at 275-250 °C, run 1 -- Precipitation Regression (n=3) -- Redissolution Regression (n=2)
I • • •
100 150
Time (hrs)
Kinetics of precipitation andre-dissolution of SNHP (data obtained from the best runs)
94
•
200

(4.2)
Integration ofEquation (4.2) gives the following expression
m(P04,t) = m(P04,sat) + [(n-l)kat + {m(P04,t=O)- m(P04,sat)}(l-n)]11(1-n) (4.3)
The total phosphate concentration at time t is represented by m(P04, t) whereas m(P04,
sat) is the total phosphate concentration at equilibrium (t = oo). In fitting Equation (4.3)
to the data, the value of n was set at an arbitrary number whereas the value of the oxide
surface area, a, was estimated to be equal to 1. Equation (4.3) was fitted to the kinetic
data in Figure 4.3 with n = 3 for precipitation and n = 2 for re-dissolution, and the result
are represented by solid curves in Figure 4.3. The rate constant for the precipitation
obtained for the re-dissolution reaction. The limiting values for the total solution
concentrations at equilibrium (t-+oo) for the precipitation reaction were m(Na+) = 1.3849
mol·kg-1 and m(P04hotal = 0.4546 mol·kg-1• The corresponding values were m(Na+) =
1.1901 mol·kg-1 and m(P04hotai = 0.3892 mol·kg-1 for there-dissolution reaction. The
averages of the two runs were taken as the "best" value at 250 °C in the thermodynamic
modeling (m(Na+) = 1.2875 ± 0.010 mol·kg-1, m(P04hotal = 0.4219 ± 0.033 mol·kg-1
) .
From Figure 4.3, it is shown that a time of75 hours is needed for the precipitation
reaction to equilibrate from over saturation at 250 °C. Therefore, the data used to
95

develop the thermodynamic model for this system were the equilibrium value at 250 °C,
noted above, and values from Table A.III.3 for temperatures above 250 °C.
4.3 A Thermodynamic Model
4.3.1 Phosphate Ionization Equilibria
The major phosphate species in high-temperature water are the anions of
orthophosphoric acid (Tremaine et al., 1992). These include dihydrogen phosphate,
H2P04-; hydrogen phosphate, HP042-; and phosphate, P04
3-. These species form
according to the equilibria listed below. Because we are dealing with alkaline boiler
water conditions, these are written as reactions with hydroxide, followed by their
corresponding equilibrium constants:
(4.4)
K = m(H2PO; ) 1 m(H3P04 )m(OH- )
(4.5)
(4.6)
K = m(HPo;- ) 2 m(H2PO;)m(OH- )
(4.7)
96
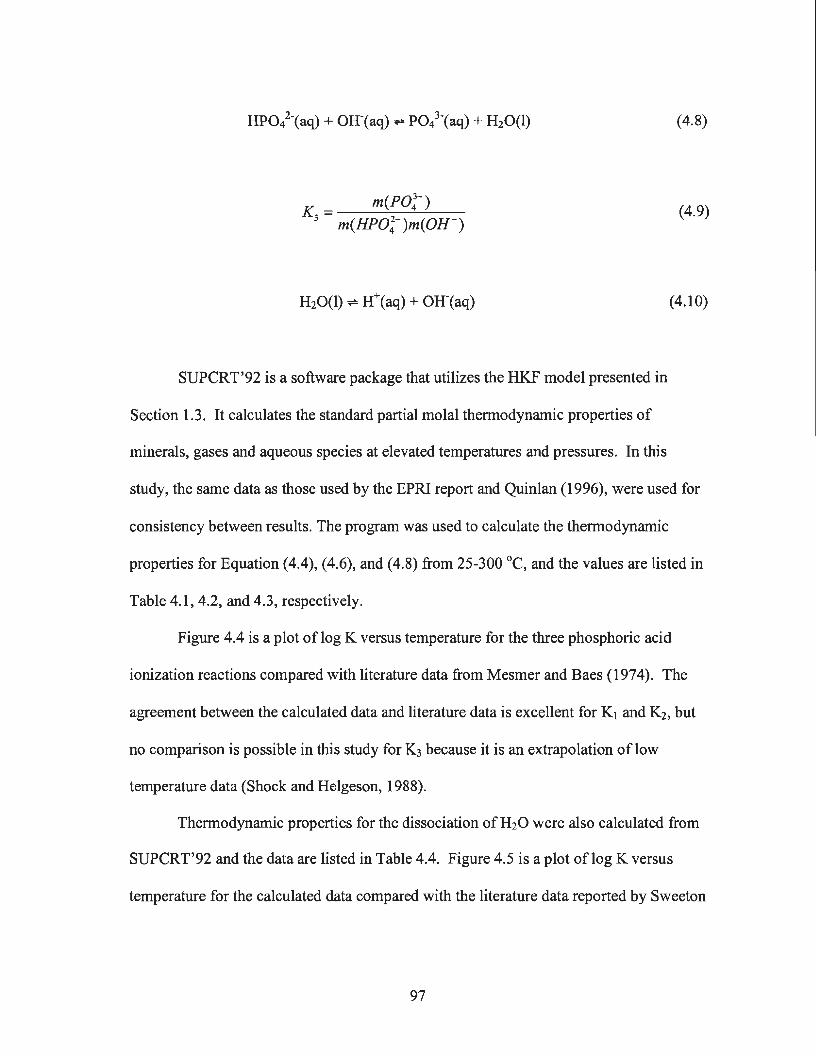
(4.8)
K = m(PO~-) 3 m(HPo:-)m(OH-)
(4.9)
(4.10)
SUPCRT'92 is a software package that utilizes the HKF model presented in
Section 1.3. It calculates the standard partial molal thermodynamic properties of
minerals, gases and aqueous species at elevated temperatures and pressures. In this
study, the same data as those used by the EPRI report and Quinlan ( 1996), were used for
consistency between results. The program was used to calculate the thermodynamic
properties for Equation (4.4), (4.6), and (4.8) from 25-300 °C, and the values are listed in
Table 4.1, 4.2, and 4.3, respectively.
Figure 4.4 is a plot oflog K versus temperature for the three phosphoric acid
ionization reactions compared with literature data from Mesmer and Baes (1974). The
agreement between the calculated data and literature data is excellent for K 1 and K 2, but
no comparison is possible in this study for K 3 because it is an extrapolation oflow
temperature data (Shock and Helgeson, 1988).
Thermodynamic properties for the dissociation of H20 were also calculated from
SUPCRT'92 and the data are listed in Table 4.4. Figure 4.5 is a plot oflog K versus
temperature for the calculated data compared with the literature data reported by Sweeton
97

Table 4.1 Experimental equilibrium constants for the SNHP formation reaction
NiO(s) + 2 Na\aq) + HPOl-(aq) ~ Na2Ni(OH)P04(s)
t Average Average Average oc log Q logK K
243 -0.2571 2.5773 3.779·102
245 -0.6839 2.2548 1.798·102
250 0.4031 3.0841 1.214·103
252 0.3619 2.6607 4.578·102
255 -0.0124 2.9658 9.242·102
257 0.1356 3.1103 1.291·103
260 0.1436 3.1637 1.457·103
265. 0.5598 3.4764 2 .995·103
268 0.9847 3.7902 6.169·103
272 0.9448 3.7904 6.172·103
280 1.2172 4.0475 1.116·104
98

Table 4.2 Standard state properties of the first and second ionizations of phosphoric acid
H3P04(aq) + OH-(aq) ~ H2P04-(aq) +H20(l) H2P04-(aq) + OH-(aq) ~ HPOl-(aq) +H20(l)
t p dH20 logK ~rG ~rH ~rS0 ~rV0 8rCp0
oc bars g·cm-3 cal·mor1 cal·mor1 cal·mor1·K-1 cm3·mor1 cal·mor1·K-1
1st ionization
25.00 1.000 0.997 11.825 -16133 -15240 2.9 5.5 20.2 50.00 1.000 0.988 10.972 -16224 -14789 4.3 4.0 16.5 75.00 1.000 0.975 10.261 -16347 -14395 5.5 3.3 15.2 100.00 1.013 0.958 9.662 -16498 -14019 6.5 3.2 14.9 125.00 2.320 0.939 9.152 -16673 -13645 7.5 3.3 15.1 150.00 4.757 0.917 8.714 -16873 -13265 8.4 3.8 15.3 175.00 8.918 0.892 8.336 -17094 -12882 9.3 4.5 15.3 200.00 15.536 0.865 8.008 -17337 -12499 10.1 5.3 15.5 225.00 25.479 0.834 7.721 -17599 -12108 10.9 6.2 15.9 250.00 39.736 0.799 7.469 -17880 -11726 11.7 7.2 14.2 275.00 59.431 0.759 7.247 -18176 -11484 12.1 7.5 1.6 300.00 85.838 0.712 7.043 -18471 -11870 11.5 2.6 -52.6
2nd ionization
25.00 1.000 0.997 6.790 -9263 -12335 -10.3 -3.7 -0.5 50.00 1.000 0.988 6.089 -9004 -12349 -10.4 -5 .7 -0.7 75.00 1.000 0.975 5.489 -8744 -12372 -10.4 -6.8 -1.2 100.00 1.013 0.958 4.967 -8482 -12408 -10.5 -7.5 -1.8 125.00 2.320 0.939 4.510 -8217 -12461 -10.7 -8.1 -2.5 150.00 4.757 0.917 4.105 -7948 -12534 -10.9 -8.6 -3.3 175.00 8.918 0.892 3.743 -7675 -12627 -11.1 -9.1 -4.2 200.00 15.536 0.865 3.417 -7397 -12747 -11.3 -9.6 -5.6 225.00 25.479 0.834 3.120 -7112 -12915 -11.7 -10.4 -8.2 250.00 39.736 0.799 2.849 -6819 -13154 -12.1 -11.6 -11 .5 275.00 59.431 0.759 2.597 -6515 -13456 -12.7 -13.5 -13 .0 300.00 85.838 0.712 2.365 -6201 -13695 -13 .1 -15.1 -3.9
99

Table 4.3 Standard state properties of the third ionization of phosphoric acid
HPOl-(aq) + OH-(aq) ~ Pol-(aq) +H20(l)
~rS6 t p dH2o log K3 ~rG0 ~rH0 ~rV6 ~rCp6 oc bars g·cm-3 cal·mor1 cal·mor1 cal·mor1K-1 cm3·mor1 cal·mor1·K-1
25.00 1.000 0.997 1.673 -2283 -9825 -25.7 -13.9 -5.8 50.00 1.000 0.988 1.105 -1634 -9959 -26.2 -16.2 -5.2 75.00 1.000 0.975 0.612 -975 1009 -26.6 -17.7 -5.6 100.00 1.013 0.958 0.179 -306 -1024 -27.0 -18.7 -6.5 125.00 2.320 0.939 -0.205 374 -1042 -27.4 -19.7 -7.8 150.00 4.757 0.917 -0.550 1065 -1063 -28.0 -20.6 -9.1 175.00 8.918 0.892 -0.862 1768 -10875 -28.5 -21.6 -10.1 200.00 15.536 0.865 -1.148 2485 -11146 -29.1 -22.7 -11.9 225.00 25.479 0.834 -1.410 3214 -11479 -29.8 -24.1 -15.1 250.00 39.736 0.799 -1.654 3959 -11887 -30.5 -26.0 -17.4 275.00 59.431 0.759 -1.881 4719 -12247 -31.2 -27.9 -8.3 300.00 85.838 0.712 -2.089 5480 -12002 -30.7 -25.1 48.4
100
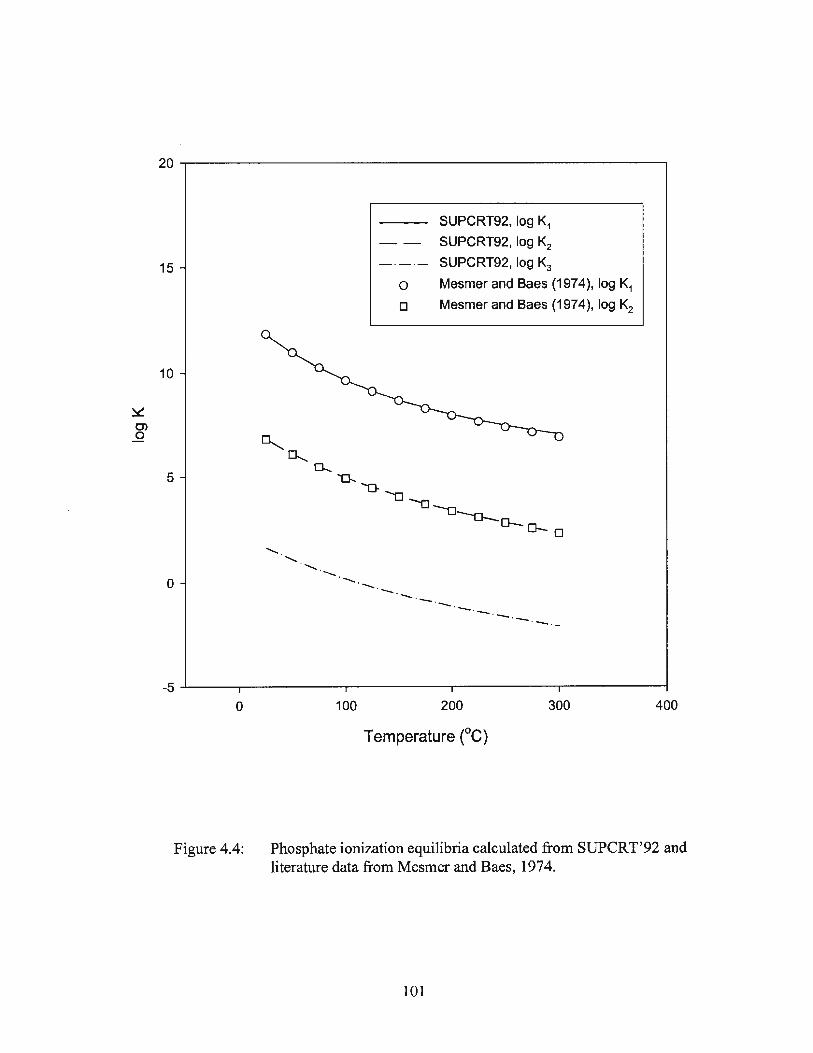
20.-------------------------------------------------~
15
10
5
-
SUPCRT92, log K1
- - SUPCRT92, log K2
-·- - SUPCRT92, log K3
o Mesmer and Baes ( 197 4 ), log K1
o Mesmer and Baes ( 197 4 ), log K2
-0 -- - -·- ·--·-
-5~--~--------~~--------~----------~--------~
0 100 200 300 400
Temperature (°C)
Figure 4.4: Phosphate ionization equilibria calculated from SUPCRT'92 and literature data from Mesmer and Baes, 1974.
101

Table 4.4 Standard state properties of the dissociation of water
H20(l) ~ H+(aq) + OK(aq)
t p dH2o logKw ~rG0 ~rH0 ~rS0 ~rV0 ~rCp oc bars g·cm-3 cal·mor1 cal·mor1 I r 1 K-1 cm3·mor1 cal·mor1·K-1 ca·mo ·
25.00 1.000 0.997 -27.990 38185 26680 -38.5 -45.6 -101.2 50.00 1.000 0.988 -26.541 39245 24391 -45.9 -44.5 -85.4 75.00 1.000 0.975 -25.406 40472 22305 -52.1 -45.6 -82.9 100.00 1.013 0.958 -24.510 41849 20196 -58.0 -48.4 -86.7 125.00 2.320 0.939 -23.806 43370 17933 -63.9 -52.9 -95.1 150.00 4.757 0.917 -23.262 45039 15409 -70.0 -59.6 -107.8 175.00 8.918 0.892 -22.854 46864 12520 -76.6 -69.1 -125.4 200.00 15.536 0.865 -22.567 48858 9081 -84.0 -82.5 -154.6 225.00 25.479 0.834 -22.394 51045 4719 -93.0 -102.4 -204.6 250.00 39.736 0.799 -22.335 53465 -1149 -104.4 -134.1 -287.0 275.00 59.431 0.759 -22.398 56179 -9368 -119.6 -186.9 -422.7 300.00 85.838 0.712 -22.600 59271 -21427 -140.8 -278.5 -680.6
102
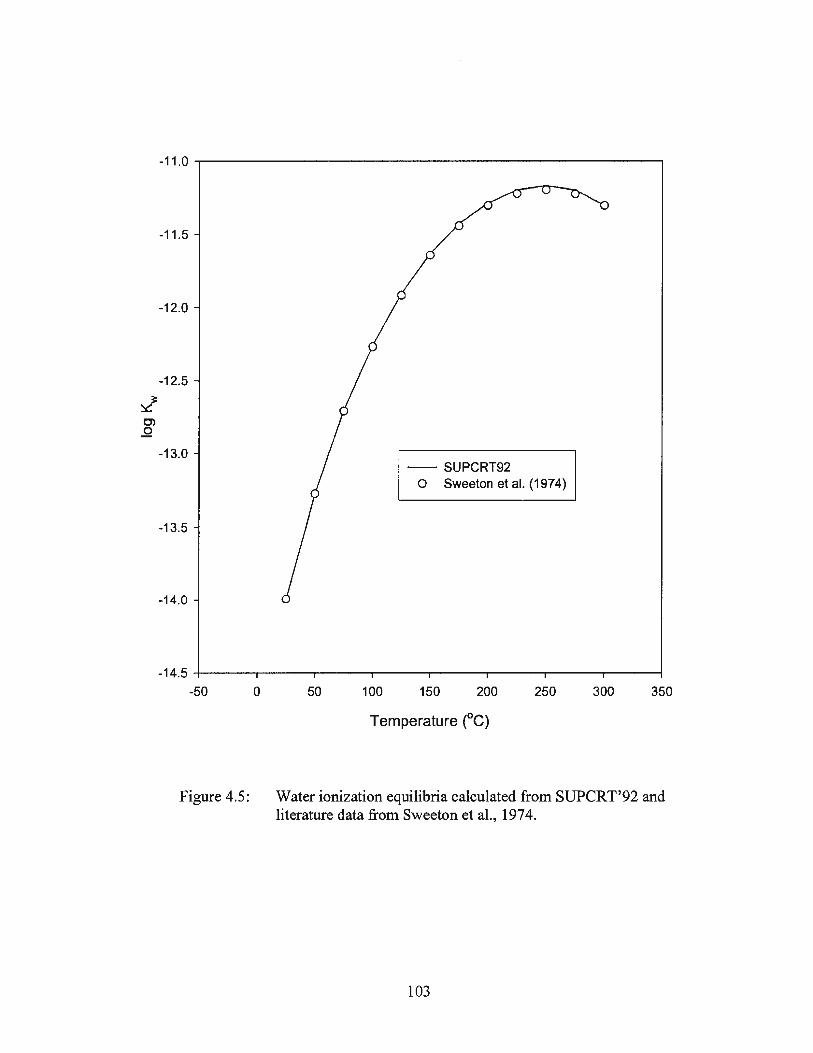
C) 0
-11.0 ..---------------------------,
-11.5
-12.0
-12.5
-13.0 -- SUPCRT92
0 Sweeton et al. (1974)
-13.5
-14.0
-14.5 +---.....------r------.------r-------r---.----~----1
-50 0 50 100 150 200 250 300 350
Temperature (°C)
Figure 4.5: Water ionization equilibria calculated from SUPCRT'92 and literature data from Sweeton et al., 1974.
103

et al. (1974) and the agreement is again excellent. A difference plot ofthe agreement
between calculated and literature data is shown in Figure 4.6. The relative difference plot
shows that the highest percent difference is only ~2.1 %.
Data from SUPCRT'92 for other species used in our study are tabulated in Tables
4.5, 4.6, and 4.7. The standard state properties are listed in Table 4.5. Table 4.6lists the
HKF equation of state coefficients for these species and Table 4. 7 contains the Maier-
Kelley coefficients for nickel oxide and SNHP.
4.3.2 Equilibrium Constants and Thermodynamic Properties of SNHP
Once the equilibrium concentrations of total sodium and total phosphorus from
solubility and kinetic measurements were converted to units of molality, MULTEQ was
used to calculate the composition concentrations of relevant species at each temperature
studied. The activity coefficient model described in Section 1.4, that incorporates the
Meissner equation used in MUL TEQ, was used to calculate the equilibrium constants for
Equation ( 4.1) according to the following equation:
ln K eq = lnQ + ln[--2-1--]
(rNa+ ) (r HPol - )
104
(4.11)

0.5
0.0
a X
"' ~ Ol 0 -0.5
........ 0 0 ..->< -"8 -1 .0 ~ ~ Ol 0
a X
~"' -1.5
Ol 0
::::::..
-2.0
-2.5 0
Figure 4.6:
.... .... .... .... • ....
• • .... .... ....
"' .... ..... - •
• • • • • • • • • • • •
• • • • •
•
•
• 151 Ionization of Phospheric Acid (Mesmer and Baes, 1974)
• 2"d Ionization of Phosphoric Acid (Mesmer and Baes, 1974) • .... Dissociation of Water (Sweeton et al., 1974)
50 100 150 200 250 300
Temperature (0C}
The relative difference between experimental values of log K (Mesmer and Baes, 1973; Sweeton et al. , 1973) and those calculated from SUPCRT'92
105

Table 4.5 Standard state properties of aqueous species at 25 °C and 1 bar
~rG0 ~rH0 so yo Cp cal·mor1 cal·mor1 cal·mor1·K-1 cm3·mor1 1 r 1 K-1 ca··mo ·
H3P04 (aq) -273100 -307920 38.000 48.2 23.6 HzP04- (aq) -270140 -309820 21.600 30.9 -6.9 HPol- (aq) -260310 -308815 -8.000 4.4 -58.0 Pol-(aq) -243500 -305300 -53.000 -32.3 -114.3 Na+ (aq) -62591 -57433 13.960 -1.2 9.1 H+ (aq) 0 0 0 0 0 OH- (aq) -37595 -54977 -2.560 -4.7 -32.6 HzO (1) -56688 -68317 16.712 18.1 18.0 NiO (s) -50573 -57300 9.080 10.970 10.6 SNHP(s) 431661 468325 56.778 48.766
106

Table 4.6 HKF equation of state coefficients for aqueous speciesa
a1 x 10 a2 x 10- a3 '4 X 10- CJ c2 x 10-
H3P04(aq) 8.2727 12.4182 0.8691 -3.2924 17.9708 1.7727 -0.2200 H2P04-(aq) 6.4875 8.0594 2.5823 -3.1122 14.0435 -4.4605 1.3003 HPO/-(aq) 3.6315 1.0857 5.3233 -2.8239 2.7357 -14.9103 3.3363 Pol-(aq) -0.5259 -9.0654 9.3131 -2.4042 -9.4750 -26.4397 5.6114 Na+(aq) 1.8390 -2.285 3.2560 -2.7260 18.1800 2.9810 0.3306 H+(aq) 0 0 0 0 0 0 0 OH-(aq) 1.2527 0.0738 1.8423 -2.7821 4.1500 -10.3460 1.7246
a Units: a~, cal·mor1·bar-1; a2, cal·mor1
; a3, cal·K·mor1·bar-1; <4, cal·K·mor1
; c1, cal·mor1
·K-1; c2, cal·K·mor1
; ro, cal·mor1•
107

Table 4.7 Maier-Kelley coefficients for heat capacities of solids
a b X 10 C X 10- Temperature cal·mor1·K1 1 r 1 K-2 1 r 1 K-1 of transition ca·mo · ca·mo ·
COK) NiO (s) -4.99 37.58 3.89 Bunsenite (s) -4.99 37.58 3.89 525
13.88 0.0 0.0 565 11.18 2.02 0.0
SNHP (s) 48.766 0.0 0.0
108

Equilibrium constants are listed in Table 4.8. Equation ( 4.1) is not an
isocoulombic reaction, meaning that ~rCp 0 is not independent of temperature. Because
the temperature-dependance of Cp 0 for aqueous ions is highly asymmetric, the data are
very difficult to fit. Thus an isocoulombic reaction equation is desirable so that, even
though ~rCp 0 is not equal to zero, it is approximately independent of temperature
(Mesmer et at., 1988). This can be accomplished by adding the first and second
ionizations of phosphoric acid, Equations (4.4) and (4.6) respectively, and two
equivalents of the water dissociation reaction in Equation ( 4.1 0), to the experimental
Equation ( 4.1) results calculated in this study. This results in new equilibrium constants
for the following isocoulombic reaction:
(4.12)
The equilibrium constants for Equation (4.12) are listed in Table 4.9.
SNHP was not synthesized as a pure solid in this study; therefore no calorimetric
measurements could be performed in order to obtain an experimental heat capacity of
SNHP. Thus we used another method to find Cp 0 (SNHP) in order to calculate a value for
the heat capacity of the reaction. The value for the heat capacity of SNHP was
calculated using a method by Qui and White (2001), called the "constituent additivity"
model. In this method, the heat capacities of inorganic salts are calculated from
additivity of the experimental heat capacities of the appropriate proportions oftheir
109

Table 4.8 Experimental data calculations for the SNHP formation reaction
NiO(s) + 2 Na\aq) + HPOl-(aq) ~ Na2Ni(OH)P04(s)
t ln Q I Y± (Na +j Y±(HPO/) lnK oc rnol·kg-1
235 -2.5841 3.7398 0.3521 0.01537 3.6788 240 -1.8436 2.9115 0.3360 0.01275 4.6995 243 -0.5919 1.9406 0.3370 0.01289 5.9345 245 -1.5748 2.7250 0.3238 0.01099 5.1918 250 0.9265 1.1247 0.3499 0.01500 7.2276 252 -0.8334 2.0967 0.3135 0.00966 6.1264 255 -0.0286 1.5913 0.3189 0.01034 6.8289 257 0.3123 1.4587 0.3192 0.01039 7.1632 260 0.3307 1.4305 0.3138 0.00970 7.2840 265 1.2889 1.0090 0.3265 0.01136 8.0048 268 2.2674 0.7802 0.3407 0.01348 8.7273 272 2.1755 0.7518 0.3355 0.01267 8.7277 280 2.8026 0.6085 0.3375 0.01298 9.3196
110

Table 4.9 Equilbrium constants for the isocoulombic reaction
1s 2n Water I so- I so-t ionization ionization Dissociation coulombic coulombic
oc logK1 logK2 logKw logK K
235 7.6170 3.0090 -11.1780 -10.1336 7.352·10-11
240 7.5660 2.9550 -11.1720 -9.7830 1.648·1 o-10
243 7.5370 2.9220 -11.1700 -9.3029 4.979·10-10
245 7.5170 2.9010 -11.1690 -9.6644 2.166·1 o-10
250 7.4690 2.8490 -11.1670 -8.8778 1.325·1 o-09
252 7.4510 2.8280 -11.1680 -9.3963 4.015·10-10
255 7.4230 2.7970 -11.1690 -9.1523 7.042·10-10
257 7.4040 2.7760 -11.1700 -9.0480 8.954·10-10
260 7.3770 2.7460 -11.1720 -9.0587 8.736·10-10
265 7.3330 2.6960 -11.1790 -8.8530 1.403·1 o-09
268 7.3070 2.6660 -11.1840 -8.6054 2.481 ·1 o-09
272 7.2720 2.6270 -11.1920 -8.6951 2.018·10-09
280 7.2050 2.5490 -11.2140 -8.6253 2.370·1 o-09
111

simple "constituent" compounds. For SNHP, the calculation is represented by the
following equations:
c; = Inc; c oxides) (4.13)
(4.14)
It was found that this model gives reasonably accurate heat capacity at or above about
150 K, provided that the coordination within the constituent solids is similar to the
complex solids and there are no solid-solid phase transitions. The heat capacity value
calculated for SNHP using this method is Cp0 = 48.766 cal·K-1·mor1•
Once the equilibrium constants for the isocoulombic reaction were calculated, the
following equation was fitted to the data:
11,H0
( 1 1) 11,c; [l (T2 ) T. ] lnK =lnK --- --- +-- n- +--1 T2 T, R T T. R T. T
2 I I 2
(4.15a)
Here, ln Kr. and /1H~ were used as fitting parameters whereas 11rCp 0 was fixed at the I I
room temperature value of 11rCp0 = -0.134 cal·mor1·K-1 (from Table 4.5). The extended
van't Hoff plot is shown in Figure 4.7. The activity coefficient model works best at 250
°C, giving us a more accurate value for the equilibrium constant (Tremaine et al, 2002),
thus the reference temperature was set at that temperature (T1 = 523.15 K). In our
112

-19.5 ....,.......-------------------------..
-20.0
-20.5
c • • -21.0 •
• -21.5
• e Experimental Data
-22.0 -- Extended van't Hoff fit & Definitive 250 °C Point
• -22.5 ...1.._---.----.-----.-----.----.----.-----1
0.001800 0.001825 0.001850 0.001875 0.001900 0.001925 0.001950
1/T (1/K)
Figure 4.7: Extended van't Hoff plot of the isocoulombic reaction
113

solubility runs, we used the same equilibration time, 48 hrs, as that used by Quinlan
(1996) for SIHP but, from our kinetic studies, it was determined that 75 hours was
needed for the reaction to equilibrate at 250 °C. Therefore the best definitive solubility
point was obtained from the careful kinetic experiments at 250 °C, in which equilibrium
was approached from conditions of super-saturation and under-saturation. Thus the curve
fit was forced to go through this data point. Furthermore, the data points at 23 5 and 240
°C were deleted from the curve fitting because the activity coefficients have larger errors
associated with them and the reaction may not have been at equilibrium. From the plot in
Figure 4. 7, it can be seen that the fit also gave good agreement at the higher temperatures
(t = 252 °C- 280 °C).
Equation ( 4.15a) with the fitted and fixed parameters included takes the form:
lnK = _20.4691 _ 11730.4845 (__!_ _ 1 J T
2 R T2 523.15
+ -0.134[ln( I; )+ 523.15 _ 1] R 523.15 T;_
(4.15b)
From these data-fitting results, the values InK = -20.4691 and 6rH0 = 11730.5 cal·mor1
at 250 °C were obtained. The value ofln K = -29.0191 at 25 °C was found by
extrapolation. Since 6rCp 0 was assumed independent of temperature, the value of 6rH0 =
11760.6 cal·mor1 at 25 °C could be calculated from the equation:
(4.16)
114

where T1 = 523.15 K and T2 = 298.15 K. The remaining thermodynamic properties of
SNHP were calculated using well known thermodynamic equations found in Section
1.3.1.
Once the standard state properties of SNHP were calculated, they were entered
into the SUPCRT'92 database and the thermodynamic program was used to calculate the
equilibrium constants and Gibb' s free energies of the reaction in Equation ( 4.1 ). Figure
4.8 shows a comparison of the experimental and calculated results for this study. Table
4.10 contains the calculated results for SNHP formation from SUPCRT'92.
4.4 Comparison With Data From Other Workers
Ziemniak and Opalka (1988) reported solubility data for SNHP at two separate
Na!P04 mole ratios, 2.2 and 2.5, over temperatures within the range of 256-296 °C.
Unlike the present study, the reaction was only allowed to equilibrate for 4 to 16 hours at
each measurement temperature before a sample was taken. From our kinetic studies, it
was determined that this is not enough time for the reaction to reach completion. Also,
calculations were performed using differing methods. Ziemniak and Opalka (1988)
calculated equilibrium constants using the extended Debye-Huckel equation. In
comparing the Ziemniak and Opalka (1998) data with those obtained in this study, the
reported raw data had to be re-calculated using the same activity coefficient model used
in this work. Figure 4.9 shows a comparison of the experimental and calculated
115

10~--------------------------------------------------~
• 9
• • 8
7
6
• 5
• 4 • Experimetal data
-- Calculated SUPCRT'92 model • 3+--------.--------.-------~-------.--------~------~
0.001785 0.001820 0.001855 0.001890 0.001925 0.001960 0.001995
Figure 4.8:
1/T (1/K)
Comparison of experimental data and values calculated from SUPCR T'92 for the SNHP formation reaction
116
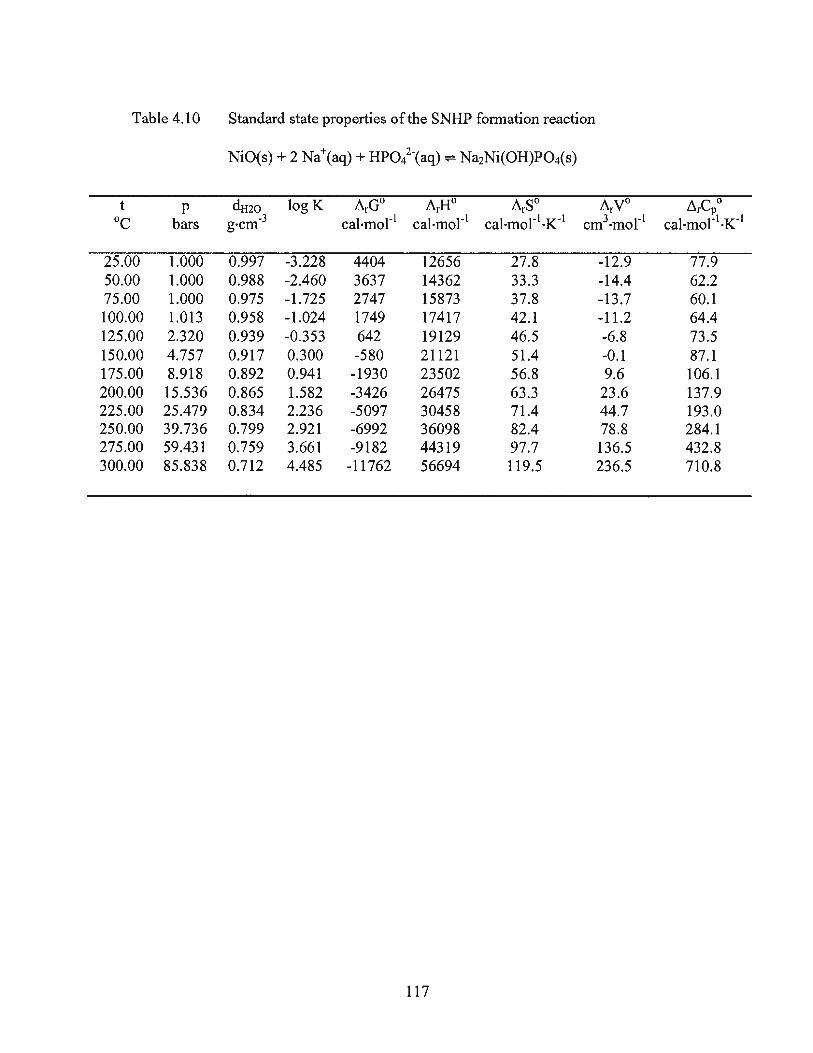
Table 4.10 Standard state properties of the SNHP formation reaction
NiO(s) + 2 Na\aq) + HPO/-(aq):;:!: Na2Ni(OH)P04(s)
t p dH2o logK 6rG6 6rH0 6rS0 6rV0 6rCp0
oc bars g·cm-3 cal·mor1 cal·mor1 cal·mor1·K-1 cm3·mor1 1 r 1 K-1 ca·mo ·
25.00 1.000 0.997 -3.228 4404 12656 27.8 -12.9 77.9 50.00 1.000 0.988 -2.460 3637 14362 33.3 -14.4 62.2 75.00 1.000 0.975 -1.725 2747 15873 37.8 -13.7 60.1 100.00 1.013 0.958 -1.024 1749 17417 42.1 -11.2 64.4 125.00 2.320 0.939 -0.353 642 19129 46.5 -6.8 73.5 150.00 4.757 0.917 0.300 -580 21121 51.4 -0.1 87.1 175.00 8.918 0.892 0.941 -1930 23502 56.8 9.6 106.1 200.00 15.536 0.865 1.582 -3426 26475 63.3 23.6 137.9 225.00 25.479 0.834 2.236 -5097 30458 71.4 44.7 193.0 250.00 39.736 0.799 2.921 -6992 36098 82.4 78.8 284.1 275.00 59.431 0.759 3.661 -9182 44319 97.7 136.5 432.8 300.00 85.838 0.712 4.485 -11762 56694 119.5 236.5 710.8
117
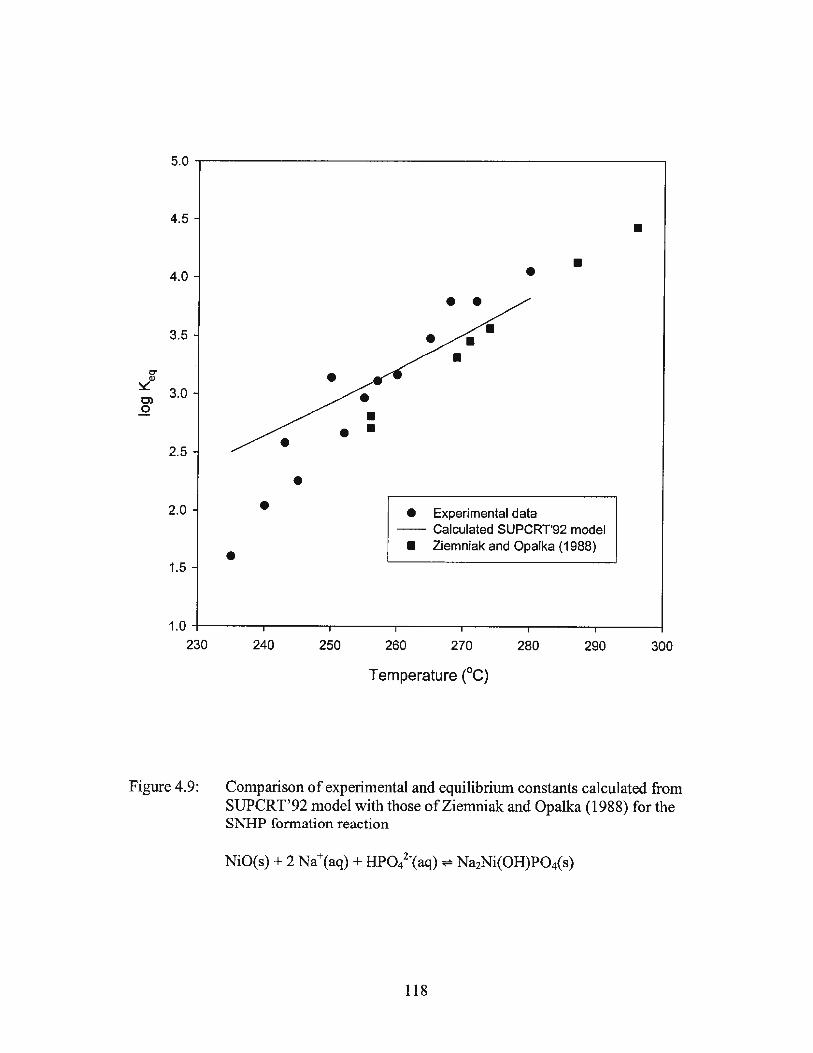
<7 Q)
~ C)
..Q
5.0~------------------------------------------------.
4.5
4.0
3.5
3.0
2.5
2.0 •
• 1.5
• • •
•
• •
• Experimental data -- Calculated SUPCRT'92 model
• Ziemniak and Opalka (1988)
•
1.0+------.-------r------r------.------.------.------~
230 240 250 260 270 280 290 300
Temperature (°C)
Figure 4.9: Comparison of experimental and equilibrium constants calculated from SUPCRT'92 model with those ofZiemniak and Opalka (1988) for the SNHP formation reaction
118

equilibrium constants obtained in this work with those of Ziemniak and Opalka ( 1988),
and Figure 4.10 compares the Gibbs free energy of each. While the values at the highest
temperatures compare well, those at lower temperature do not.
The Gibbs free energy and enthalpy of formation ofNazNi(OH)P04 reported by
Ziemniak and Opalka (1988) were 11 1G;98 = -415.7266 and 11 1H;98 = -430.2103
kcal·mor1 respectively. Those obtained from this study were 11 1G;98 = -431.6615 and
11 1H;98 = -468.3254 kcal·mor1. The discrepancy is undoubtedly due to lack of
equilibration in this study and those of Ziemniak and Opalka (1988), at temperatures
below 250 °C.
4.5 Future Work
The work presented in this study has provided reliable solubility data for the
formation of SNHP under boiler conditions and from which thermodynamic data were
calculated at 250 °C.
While the value of /1~0(SNHP) and the equilibrium constant for Equation ( 4.1)
have been accurately determined, our value of the enthalpy 11rH\SNHP) contains more
uncertainty. Further work should be done to obtain more accurate parameters for SNHP,
by measuring solubility data over a wider range of temperatures or at more temperatures
within the 235-280 °C range investigated in this study. Allowing at least ~75 hours for
equilibrium to be reached at each sample temperature would give more reliable results,
119

-....... I
0 E cti (J -
-2000.-----------------------------------------------~
• -4000
• •
-6000
-8000
-10000
-12000 230 240 250
• Experimental data --- Calculated SUPCRT92 model
• Ziemniak and Opalka (1988)
• • • •
260 270 280 290
Temperature (°C)
• 300
Figure 4.10: Comparison of experimental and Gibbs free energy data calculated from SUPCRT'92 model with those of Ziemniak and Opalka (1988) for the SNHP formation reaction
120

and a kinetic study should be carried out at temperatures below 250 °C since the reaction
is slower at these temperatures.
In fitting a model to the experimental data, a fixed value was used for the heat
capacity of the reaction based on the estimated value for that of SNHP. If a sufficiently
pure sample of SNHP could be synthesized, an experimental value for Cp(SNHP) should
be determined from calorimetric studies. This would improve the reliability of the fitted
curve, and thus the thermodynamic parameters obtained from it.
121

5.0 CONCLUSIONS
The synthesis of maricite developed by Quinlan (1996) was shown to be
reproducible and is a reliable hydrothermal means of synthesizing single crystals of
maricite. SIHP crystals were also synthesized under conditions similar to the maricite
synthesis but at a much higher sodium phosphate mole ratio than in the studies done by
Quinlan (1996). Larger SIHP crystals were obtained from two different chelate
decomposition reactions but future work on these reactions could include trying the
synthesis at a higher Na/P04 mole ratio.
It can be concluded from this study that ammonium-iron-phosphate reaction
products can form under boiler conditions. The synthesis of (~)Fe11Fem(P04)2 by
Boudin and Lii (1998) was repeated under conditions similar to those seen in boilers, and
single crystals were synthesized, providing a new simpler synthesis for
CNH4)Fe11Fem(P04)2• Another ammonium iron phosphate hideout product that can
indeed be formed at temperatures below 300 °C is (NH4)Fe11(P04)-H20. This is a new
synthesis for this compound.
The sodium-nickel-phosphate hideout product originally reported by Ziemniak
and Opalka (1988) was synthesized both from NiO and the decomposition of
H+[NiNTA-] under boiler conditions. Although no pure samples of SNHP were obtained
from either set of experiments, an alternative starting material to use in the future could
be NaNiNT A. Since there is no H+ to neutralize, it may be used to synthesize SNHP at a
122

lower Na/P04 mole ratio than the reactions with H+[NiNTA-] in this study. Also, it
provides another source of sodium for the reaction.
Equilibrium solubility data and kinetic data for the formation ofNa2Ni(OH)P04
have been obtained at boiler conditions from 235 to 280 °C. Ziemniak and Opalka (1988)
also provided solubility and thermodynamic data for SNHP and the solubility work
performed in this study has provided additional solubility data for the formation of SNHP
under boiler conditions and a preliminary entry for the reaction product in the
thermodynamic database. The thermodynamic model gives good agreement with the
experimental data collected considering the limited amount of solubility data obtained in
our study.
123

6.0 BIBLIOGRAPHY
Alexander J.H., and Luu L. (1989) MULTEQ: Equilibrium of an electrolyte solution with vapor-liquid partitioning and precipitation, Vol I. Users Manual, EPRJ Report NP-5561-CCM
Anderson G.M., and Crerar D.A. (1993) Thermodynamics in Geochemistry- The Equilibrium Model, Oxford University Press, New York, NY.
Ashoff A.F., Lee Y.H., Sopocy D.M., and Jonas 0. (1986) Interim concensus guidelines on fossil cycle chemistry, EPRI Report CS 4629.
Atkins, P.W. (1993) The Elements of Physical Chemistry, W. H. Freeman and Company, New York.
Baes C.F., and Lindsay W.T. (1996) Modeling the formation of variable-composition liquid or solid phases in MUL TEQ, Preceedings of Conference on Improving the Understanding and Control of Corrosion on the Secondary Side Of Steam Generators, Virginia R.W., Staehle W., Gorman J.A. and Mcilree A.r. eds, NACE International, Houston, pp 577-600.
Balakrishnan P.V. (1977) A study of phosphate hide-out from boiling water, Can. J Chern. Eng. 55, 592-596.
Barrer, R.M. (1948) Syntheses and reactions ofmordenite, J Chern. Soc., 2158.
Bell, C.F. (1977) Principles and Applications of Metal Chelation, Clarendon Press, Oxford.
Benson S.W. (1968) Thermochemical Kinetics, Wiley, New York, NY.
Blesa M.A., Morando P.J., and Regazzoni, A.E. (1994) Chemical Dissolution of Metal Oxides, CRC Press, Boca Raton, FL.
Booy M., and Swaddle T.W. (1978) Hydrothermal preparation of magnetite from iron clelates, Can. J Chern. 56, 402-403.
Boudin S., and Lii K.H. (1998) Ammonium iron(II,III) phosphate: Hydrothermal synthesis and characterization ofNH4Fe2(P04)2, Inorg. Chern. 37, 799-803.
Bridson J.N., Quinlan S., and Tremaine P.R. (1998) Synthesis and crystal structure of maricite and sodium iron(III) hydroxyl phosphate, Chern. Materials 10, 763-768.
124

Broadbent D., Lewis G.G., and Wetton E.A.M. (1977) Phase equilibria in aqueous sodium phosphate solution at elevated temperatures, J. Chem. Soc. Dalton Trans. 5, 564-468.
Broadbent D., Lewis G.G., and Wetton E.A.M. (1978) High-temperature phosphate chemistry, Part IV Corrosion of mild steel in sodium phosphate solutions at 250, 300, and 350°C, CEGB Research Reoprt NW/SD/RR/67/78.
Broadbent D., Lewis G.G., and Wetton E.A.M. (1978) The chemistry of high temperature phosphate solutions in relation to steam generation, Proc. BNES Conf Water Chem. Nuclear Reactor Systems (London) pp. 53-62.
Bursik L. (2002) Once-through boiler as an autoclave for testing and organic cycle treatment chemical, PowerPlant Chemistry 4(2), 81-85.
Byrappa K. (1994) Hydrothermal growth of crystals, Handbook of Crystal Growth, Hurle, D.T.J., ed, Elsevier Science B.V., England, pp. 465-562.
Byrappa K., and Yoshimura M. (2001) Handbook of Hydrothermal Technology, William Andrew Publishing, New York, NY.
Chang, H.C., Healy, T.W., and Matijevic, E. (1983) Interactions of Metal Hydrous Oxides with Chelating Agents: III. Adsorption on Spherical Colloidal Hematite Particles, J. Colloid Interface Sci., 92, 469-478.
Chang, H.C., and Matijevic, E. (1983) Interactions of Metal Hydrous Oxides with Chelating Agents: IV. Dissolution of Hematite, J. Colloid Interface Sci., 92, 479-488.
Connor W.M., and Panson A.J. (1983) Investigation of phosphate-sludge interactions, EPRI Report NP-2963.
Daidouh A., Martinez J.L., Pico C., and Veiga M.L. (1999) Structure characterization and magnetic behaviour of NaNi4(P04)3 and KMTI4(P04)3, J. Solid State Chem. 144, 169-174.
Dooley R.B., and McNaughton W. (1996) Boiler tube failures, theory and practice, EPRI · Technical Report TR 105261, Vol2, Chapter 16.
Dooley R.B., Goodstine S., Jonas 0., Pocock F., Rice J. , and Stodola J. (1994) Cycle chemistry guidelines for fossil plants: phosphate treatment for drum units, EPRI Report TR-103655., Electric Power Research Institute, Palo Alto, Ca.
Dooley R.B., and Paterson S. (1994) Phosphate treatment: boiler tube failures lead to optimum treatment, Proc. 551
h Int. Water Conf (Pittsburgh, P.A.) Paper IWC-94-50.
125

Economy G., Panson A.J., Liu Chia-tsun, Esposito J.N., and Lindsay W.T. Jr. (1975) Sodium phosphate solutions at boiler conditions: Solubility, phase equilibria and interactions with magnetite, Proc.36th Int. Water Conf (Pittsburgh, PA.) pp.161-173.
Goranson R.W., (1931) Solubility ofwater in granite magmas, Amer. J Sci. 22, 481-502.
Greeden J.E., Reubenbauer K. Birchall T., Ehlert M., Corbin D.R., and Subramanian M.A. (1988) A magnetic and mossbauer study of the layered compound (NH4)Fe(P04) ·H20, J Solid State Chern. 77, 376-388.
Greenburg J.P., and Moller N. (1989) The prediction of mineral solubilities in natural waters: A chemical equilibrium model for the Na-K-Ca-S04-H20 systems to high concentration from 0 to 250°C, Geochim. Cosmochim. Acta., 53, 2503-2518.
Haar L., Gallagher J.S., and Kell G.S. (1984) NBS/NRC Steam Tables. Thermodynamic and Transport Properties and Computer Programs for Vapour and Liquid States of Water in Sf Units, Hemisphere Publishing, New York.
Habashi F. (1994) Recent advances in pressure leaching technology, Proc. F1 Int. Conf. Solvothermal Reactions 13-16 (Takamatsu, Japan).
Harada K., Arai T., Shimada M., Kawai N., and Kurosawa T. (1978) Corrosion of Inconel 600 in high temperature water. Part I: Design and construction of high temperature experimental apparatus under boiling heat transfer condition and corrosion behaviour in sodium triphosphate solution, Central Research Institute of Electric Power Industry (Japan), Report EEL-£277010.
Helgeson H.C., Delaney J.M., and Nesbitt H.W., and Bird D.K. (1978) Summary and critique of the thermodynamic properties of rock-forming minerals, Am., J Sci. 278A, 1-229.
Helgeson H. C., and Kirkham D.H. (1976) Theoretical prediction of the thermodynamic properties of aqueous electrolytes at high pressures an temperatures: III. Equation of state for aqueous species at infinite dilution, Am J Sci. 276, 97-240.
Helgeson H.C., and Kirkham D.H. (1981) Theoretical prediction of the thermodynamic properties of aqueous electrolytes at high pressures and temperatures: IV. Calculation of activity coefficients, osmotic coefficients, and apparent molal and standard and relative molal properties to 600°C and 5kb, Am. J. Sci. 281 , 1249-1493.
Ivanov Y.A., Egorov-Tismenko Y.K., Simonov M.A., and Belov N.Y. (1974) Crystal structure of cadmium ammonium phosphate, (NH4)Cd[P030H](OH), Sov. Phys. Crystallogr. 19(5), 665-666.
126

Ivanov Y.A., Simonov M.A., and Belov N.V. (1976) The crystal structure of a second modification of cadmium ammonium phosphate (NH4)Cd[P030H](OH), Sov. Phys. Crystallogr. 21(1), 109-110.
JCPDS (1991) Powder Diffraction File, JCPDS Int. Center for Diffraction Data Swarthmore, P.A.
Johnson J.W., Oelkers E.H., and Helgeson H.C. (1992) SUPCRT'92: A software package for calculation the standard molal thermodynamic properties of minerals, gases, aqueous species and reactions from 1 to 5000 bar and 0 to 1 000°C, Computers and Geoscience 18(7), 899-947.
Jonas 0., Blood F., Connick B., Lehner K., and Homan W.R. (1987) Water, steam, and turbine deposit chemistries in phosphate-treated drum boiler units, EPRJ Report CS-5275, Project No. 1986-9.
Jonas 0., and Layton K.F. (1988) Phosphate boiler water treatment for high pressure boilers, Proc. Second EPRI Fossil Plant Cycle Chemistry Conf (Seattle, W A).
Kirsh H. (1964) Phosphate containing deposits in high pressure steam generators. Mitteilung, VGB 89, 80-88.
LePage, Y.; Donnay, G. Can. Mineral. 1977, 15,518-521.
Lindsay W.T. Jr. (1989) Computer modeling of aqueous systems in power cycles, in Properties of Water and Steam, M. Pichal and 0. Sifner, eds., Hemisphere Publishing, New York, NY. pp. 29-38.
Lindsay W.T. (1990) Chemistry of steam cycle solutions: principles, in The ASME Handbook on Water Technology for Thermal Power Systems, Cohen, P. ed., Amer. Soc. Mech. Engineers, New York, NY. Chapter 7, 341-544.
Lobachev, A.N. (1971) Hydrothermal Synthesis of Crystals, Consultants Bureau, NewY ork-London.
Maier C.G., and Kelley K.K. (1932) An equation for the representation of high temperature heat content data, J. Am. Chern. Soc. 54, 3243-3246.
Marcy V.M., and Halstead S.L. (1964) Improved basis for coordinated phosphate-pH control of boiler water, Combustion Jan., 45-47.
Marshall W.L. (1985) Aqueous inorganic phase equilibria at high temperatures: Some experimental, theoretical, and applied aspects, Pure and Appli. Chern. 57, 283-301.
127

Marshall W.L. (1982) Two-liquid-phase boundaries and critical phenomena at 275-400°C for high-temperature aqueous potassium phosphate and sodium phosphate solutions. Potential applications for steam generators, J. Chern. Eng. Data 27, 175-180.
Marshall W.L., and Begun G.M. (1989) Raman spectroscopy of aqueous phosphate solutions at temperatures up to 450°C, J Chern. Soc., Faraday Trans. 2, 85, 1963-1978.
Martell, A.E., and Calvin, M. (1956) Chemistry of the Metal Chelate compounds, Prentice-Hall, Inc., New Jersey.
Martell, A.E., Motekaitis, R.J., Fried, A.R., Wilson, J.S., and MacMillan, D.T. (1975) Thermal Decomposition of EDT A, NT A, and Nitrilotrimethylene Phosphonic Acid in Aqueous Solutions, Can. J Chem., 53, 3471-3476.
Mesmer, R.E., and Baes, C.F. Jr. (1974) Phosphoric acid dissociation equilibria in aqueous solutions to 300°C, J Solution Chern. 3, 307-322.
Morey G.W. (1953) The system H20-NaP03, J. Arner. Chern. Soc. 75, 5794-5797.
Nacken, R. (1946) Artificial quartz crystals, etc., U.S. Office Of Technical Services Report, PB-18-748, 28-897.
Nordmann F., Dijoux M., and Stutzmann A., (2001) PowerPlant Chemistry 3(4), 209.
Panson A.J., Economy G., Liu Chia-tsun, Bulischeck T.S., and Lindsay W.T. Jr. (1975) Sodium phosphate solubility and phase relations basis for invariant point chemistry control, J. Electrochern. Soc. 122, 915-918.
Partridge E.P., and Hall R.E. (1939) Attack on steel in high-capacity boilers as a result of overheating due to steam blanketing, Trans. ASME, 10, 597-627.
Pessall N., Dunlop A.B., and Feldman D.W. (1977) The corrosion resistance of Inconel Alloy 600 in high temperature phosphate solutions, Corrosion 33( 4), 130-144.
Pitzer K.S., and Simonson J.M. (1986) Thermodynamics of multicomponent, miscible, ionic systems: Theory and equations, J Phys. Chem. 90, 3005-3009.
Pitzer K.S. (1991) Activity Coeficients in Electrolyte Solutions, 2"d ed, CRC Press, Boca Raton, Fl.
Pollard A.J., and Edwards A.J. (1963) An investigation of the effects of alkaline phosphate solutions at elevated temperature on compounds prepared at room temperature, U.S. Naval Research Laboratory Report NRL 5865.
128

Quinlan S. (1996) Thermochemistry of aqueous sodium phosphate interactions with metal oxides in high temperature water, MSc. Thesis, Memorial University of Newfoundland.
Qui, L., and White, M.A. (2001) The constituent additivity method to estimate heat capacities of complex inorganic solids, J. Chemical Education 78(8), 1076-1079.
Ravich M.l., and Scherbakova L.A. (1955) Nature of the solid phase which crystallizes from aqueous solutions of trisodium orthophosphate at high temperatures, Izvest. Sektora Fiz. Khim. Anal., Inst. Obshchei Neorg. Khim. Akad. Nauk SSSR 26, 248-258.
Sanz F., Parada C., Rojo J.M., and Ruiz-Valero C. (1999) Crystal structure, magnetic properties, and ionic conductivity of a new mixed-anion phosphate N'4Nis(P04)2(P207)2, Chern. Mater. 11,2673-2679.
Schroeder W.C., Berk A.A., and Gabriel A. (1937) Solubility of equilibria of sodium sulfate at temperatures from 150 to 350°C. III. Effect of sodium hydroxide and sodium phosphate, J. Amer. Chern. Soc. 59, 1783-1790.
Shock H.L., and Helgeson H. C. (1988), Calculation of the thermodynamic and transport properties of aqueous species at high pressures and temperatures: Correlation algorithms for ionic species and equation of state predictions to 5kB and 1 000°C, Geochim. Cosmochim. Acta, 52, 2009.
Shock E.L., Oelkers E.H., Johnson J.W., Swerjensky D.A., and Helgeson H.C. (1992) Calculation of the thermodynamic properties of aqueous species at high pressures and termperatures: Effective electrostatic radii, dissociation constants and standard partial molar properties to 1000°C and 5kbar, J Chern. Soc. Faraday Trans. 88, 803-826.
Sir Roderick Murchison (1840's), (cited by S. Somiya)
Straub F.G. (1950) Hideout of sodium phosphate in high-pressure boilers, Trans. ASME 72, 4 79-489.
Stodola J. (1985) Phosphate and other hide-out, Proc. Fossil Plant Water Chemistry Symposium, EPRI Report CS-4950.
Stodola J. (1986) Review of boiler water alkalinity control, Proc. 471h Int. Water. Conf
(Pittsburgh, PA.) pp. 1-9.
Stumm W., and Morgan J.J. (1970) Aquatic Chemistry, Wiley-Interscience, New York, NY.
129
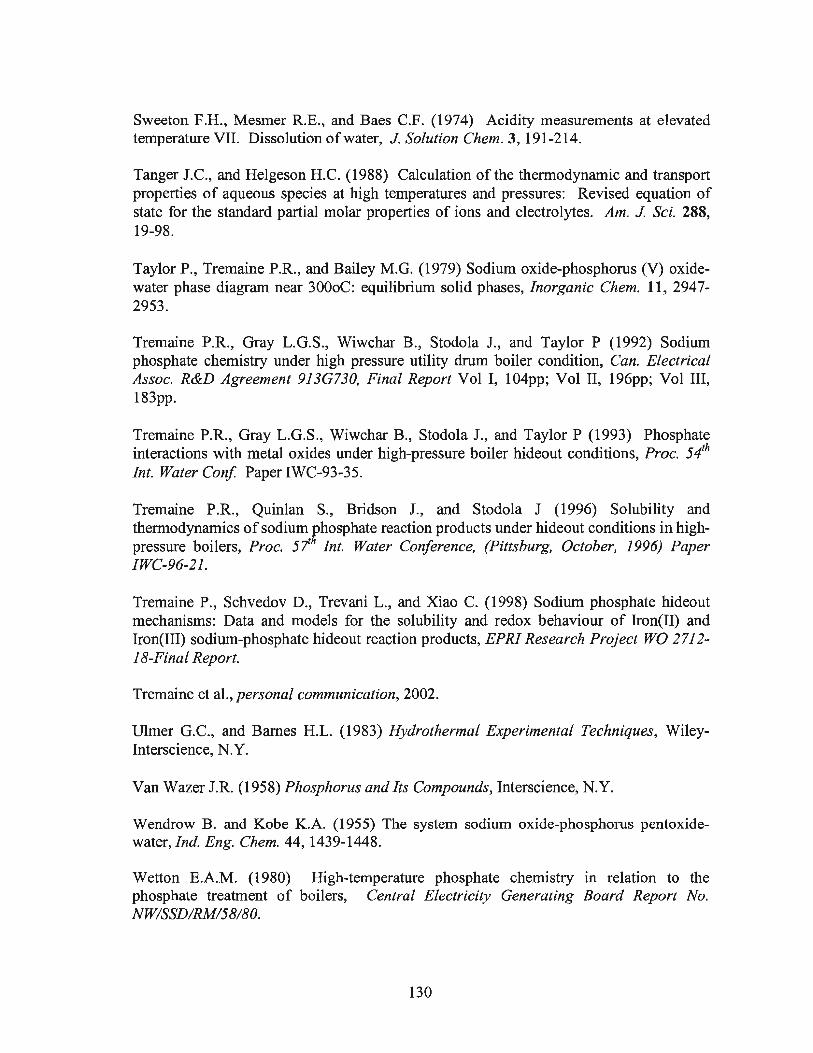
Sweeton F.H., Mesmer R.E., and Baes C.F. (1974) Acidity measurements at elevated temperature VII. Dissolution of water, J Solution Chern. 3, 191-214.
Tanger J.C., and Helgeson H. C. (1988) Calculation of the thermodynamic and transport properties of aqueous species at high temperatures and pressures: Revised equation of state for the standard partial molar properties of ions and electrolytes. Am. J Sci. 288, 19-98.
Taylor P ., Tremaine P.R., and Bailey M.G. (1979) Sodium oxide-phosphorus (V) oxidewater phase diagram near 300oC: equilibrium solid phases, Inorganic Chern. 11, 2947-2953.
Tremaine P.R., Gray L.G.S., Wiwchar B., Stodola J., and Taylor P (1992) Sodium phosphate chemistry under high pressure utility drum boiler condition, Can. Electrical Assoc. R&D Agreement 913G730, Final Report Vol I, 104pp; Vol II, 196pp; Vol III, 183pp.
Tremaine P.R., Gray L.G.S., Wiwchar B., Stodola J., and Taylor P (1993) Phosphate interactions with metal oxides under high-pressure boiler hideout conditions, Proc. 5lh Int. Water Conf Paper IWC-93-35.
Tremaine P.R., Quinlan S., Bridson J., and Stodola J (1996) Solubility and thermodynamics of sodium phosphate reaction products under hideout conditions in highpressure boilers, Proc. 5i Int. Water Conference, (Pittsburg, October, 1996) Paper IWC-96-21.
Tremaine P., Schvedov D., Trevani L., and Xiao C. (1998) Sodium phosphate hideout mechanisms: Data and models for the solubility and redox behaviour of Iron(ll) and Iron(lll) sodium-phosphate hideout reaction products, EPRI Research Project WO 2712-18-Final Report.
Tremaine et al., personal communication, 2002.
Ulmer G.C., and Barnes H.L. (1983) Hydrothermal Experimental Techniques, WileyInterscience, N.Y.
Van Wazer J.R. (1958) Phosphorus and Its Compounds, Interscience, N.Y.
Wendrow B. and Kobe K.A. (1955) The system sodium oxide-phosphorus pentoxidewater, Ind. Eng. Chern. 44, 1439-1448.
Wetton E.A.M. (1980) High-temperature phosphate chemistry in relation to the phosphate treatment of boilers, Central Electricity Generating Board Report No. NW/SSD/RM/58/80.
130

Wetton E.A.M. (1981) Phase equilibria in aqueous sodium phosphate solutions at 350°C, Power Industry Research l, 151-158.
Ziemniak S.E., Jones M.E., and Combs K.E.S. (1989) Solubility and phase behaviour of nickel oxide in aqueous sodium phosphate solutions at elevated temperatures, J. Solution. Chem. 18, 1132-1152.
Ziemniak S.E. and Opalka E.P. (1988) Nickel oxide stability in aqueous sodium phosphate solutions at elevated temperatures, Proc. Int. Symp. on Environmental Degradation of materials in Nuclear Power Systems-Water Reactors, Theus. G.J., and Weeks, J.R., eds. Pp. 153-156.
Ziemniak S.E., and Opalka E.P. (1992) Magnetite stability in aqueous sodium phosphate solution at elevated temperatures, Knolls Atomic Power Lab Report KAPL-4735.
Ziemniak S.E., and Opalka E.P. (1993) Proc. Sixth Int. Symposium on Environmental Degradation of Materials in Nuclear Power Systems-Water Reactors, Gold R.E., and Simonen E.P., eds. (Warrendale, PA.) pp. 929-935.
Ziemniak S.E., Stalnaker N.D., Jones M.E., and Grossman B. (1981) Chemical interactions between high temperature aqueous solutions of sodium phosphate and magnetite, EPRI Workshop (Minneapolis., MN, June 1981) Abstract.
131

APPENDICES
132

APPENDIX 1: Powder X-ray Diffraction Results
133

TABLE A.I.l: X-Ray Diffraction Results for Maricite
Quinlan (1996), Quinlan (1996), Product synthesized from synthesized from JCPDS database RGH05 FeNTA Fe powder Maricite
dobs l/l10o dobs l/l10o dobs l/l10o dobs I/lwo
4.4944 33.9 4.514 45 4.512 49 4.500 5 4.3969 13.4 4.417 31 4.409 53 4.400 20
3.768 13 3.775 54 3.757 10 3.6995 13.0 3.714 18 3.721 63 3.705 40 3.3550 6.6 2.7220 70.0 2.730 28 2.728 84 2.729 90
2.710 36 2.713 85 2.707 80 2.5751 100 2.582 100 2.579 100 2.574 100 2.5216 11.8 2.527 17 2.522 43 2.525 30 2.4282 7.5 2.432 23 2.431 30 2.431 15 2.3991 6.5 2.401 28 2.401 10 2.2466 10.6 2.254 22 2.244 1
2.203 8 2.0934 8.9 2.098 10 2.096 30 2.096 10
2.062 6 2.062 2 2.027 49
1.8798 22.7 1.883 15 1.880 41 1.881 30 1.8518 16.0 1.854 21 1.852 35 1.853 60 1.7158 6.9 1.717 13 1.717 23 1.714 15 1.6934 7.9 1.697 10 1.690 22 1.696 1
1.681 21 1.654 7 1.653 21
1.5183 18.0 1.520 28 1.519 10 1.5073 11.6 1.509 27 1.508 15 1.4982 21.3 1.490 15 1.4282 11.0 1.429 5 1.2880 13.8 1.288 5
134

TABLE A.I.2: X-Ray Diffraction Results for SIHP from PeNTA Decomposition
Quinlan( 1996) JCPDS JCPDS JCPDS Product SIHP Database Database Database
RGH32B From FeP04 Magnetite Maricite Na3P04
dabs 1/IIOo dobs l/l10o dobs III10o dobs I/I10o dobs III10o
7.7812 18.3 7.769 78 7.3562 15.2 7.367 73
7.160 30 5.3421 27.9 5.343 32 4.8540 31.8 4.8520 8
4.500 5 4.400 20
4.180 90 3.757 10 3.705 40 3.700 50
3.6345 29.2 3.637 7 3.580 60
3.4285 17.9 3.432 15 3.3190 10.9 3.323 19 2.9658 10.5 2.9670 30
2.729 90 2.707 80
2.6661 100 2.668 100 2.6205 41.2 2.624 6
2.582 100 2.5571 29.4 2.557 8 2.574 100 2.5494 18.1 2.5320 100 2.531 70
2.525 30 2.478 40
2.450 13 2.4243 8 2.431 15 2.433 70 2.401 10 2.389 50
2.279 40 2.244 1
2.1335 8.4 2.116 5 2.0993 20 2.096 10
2.0723 7.1 2.081 8 2.062 2 1.995 30
1.9390 37.9 1.940 60 1.955 30
135

TABLE A.I.2 (continued)
Quinlan( 1996) JCPDS JCPDS JCPDS Product SIHP Database Database Database
RGH32B From FeP04 Magnetite Maricite Na3P04
dobs I/l10o dobs I/I10o dobs III10o dobs III10o dobs I/I10o
1.935 34 1.916 30 1.876 4 1.881 30
1.853 60 1.854 40 1.8353 13.7 1.837 38
1.832 23 1.7771 11.3 1.779 4 1.792 50
1.7146 10 1.714 15 1.696 1
1.6158 30 1.5438 22.7 1.546 5 1.550 20
1.519 10 1.5035 21.8 1.505 4 1.4845 40 1.508 15 1.498 40
1.490 15 1.472 70 1.4192 2 1.429 5
1.383 20 1.334 5 1.3277 4
1.2807 10 1.288 5 1.291 30 1.2659 4 1.2119 2
136

TABLE A.I.3: X-Ray Diffraction Results for SIHP from PeNTA Decomposition
Quinlan JCPDS JCPDS JCPDS JCPDS Product (1996) Database Database Database Database
RGH59B SIHP Magnetite Hematite Maricite Na3P04
dobs IIIIoo dobs I/I10o dobs III10o dobs I/I10o dobs III10o dobs III10o
7.7610 21.8 7.769 78 7.3373 19.7 7.367 73
7.160 30 5.3326 25.7 5.343 32 4.8524 14.8 4.8520 8
4.500 5 4.400 20
4.180 90 3.757 10
3.6840 30 3.705 40 3.700 50 3.6309 19.8 3.637 7
3.580 60 3.4245 19.4 3.432 15 3.3154 14.6 3.323 19
2.9670 30 2.7211 26.0 2.729 90
2.7000 100 2.707 80 2.6638 100 2.668 100 2.6202 24.6 2.624 6 2.5806 15.0 2.582 100 2.5706 11.0 2.557 8 2.574 100
2.5320 100 2.531 70 2.5190 70 2.525 30
2.478 40 2.4425 6.4 2.450 13 2.4243 8 2.431 15 2.433 70
2.401 10 2.389 50 2.2920 3 2.279 40
2.244 1 2.2070 20
2.116 5 2.0993 20 2.096 10
2.0683 8.7 2.081 8 2.0779 3 2.062 2 1.995 30
1.9377 38.4 1.940 60 1.955 30 1.935 34 1.916 30
137

TABLE A.I.3 (continued)
Quinlan JCPDS JCPDS JCPDS JCPDS Product (1996) Database Database Database Database
RGH59B SIHP Magnetite Hematite Maricite Na3P04
dobs I/I10o dabs III10o dobs III10o dobs III10o dobs I/I10o dobs l/l10o
1.8755 12.2 1.876 4 1.881 30 1.8518 10.6 1.8406 40 1.853 60 1.854 40 1.8343 16.7 1.837 38
1.832 23 1.779 4 1.792 50
1.7146 10 1.714 15 1.6941 45 1.696 1 1.6367 1
1.6158 30 1.6033 5 1.5992 10
1.5436 14.3 1.546 5 1.550 20 1.519 10
1.5029 22.6 1.505 4 1.4845 40 1.4859 30 1.508 15 1.498 40 1.490 15 1.472 70
1.4538 30 1.4192 2 1.4138 1 1.429 5
1.383 20 1.334 5 1.3277 4 1.3497 3
1.3115 10 1.2807 10 1.3064 6 1.288 5 1.291 30 1.2659 4 1.2592 8
1.2272 4 1.2119 2 1.2141 2
138

TABLE A.I.4: X-Ray Diffraction Results for SlliP from PeNTA Decomposition
Quinlan (1996) Product SIHP from JCPDS database JCPDS database
RGH60A FeP04 Na3P04 FezPOs
dobs III10o dobs III10o dobs III10o dobs I/I10o
13.9757 21.0 7.7593 19.2 7.769 78 7.3563 19.9 7.367 73 5.3410 28.3 5.343 32
5.2500 20 4.8533 29.9 4.8800 20
4.3350 40 4.2830 11.9 4.2750 50
3.6900 20 3.6346 29.7 3.637 7 3.4260 14.4 3.432 15 3.3223 13.1 3.323 19 3.3200 100
3.2200 20 2.9520 19 2.7440 70
2.6685 100.0 2.668 100 2.6550 30 2.6183 72.6 2.624 6 2.6250 100 2.6220 25 2.5528 52.2 2.557 8
2.450 13 2.4300 28 2.3570 19 2.3170 50
2.2510 20 2.2376 11.2 2.2290 15 2.1336 9.1 2.116 5 2.1390 10
2.081 8 2.0620 25 1.9940 3
1.9415 18.9 1.940 60 1.935 34 1.876 4 1.8530 30 1.8640 19
1.8373 13.3 1.837 38 1.832 23
1.7731 11.7 1.779 4 1.7180 1 1.7080 1 1.6580 5 1.6530 25
139

TABLE A.I.4 (continued)
Quinlan ( 1996) Product SIHP from JCPDS database JCPDS database
RGH60A FeP04 Na3P04 Fe2POs
dobs I/11 00 dobs IIIJOo dobs IIIJOo dobs 1/IJOo
1.6090 55 1.5760 14
1.5456 20.3 1.546 5 1.5380 30 1.5042 20.8 1.505 4 1.5150 20 1.4770 8.8 1.4770 12
1.4260 10 1.4470 18 1.334 5 1.3310 20
1.3150 18
140

TABLE A.I.S: X-Ray Diffraction Results for SIHP from Fe2(C4H40 6) 3 Decomposition
JCPDS Quinlan JCPDS JCPDS Database JCPDS
Product (1996) Database Database Sodium Database RGH29A SIHP Maricite Na3P04 Tartrate H3P04·0.5
From FeP04 Hydrate H20
dobs IIIIoo dobs I/I10o dobs IIIIOo dabs IIIIOo dobs III10o dobs III10o
9.0172 27.4 9.031 100 7.7786 14.8 7.769 78 7.3730 9.8 7.367 73
7.160 30 7.020 40
5.730 29 5.3419 24.0 5.343 32 4.8488 9.8 4.890 46
4.698 25 4.4826 22.2 4.500 5 4.498 41
4.400 20 4.180 90
3.880 46 3.757 10
3.7062 6.6 3.705 40 3.700 50 3. 720 52 3.680 15
3.6348 14.0 3.637 7 3.633 42 3.650 100 3.580 60
3.5566 13.3 3.560 44 3.510 12
3.482 25 3.4213 13.8 3.432 15
3.390 11 3.3125 36.0 3.323 19 3.339 17
3.332 18 3.250 68 3.210 44
2.9943 15.9 2.980 3 2.964 22
2.910 26 2.865 21
2.8518 9.8 2.856 21 2.840 14
141

TABLE A.I.S (continued)
JCPDS Quinlan JCPDS JCPDS Database JCPDS
Product (1996) Database Database Sodium Database RGH29A SlliP Maricite Na3P04 Tartrate H3P04·0.S
From FeP04 Hydrate HzO
dobs III10o dobs Ill10o dobs III10o dobs III10o dobs III10o dobs III10o
2.830 15 2.8021 8.1 1.797 59 1.810 4 2.7148 16.4 1.719 90
1.707 80 2.6614 100 1.668 100 1.669 10
2.624 6 2 .622 22 2.5828 21.8 1.581 100 1.591 6 2.5684 12.8 1.557 8 1.574 100
2.531 70 2.525 30
2.478 40 2.481 34 2.450 13 2.431 15 2.433 70 2.466 18 2.446 14
2.438 12 2.3986 9.2 1.401 10 1.389 50
2.311 28 2.279 40
2.2396 8.1 1.144 1 1.149 10 1.154 8 2.1109 6.8 1.116 5
2.096 10 2.081 8 2.062 2 2.063 27
1.995 30 1.9378 16.9 1.940 60 1.955 30
1.935 34 1.916 30 1.876 4 1.881 30
1.8551 19.3 1.853 60 1.854 40 1.860 10 1.8310 9.4 1.837 38
1.832 23 1.779 4 1.792 50
1.714 15 1.696 1
1.5436 5.0 1.546 5 1.550 10
142

TABLE A.I.S (continued)
JCPDS Quinlan JCPDS JCPDS Database JCPDS
Product (1996) Database Database Sodium Database RGH29A SIHP Maricite Na3P04 Tartrate H3P04·0.5
From FeP04 Hydrate HzO
dobs Ill too dobs Ill too dobs Ill too dobs I/IJOo dobs 111100 dobs Ill 10o
1.519 10 1.5008 5.0 1.505 4 1.508 15 1.498 40
1.490 15 1.472 70 1.429 5
1.383 20 1.334 5
1.288 5 1.291 30
143

TABLE A.l.6: X-Ray Diffraction Results for SIHP from Fe2(C20 4)3'5H20 Decomposition
Quinlan ( 1996) JCPDS JCPDS Product SIHP Database Database
RGH78B From FeP04 FezPOs Na3P04
dabs I/I10o dabs III10o dabs I/I10o dabs VI10o
7.9709 14.4 7.8460 47.6
7.769 78 7.3952 11.3 7.367 73
7.160 30 5.3712 27.2 5.343 32
5.2500 20 4.8939 16.0 4.8800 20
4.180 90 3.700 50
3.6525 24.8 3.637 7 3.580 60
3.4474 13.4 3.432 15 3.4400 14.7 3.3333 8.0 3.323 19 3.3200 100 3.3261 12.8
3.2200 20 2.9520 19 2.7440 70
2.6727 100 2.668 100 2.6359 28.1 2.624 6 2.6220 25 2.5637 22.0 2.557 8 2.582 100
2.531 70 2.478 40
2.450 13 2.4300 28 2.433 70 2.389 50
2.3570 19 2.3170 50
2.279 40 2.1369 6.7 2.116 5 2.1168 7.9
144

TABLE A.l.6 (continued)
Quinlan ( 1996) JCPDS JCPDS Product SIHP Database Database
RGH78B From FeP04 FezPOs Na3P04
<fobs I/I10o dobs I/I10o dobs VI10o dobs III10o
2.081 8 2.0620 25 1.995 30
1.9412 48.2 1.940 60 1.955 30 1.935 34 1.916 30 1.876 4
1.8640 19 1.854 40 1.8341 10.8 1.837 38
1.832 23 1.7876 6.5 1.779 4 1. 792 50
1.6530 25 1.6090 55 1.5760 14
1.5458 16.7 1.546 5 1.5380 30 1.550 20 1.5029 13.4 1.505 4 1.498 40
1.4770 12 1.472 70 1.4470 18
1.383 20 1.334 5 1.3310 20
1.3150 18 1.291 30
145

TABLE A.l.7: X-Ray Diffraction Results for (NH4)Fez(P04)z from Fez(C4H406)J Decomposition
Boudin JCPDS JCPDS and Lii (1998) JCPDS database database
Product (NH4)Fez database Fe(P04) (NH4)Ils(P04)2 RGII51A (P04)z Hematite ·2Hz0 ·HzO
dobs III1oo dobs I/110o dabs III10o dobs I/I10o dobs III10o
8.2854 43.73 6.5200 50
6.2014 63.2 6.0300 10
5.9792 15.57 5.6685 15.1 5.6508 56.41
5.5600 10 5.5090 60
5.4645 9.3 5.4500 50 4.9540 30 4.3830 85
4.1315 9.9 4.1446 11.79 3.9960 45
3.9200 15 3.8700 10 3.8300 70
3.7190 25 3.6840 30
3.6000 10 3.5700 100
3.5033 15.8 3.3975 8.68
3.1172 16.3 3.1140 100 3.1039 12.0
3.0562 6.96 3.0188 14.45 3.0020 45
2.9836 100.0 1.9894 100.0 2.9600 35
2.9490 45 2.7299 64.6 1.7360 7.51 2.6890 51.3 1.7000 100 1.6900 5 2.6156 8.7 1.6310 11 2.5341 12.9 1.5164 15.19 1.5460 50
146

TABLE A.I.7 (continued)
Boudin JCPDS JCPDS and Lii (1998) JCPDS database database
Product (NR+)Fe2 database Fe(P04) (~4)Ifs(P04)2 RGII51A (P04)2 Ifematite ·2If20 ·If20
dobs l/l10o dabs III10o dobs l/l10o dobs l/l10o dobs III10o
2.5310 35 2.4994 21.8 2.5007 13.8 2.5190 70 2.4938 15.4 2.4700 5
2.4600 10 2.4424 6.22 2.4440 25
2.2920 3 2.2070 20 2.2130 15
2.1545 9.5 2.1785 3.05 2.1530 10 2.1320 35
2.0779 3 2.0030 20
1.9773 10.4 1.9712 2.88 1.9580 20 1.9750 5 1.9225 9.2 1.9280 5
1.8836 8.22 1.8540 9.37 1.8406 40
1.8076 7.3 1.8248 9.56 1.8058 16 1.8210 5 1. 7940 5
1.6858 10.5 1.6905 11.71 1.6941 45 1.6950 5 1.6367 1 1.6390 15 1.6033 5 1.5992 10
1.5335 9.58 1.5557 20 1.4868 8.8 1.4886 4.12 1.4859 30 1.4789 19 1.4950 5
1.4746 11 1.4538 30 1.4138 1 1.3497 3 1.3115 10 1.3064 6 1.2592 8 1.2276 4 1.2141 2
147

TABLE A.I.8: X-Ray Diffraction Results for (NH4)Fez(P04)2 from Fez(C,JI406)3 Decomposition
Boudin JCPDS JCPDS Product and Lii (1998) Database Database
RGH62A (NH4)Fez(P04)2 Hematite (NH4)HzP04
dobs l/l10o dobs III10o dabs III10o dobs I/I10o
8.2854 43.73 6.3203 41.0 6.2460 57.0
5.9792 15.57 5.6508 56.41
5.3243 64 4.1446 11.79
3.7511 15.6 3. 7507 50 3.6840 30
3.3975 8.68 3.1237 14.3 3.0884 14.5 3.0779 94 3.0678 8.0 3.0562 6.96 3.0673 100
3.0188 14.45 2.9838 100 2.9894 100 2.7257 51.6 2. 7360 7.51 2.6914 47.6 2.7000 100 2.6804 13.2 2.6604 25
2.6525 25 2.5430 16.0 2.5264 15.19 2.4970 28.1 2.5007 13.8 2.5190 70 2.4940 34.2
2.4424 6.22 2.3877 14 2.3725 13
2.2920 3 2.2070 20
2.1542 18.3 2.1785 3.05 2.1166 9.5 2.0901 15.5 2.0779 3
2.0146 59 2.0091 67
1.9792 18.3 1.9712 2.88 1.8836 8.22
148

TABLE A.I.8 (continued)
Boudin JCPDS JCPDS Product and Lii (1998) Database Database
RGH62A (NH4)Fez(P04)z Hematite (NH4)HzP04
dobs III10o dobs III10o dobs l/110o dobs 1/IJOo
1.8540 9.37 1.8406 40 1.8225 26.3 1.8248 9.56 1.7748 11 1.7400 8.9
1.6905 11.71 1.6941 45 1.6871 8 1.6776 10
1.6367 1 1.6033 5 1.6036 21 1.5992 10 1.6010 21
1.5147 17.8 1.5335 9.58 1.4886 4.12 1.4859 30 1.4771 9
1.4716 11 1.4538 30 1.4138 1
1.3711 15 1.3497 3 1.3312 12 1.3115 10 1.3064 6 1.2592 8 1.2541 13 1.2276 4 1.2141 2
149
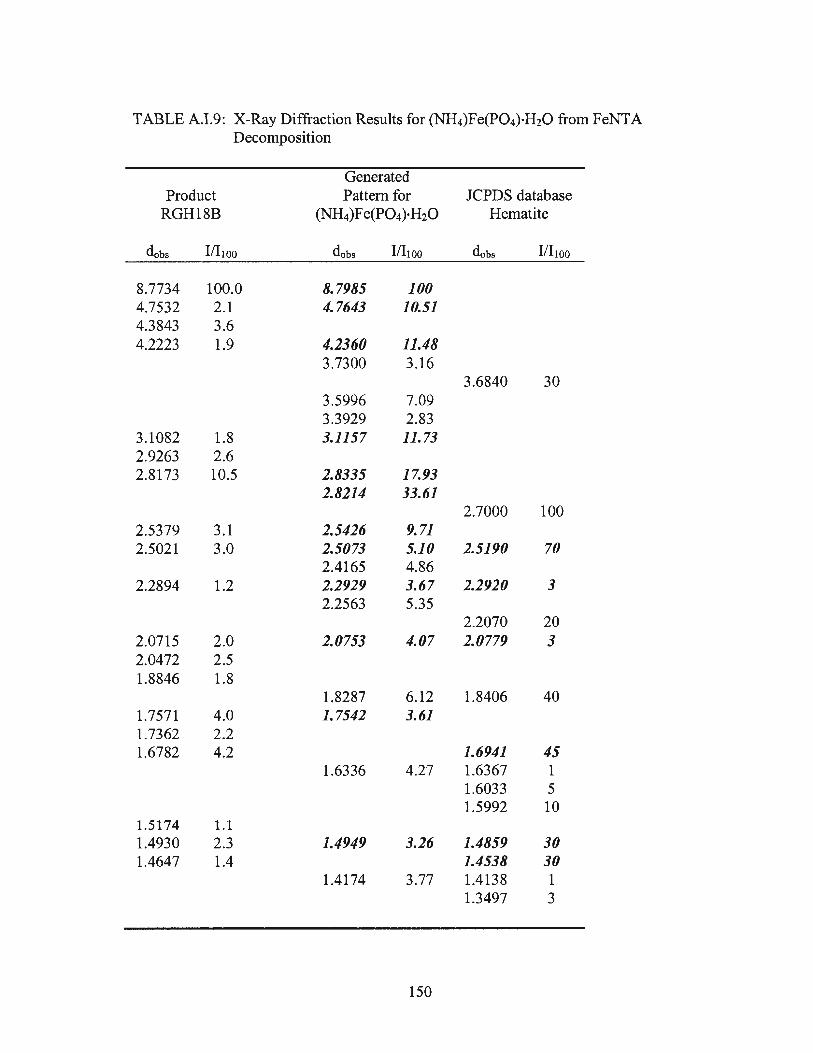
TABLE A.I.9: X-Ray Diffraction Results for (NH4)Fe(P04)·HzO from PeNTA Decomposition
Generated Product Pattern for JCPDS database
RGH18B (NH4)F e(P04)· HzO Hematite
dobs I/I10o dabs III10o dobs l/l10o
8.7734 100.0 8.7985 100 4.7532 2.1 4.7643 10.51 4.3843 3 .6 4.2223 1.9 4.2360 11.48
3.7300 3.16 3.6840 30
3.5996 7.09 3.3929 2.83
3.1082 1.8 3.1157 11.73 2.9263 2.6 2.8173 10.5 2.8335 17.93
2.8214 33.61 2.7000 100
2.5379 3.1 2.5426 9.71 2.5021 3.0 2.5073 5.10 2.5190 70
2.4165 4.86 2.2894 1.2 2.2929 3.67 2.2920 3
2.2563 5.35 2.2070 20
2.0715 2.0 2.0753 4.07 2.0779 3 2.0472 2.5 1.8846 1.8
1.8287 6.12 1.8406 40 1.7571 4.0 1. 7542 3.61 1.7362 2.2 1.6782 4.2 1.6941 45
1.6336 4.27 1.6367 1 1.6033 5 1.5992 10
1.5174 1.1 1.4930 2.3 1.4949 3.26 1.4859 30 1.4647 1.4 1.4538 30
1.4174 3.77 1.4138 1 1.3497 3
150
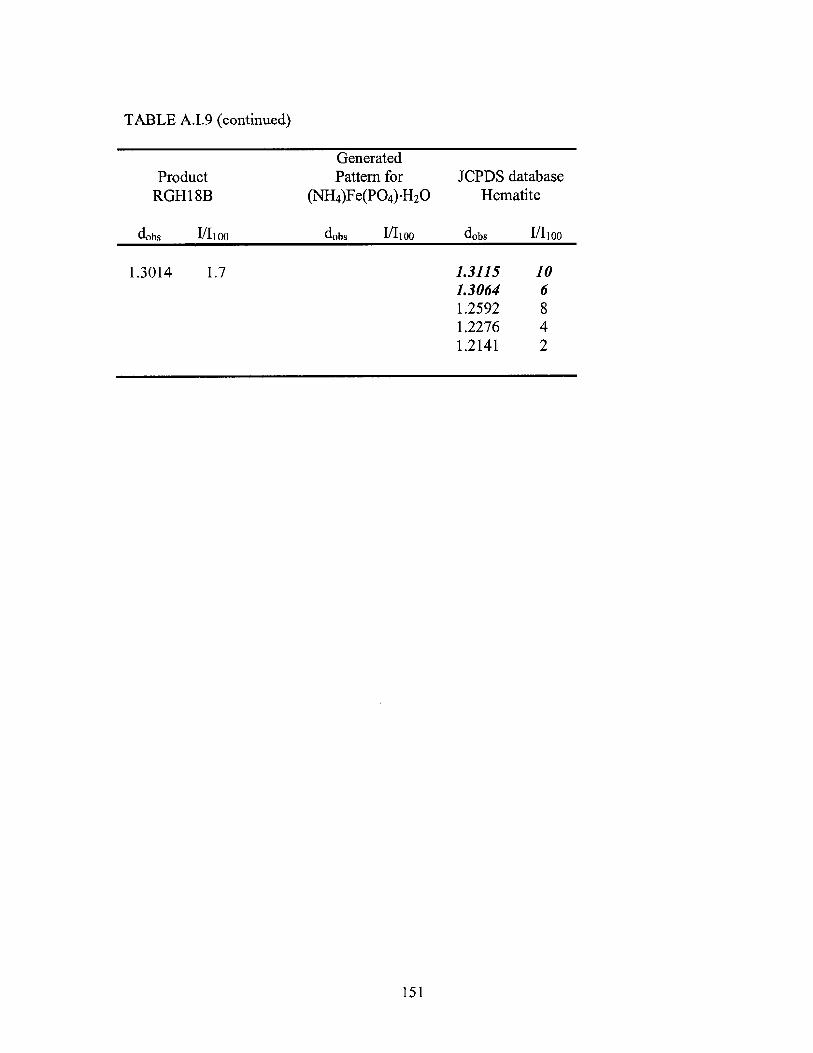
TABLE A.I.9 (continued)
Product RGH18B
dobs III10o
1.3014 1.7
Generated Pattern for JCPDS database
(NH4)Fe(P04)·HzO Hematite
dobs III1oo
151
dobs
1.3115 1.3064 1.2592 1.2276 1.2141
Ill10o
10 6 8 4 2

TABLE A.l.10: X-Ray Diffraction Results for Na2Ni(OH)P04 from NiO Reaction
Ziemniak and JCPDS JCPDS JCPDS Product Opalka (1988) Database Database Database
RGH92A Na2Ni(OH)P04 N~Ni(P04)2 NiO Na3P04
dobs I/I10o dobs III10o dobs III10o dobs III10o dobs I/I10o
10.780 29 8.120 17
7.4855 7.2 7.510 53 7.4134 12.9
6.500 8 6.160 27
6.0997 6.7 5.900 5 5.780 8 5.090 3 4.770 16 4.458 5
4.2650 6.1 4.2800 70 4.2167 5.1 4.200 52 4.235 70 4.1817 20.0
3.924 25 3.873 8
3.7100 20 3.550 12 3.400 13 3.381 6
3.2235 7.8 3.210 20 3.250 6 3.151 5 3.108 6
2.940 9 2.932 5 2.829 18 2.771 4 2.701 25
2.6226 6.8 2.6210 100 2.6071 18.3 2.5851 48.5 2.590 100 2.592 100 2.5322 16.1 2.520 32 2.540 8
2.511 4 2.453 5
2.4062 57.3 2.401 14 2.4120 60 2.370 4
152

TABLE A.l.l 0 (continued)
Ziemniak and JCPDS JCPDS JCPDS Product Opalka (1988) Database Database Database
RGH92A Na2Ni(OH)P04 N~Ni(P04)2 NiO Na3P04
dobs 1/IIOo dobs 1/IIOo dobs 1/IIOo dobs III10o dobs I/l10o
2.293 6 2.270 5
2.226 6 2.180 6 2.201 12 2.150 8 2.1400 20
2.0970 8.1 2.100 7 2.117 8 2.0834 100 2.0880 100
2.050 9 2.042 4 1.974 5 1.962 5
1.925 4 1.909 6
1.8668 6.1 1.875 7 1.8530 20 1.865 5 1.830 19 1.831 15
1.7925 7.0 1.790 12 1.7742 3 1.782 8 1.654 5 1.6658 4
1.6353 5 1.601 3 1.557 3
1.5048 4.9 1.508 11 1.5130 30 1.4745 55.4 1.472 12 1.4955 12 1.4770 35
1.4760 35 1.4260 40
1.2582 18.3 1.2600 18 1.2586 12
1.2051 10.1 1.2064 16
153

TABLE A.I.ll: X-Ray Diffraction Results for Na2Ni(OH)P04 from H+[NiNTA-] Decomposition
Ziemniak and JCPDS JCPDS JCPDS Product Opalka (1988) Database Database Database
RGH89A NazNi(OH)P04 Ni(OH)z N~Ni(P04)2 Na2HP04
dobs l/l10o dobs Ill10o dobs Ill10o dobs IIIJOo dobs 1/IJOo
10.780 29 8.120 17
7.510 53 7.0426 16.6 6.8782 24.8 6.8155 19.8 6.5451 16.5
6.500 8 6.160 27
5.900 5 5.780 8 5.090 3
4.900 10 4.7767 25.6 4.770 16
4.605 100 4.4967 12.4
4.458 5 4.235 70
4.200 52 3.9611 14.6 3.980 45 3.9036 11.8 3.924 25 3.8887 34.4 3.873 8
3.840 55 3.7523 16.0 3.7433 27.1 3.7111 50.5 3.5661 14.1 3.550 12
3.400 13 3.420 20 3.381 6
3.210 20 3.2936 11.0
3.250 6 3.1997 14.3
3.151 5
154

TABLE A.I.ll (continued)
Ziemniak and JCPDS JCPDS JCPDS Product Opalka (1988) Database Database Database
RGH89A Na2Ni(OH)P04 Ni(OH)2 N~Ni(P04)2 Na2HP04
dobs l/l10o dobs Ill10o dobs l/l10o dobs Ill10o dobs Ill10o
3.108 6 2.940 9 2.932 5
2.880 40 2.829 18
2.7846 79.0 2.805 100 2.771 4
2.7154 73.0 2.730 50 2.720 25
2.7034 100.0 2.707 45 2.701 25 2.6988 63.0
2.655 20 2.5960 76.8 2.590 100 2.592 100 2.5640 66.3 2.5216 16.6 2.520 32 2.540 8 2.537 8
2.511 4 2.453 5 2.453 18 2.401 14
2.370 4 2.334 100 2.302 2 2.309 8
2.293 6 2.270 5
2.226 6 2.180 6 2.201 12 2.197 10 2.150 8
2.0943 10.4 2.100 7 2.117 8 2.050 9 2.042 4 2.047 8
2.0222 10.6 1.994 16
1.974 5 1.962 5 1.9423 13.9 1.925 4 1.921 18
1.909 6 1.875 7
1.8582 18.6 1.865 5 1.830 19 1.831 15
155

TABLE A.I.ll (continued)
Ziemniak and JCPDS JCPDS JCPDS Product Opalka (1988) Database Database Database
RGH89A Na2Ni(OH)P04 Ni(OH)z N~Ni(P04)2 Na2HP04
dobs VIIOO dobs Vl10o dobs I/l10o dobs III10o dobs III10o
1.790 12 1.812 8 1.782 8 1.774 3
1.754 35 1.751 18 1.7128 10.3 1.712 16
1.654 5 1.6658 4 1.6353 5
1.601 3 1.595 14 1.5472 10.9 1.557 3 1.563 25
1.535 1 1.508 11 1.472 12 1.480 16 1.4955 12
1.354 4 1.335 8 1.299 10 1.293 2 1.167 8
156

TABLE A.I.12: X-Ray Diffraction Results for Na2Ni(OH)P04 from H+[NiNTA"] Decomposition
Ziemniak and JCPDS JCPDS Product Opalka (1988) Database Database
RGH66A Na2Ni(OH)P04 Ni(OH)2 N~Ni(P04)2
dabs Vl10o dabs IIIJOo dabs IIIJOo dabs 1/IJOo
10.9222 4.4 10.780 29
8.120 17 7.4861 18.8 7.510 53
6.500 8 6.1475 13.6 6.160 27
5.900 5 5.780 8 5.090 3 4.770 16
4.6071 8.0 4.605 100 4.458 5 4.235 70
4.2041 40.6 4.200 52 3.924 25 3.873 8
3.550 12 3.5286 6.1 3.4089 11.3 3.400 13 3.381 6 3.2374 16.4 3.250 6
3.210 20 3.151 5 3.108 6
2.940 9 2.932 5 2.829 18 2.771 4
2.707 45 2.701 25 2.5895 100.0 2.590 100 2.592 100 2.5406 38.4 2.520 32 2.540 8
2.511 4 2.453 5 2.401 14
2.370 4 2.3324 10.8 2.334 100
157
TABLE A.I.l2 (continued)
Ziemniak and JCPDS JCPDS Product Opalka (1988) Database Database
RGH66A Na2Ni(OH)P04 Ni(OH)2 N~Ni(P04)2
dobs I/I10o dobs III10o dobs l/l10o dobs IIIIOo
2.302 2 2.293 6 2.2693 7.9 2.270 5 2.226 6 2.1843 5.1 2.180 6 2.201 12 2.1545 6.8 2.150 8 2.1001 9.8 2.100 7 2.117 8 2.0468 5.4 2.050 9 2.042 4
1.974 5 1.962 5 1.925 4 1.909 6
1.875 7 1.8678 14.8 1.865 5
1.830 19 1.831 15 1.7966 17.4 1.790 12
1.782 8 1.774 3 1.754 35
1.654 5 1.6658 4 1.6353 5
1.601 3 1.557 3 1.563 25
1.535 1 1.5048 14.2 1.508 11 1.4764 16.5 1.472 12 1.480 16 1.4955 12
1.354 4 1.335 8 1.299 10 1.293 2 1.167 8
158

TABLE A.I.13: X-Ray Diffraction Results for Na2Ni(OH)P04 from H+[NiNTA-) Decomposition
Ziemniak and JCPDS JCPDS JCPDS Product Opalka(1988) Database Database Database
RGH73A NazNi(OH)P04 N~Ni(P04)2 Na3P04 NazHP04
dabs 1/IJOo dobs 1/IJOo dobs 1/IJOo dobs 1/IJOo dobs 1/IJOo
10.9590 8.1 10.780 29
8.120 17 7.7002 8.1 7.5840 18.3
7.510 53 6.500 8
6.2272 16.2 6.2028 9.2
6.160 27 5.900 5 5.780 8 5.090 3
4.900 10 4.770 16 4.458 5
4.3078 13.9 4.280 70 4.2290 48.9 4.200 52 4.235 70 4.0243 8.8
3.980 45 3.924 25 3.873 8
3.840 55 3.710 20
3.550 12 3.4243 10.5 3.400 13 3.420 20
3.381 6 3.2546 20.8 3.250 6
3.210 20 3.151 5 3.108 6
2.940 9 2.932 5 2.880 40
2.829 18 2.805 100
159

TABLE A.I.l3 (continued)
Ziernniak and JCPDS JCPDS JCPDS Product Opalka (1988) Database Database Database
RGH73A Na2Ni(OH)P04 N~Ni(P04)2 Na3P04 Na2HP04
dobs III10o dabs Ill10o dabs 1/IJOo dabs I/110o dobs 1/IJOo
2.771 4 2.730 50
2.701 25 2.720 25 2.6635 17.2 2.655 20 2.6360 9.9 2.6227 20.0 2.621 100 2.6006 100.0 2.590 100 2.592 100 2.5467 32.2 2.520 32 2.540 8 2.537 8
2.511 4 2.453 5 2.453 18 2.401 14
2.370 4 2.293 6 2.309 8
2.270 5 2.226 6
2.180 6 2.201 12 2.197 10 2.150 8 2.140 20 2.100 7 2.117 8
2.0417 23.3 2.050 9 2.042 4 2.047 8 1.994 16
1.974 5 1.962 5 1.925 4 1.921 18 1.909 6
1.8777 8.4 1.875 7 1.865 5 1.853 20 1.830 19 1.831 15 1.812 8
1.7985 9.3 1.790 12 1.782 8 1.774 3
1.751 18 1.712 16
1.654 5 1.6658 4 1.6353 5
1.601 3 1.595 14 1.557 3
1.5101 8.4 1.513 30
160

TABLE A.I.13 (continued)
Ziemniak and JCPDS JCPDS JCPDS Product Opalka (1988) Database Database Database
RGH73A NazNi(OH)P04 N~Ni(P04)2 Na3P04 NazHP04
dobs 1/lJOo dobs I/I10o dobs I/I10o dabs l/l10o dobs III1oo
1.5088 9.0 1.508 11 1.4955 12 1.4763 10.9 1.472 12
1.426 40
161

APPENDIX II: X-ray Crystal Structure of (NH4)Feli(P04)-H20
162

X-ray Structure Report
For Dr. P. Tremaine
Prepared by David 0. Miller
May 31,2001
Introduction
Collection, solution and refinement all proceeded normally. Hydrogen atoms were introduced in calculated or difference map positions with isotropic thermal parameters set twenty percent greater than those of their bonding partners at the time of their inclusion. Some were optimized by positional refinement but all were fixed for the final round of refinement.
163

Experimental
Data Collection
A colorless irreg.plate crystal of H705FePN having approximate dimensions of 0.40 x 0.35 x 0.15 mm was mounted on a glass fiber. All measurements were made on a Rigaku AFC6S diffractometer with graphite monochromated Mo-Ka radiation.
Cell constants and an orientation matrix for data collection, obtained from a leastsquares refinement using the setting angles of 23 carefully centered reflections in the
range 47.53 < 20 < 49.340 corresponded to a primitive orthorhombic cell with dimensions:
a= 17.597(2) A b = 5.667(2) A c = 4.833(2) A v = 481.9(2) A3
For Z = 4 and F.W. = 187.88, the calculated density is 2.59 g/cm3. Based on the systematic absences of:
Okl: k+l ± 2n hkO: h± 2n
packing considerations, a statistical analysis of intensity distribution, and the successful solution and refinement of the structure, the space group was determined to be:
Pnrna (#62)
The data were collected at a temperature of 26 :±: 1 oc using the ro-20 scan
technique to a maximum 28 value of 55.1°. Omega scans of several intense reflections, made prior to data collection, had an average width at half-height of 0.430 with a take-off
angle of 6.oo. Scans of(1.84 + 0.35 tan 8)0 were made at a speed of 4.0°/min (in ro). The weak reflections (I < lO.Ocr(I)) were rescanned (maximum of 8 scans) and the counts were accumulated to ensure good counting statistics. Stationary background counts were recorded on each side of the reflection. The ratio of peak counting time to background counting time was 2:1. The diameter of the incident beam collimator was 1.0 mm, the crystal to detector distance was 400 mm, and the detector aperture was 6.0 x 6.0 mm (horizontal x vertical).
164

Data Reduction
A total of 707 reflections was collected. The intensities of three representative reflections were measured after every 150 reflections. No decay correction was applied.
The linear absorption coefficient, ).!, for Mo-Ka radiation is 33.9 cm-1. An empirical absorption correction based on azimuthal scans of several reflections was applied which resulted in transmission factors ranging from 0.68 to 1.00. The data were corrected for Lorentz and polarization effects. A correction for secondary extinction was applied (coefficient= 2.54394e-006).
Structure Solution and Refinement
The structure was solved by direct methodsl and expanded using Fourier
techniques2. The non-hydrogen atoms were refmed anisotropically. Hydrogen atoms
were included but not refined. The final cycle of full-matrix least-squares refinement3 on F was based on 587 observed reflections (I > 2.00cr(I)) and 47 variable parameters and converged (largest parameter shift was 0.00 times its esd) with unweighted and weighted agreement factors of:
R = L: IIFoi- IFcll I L: IFol = 0.061
Rw = [ L: w (IFoi-IFcl)2 I 2: w Fo2]112 = 0.078
The standard deviation of an observation ofunit weight4 was 7.57. The weighting scheme was based on counting statistics and included a factor (p = 0.010) to downweight
the intense reflections. Plots of I: w (IFoi-IFcl)2 versus IFol, reflection order in data collection, sin 81').., and various classes of indices showed no unusual trends. The maximum and minimum peaks on the final difference Fourier map corresponded to 2.27
and -1.01 e-IA3, respectively.
Neutral atom scattering factors were taken from Cromer and Waber5.The values
for the mass attenuation coefficients are those of Creagh and Hubbell6. All calculations were performed using the teXsan 7 crystallographic software package of Molecular Structure Corporation.
165

References
(1) SIR92: Altomare, A., Cascarano, M., Giacovazzo, C., Guagliardi, A. (1994). J. Appl. Cryst., 26, 343.
(2) DIRDIF94: Beurskens, P.T., Admiraal, G., Beurskens, G., Bosman, W.P., de Gelder, R., Israel, R. and Smits, J.M.M.(1994). The DIRDIF-94 program system, Technical Report of the Crystallography Laboratory, University ofNijmegen, The Netherlands.
(3) Least Squares function minimized:
Lw(IFoi-IFcl)2 where
w = 1/[cr2(Fo)] = [cr2c(Fo) + p2Fo2/4]-1
crc(Fo) = e.s.d. based on counting statistics
p = p-factor
(4) Standard deviation of an observation of unit weight:
[Lw(IF oi-IF cl)2f(N0 -Nv )] 1/2
where: N0 =number of observations Nv =number of variables
(5) Cromer, D. T. & Waber, J. T.; "International Tables for X-ray Crystallography", Vol. IV, The Kynoch Press, Birmingham, England, Table 2.2 A (1974).
(6) Creagh, D. C. & Hubbell, J.H .. ; "International Tables for Crystallography", Vol C, (A.J.C. Wilson, ed.), Kluwer Academic Publishers, Boston, Table 4.2.4.3, pages 200-206 (1992).
(7) teXsan for Windows version 1.06: Crystal Structure Analysis Package, Molecular Structure Corporation (1997-9).
166

EXPERIMENTAL DETAILS
Empirical Formula
Formula Weight
Crystal Color, Habit
Crystal Dimensions
Crystal System
Lattice Type
No. of Reflections Used for Unit
Cell Determination (28 range)
Omega Scan Peak Width
at Half-height
Lattice Parameters
Space Group
Z value
Deale
Fooo
~(MoKa)
A. Crystal Data
167
187.88
colorless, irreg.plate
0.40 X 0.35 X 0.15 mm
orthorhombic
Primitive
23 ( 47.5 - 49.30)
0.430
a= 17.597(2) A b = 5.667(2) A c = 4.833(2) A v = 481.9(2) A3
Pnma (#62)
4
2.589 g/cm3
380.00
33.88 cm-1

Diffractometer
Radiation
Take-off Angle
Detector Aperture
Crystal to Detector Distance
Voltage, Current
Temperature
Scan Type
Scan Rate
Scan Width
28m ax
No. ofReflections Measured
Corrections
B. Intensity Measurements
168
Rigaku AFC6S
MoKa (A.= 0.71069 A) graphite monochromated
6.0°
6.0 mm horizontal 6.0 mm vertical
400mm
50kV, 27.5mA
26.0°C
ro-28
4.00/min (in ro) (up to 8 scans)
(1.84 + 0.35 tan 8)0
55.10
Total: 707
Lorentz-polarization Absorption (trans. factors: 0.6751 - 1.0000) Secondary Extinction (coefficient: 2.54394e-006)

C. Structure Solution and Refinement
Structure Solution
Refinement
Function Minimized
Least Squares Weights
p-factor
No. Observations (1>2.00cr(l))
No. Variables
Reflection/Parameter Ratio
Residuals: R; Rw
Goodness of Fit Indicator
Max Shift/Error in Final Cycle
Maximum peak in Final Diff. Map
Minimum peak in Final Diff. Map
169
Direct Methods (SIR92)
Full-matrix least-squares on F
2: w (IFol - 1Fcl)2
1/cr2(Fo) = 4Fo2Jcr2(Fo2)
0.0100
587
47
12.49
0.061 ; 0.078
7.57
0.00
2.27 e-;A3
-1.01 e-;A3

170

171

APPENDIX III: Kinetic and Solubility Data for Na2Ni(OH)P04 Formation Equilibria with Nickel Oxide
172

TABLE A.III.1: Summary of ICP ES Results for Standard Solutions
run name stock sol'n m(P)total % dev m(Na+) % dev mol·kg-1 mol·kg-1
Prec. 1 Standard 1 1.5028 0.19 3.8848 3.59 1.4941 0.39 3.8839 3.57
Standard 2 0.9448 5.52 2.8596 14.4 0.9370 6.30 2.7865 11.5
Standard 3 0.7070 1.00 2.3034 17.5 0.6910 1.29 2.2103 12.8
Prec. 2 Standard 1 1.4642 2.39 3.8585 2.89 1.4639 2.40 3.8451 2.54
Standard 2 1.0094 0.94 2.7187 8.75 1.0137 1.37 2.6184 4.73
Standard 3 0.7017 0.24 2.0057 2.33 0.7076 1.09 2.0946 6.87
Standard 4 0.5042 0.83 1.3497 7.98 0.4976 0.48 1.3031 4.25
Rediss. 1 Standard 1 1.5035 0.24 3.9589 5.57 1.5145 0.96 3.9929 6.48
Standard 2 1.0222 2.22 2.6856 7.42 1.0171 1.71 2.6663 6.65
Standard 3 0.6994 0.09 2.0222 3.18 0.6930 1.01 2.0135 2.73
Standard 4 0.5043 0.85 1.3340 7.17 0.5072 1.44 1.3889 11.1
Rediss. 2 Standard 1 1.5171 1.14 3.9880 6.35 1.5026 0.18 3.8987 3.97
Standard 2 1.0116 1.16 2.6468 5.87 1.0238 2.38 2.6825 7.30
Standard 3 0.6945 0.79 1.9651 0.26 0.7067 0.95 2.0203 3.08
Solubility 1 Standard 1 1.5592 3.95 3.9237 4.63 1.5606 4.04 3.8955 3.88
Standard 3 0.7251 3.58 2.0303 3.59 0.7260 3.70 2.0023 2.16
Standard 4 0.5256 5.12 1.3340 6.72 0.5210 4.21 1.3109 4.87
173

TABLE A.III.l (continued)
run name stock sol'n m(P)total %dev m(Na) %dev mol·kg-1 mol·kg-1
Solubility 2 Standard 2 1.0256 2.56 2.5678 2.71 1.0346 3.46 2.6724 6.90
Standard 3 0.7268 3.83 2.1043 7.36 0.7146 2.09 1.9930 1.68
Standard4 0.5176 3.52 1.3402 7.21 0.5173 3.46 1.3203 5.63
174

TABLE A.III.2: Kinetic Data
Time m(Na) m(P)total m(HP04 ") hr mol·kg-1 mol·kg-1 mol·kg-1
Precipitation at 250 °C
0.8 2.520 0.9389 0.5054
0.8 2.414 0.9163 0.5216
0.82 2.154 0.8282 0.4998
0.82 2.160 0.8363 0.5117
5.78 2.060 0.7700 0.4440
5.78 2.060 0.7653 0.4361
5.85 1.987 0.7383 0.4256
5.85 2.049 0.7443 0.4055
18.68 1.821 0.6405 0.3443
18.68 1.829 0.6421 0.3433
18.73 1.713 0.5889 0.3125
18.73 1.742 0.5956 0.3111
22.28 1.633 0.5528 0.2930
22.28 1.680 0.5610 0.2873
22.33 1.630 0.5467 0.2863
22.33 1.652 0.5540 0.2881
2.61 1.606 0.5368 0.2814
175

TABLE A.III.2 (continued)
Time m(Na+) m(P)total m(HP04 -)
hr mol·kg-1 mol·kg-1 mol·kg-1
Precipitation at 250 °C
26.1 1.552 0.5360 0.3002
26.12 1.669 0.5481 0.2743
26.12 1.645 0.5360 0.2671
42.8 1.502 0.4818 0.2469
42.8 1.513 0.4817 0.2436
42.83 1.449 0.4744 0.2551
42.83 1.440 0.4719 0.2545
46.75 1.435 0.4681 0.2515
46.75 1.448 0.4729 0.2533
46.78 1.450 0.4741 0.2543
46.78 1.412 0.4697 0.2613
50.17 1.419 0.4674 0.2559
50.17 1.376 0.4555 0.2550
50.22 1.438 0.4647 0.2465
50.22 1.441 0.4682 0.2499
67.15 1.407 0.4655 0.2573
67.15 1.416 0.4687 0.2584
176
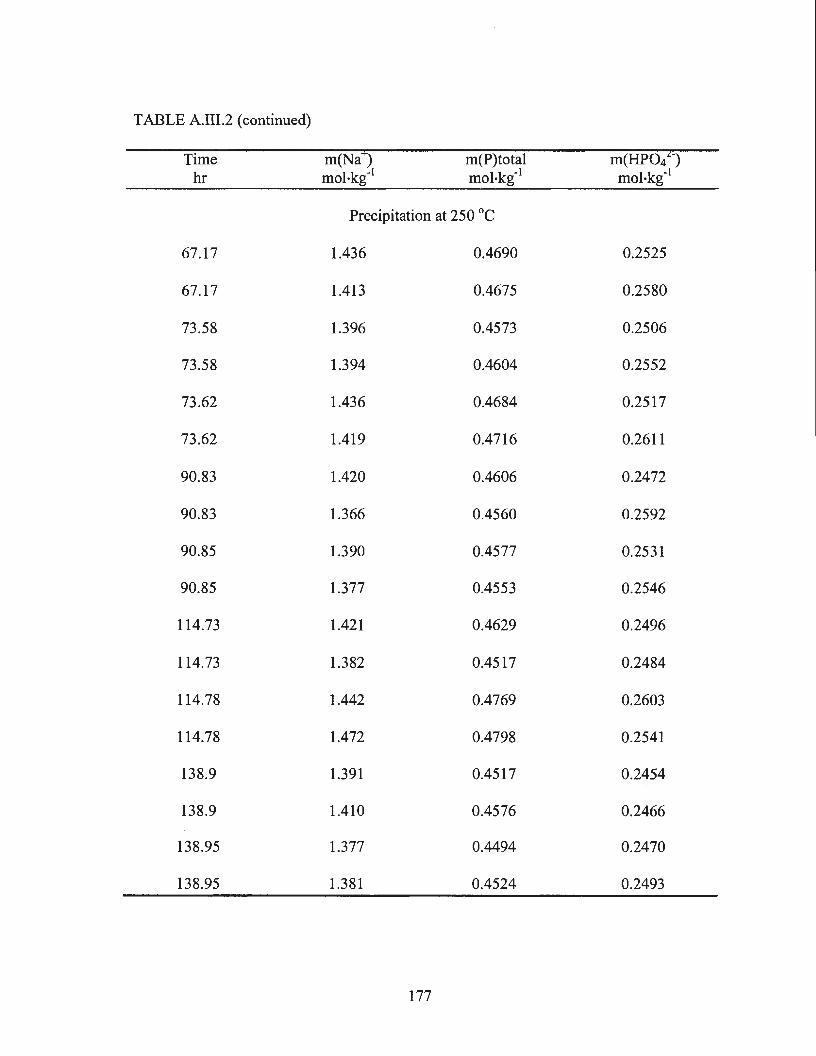
TABLE A.III.2 (continued)
Time m(Na) m(P)total m(HP04 -) hr mol·kg-1 mol·kg-1 mol·kg-1
Precipitation at 250 °C
67.17 1.436 0.4690 0.2525
67.17 1.413 0.4675 0.2580
73.58 1.396 0.4573 0.2506
73.58 1.394 0.4604 0.2552
73.62 1.436 0.4684 0.2517
73.62 1.419 0.4716 0.2611
90.83 1.420 0.4606 0.2472
90.83 1.366 0.4560 0.2592
90.85 1.390 0.4577 0.2531
90.85 1.377 0.4553 0.2546
114.73 1.421 0.4629 0.2496
114.73 1.382 0.4517 0.2484
114.78 1.442 0.4769 0.2603
114.78 1.472 0.4798 0.2541
138.9 1.391 0.4517 0.2454
138.9 1.410 0.4576 0.2466
138.95 1.377 0.4494 0.2470
138.95 1.381 0.4524 0.2493
177

TABLE A.III.2 (continued)
Time m(Na) m(P)tota1 m(HP04 -)
hr mol·kg-1 mol·kg-1 mol·kg-1
Precipitation at 250 °C
162.82 1.332 0.4397 0.2493
162.82 1.322 0.4434 0.2575
162.87 1.319 0.4418 0.2561
162.87 1.311 0.4398 0.2565
186.95 1.278 0.4157 0.2367
186.95 1.288 0.4152 0.2331
186.98 1.205 0.3993 0.291
186.98 1.235 0.3907 0.2198
Redissolution at 275-250 °C
3.37 0.8653 0.2717 0.1823
3.37 0.8562 0.2707 0.1834
3.37 0.9444 0.3130 0.2100
3.37 0.9401 0.3153 0.2140
5.08 1.085 0.3667 0.2354
5.08 1.039 0.3628 0.2450
5.08 1.062 0.3731 0.251 3
5.08 1.092 0.3689 0.2358
8.92 1.189 0.3759 0.2157
178

TABLE A.III.2 (continued)
Time m(Na) m(P)total m(HP04 -) hr mol·kg-1 mol·kg-1 mol·kg-1
Redissolution at 275-250 °C
8.92 1.099 0.3713 0.2369
8.92 1.091 0.3781 0.2483
8.92 1.107 0.3796 0.2451
12.77 1.173 0.3903 0.2376
12.77 1.147 0.3826 0.2361
12.77 1.145 0.3818 0.2358
12.77 1.151 0.3853 0.2384
23.19 1.212 0.3991 0.2369
23.19 1.206 0.3999 0.2396
23.19 1.219 0.3921 0.2261
23.19 1.207 0.3987 0.2377
28.75 1.224 0.4000 0.2341
28.75 1.204 0.3948 0.2337
28.75 1.180 0.3891 0.2341
28.75 1.152 0.3863 0.2395
47.78 1.209 0.3924 0.2293
47.78 1.178 0.3885 0.2339
47.78 1.169 0.3896 0.2383
179

TABLE A.III.2 (continued)
Time m(Na+) m(P)total m(HP042)
hr mol·kg-1 mol·kg-1 mol·kg-1
Redissolution at 275-250 °C
47.78 1.126 0.3776 0.1976
58.27 1.241 0.4000 0.2289
58.27 1.189 0.3932 0.2366
58.27 1.234 0.3967 0.2271
58.27 1.196 0.3886 0.2287
76.82 1.196 0.3921 0.2331
76.82 1.178 0.3925 0.2391
76.82 1.176 0.3871 0.2330
76.82 1.150 0.3827 0.2353
120.57 1.220 0.3978 0.2327
120.57 1.215 0.3944 0.2299
120.57 1.188 0.3803 0.2212
120.57 1.173 0.3755 0.2198
143.92 1.199 0.3837 0.2220
143.92 1.188 0.3847 0.2264
143.92 1.151 0.3708 0.2206
143.92 1.146 0.3703 0.2214
168.57 1.157 0.3697 0.2176
180
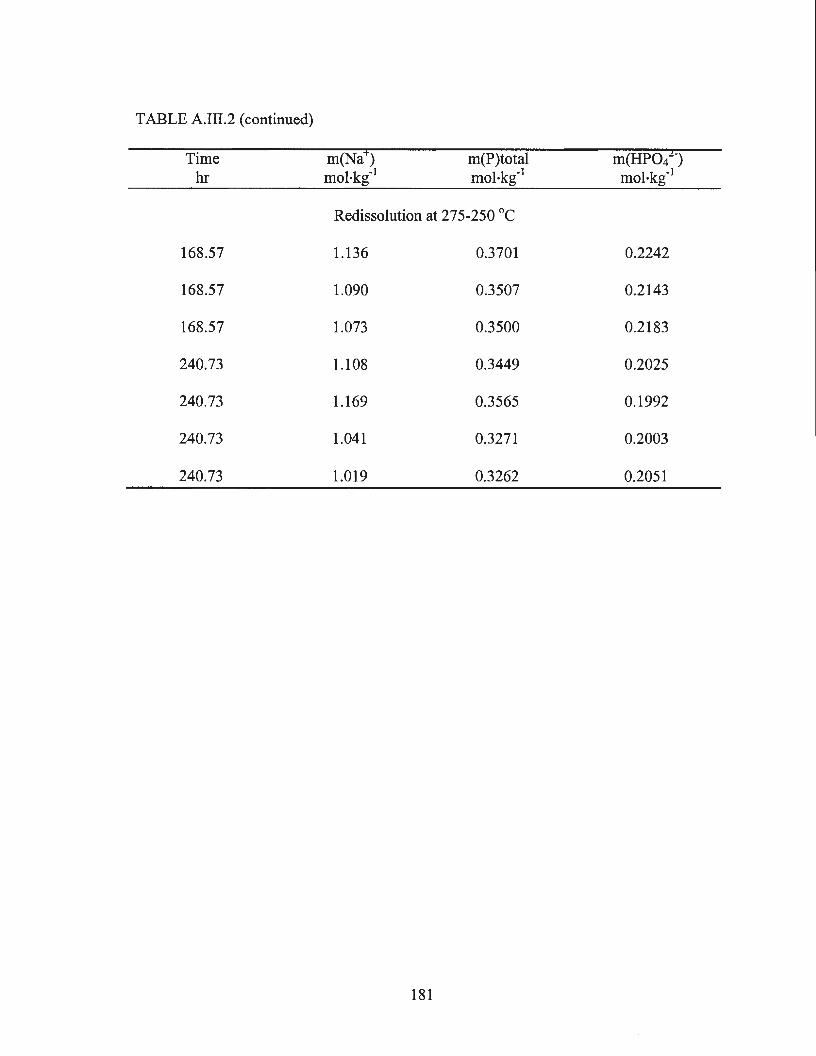
TABLE A.III.2 (continued)
Time m(Na) m(P)total m(HP04 -) hr mol·kg-1 mol·kg-1 mol·kg-1
Redissolution at 275-250 °C
168.57 1.136 0.3701 0.2242
168.57 1.090 0.3507 0.2143
168.57 1.073 0.3500 0.2183
240.73 1.108 0.3449 0.2025
240.73 1.169 0.3565 0.1992
240.73 1.041 0.3271 0.2003
240.73 1.019 0.3262 0.2051
181

TABLE A.III.3: Experimental Data for the Reaction
NiO(s) + 2 Na\aq) + HPO/"(aq) ~ Na2Ni(OH)P04(s)
t m(P04hotal m(HP04 -) m(Na) Equil. Average Average Average oc mol·kg-1 mol·kg-1 mol·kg-1 time lnQ InK K
(hrs)
Na/P = 2.5, run 1
240 1.183 0.6609 3.111
240 1.163 0.7148 2.949 50 -1.8436 4.6995 1.099·102
240 1.165 0.7537 2.892
255 0.6199 0.3801 1.648
255 0.6226 0.3907 1.643 53 -0.0286 6.8289 9.242·102
255 0.6104 0.3964 1.589
265 0.4033 0.2310 1.207
265 0.3977 0.2435 1.151 75 1.2889 8.0048 2.995·103
265 0.3449 0.2241 1.004
265 0.3470 0.2300 0.9951
272 0.2684 0.1783 0.8288
272 0.2696 0.1771 0.8381 62 2.1755 8.7277 6.172·103
272 0.2501 0.1699 0.7815
272 0.2509 0.1702 0.7841
280 0.2010 0.1383 0.6729 95 2.8026 9.3196 1.116·104
280 0.1974 0.1403 0.6468
182

TABLE A.III.3 (continued)
m(HPO/") m(Na+) t m(P04hotal Equil. Average Average Average oc moi·kg-1 moi·kg-1 moi·kg-1 time In Q InK K
(hrs)
Na/P = 2.5, run 2
235 1.5019 0.9095 3.807
235 1.4836 0.9552 3.669 60 -2.5841 3.6788 3.960·101
235 1.5238 0.9020 3.896
245 1.0667 0.7034 2.629 69 -1.5748 5.1918 1.798·102
245 1.0602 0.7183 2.584
252 0.8175 0.5154 2.086
252 0.8289 0.5326 2.094 52 0.83341 6.1264 4.578·102
252 0.8282 0.5268 2.102
260 0.5337 0.3537 1.395
260 0.5357 0.3589 1.391 68 0.3307 7.2840 1.457·103
260 0.5478 0.3658 1.420
260 0.5523 0.3779 1.412
268 0.2659 0.200 0.6815 53 2.2674 8.7273 6.169·103
268 0.2661 0.2153 0.6982
183
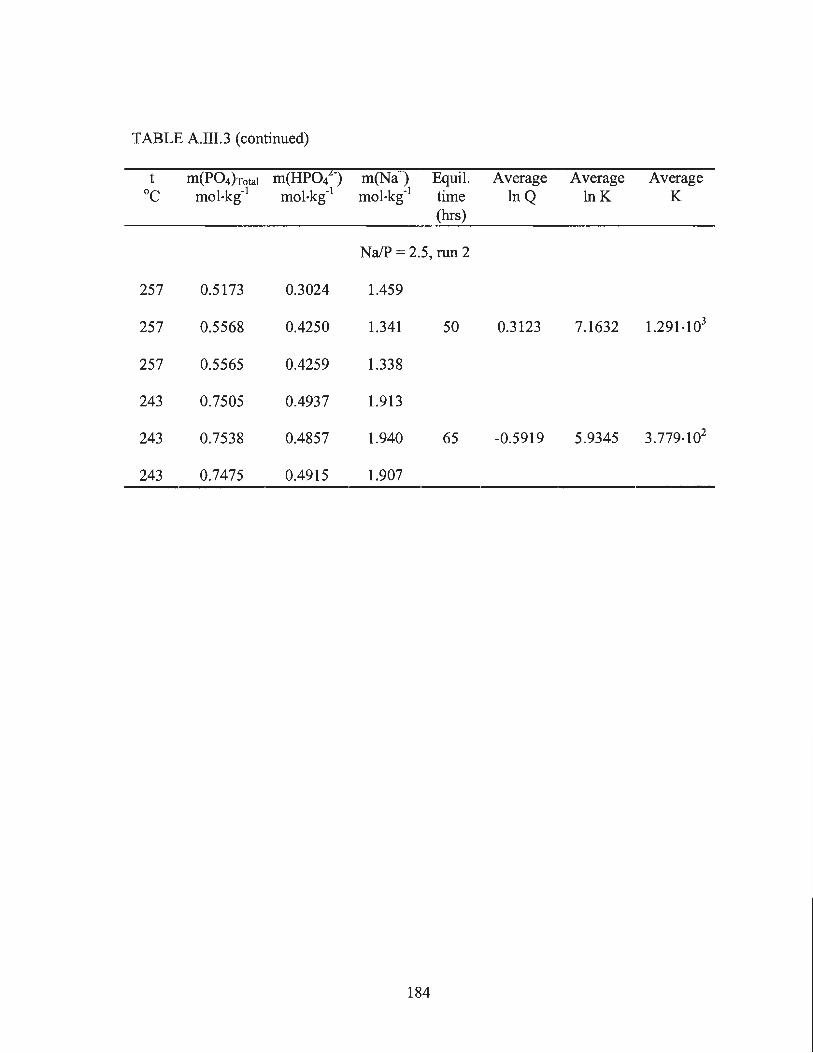
TABLE A.III.3 (continued)
m(HP042
) m(Na+) t m(P04hotal Equil. Average Average Average oc mol·kg-1 mol·kg-1 mol·kg-1 time lnQ InK K
(hrs)
Na/P = 2.5, run 2
257 0.5173 0.3024 1.459
257 0.5568 0.4250 1.341 50 0.3123 7.1632 1.291·103
257 0.5565 0.4259 1.338
243 0.7505 0.4937 1.913
243 0.7538 0.4857 1.940 65 -0.5919 5.9345 3.779·102
243 0.7475 0.4915 1.907
184


