abstract - nyu stern school of...
TRANSCRIPT

VERY LONG-RUN DISCOUNT RATES∗
STEFANO GIGLIO
MATTEO MAGGIORI
JOHANNES STROEBEL
Abstract
We estimate how households trade off immediate costs and uncertain future benefits that occur
in the very long run, 100 or more years away. We exploit a unique feature of housing markets in the
U.K. and Singapore, where residential property ownership takes the form of either leaseholds or
freeholds. Leaseholds are temporary, pre-paid, and tradable ownership contracts with maturities
between 99 and 999 years, while freeholds are perpetual ownership contracts. The price difference
between leaseholds and freeholds reflects the present value of perpetual rental income starting at
leasehold expiry, and is thus informative about very long-run discount rates. We estimate the
price discounts for varying leasehold maturities compared to freeholds and extremely long-run
leaseholds via hedonic regressions using proprietary datasets of the universe of transactions in
each country. Households discount very long-run cash flows at low rates, assigning high present
value to cash flows hundreds of years in the future. For example, 100-year leaseholds are valued
at more than 10% less than otherwise identical freeholds, implying discount rates below 2.6% for
100-year claims.
JEL Codes: G11, G12, R30.
∗We thank Sumit Agarwal, Robert Barro, Arthur van Benthem, Jules van Binsbergen, Andrea Caggese, John Campbell,Jaime Casassus, Raj Chetty, John Cochrane, Xavier Gabaix, Bob Goldstein, Christian Gollier, Bob Hall, Barney Hartman-Glaeser, Mervyn King, Anil Kashyap, Amir Kermani, Ralph Koijen, Martin Lettau, Lars Lochstoer, Hanno Lustig, TimMcQuade, Stijn van Nieuwerburgh, William Nordhaus, Monika Piazzesi, Tomasz Piskorski, Tarun Ramadorai, EstebanRossi-Hansberg, Florian Schulz, Amit Seru, Andrei Shleifer, Martin Weitzman as well as seminar participants at the NBER(Public Economics, Asset Pricing, Financing Housing Capital, Real Estate), Harvard (HBS and Department), Princeton (JRCConference), Chicago Booth, NYU Stern, Columbia GSB, Wharton, MIT Sloan, Federal Reserve Board, Adam Smith Confer-ence (LBS/LSE/Oxford), UBC Winter Finance Conference, ASU Sonoran Winter Finance Conference, HULM Conference,Universitaet Regensburg, Fordham University, and Notre Dame for helpful discussions and comments. We gratefully ac-knowledge the generous research support from the NYU Stern Center for the Global Economy and Business as well as fromthe Fama-Miller Center and the Initiative on Global Markets at the University of Chicago Booth School of Business. Wethank iProperty and Rightmove for sharing part of their data. We thank Miguel de Faria e Castro for excellent research as-sistance. Corresponding Author: Johannes Stroebel, 44 West 4th Street, New York City, NY 10012; Telephone: 650-888-3441;Email: [email protected]. This version: October 2014. First version: October 2013.
I INTRODUCTION
Long-run discount rates play a central role in economics and public policy. For example, much of
the debate around the optimal response to climate change centers on the trade-off between the im-
mediate costs and the very long-term benefits of policies that aim to reduce global warming. Similar
cost-benefit analyses are required of all U.S. government agencies prior to proposing and adopting
regulation. Unfortunately, there is little direct empirical evidence on how households discount pay-
ments over very long horizons, because of the scarcity of finite, long-maturity assets necessary to
estimate households’ valuation of very long-run claims. For regulatory action with “intergenera-
tional benefits or costs,” the U.S. Office of Management and Budget therefore recommends a wide
range of discount rates (1% - 7%), lamenting that while “private markets provide a reliable reference
for determining how society values time within a generation, for extremely long time periods no
comparable private rates exist.”
We provide direct estimates of households’ discount rates for payments very far in the future. We
exploit a unique feature of residential housing markets in the U.K. and Singapore, where property
ownership takes the form of either very long-term leaseholds or freeholds. Leaseholds are tempo-
rary, pre-paid and tradable ownership contracts with maturities ranging from 99 to 999 years, while
freeholds are perpetual ownership contracts. The price difference between leaseholds and freeholds
for otherwise identical properties captures the present value of perpetual rental income starting at
leasehold expiry, and is thus informative about households’ discount rates over that horizon.
Our empirical analysis is based on proprietary information on the universe of residential prop-
erty sales in the U.K. (2004-2013) and Singapore (1995-2013). These data contain information on
transaction prices, leasehold terms, and property characteristics such as location and structural at-
tributes. We estimate long-run discount rates by comparing the prices of leaseholds with different
maturities to each other and to the price of freeholds across otherwise identical properties. We use
hedonic regression techniques to control for possible heterogeneity between leasehold and freehold
properties. This allows us to identify price discounts associated with differences in lease length. We
find that 100-year leaseholds are valued 10%-15% less than otherwise identical freeholds; leaseholds
with maturities of 125 to 150 years are valued 5%-8% less than freeholds. There are no price differ-
ences between leaseholds with maturities of more than 700 years and freeholds. Our results show
that households apply annual discount rates of below 2.6% to housing cash flows more than 100 years
1

in the future.
While these housing markets provide a unique and important setting for understanding very
long-run discount rates, they are not frictionless markets. We therefore address a number of possible
concerns that the observed price differences between leaseholds of different maturity and freeholds
might not only be driven by the different maturity of the claims, but also by other differences between
the two contracts or frictions specific to housing markets. We first show that the empirical results are
consistent across the U.K. and Singapore, two housing markets with otherwise very different institu-
tional settings. In addition, we provide direct evidence that the leasehold discounts are not related
to either systematic unobserved structural heterogeneity across different properties, differences in
the liquidity of the properties or a different clientele for the different ownership structures, and are
unlikely to be explained by contractual restrictions in leasehold contracts.
We first address the concern that our estimated price discounts are driven by systematic differ-
ences in unobserved property characteristics. To do this, we analyze how annual rents differ across
freehold and leasehold properties with different maturities. Conditional on observable property char-
acteristics, rental prices of leasehold properties with different maturities and freeholds are essentially
identical. This suggests that the observed transaction price differences are not related to differences in
the flow utility from these properties, but rather to the maturity of the contracts. Consistent with this,
the absence of a price difference between leaseholds with 700 or more years remaining and freeholds
provides further confidence that our hedonic control variables allow us to partial out all important
sources of structural heterogeneity between leasehold and freehold properties.
We next consider whether covenants in leasehold contracts might explain the estimated price
discounts. Since leaseholds with more than 700 years maturity trade at the same price as freeholds,
the price discounts between shorter leaseholds and freeholds are unlikely to be explained by funda-
mental differences in the general contract structure (e.g., a significant control premium or a maturity-
independent preference of households for freehold ownership), since these should show up along
the entire term structure, including the very long leases. This is consistent with a robustness check
that estimates discounts only within leaseholds of different maturity, and finds them to be similarly
large. We also show that our estimated price discounts persist even after controlling for the initial
lease length of contracts, addressing concerns that restrictive covenants might be more prevalent for
shorter maturity leaseholds. The absence of such a correlation is confirmed by a direct analysis of
2
the covenants in a subset of leasehold contracts. Finally, since most important restrictive covenants
on short-maturity leaseholds would have to be passed on to possible renters of the property, the ab-
sence of differential rental prices for leaseholds of different maturity further confirms the absence of
important restrictive covenants that differ by lease length.
We next address concerns that differences in the behavior of residual freeholders, who hold the
rights to the property after the expiry of the lease, might affect a leaseholder’s incentives and ability
to extend an existing leasehold. This could generate an endogenous correlation between remaining
lease length and freeholder characteristics and behavior, since leaseholds with less attractive free-
holders may be extended less frequently and could therefore sell both for less and with fewer years
remaining on the lease. To consider whether this can explain our estimates we further homogenize
our estimation sample by only exploiting differences in the remaining lease length of flats in the same
building, all of which have the same freeholder. Our estimates are unchanged in that sample, sug-
gesting that the price differences across leaseholds of differential remaining maturity are not related
to systematic differences in freeholder characteristics. These estimates also further address some of
the other concerns already discussed. First, flats in the same building are even less likely to differ sys-
tematically on unobservable property characteristics. Second, covenants, contracts for maintenance
and servicing, and restrictions on property redevelopment generally do not vary within a building.
Therefore, our estimates from this sample are robust to concerns that the price differences between
leaseholds of different maturity are driven by correlation of remaining lease length with any of these
factors.
We also document that price differences are not driven by differential liquidity of leasehold con-
tracts with different maturities and freehold contracts, by showing that the time on market does not
vary systematically across the term structure of remaining lease length. We then consider whether the
presence of a different clientele for leasehold and freehold properties can explain the price differences,
but find evidence that buyers of these contracts are essentially identical on observable characteristics.
Our estimates also cannot be explained by potential financing frictions that might be important for
short-maturity leasehold properties (50-70 years), since leasehold discounts remain substantial even
for maturities of 200 years, for which the effects of potential financing frictions are too far away to
matter quantitatively.
Overall, our findings show that a sizable fraction of the value of residential properties comes
3

from cash flows that occur hundreds of years away. To interpret the economic magnitude of the
observed leasehold discounts and implied discount rates, we consider the predictions from a simple
valuation model with constant discount rates across maturities. In the simplest constant-discount-
rate model, rental income Dt grows at rate g and is discounted at a constant rate r. The prices for the
freehold Pt, and the T-maturity leasehold PTt are given by:
Pt =Dt
r− g; PT
t =Dt
r− g(1− e−(r−g)T).
The first formula is the Gordon (1982) growth valuation for infinitely-lived assets, the second formula
corrects the freehold price for the shorter maturity of the leasehold to obtain the leasehold price. Both
formulae are derived from first principles in Section V. In this valuation model, the price discount
between leaseholds and freeholds is:
DiscTt ≡
PTt
Pt− 1 = −e−(r−g)T.
To match the observed discounts, this formula requires the net discount rate for housing cash flows,
r− g, to be approximately 1.9%. Together with an estimate of long-run real rent growth of g = 0.7%,
this shows that households use low discount rates (r = 2.6%) for very distant housing cash flows.
Combining this with a separate estimate of the real long-run risk-free discount rate of 1% obtained
from the real U.K. yield curve, we find that housing cash flows have a relatively low long-run risk
premium of 1.6%.
Our estimates of very long-run discount rates are of direct interest to a large theoretical literature
that has lamented the absence of estimates for these very long maturities, not only for real estate, but
for any asset. This literature has often been motivated by the importance of long-run discount rates
in particular applications: the analysis of climate change (Arrow et al., 1996; Weitzman, 2001; Nord-
haus, 2007; Stern, 2007; Gollier, 2012; Barro, 2013; Pindyck, 2013; Weitzman, 2013; Farmer et al., 2014),
the study of the term structure and long-run properties of risky assets (Alvarez and Jermann, 2005;
Binsbergen, Brandt and Koijen, 2012; Binsbergen et al., 2013), and macroeconomics and fiscal pol-
icy (Auerbach, Gokhale and Kotlikoff, 1994; Hall, 2014). In the conclusions, we discuss the possible
implications of our finding of low long-run discount rates for these fields.
4

II HOUSING MARKETS IN THE UNITED KINGDOM AND SINGAPORE
In this section we discuss the relevant institutional details of housing markets in the U.K. and in
Singapore, highlighting the distinguishing characteristics of freeholds and leaseholds.1 Appendix
A.1 and A.2 provide detailed additional information.
II.A Leaseholds and Freeholds in the U.K.
Property contracts in England and Wales come in two forms: permanent ownership, called a free-
hold, and long-maturity, temporary ownership, called a leasehold. A leasehold is a grant of exclu-
sive possession for a clearly defined, temporary period of time (Burn, Cartwright and Cheshire, 2011).
Common initial leasehold maturities are 99, 125, 150, 250 or 999 years. During this period, owner-
ship of the leasehold entitles the lessee to similar rights as the ownership of the freehold, including
the right to mortgage and rent out the property. Unlike for commercial leases, the vast majority of
the costs associated with a residential leasehold come through the up-front purchase price; annual
payments, the so-called “ground rents,” are small to non-existent and do not significantly affect the
prices paid for leaseholds. Leasehold properties are traded in liquid secondary markets, where the
buyer purchases the remaining term of the lease.
Once the leasehold expires, the ownership reverts back to the freeholder. However, it is common
for leaseholders to purchase lease extensions ahead of lease expiry. Over time, a number of laws
have regulated the rights of leaseholders in the U.K. to extend their lease terms, and have codified
the bargaining process between leaseholders and freeholders. For our sample period, the law states
that leaseholders had the right to request a lease extension from the freeholder in exchange for paying
a premium. The valuation on which the premium is based does not include the value of improve-
ments to the property paid for by the leaseholder. If leaseholder and freeholder cannot agree on the
premium, they can appeal to a government-run Leasehold Valuation Tribunal (LVT) with the power
to set the prices for extensions. In Section IV.H, we discuss the effects of LVT decisions and lease
extension regulation on the interpretation of our results, and show that the particular institutional
setting of the U.K. tends to balance the potentially stronger negotiating power of freeholders with
laws and court decisions that might be favorable towards the leaseholder.1This contract structure is not unique to the U.K. and Singapore. Other papers in the real estate literature have studied
the pricing of leasehold and freehold contracts in a variety of settings and countries (e.g., Capozza and Sick, 1991; Wonget al., 2008; Iwata and Yamaga, 2009; Tyvimaa, Gibler and Zahirovic-Herbert, 2013; Bracke, Pinchbeck and Wyatt, 2014;Gautier and van Vuuren, 2014).
5

Some leaseholds contain covenants that might, for example, restrict the type of commercial activ-
ity that can be operated on the land. In Section IV.B we provide empirical evidence that differential
covenants across contracts are unlikely to explain the observed differences in prices between lease-
holds and freeholds, and between leaseholds of different maturity. Finally, management fees and
service charges that are sometimes levied on leaseholders for the maintenance of the property pri-
marily cover expenses also faced by freeholders, and do not significantly confound our analysis.
II.B Leaseholds and Freeholds in Singapore
Residential properties in Singapore are also either sold as freeholds or leaseholds, where the latter
almost always have initial terms of 99 or 999 years. By far the largest freeholder is the government
of Singapore, represented by the Singapore Land Authority (SLA). As in the U.K., there is a vibrant
private secondary market for leaseholds, where buyers purchase the remaining term of the original
lease.
At the expiration of the lease, the ownership interest reverts to the SLA. Leaseholders may apply
for a renewal of the lease before expiration. The granting of an extension is decided on a case-by-case
basis; considerations include whether the development is in line with the government’s planning
intentions, and results in land use intensification or the mitigation of property decay. Between 2007
and 2010 about 60% of lease extension applications were approved. If the extension is approved,
the Chief Valuer determines the “land premium” that will be charged. Prior to 2008 an additional
“building premium” was charged, based on the value the Chief Valuer puts on the building sitting
on the land with an expiring lease; the building premium was payable if a lease extension was sought
and the building not demolished. The new lease cannot exceed the original, and might be shorter if
otherwise not in line with the Urban Redevelopment Authority’s (URA) planning intention.
III EMPIRICAL ANALYSIS
The estimation of the relative prices of leaseholds and freeholds is potentially challenging because the
underlying properties are heterogeneous assets. Since leasehold and freehold properties could differ
on important dimensions such as property size and location, comparing prices across properties re-
quires us to control for these differences. We use hedonic regression techniques (Rosen, 1974), which
allow us to consider the variation in price over time and across lease terms for different properties
6

while controlling for key characteristics of each property.
III.A U.K. Residential Housing Data
We begin by analyzing data from England and Wales. We obtained transaction-level administrative
data on all residential housing sales between 1995 and 2013 from the Land Registry. The data include
the price paid as well as some characteristics of the house: whether the property is a flat (apartment)
or a house, the type of house (detached, semi-detached or terraced), the full address and a “new con-
struction” indicator. In addition, the Land Registry has provided us with an indicator of whether the
transaction was for a freehold or a leasehold property, as well as previously unexplored information
on leasehold characteristics such as the origination date and lease length.
Two limitations affect the combined transaction-leasehold data. First, until the Land Registry
Act 2002, which was enforced from October 2003 (see Appendix A.1.2), leasehold registration was
not mandatory for all leases, and leases were valid and enforceable even if they were not registered
with the Land Registry. This limited the incentive to register a lease. Therefore, data before October
2003 are subject to measurement error because transactions that occurred before that date may have
been erroneously associated with out-of-date leaseholds. For this reason, we focus our analysis on
the period 2004-2013.
The second limitation is that the leasehold associated with each transaction in the Land Registry
dataset is the lease registered with the Land Registry at the time of the transaction. This is not a prob-
lem for our analysis except when the freeholder and leaseholder agree to a lease extension. A problem
occurs if the lease extension happened before the transaction but is only registered afterwards. We
have manually detected a number of such instances in a subsample of leasehold transactions. In those
cases, the data erroneously reports the terms of the older (and shorter) lease, while the price paid per-
tains to the new (and longer) lease. This biases our analysis against finding a large price discount for
short leases because a higher price (corresponding to a longer lease) would be mistakenly associated
with a leasehold with fewer years remaining. When we can identify lease extensions (because we
observe transactions that occur under both the old and the new lease), we observe that around 84%
of extensions occur for leaseholds of less than 80 years remaining (see Appendix Figure A.1). We
therefore focus on estimating price discounts for leaseholds with maturities above 80 years, where
extensions are rare and which are particularly informative about very long-run discount rates.2
2We also exclude the 3.1% of transactions for flats in properties for which we observe both a freehold and a leasehold
7

For 80% of the properties, we have obtained additional proprietary property characteristics such
as the number of bedrooms, bathrooms, the size and age of the property as well as information on
the condition, type of heating and availability of parking. These are collected by Rightmove.co.uk
from “for sale” listings and other data sources. Rightmove also provided us with information on the
time on the market for most properties, as well as rental data for about 29, 000 flats that were listed
in London in 2011 and 2012, which allows us to compare rental prices across leasehold and freehold
properties.
III.B U.K. Data: Summary Statistics
Our final dataset contains more than 8 million property transactions between 2004 and 2013. Table
I provides an overview of the U.K. transaction sample. Houses in the U.K. are mainly transacted as
freeholds, with some very long leases and very few shorter leases. Flats are mainly traded as lease-
holds. Since the market for flats and the market for houses are relatively segmented and differ in their
propensity to use freehold and leasehold contracts, we study them separately. In our main analysis
we focus on flats, which have significant variation in terms of remaining lease length. Appendix A.3
shows that the estimated price discounts are, if anything, larger in the sample of house transactions
for which we have less variation across contracts.
The top panel of Figure II shows the distribution of remaining lease length for flats at the time
of sale. There are many transactions with remaining lease length below 300 years and above 700
years, allowing us to trace out the term structure of leasehold discounts across long horizons. To
reduce noise in our estimation, we pool leaseholds into a number of buckets with similar remaining
lease length at the time of transaction, as shown in Table I. The top panel presents the composition
of our sample of flats, comprising almost 1.4 million transactions. About 3% of transactions are for
freeholds, and 27% are for extremely long leaseholds (700 or more years remaining). The rest of the
transactions are for shorter-maturity leaseholds.
While our dataset covers all of England and Wales, it is important to verify that all types of
contracts are present in most locations. We focus on the variation in lease length within 3-digit post-
codes; these relatively small geographical units correspond to the level of geographic fixed effects
transaction. This is because when the same person purchases both the freehold and the leasehold, it is unclear what thedivision of price between the two titles captures. This also removes transactions of flats in buildings where the leaseholdershave jointly purchased the freehold, and now own a "leasehold with a share of the freehold." This procedure does notremove "freehold flats," which are different contracts from leaseholds with a share of the freehold, because they haveclearly assigned individual freehold titles for each flat, as opposed to a fraction of a common freehold title.
8

used in our hedonic analysis. Overall, flats have significant variation across contract types (freehold
vs. leasehold), within leaseholds (by number of years remaining), and across geographic areas.3
Table II shows summary statistics for the main hedonic variables in our analysis of flats in the
U.K., displayed by remaining lease length and pooled across all properties. The median flat in the
U.K. has 2 bedrooms and 1 bathroom, has an area of 66m2 and is in a building that is 36 years old.
The median price for a flat in the U.K. is £123,000. Property characteristics display some variation
between freeholds and leaseholds, and across leaseholds of different remaining lease length. The pat-
terns, however, differ across characteristics. For example, all leaseholds have a very similar number
of bedrooms and bathrooms; freeholds tend to have more bedrooms but fewer bathrooms than lease-
holds. Shorter leaseholds and freeholds tend to be on older buildings than leaseholds of intermediate
lease length.
These summary statistics do not condition on the geographic location of the properties. To better
understand the differences in observable characteristics between leaseholds and freeholds, Figure I
shows the residuals of a regression of each hedonic characteristic on postcode fixed effect for each
group of remaining lease length. Within each 3-digit postcode we observe little systematic difference
in these observable characteristics across leaseholds with different remaining lease length, which
will be our main source of price variation. For the case of property age, there is some variation across
leaseholds of different length, but it is not systematically related to the number of years remaining (for
example, freeholds and shorter leaseholds with 80-99 years remaining tend to be on older buildings
than leaseholds with maturities above 99 years). While there is little variation within leaseholds,
there is evidence that even within 3-digit postcodes, freehold properties are somewhat larger than
leasehold properties.
III.C Price Variation by Lease Length Remaining in the U.K.
In this section we estimate the relative prices paid for leaseholds of varying maturity and freeholds
for flats in England and Wales. Given the support of the “remaining lease length” distribution (see
top panel of Figure II), we construct a set MaturityGroup with 5 buckets for different remaining
3For each of the 2,375 3-digit postcodes in the U.K., we compute the fraction of transactions that occur with each re-maining lease length as well as the fraction of freeholds. Appendix Table A.1 presents the distribution of the shares ofcontracts across postcodes. To visualize the geographic variation of freeholds and leaseholds, Appendix Figures A.3 - A.26also provide maps of the shares of freeholds and leaseholds of different lease length remaining by postcode. The mapsshow significant geographic dispersion for freeholds and leaseholds in the case of flats.
9

lease length: 80-99 years, 100-124, 125-149 years, 150-300 years, and 700+ years. We then estimate
regression (1) below. The unit of observation is a transaction i of a property in 3-digit post code h at
time t. We assign each leasehold transaction with remaining maturity at time of sale Ti,t to one of the
MaturityGroup. The β j coefficients capture the log-discount of leaseholds with maturity in bucket j
of the MaturityGroup relative to otherwise similar freeholds.
log(Pricei,h,t) =α +5
∑j=1
β j1{Ti,t∈MaturityGroupj} + γControlsi,t + ξh × ψt + εi,h,t(1)
We control for average prices in a property’s geography by including 3-digit postcode (ξh) by time
of sale (ψt) fixed effects. We also include dummy variables for whether the property is a new con-
struction, as well as for the number of bedrooms, bathrooms, property condition, whether there is
parking, and the type of heating. We further control for the size and age of the property in a flexible
way by including dummy variables for 50 equally sized groups of these characteristics. Standard er-
rors are clustered at both the quarter and 3-digit postcode level, following the procedure in Petersen
(2009).
Table III shows the results from regression (1) for flats; the different columns test the robustness of
our estimates to different samples and specifications. In column (1) we control for the time of sale in
the interacted fixed effects by using the month of sale, in column (2) by using the quarter of sale, and
in column (3) by using the year of sale. In column (4) we interact all our controls with year dummies,
to allow for time variation in the effect of property characteristics. In column (5) we report the results
obtained by winsorizing prices at the 1% level to reduce the possible effect of outliers. In column (6),
we report the results obtained using only flats with non-missing property characteristics.4 In column
(7) we report the results excluding the London postal district.
The coefficients β j of our baseline estimate, column (1), are also plotted in the bottom panel of
Figure II. Freeholds and leaseholds with maturities of more than 700 years trade at approximately the
same price: the coefficient on β700+ is small and statistically indistinguishable from zero. This suggest
that the present value of rents starting in 700 years is negligible. Leaseholds with shorter maturities
4In our baseline regressions we treat missing characteristics in a different way. For each characteristic X we add a vari-able Xmis that is equal to 1 for all observations for which X is not observed, and 0 otherwise. We then set X = 0 wheneverXmis=1. We estimate our regressions including both X and the dummy Xmis, which controls for any average differencebetween transactions for properties with and without missing characteristics, and allows us to keep the observations withmissing values for X in our estimation. See Dickens and Katz (1987) for a description of this procedure and a discussion ofdifferent approaches to dealing with missing characteristics. As the robustness check in column (6) of Table III shows, ourresults are robust to various ways of dealing with missing characteristics.
10

trade at significant discounts to otherwise identical freeholds: leaseholds with 80-99 years remaining
trade at an approximately 16% discount to freeholds.5 For the median flat, this corresponds to a price
difference of approximately £20, 000. The discount decreases to 10% for leaseholds with 100 to 124
years remaining, 8% for 125-149 years remaining, and 3% for 150-300 years remaining. The results
are robust to the various specifications reported in Table III.
To our knowledge, this is the first extensive analysis of the relative valuation of leaseholds and
freeholds using the universe of transactions and lease terms in England and Wales, combined with
an extensive set of hedonic property characteristics. The analysis reveals substantial discounts for
shorter leaseholds compared to longer leaseholds and to freeholds. Interestingly, when informally
investigating the priors of participants in this market (home buyers, valuers, real estate agents) we
found them to be very dispersed. In particular, a number of valuers believe the discounts to be
smaller than those we found in our systematic analysis, while a number of home buyers believe
them to be bigger. As discussed in Appendix A.1.5, the priors appear to be based on either little
data or introspection.6 This dispersion is consistent with significant heterogeneity of properties, seg-
mentation of the housing market, and the absence of a large-scale systematic empirical analysis of
market valuations. In Section IV, we show that our estimated price differences are not driven by
a number of frictions that could differentially affect the flow utility between leaseholds of different
maturity and freeholds. Instead, the price differences suggest a significant present value attached by
buyers to rents 100 or more years in the future, and, therefore, a relatively low discount rate over
those horizons.
III.D Singapore Residential Housing Data
We obtained transaction-level price data for all private residential transactions in Singapore from the
Urban Redevelopment Authority. We do not use transaction prices for property sales by the Housing
Development Board (HDB), which usually happen at below-market value (see Appendix A.2). We
observe approximately 380,000 private market transactions between 1995 and 2013. For each trans-
action there is information on the transaction price and date, the lease terms, property characteristics
and the precise location of the property. Table IV provides an overview of the transaction sample
used in the regressions. There are between 10,000 and 40,000 transactions per year. Between 30% and5The β j coefficients are log discounts. To convert into percentage discounts, compute eβ j − 1.6Valuers at most look at about 200 transactions scattered over a number of years, 10 or more, and often use subjective
judgment and exponential discounting to fill in gaps in the valuations.
11
60% of all transactions each year are of freehold properties. We observe substantial dispersion in the
lease length remaining at the time of sale. Figure III plots the remaining lease length at the time of
sale for leaseholds with initially 99 years (left panel) and initially 999 years maturity (right panel).
There are no transactions of leaseholds with 100 to 800 years remaining on the lease, and relatively
few transactions with lease lengths less than 70 years.
For Singapore we observe fewer hedonic characteristics than for the U.K.; the primary charac-
teristics are property size, development size and property age. Table V shows summary statistics for
age and size of the property in our sample. While there is some heterogeneity in size and age across
leaseholds and between leaseholds and freeholds, there do not seem to be clear patterns across ma-
turities. For example, leaseholds with 70-84 years remaining on the lease tend to be smaller both
relative to shorter leases (50-69 years) and to longer leases (800+), as well as freeholds. Age of the
building is correlated with maturity, but freeholds and 800+ leaseholds tend to be in buildings that
are approximately the same age as leasehold with maturity 85-94 years. As we do for the U.K., to
further study the differences in characteristics across contracts we estimate residuals conditional on
5-digit postcode fixed effects. Figure I (bottom row) shows that there is no systematic difference in
property size by lease length remaining; older properties, unsurprisingly, tend to transact with fewer
years remaining on the lease.
III.E Price Variation by Lease Length Remaining in Singapore
To analyze the relative price paid for leaseholds and freeholds in Singapore we run regression (2) be-
low. The unit of observation is a property i of type g (e.g., apartment, condominium, detached house,
executive condominium, semi-detached house and terrace house), of title type s (either “strata” or
“land”),7 in geography h, sold at time t. For leaseholds the variable Ti,t captures the number of years
remaining on the lease at the time of sale. We split the 99-year leases into five buckets with different
groups of lease length remaining (50-69 years, 70-84 years, 85-89 years, 90-94 years and 95-99 years).
We also include a dummy variable for 999-year leases, all of which have at least 800 years remain-
ing when we observe the transaction. The excluded category are the freeholds. The key dependent
variable is the log of the price paid in the transaction.
7Residential properties in Singapore are classified into land or strata titles. Land title properties occupy land that isexclusive to the owner (e.g., a detached house), whereas a strata title comprises units in cluster housing (e.g., an apartment).Owners of strata properties enjoy exclusive title only to the airspace of their individual unit. The land that the developmentis built on is shared by all the owners of the project, based on the share of the strata title unit owned by each owner. SeeAppendix A.2 for details.
12
ln (Price)i,h,s,g,t = α +6
∑j=1
β j1{Ti,t∈MaturityGroupj} + γControlsi,t+(2)
+ ξh × ρs × φg × ψt + εi,h,s,g,t
The results from this regression are shown in Table VI. In column (1) we control for 5-digit postcode
(ξh) by title type (ρs) by property type (φg) by transaction quarter (ψt) fixed effects. Beyond these
94, 700 fixed effects, our other control variables include property age, size and type, as well as the
total number of units in a development. Standard errors are double clustered by 5-digit postcode
and by quarter.
The results are consistent with our findings for the U.K.: the price paid for freeholds and other-
wise similar leaseholds with more than 800 years remaining is economically and statistically iden-
tical. Leases with maturities of 99 years or less sell at a significant discount to otherwise identical
freeholds. For example, a leasehold with 95-99 years remaining maturity trades at an 11.8% discount,
which corresponds to a SG$108,000 price discount for the median flat. A leasehold with 70-84 years
remaining trades at a 24% discount.8 In column (2) we control for the transaction month rather than
the transaction quarter. In column (3), rather than controlling for the age of the property directly, we
only focus on the sale of newly-built properties. The estimates for 95-99 year leases are unaffected.
For leases with shorter maturities the estimates of the discount increase somewhat. However, since
most leases get topped up to 99 years when the property gets rebuilt, there are few observations to es-
timate the discount of new properties with 80 years lease length remaining. In column (4) we restrict
transactions to those where the buyer is not the HDB. The results are essentially unchanged, suggest-
ing that sales to the HDB generally happen at market value. In column (5) we restrict our analysis to
strata properties, which comprise the majority of all title types; in column (6) we restrict the analysis
to land titles. 999 year leaseholds and freeholds trade at the same price. There are very few land title
properties trading on 99 year leases, making it hard to estimate the lower end of the term structure
of leasehold discounts. Nevertheless, while the estimates are very noisy (and there are not sufficient
8The regression has a high adjusted R2 of above 95%. This suggests that there remains no significant variation in pricesthat is not explained by our control variables, and that our discounts are thus unlikely to be driven by unobserved hetero-geneity between freehold and leasehold properties. The adjusted R2 remains at 95% if we exclude those instances where weonly observe one transaction for a particular fixed effect, in which the fixed effects perfectly explains the transaction price.This is consistent with properties in Singapore being very homogeneous, in particular conditional on our tight geographicfixed effects.
13
data to estimate every bucket), the point estimates for the land title and strata regressions are similar.
IV FRICTIONS AND LEASEHOLD DISCOUNTS
In Section III we estimated significant price differences between 100 year leaseholds and otherwise
similar freeholds or leaseholds with longer maturity. In Section V we will show that these leasehold
discounts are informative about very long-run discount rates. Before discussing the interpretation of
our results in terms of discount rates, however, we explore several ex-ante plausible alternative inter-
pretations of the estimated price discounts, all of which involve the flow utility being different across
the different contracts: (i) the presence of unobserved structural heterogeneity across properties, (ii)
the impact of leasehold covenants, (iii) the impact of differences across freeholders, (iv) a different
clientele for freeholds and leaseholds, (v) differential liquidity of freehold and leasehold properties,
(vi) financing frictions for short leaseholds, (vii) the impact of taxation, and (viii) hold-up problems
at lease extension. Overall, there is no evidence that the flow utility from owning properties differs
across leaseholds of different maturity and freeholds. In terms of the model in the introduction, thus,
we argue that conditional on our observable control variables, D is the same across all properties.
This will allow us to interpret the estimated discounts in terms of net discount rates, r− g.
IV.A Unobserved Structural Heterogeneity
Even after controlling for all observed differences across properties (such as property size and age),
there potentially remains unobserved structural heterogeneity that could vary systematically by lease
length. While an econometrician is unable to observe all characteristics that might affect the flow util-
ity from a property, to the extent that these characteristics affect the relative prices paid for leaseholds
and freeholds they should also affect the annual market rents for these properties. Conversely, if our
control variables correctly capture all sources of systematic heterogeneity across properties, rents
should not differ systematically between freeholds and leaseholds of different maturity.
To test this, Rightmove has provided us with a sample of around 29,000 rental listing prices
for flats with a full set of property characteristics listed in London during 2011 and 2012. Panel A
of Figure IV shows the price discounts in “for sale” transactions for our full sample as well as the
subsample for which we observe rental prices; this regression is identical to Column (1) in Table
III. Price discounts are very similar in both samples, suggesting that our sample with rental data is
14
representative on this important dimension.
In Columns (1) - (3) of Table VII we estimate different specifications of regression (1) using the
log of annual rents as the dependent variable. There is no significant and systematic difference be-
tween rental rates of freeholds and leaseholds of different maturity.9 Panel B of Figure IV shows the
rental discounts graphically. These results provide support to the assumption that our controls are
correctly capturing the main heterogeneity across properties. This is consistent with the observation
that, conditional on geography, observable characteristics did not vary significantly across leasehold
maturity. Finally, an additional piece of evidence that our hedonic regression allows us to control for
all important structural differences is that, once we control for those observables, there is no observed
price difference between 700+ year leaseholds and freeholds.
IV.B Leasehold Covenants or Contract Structure
A second alternative interpretation of the results is that buyers might perceive an intrinsic difference
between owning a leasehold and owning a freehold (for example, because of restrictions on lease-
holders to redevelop the property, or because of a pure psychological preference for freehold own-
ership). To demonstrate that this is not the case, we show that the price discounts remain the same
when we exclude freeholds and use the longest leaseholds as the excluded category (700+ years).10
This analysis, however, does not yet rule out that covenants or other contract characteristics
might be more restrictive only on shorter leases, which could affect the relative valuation of lease-
holds of different remaining maturity. Ideally, we would like to estimate the price differences between
leaseholds with different remaining maturity at the time of transaction, controlling for the initial lease
length, which would capture differential covenants attached to contracts with different initial matu-
rity. In practice, this is complicated by the high degree of collinearity between initial and remaining
lease length.11
To deal with this collinearity we conduct a number of empirical tests, none of which suggest that9Only the rental prices for the 700+ year bucket are statistically different to the rents for the other buckets. However,
Panel A of Figure IV shows that in this subsample, properties in that bucket also sell for a higher price than freeholds,which they do not in the full sample.
10See Appendix Table A.3 and the top panel of Appendix Figure A.27. We conduct a similar analysis for Singapore, usingleasehold with 95-99 years remaining maturity as the excluded category. See Appendix Table A.4 and the bottom panel ofAppendix Figure A.27.
11The identification of the initial lease length effects – separate from the effect of the years remaining at the time oftransaction – relies on observing transactions with approximately the same number of years remaining (say, 125-150) butvery different initial lease length. Unfortunately, for all buckets except 80-99 years, there are very few transactions ofcontracts with higher initial lease length. For example, only 3% of the properties trading with 125-150 years remaininghave an initial lease length of above 150 years.
15
our results are explained by covenants that vary systematically with initial lease length. In a first
test, we run regression (1) while including fixed effects for the 10 most common initial lease lengths
(which represent 92% of all transactions).12 Table VIII shows the results. The inclusion of these fixed
effects does not significantly affect the estimated price discounts. The discount for leaseholds with
80-99 years remaining relative to freeholds drops from about 16% to 13%; a small part of the initial
16% discount is now attributed to the fixed effects for contracts with 99 years initial maturity. In ad-
dition, the coefficients on the initial lease length fixed effects do not systematically vary with contract
maturity. Overall, we find no evidence that differential covenants are an important explanation for
the estimated discounts.
Since we observe significant variation in initial lease length for the group of transactions with
80-99 years remaining at the time of sale, we analyze this group in more detail in Table IX. Columns
(1) and (2) show results from a variant of regression (1) where the price discount for this group is
allowed to differ between contracts with initial lease length above or below 99 years. Consistent with
Table VIII we only find a small difference between the two groups of initial lease length.13 A different
specification, presented in columns (5) and (6), restricts the sample to transactions of leaseholds with
80-99 years remaining, and includes initial lease length fixed effects for the 8 most common initial
lease lengths in this window. This avoids having to estimate the level of the price discount, and only
looks at the differential prices of different contracts that all trade with roughly the same number of
years remaining. There is no systematic pattern in pricing across initial lease lengths.
Overall, the analysis in Tables VIII and IX suggests that even after controlling, to the extent possi-
ble, for the initial lease length, the discounts related to the remaining leasehold maturity are large and
significant. In addition, the term structure of leasehold discounts we estimate for Singapore between
50 and 99 years (see Appendix Table A.4) keeps the initial length constant (all are 99 year contracts),
and thus cannot be explained by differential initial lease length effects. Two additional pieces of evi-
dence confirm that leasehold covenants are unlikely to have a significant confounding impact on our
analysis. First, to the extent that restrictive covenants affect the flow utility from the property (for
example, because they require a certain configuration of the flat), these restrictions should be passed
12We include fixed effects for initial lease lengths of 99, 120, 125, 150, 155, 199, 200, 250, 800 and 999 years. Results arerobust to also including fixed effects for the 10 next most common initial lease lengths. In addition to the controls in TableIII, we also include an indicator for whether transactions occur as a new contract is started.
13Columns (3) and (4) show that, in addition, there is essentially no difference in discounts for leaseholds with 100-124years remaining between contracts with original lease length below or above 125 (though only 2% of the transactions arein the latter group).
16

onto renters of the property. The absence of differential rents across leaseholds of different maturity
makes it unlikely that there are significant differences in restrictive covenants. Second, a manual in-
spection of covenants on 801 leasehold properties with different lease lengths in postcode E16 (East
London) suggests that the type of covenants included does not vary with lease length (see Appendix
A.1.7.1).
IV.C Heterogeneous Freeholders
One further possible explanation for the estimated price discounts of leaseholds with relatively short
remaining maturities relates to differences across freeholders. If freeholders meaningfully differed
in their treatment of leaseholders, this might affect leaseholders’ incentives and ability to extend
an existing lease. In equilibrium, this could generate an endogenous correlation between remaining
lease length and freeholder characteristics, since leaseholds with more problematic freeholders would
be extended less frequently and would thus trade with fewer years remaining. If leaseholds with
less attractive freeholders also sold for a lower price, this might generate a correlation between the
observed discounts and the years remaining on the lease at the time it transacts that is not directly
related to differences in the maturity of cash flows.
There are a number of reasons why such differences across freeholders cannot explain our esti-
mated price discounts. First, if such differences were economically important, they would affect the
incentives of leaseholders to maintain the property: a leaseholder that is unlikely to extend the lease
because of disagreements with the freeholder will invest less in maintenance. Similarly a prospective
renter would be willing to pay less to live in a building that is not smoothly run or the common areas
of which are not well maintained due to open conflicts between leaseholders and the freeholder. The
fact that annual rents do not differ across remaining lease lengths already suggests that differences
across freeholders are likely to be small.
In addition, to directly address this concern, we further homogenize the estimation sample by
only exploiting variation in remaining lease length of flats within the same building, which are generally
owned by the same freeholder. We focus on flats with remaining lease lengths of less than 300 years,
since in buildings with initial lease lengths of 999 years all properties are part of the 700+ years
remaining bucket (and therefore there is no within-building variation to exploit). There are about
40,000 transactions of flats that sell in the same building and quarter as at least one other flat in a
17
different remaining lease length bucket. The remaining lease length generally differs because of a
differential history of lease extensions, but can also be caused by differential initial lease lengths.
Figure V shows residuals of a regression of different property characteristics on building fixed effects
by remaining lease length, and would allow us to detect any difference in characteristics across flats
with different lease lengths in the same building. Within a building, differential remaining lease
length is not systematically related to characteristics of the property, and, by construction, orthogonal
to characteristics of the freeholder.
Column (1) of Table X shows coefficients of regressions of transaction price on building × trans-
action quarter fixed effects, other hedonic control variables, and dummy variables capturing different
remaining lease length buckets. The excluded category are leaseholds with 150 to 300 years remain-
ing. The evidence is highly consistent with our previous estimates; for example, leaseholds with
80-99 years remaining trade at about a 14% discount to leaseholds with 150-300 years remaining. In
column (2) we include building × transaction month fixed effects, and in column (3) we winsorize
the the dependent variable. In columns (4) - (6) we expand the sample to include all properties
with less than 300 years remaining lease length. While the coefficients on “remaining lease length”
buckets continue to be identified by the 40,000 flats that experience within-building variation in re-
maining lease length, the additional transactions help to better identify the coefficients on the control
variables. The estimates are highly robust across specifications.
In addition to alleviating concerns about differences across freeholders, these results also fur-
ther address some of the other concerns discussed above. First, this sample is even less likely to
differ systematically on unobservable property characteristics - for example, by definition the con-
dition and maintenance of the structure do not vary within building. Second, covenants, contracts
for maintenance and servicing, and restrictions on property redevelopment generally do not vary
within a building. Therefore, our estimates are robust to concerns that the price differences between
leaseholds of different maturity are driven by correlation of remaining lease length with any of these
factors.
For Singapore, a similar analysis is not possible, since the leaseholds for all flats in a building
usually get renewed at the same time. However, it is important to bear in mind that the vast majority
of leaseholders in Singapore have the same freeholder, the Singapore Land Authority (SLA). While
the SLA’s willingness to extend leases might differ depending on planning intentions in that area (see
18

Section II.B), within our 5-digit postcodes, which generally do not include more than 10 buildings,
such planning intentions are likely to be very similar. This means that the possible endogeneity of
lease extensions is significantly mitigated by our very tight geographic fixed effects.
Finally, we also want to re-emphasize that our results are very consistent across the U.K. and
Singapore, despite many differences in the institutional settings. In this case, for example, the U.K.
features many different freeholders while in Singapore the SLA is the main freeholder. At a basic
level, finding very similar discounts across these two setups is an indication that freeholder hetero-
geneity is unlikely to be an important driver of our results.
IV.D Heterogeneous Buyers
We observe no characteristics of the buyers in our transaction sample. Consequently, there might be a
concern that the clientele for leasehold and freehold properties is different, which could help explain
the price differences that we observe. To address this concern, we analyze data from the Survey of
English Housing, an annual household-level survey conducted between 1994 and 2008 that allows us
to compare characteristics of owners of freeholds and leaseholds. We focus on the sample of 201,933
owner-occupiers.
Table XI presents the results of a variant of regression (1) using each individual characteristic of
the owners as a dependent variable. The coefficients on the leasehold indicator then represent the av-
erage difference in each characteristic between leaseholders and freeholders, controlling for property
type by region fixed effects (columns 4 and 5) and property characteristics (column 5).14 Households
owning freeholds and leaseholds are very similar. For example, the weekly income of households
owning leasehold properties is between £3 less and £8 more than the income of households owning
freeholds; this difference is insignificant and small relative to a sample mean and standard deviation
of £350 and £450, respectively. The lack of major differences across buyers conditional on observable
characteristics makes it unlikely that our results are driven by clientele effects related to, for example,
differential bequest motives.14Geographic controls here are more coarse than in previous sections, because the Survey of English Housing only
reports 354 unique local authority codes. Property controls are those observed in both the Survey of English Housing andthe transaction dataset, such as the number of rooms and the property age.
19

IV.E Differential Market Liquidity
Leasehold and freehold properties could potentially be differentially liquid in the resale market, in
which case our estimated price differences might capture a liquidity discount that increases as lease
length declines. To test whether this hypothesis explains the estimated price discounts, Rightmove
has provided us with for-sale listing information for about 2.4 million transactions of flats and houses.
For these transactions we calculate the time between first listing and sale, i.e. the time on the market
(see Appendix Figure A.28 for the distribution), which provides a proxy for the liquidity of the asset
(see Genesove and Han, 2012; Piazzesi, Schneider and Stroebel, 2013).
To test whether liquidity differs by maturity of the lease, Columns (4) to (6) of Table VII repeat
the analysis of regression (1) using time on the market as the dependent variable. The results show
that leaseholds tend to stay a modest 3-6% longer on the market than freeholds, relative to a mean
of about 160 days. Importantly, there is no pattern between remaining lease length and time on
market that could explain the significant discounts we found in comparing short and long leases.
The highest time on market is observed for leaseholds of 150-300 years remaining, followed by the
groups 125-149, 80-99, 100-124 and 700+. Differences in liquidity are therefore unlikely to explain our
results.
IV.F Financing Frictions
Financing frictions have the potential to affect the relative valuation of leaseholds and freeholds.
Leaseholds, in particular short dated ones, require lower upfront payments to take ownership of a
property. If households have high future income that they cannot borrow against, these shorter lease-
holds are more attractive than longer leaseholds or freeholds. This credit constraint makes shorter
leaseholds more desirable, increasing their valuation relative to a frictionless benchmark.
On the other hand, short maturity leaseholds are harder to finance than long maturity ones. For
example, U.K. mortgage lenders typically require a 30 years unexpired lease term to remain at the
end of the mortgage (Council of Mortgage Lenders, 2013). This means that leasehold purchases have
to be financed with shorter maturity mortgages once the lease length falls below 55 or 60 years. The
loss in “collateral value” for these leaseholds could contribute to the large estimated discounts for
leaseholds with maturities around 80 years. However, in Appendix A.4 we calibrate a version of the
simple valuation model from the introduction to show that even under conservative assumptions
20
for the collateral value of the house, financing frictions cannot explain discounts for leases of long
maturities. Intuitively, a lease with 200 years remaining will only incur direct losses to its collateral
value in 140 years, when the lease will have 60 years left: the loss of a fraction of the total value so far
in the future has minimal effect on the present value of the leasehold.
IV.G Taxation and the Stamp Duty
Purchases of property in the U.K. are subject to a transaction tax (stamp duty). The tax applies equally
to freehold or leasehold purchases. The tax schedule is progressive: for example, a purchase of a
property up to £125,000 is tax exempt, while a purchase of a property between £125,001 and £250,000
is taxed at 1% of the total purchase price (see A.1.3). This tax schedule potentially makes shorter term
leases more attractive because for similar properties a shorter, and thus cheaper, leasehold might
avoid incurring the higher tax bracket. This would bias against finding significant leasehold dis-
counts. However, only buyers of properties that are very close to the boundaries of the tax bracket
would be affected, and since the brackets are relatively large the effect on the average discount is
unlikely to be quantitatively important.
IV.H Hold-Up at Lease Extension
One other friction that might contribute to explaining our results relates to hold-up problems during
lease extensions, whereby a freeholder might charge unreasonably high premia and administrative
expenses for the purchase of extra years on the lease. These concerns could potentially make lease-
hold contracts less attractive and therefore contribute to explaining the leasehold price discounts that
we estimate in the data.
In recent years, however, U.K. legislation and court practice have systematically alleviated this
concern. Legislation passed in 1993, well before the beginning of our sample, has granted virtually all
leaseholders who have lived in a property for more than two years the statutory right to seek a lease
extension by 90 years in return for paying a premium (see Appendix A.1.5). If a reasonable premium
cannot be negotiated with the freeholder, the leaseholder can refer the matter to the Leasehold Val-
uation Tribunal that will establish the payable premium. Badarinza and Ramadorai (2014) recently
argue that court enforced settlements have occurred at estimated discounts favorable to leaseholders
compared to those estimated based on market values in this paper. While the court decisions are
somewhat infrequent and subject to legal and advisory costs that can run in the “tens of thousands of
21

pounds" (Westminster City Council, 2013), they alleviate the concern that our discounts could simply
be due to the hold-up problem.15
In addition, our data provides direct evidence that hold-up frictions cannot explain our estimated
price discounts. If some freeholders were more prone to hold leaseholders up at lease extension, thus
resulting in the related leaseholds trading both for lower prices and on average with lower remaining
lease length, we would expect the price differences between leaseholds of different maturity to de-
crease significantly when estimated within the same building because leaseholds in the same building
have the same freeholder. In Section IV.C we showed that leasehold discounts remain identical when
estimating them within the same building.
V DISCUSSION AND INTERPRETATION
Section III presented new facts about the relative pricing of freeholds and leaseholds of different ma-
turities. Leaseholds with over 700 years of maturity trade at the same price as freeholds for otherwise
identical properties. For leaseholds with shorter maturities the price discounts range from 10-15% at
80-100 years remaining to 5-8% at 125-150 years. This suggests that a significant fraction of the value
of freehold properties comes from cash flows (rents) more than 100 years in the future.
In this section we introduce a simple pricing model to discuss the forces that drive these esti-
mated price discounts. Following the classic valuation model of Gordon (1982) we assume that cash
flows arising in each future period are discounted at a constant rate r, so that the T-period discount
factor is erT. We also assume that rents are expected to grow at a constant rate g, so that expected
rents follow: Et[Dt+s] = Dtegs.16 In this model, a claim to the rents for T periods, the T-maturity
leasehold, is valued at:
(3) PTt =
∫ t+T
te−r(s−t)Dteg(s−t)ds =
Dt
r− g(1− e−(r−g)T).
15The possibility of favorable tribunal decisions, and potentially cheaper lease extensions outside the court system asan indirect effect, would increase the ex-ante valuation of leaseholds if prospective buyers were to anticipate lower futurecosts of extensions. To the extent that buyers take this into account, this mechanism would generate a bias against findinglarge discounts for leaseholds relative to freeholds. There are several reasons why buyers may discount the ex-ante valueof this potential advantage: transaction costs related to the extension process can be significant, bargaining times are long(6-18 months), there is uncertainty about the outcome (which may involve going to court twice), and there is general lowawareness by buyers about the details of the extension process. See Appendix A.1.5 for more details.
16Technically, g is the sum of the expected growth rate of rents and a Jensen inequality term. The Jensen term is verysmall given the variance of rent growth and in the interest of intuitive results, we ignore this term and refer to g as theexpected growth rate of rents.
22
Correspondingly, the infinite maturity claim, the freehold, is valued at: Pt = limT→∞ PTt = Dt
r−g , with
r > g. The price discount for a T-maturity leasehold with respect to the freehold is:
(4) DiscTt ≡
PTt
Pt− 1 = −e−(r−g)T.
For any given maturity, the price discount decreases (in absolute value) the higher the discount rate
r and the lower the growth rate of rents g. The first effect occurs because higher discount rates
reduce the present value of future rents. The second effect occurs because higher growth rates of
rents increase the residual value of the property after leasehold expiry.
This simple model shows that the value of leasehold contracts is increasing with maturity. Since
we observe transactions of leaseholds with different maturities in the data, the housing markets we
consider represent an equilibrium where the marginal freeholders and leaseholders are indifferent
between the various contracts.
The estimated price differences between very long-run leaseholds and freeholds can be matched
by a calibration of Equation 4 with a net discount rate of r− g = 1.9%. Figure VI visually confirms the
good fit of this parameterization. To recover the implied gross discount rate, we need to separately
estimate the average long-run real growth rate of rents.
Using data from rental indexes, we estimate the real long-run growth rate of rents, g, to be 0.62%
and 0.17% for the U.K. and Singapore, respectively (see Appendix A.5 for all the data sources).17 To
be conservative, we set g = 0.7%. These estimates of low long-run real growth rates of rents are
consistent with Shiller (2006), who estimates long-run real house price growth rates to be very low,
often below 1%.18
To sum up, our estimated price discounts between long-run leaseholds and freeholds, combined
17To verify our methodology, and compare it to existing literature, we also estimate the average growth rate of real rentalincome in the U.S., which we find to be 0.53%. Our estimates are in line with the median growth rate of 0.4% estimated inCampbell et al. (2009).
18That the two long-run growth rates have to be identical is a feature necessary for rental yields to be stationary. Eichholtz(1997), Eitrheim and Erlandsen (2005) and Ambrose, Eichholtz and Lindenthal (2013) also confirm Shiller’s observationof negligible long-run real house price growth in different countries and using different data. Ambrose, Eichholtz andLindenthal (2013) find evidence of cointegration between house prices and rents using very long-run housing data forAmsterdam. Despite the historical evidence, one possibility is that agents might expect higher rent growth to occur inthe future for a substantial period of time; in this case a higher expected growth rate g would increase the discount rater necessary to match our estimates. For example, one might conjecture that “super-star” cities like Singapore or Londonmight experience such high rent growth in the future (Gyourko, Mayer and Sinai, 2013). However, the low growth rate ofrents were estimated in a period when London and Singapore were already major capitals of the world. In addition, ourestimates in Table III are very similar outside of London, where it is even less likely that households are expecting majorrental growth for centuries.
23
with the estimate of the real growth rate of rents of 0.7%, suggest that households apply discount
rates of 2.6% to housing cash flows hundreds of years in the future.
V.A Very Long-Run Risk-Free Rate and Risk Premia
Our estimated discount rate of 2.6% is appropriate for all cash-flows that have the same riskiness as
housing at long horizons. Estimating the stochastic process of rents and housing is difficult because
of the unavailability of long, unsmoothed time series. However, despite this difficulty, our results can
be used to derive useful bounds on the long-run risk-free discount rate and housing risk premium
under mild assumptions.
The long-run discount rate r is composed of a risk-free component r f , corresponding to the yield
of a hypothetical very-long run real zero-coupon bond, and a risk premium rRP, so that: r = r f + rRP.
Appendix A.6 formalizes this decomposition. Under the assumptions that housing is risky at long
horizons, so that the housing risk premium is positive, and that the risk-free rate is positive, it im-
mediately follows that: 0 < rRP < 2.6%, and 0 < r f < 2.6%.19 Both the long-run risk-free discount
rate and the housing risk premium are between 0 and 2.6%, and sum to 2.6%. The assumption that
housing is risky is supported by a recent literature that points to a co-movement between house
prices and real economic activity (see, for example, Lustig and Nieuwerburgh, 2005; Claessens, Kose
and Terrones, 2009; Reinhart and Rogoff, 2009; Favilukis, Ludvigson and Nieuwerburgh, 2010). Intu-
itively, housing performs poorly during some of the most adverse economic crisis, wars, epidemics
and natural disasters. While it might be harder to quantify precisely how risky housing is, the as-
sumption that it is at least riskier than a risk-free payment is a mild one. Similarly, many economists
have argued for the economic and mathematical implausibility of zero or negative long-run discount
rates (e.g., Koopmans, 1965; Tirole, 1982; Nordhaus, 2007, 2013).
To confirm this bound for the long-run risk-free rate and provide an estimate of the long-run
housing risk premium, we also consider the long-run risk-free rate in the U.K. obtained from the
U.K. real yield curve. Figure VII shows that the real yield curve is flat for maturities between 1 and
25 years with an average real yield of 1.4% for the period 1998-2013. The Bank of England also made
available a 40 year real yield for the period 2006-2013; the average 40 year real yield during this period
19Long-run housing is risky if the price of claims to long-run housing cash flows covaries positively with risk factorssuch as consumption, and hence has low payoffs in bad states of the world.
24

was 0.4%.20 This latter estimate should be interpreted with caution not only because of liquidity
concerns but also because the period is dominated by the global financial crisis and the European
sovereign debt crisis.21 Nevertheless, we conclude that the U.K. real yield curve is approximately flat
on average, with a real yield of 1.4% for maturities between 1 and 25 years, and that there is some
evidence for a mild downward slope at longer maturities with an average 40 year yield below 1%.
Using a calibrated value of 1% for very long-run risk-free yields, we can decompose the total dis-
count rate needed to match the estimated leasehold discounts into the risk-free component r f = 1%,
and a risk adjustment of rRP = 1.6%. While data from the U.K. real yield curve has to be inter-
preted cautiously given its shorter maturity and possible liquidity issues, we find the risk-free rate
estimated with this independent source to be centered in the range of 0 to 2.6% obtained under our
estimates and consistent with the assumption that rents are risky in the long-run and carry a positive
risk premium.
VI CONCLUSIONS AND AVENUES FOR FUTURE RESEARCH
We explore a unique feature of housing markets in the U.K. and Singapore to provide novel evidence
on very long-run discount rates. We find these discount rates to be sufficiently low, at 2.6%, that more
than 10% of the total value of a freehold property comes from cash flows that occur more than 100
years in the future. As such, our findings are of direct relevance for real estate economics and the on-
going effort to understand real estate prices (Flavin and Yamashita, 2002; Lustig and Nieuwerburgh,
2005; Piazzesi, Schneider and Tuzel, 2007; Favilukis, Ludvigson and Nieuwerburgh, 2010; Nathanson
and Zwick, 2012).
Our results are also informative for future research in asset pricing. Combining our discount
rates with estimates of the average rate of return to housing is informative about the term-structure
of discount rates for housing cash flows. A recent literature has provided a wide range of estimates
20The real yield curve is computed by the Bank of England and is available at http://www.bankofengland.co.uk/statistics/Pages/yieldcurve/archive.aspx. We are grateful to Zhuoshi Liu at the Bank of England for makingthe long-maturity average yield available to us. The U.K. government debt also includes some perpetual bonds: the WarLoan and the Annuities. These bonds comprise a negligible part of the outstanding U.K. government debt (£2.6bn out of£1.5trn of debt outstanding), and are classified as small and illiquid issuances by the U.K. Debt and Management Office.They are excluded from our analysis, not only because they are nominal and we only use data on U.K. real gilts, but alsobecause their negligible size, scarce liquidity, and callability make it hard to interpret their prices in terms of discount rates.
21Figure VII plots the average shape of the real U.K. gilts curve for the period 1998-2013, as well as for two sub-periods:1998-2007 and 2007-2013. The level of the yield curve shifted down during this latter period and the yield curve becamehump-shaped.
25

for the real rate of return to housing, ranging from above 6% (Flavin and Yamashita, 2002; Favilukis,
Ludvigson and Nieuwerburgh, 2010) to 2.5% (Piazzesi, Schneider and Tuzel, 2007). Together with our
estimates of very long-run discount rates for housing cash flows, high estimates for the average return
suggest a downward-sloping term structure of discount rates, while lower estimates are consistent
with a flat term structure.
By specifying the dynamic process of housing cash flows, our estimate of long-run risk premia
could also be decomposed into the asset-specific quantity of risk and the economy-wide price of long-
run risk. Future work based on our findings could thus provide a new testing ground for asset pricing
theories, which make stark predictions for the evolution of the price of risk over long horizons (see
Campbell and Cochrane, 1999; Bansal and Yaron, 2004; Barro, 2006; Barro and Ursua, 2008; Nakamura
et al., 2013; Gabaix, 2012; Binsbergen, Brandt and Koijen, 2012; Binsbergen et al., 2013).
Our results also have the potential to contribute to the conduct of cost-benefit analyses that con-
sider effects that materialize over very long horizons. For example, the literature on climate change
economics has focused on the importance of long-run discount rates in assessing the benefits of
policies such as reducing carbon emissions (Weitzman, 1998; Gollier, 2006; Nordhaus, 2007; Stern,
2007; Weitzman, 2007; Barro, 2013). The debate in this literature has often focused on the seemingly-
puzzling model-implied feature that agents attach very little value to cash flows far into the future;
our results, instead, are supportive of the notion that households do attach significant present value
to cash flows in the very long-run.
Finally, the institutional context we present in this paper lends itself to a direct test for the exis-
tence of infinitely-lived rational bubbles, which we pursue in a related paper (Giglio, Maggiori and
Stroebel, 2014).
UNIVERSITY OF CHICAGO
HARVARD UNIVERSITY
NEW YORK UNIVERSITY
26
REFERENCES
Alvarez, Fernando, and Urban J. Jermann. 2005. “Using Asset Prices to Measure the Persistence ofthe Marginal Utility of Wealth.” Econometrica, 73(6): 1977–2016.
Ambrose, Brent W, Piet Eichholtz, and Thies Lindenthal. 2013. “House prices and fundamentals:355 years of evidence.” Journal of Money, Credit and Banking, 45(2-3): 477–491.
Arrow, K. J., W. Cline, K. G. Maler, M. Munasinghe, R. Squitieri, and J. Stiglitz. 1996. IntertemporalEquity, Discounting, and Economic Efficiency, in "Climate Change 1995: Economic and Social Dimensionsof Climate Change". Cambridge University Press.
Auerbach, Alan J., Jagadeesh Gokhale, and Laurence J. Kotlikoff. 1994. “Generational Accounting:A Meaningful Way to Evaluate Fiscal Policy.” The Journal of Economic Perspectives, 8(1): pp. 73–94.
Badarinza, Cristian, and Tarun Ramadorai. 2014. “Long-Run Discounting: Evidence from the UKLeasehold Valuation Tribunal.” Working Paper.
Bansal, Ravi, and Amir Yaron. 2004. “Risks for the long run: A potential resolution of asset pricingpuzzles.” Journal of Finance, 59(4): 1481–1509.
Barro, Robert J. 2006. “Rare disasters and asset markets in the twentieth century.” Quarterly Journalof Economics, 121(3): 823–866.
Barro, Robert J. 2013. “Environmental Protection, Rare Disasters, and Discount Rates.” National Bu-reau of Economic Research Working Paper 19258.
Barro, Robert J., and Jose F. Ursua. 2008. “Macroeconomic Crises since 1870.” Brookings Papers onEconomic Activity, 39(1 (Spring): 255–350.
Binsbergen, Jules van, Michael Brandt, and Ralph Koijen. 2012. “On the Timing and Pricing ofDividends.” American Economic Review, 102(4): 1596–1618.
Binsbergen, Jules van, Wouter Hueskes, Ralph Koijen, and Evert Vrugt. 2013. “Equity yields.”Journal of Financial Economics, 110(3): 503 – 519.
Bracke, P., T. Pinchbeck, and J. Wyatt. 2014. “The Time Value of Housing: Historical Evidence fromLondon Residential Leases.” Working Paper.
Burn, Edward Hector, John Cartwright, and Geoffrey C. Cheshire. 2011. Cheshire and Burn’s ModernLaw of Real Property. Oxford University Press.
Campbell, John Y., and John H. Cochrane. 1999. “By Force of Habit: A Consumption Based Expla-nation of Aggregate Stock Market Behavior.” Journal of Political Economy, 107(2): 205–251.
Campbell, Sean D, Morris A Davis, Joshua Gallin, and Robert F Martin. 2009. “What moveshousing markets: A variance decomposition of the rent–price ratio.” Journal of Urban Economics,66(2): 90–102.
Capozza, Dennis R, and Gordon A Sick. 1991. “Valuing long-term leases: The option to redevelop.”The Journal of Real Estate Finance and Economics, 4(2): 209–223.
Claessens, Stijn, M Ayhan Kose, and Marco E Terrones. 2009. “What happens during recessions,crunches and busts?” Economic Policy, 24(60): 653–700.
Council of Mortgage Lenders. 2013. “What minimum unexpired lease term does the lender accept?”CLM Lender’s Handbook.
Dickens, William, and Lawrence F. Katz. 1987. “Interindustry Wage Differences and Industry Char-acteristics.” NBER Working Paper.
Eichholtz, Piet. 1997. “A long run house price index: The Herengracht index, 1628–1973.” Real EstateEconomics, 25(2): 175–192.
Eitrheim, Øyvind, and Solveig K Erlandsen. 2005. “House prices in Norway, 1819–1989.” Scandina-vian Economic History Review, 53(3): 7–33.
Farmer, J Doyne, John Geanakoplos, Jaume Masoliver, Miquel Montero, and Josep Perelló. 2014.“Discounting the Distant Future.” Cowles Foundation Discussion Paper.
Favilukis, Jack, Sydney C. Ludvigson, and Stijn Van Nieuwerburgh. 2010. “The MacroeconomicEffects of Housing Wealth, Housing Finance, and Limited Risk-Sharing in General Equilibrium.”National Bureau of Economic Research Working Paper 15988.
Flavin, Marjorie, and Takashi Yamashita. 2002. “Owner-occupied housing and the composition ofthe household portfolio.” American Economic Review, 92(1): 345–362.
Gabaix, Xavier. 2012. “Variable rare disasters: An exactly solved framework for ten puzzles in macro-finance.” Quarterly Journal of Economics, 127(2): 645–700.
Gautier, Pieter A, and Aico van Vuuren. 2014. “The estimation of present bias and time preferences
27
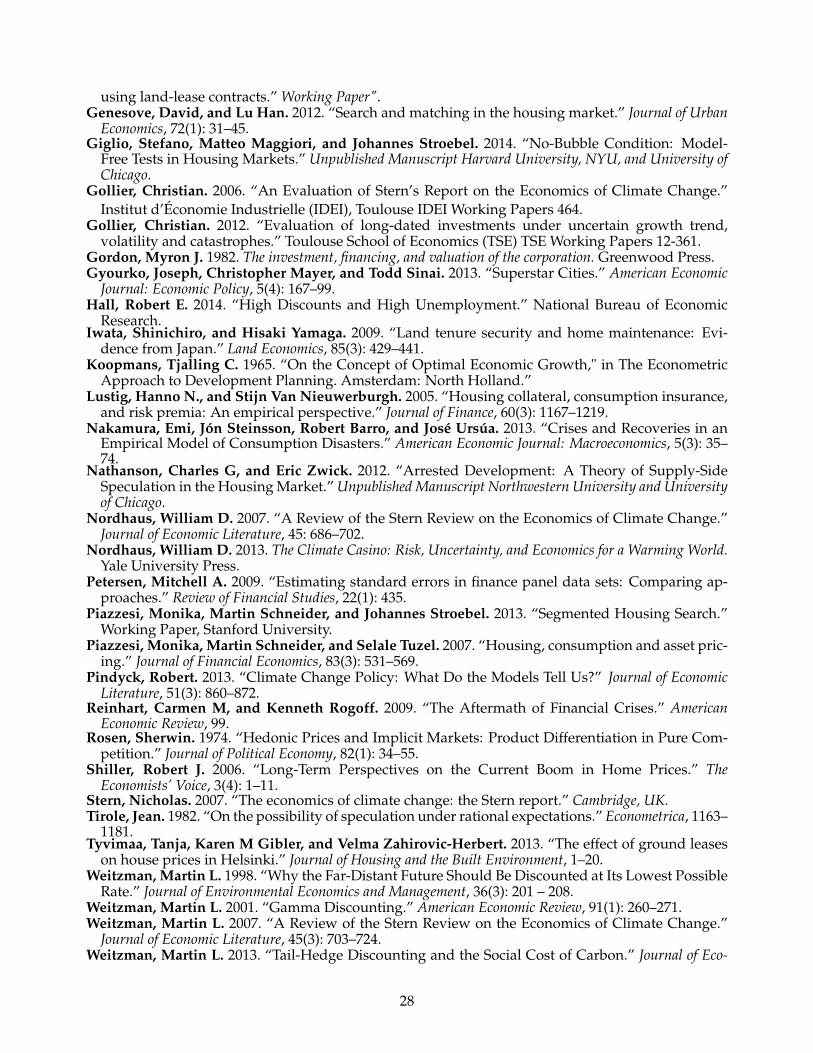
using land-lease contracts.” Working Paper".Genesove, David, and Lu Han. 2012. “Search and matching in the housing market.” Journal of Urban
Economics, 72(1): 31–45.Giglio, Stefano, Matteo Maggiori, and Johannes Stroebel. 2014. “No-Bubble Condition: Model-
Free Tests in Housing Markets.” Unpublished Manuscript Harvard University, NYU, and University ofChicago.
Gollier, Christian. 2006. “An Evaluation of Stern’s Report on the Economics of Climate Change.”Institut d’Économie Industrielle (IDEI), Toulouse IDEI Working Papers 464.
Gollier, Christian. 2012. “Evaluation of long-dated investments under uncertain growth trend,volatility and catastrophes.” Toulouse School of Economics (TSE) TSE Working Papers 12-361.
Gordon, Myron J. 1982. The investment, financing, and valuation of the corporation. Greenwood Press.Gyourko, Joseph, Christopher Mayer, and Todd Sinai. 2013. “Superstar Cities.” American Economic
Journal: Economic Policy, 5(4): 167–99.Hall, Robert E. 2014. “High Discounts and High Unemployment.” National Bureau of Economic
Research.Iwata, Shinichiro, and Hisaki Yamaga. 2009. “Land tenure security and home maintenance: Evi-
dence from Japan.” Land Economics, 85(3): 429–441.Koopmans, Tjalling C. 1965. “On the Concept of Optimal Economic Growth," in The Econometric
Approach to Development Planning. Amsterdam: North Holland.”Lustig, Hanno N., and Stijn Van Nieuwerburgh. 2005. “Housing collateral, consumption insurance,
and risk premia: An empirical perspective.” Journal of Finance, 60(3): 1167–1219.Nakamura, Emi, Jón Steinsson, Robert Barro, and José Ursúa. 2013. “Crises and Recoveries in an
Empirical Model of Consumption Disasters.” American Economic Journal: Macroeconomics, 5(3): 35–74.
Nathanson, Charles G, and Eric Zwick. 2012. “Arrested Development: A Theory of Supply-SideSpeculation in the Housing Market.” Unpublished Manuscript Northwestern University and Universityof Chicago.
Nordhaus, William D. 2007. “A Review of the Stern Review on the Economics of Climate Change.”Journal of Economic Literature, 45: 686–702.
Nordhaus, William D. 2013. The Climate Casino: Risk, Uncertainty, and Economics for a Warming World.Yale University Press.
Petersen, Mitchell A. 2009. “Estimating standard errors in finance panel data sets: Comparing ap-proaches.” Review of Financial Studies, 22(1): 435.
Piazzesi, Monika, Martin Schneider, and Johannes Stroebel. 2013. “Segmented Housing Search.”Working Paper, Stanford University.
Piazzesi, Monika, Martin Schneider, and Selale Tuzel. 2007. “Housing, consumption and asset pric-ing.” Journal of Financial Economics, 83(3): 531–569.
Pindyck, Robert. 2013. “Climate Change Policy: What Do the Models Tell Us?” Journal of EconomicLiterature, 51(3): 860–872.
Reinhart, Carmen M, and Kenneth Rogoff. 2009. “The Aftermath of Financial Crises.” AmericanEconomic Review, 99.
Rosen, Sherwin. 1974. “Hedonic Prices and Implicit Markets: Product Differentiation in Pure Com-petition.” Journal of Political Economy, 82(1): 34–55.
Shiller, Robert J. 2006. “Long-Term Perspectives on the Current Boom in Home Prices.” TheEconomists’ Voice, 3(4): 1–11.
Stern, Nicholas. 2007. “The economics of climate change: the Stern report.” Cambridge, UK.Tirole, Jean. 1982. “On the possibility of speculation under rational expectations.” Econometrica, 1163–
1181.Tyvimaa, Tanja, Karen M Gibler, and Velma Zahirovic-Herbert. 2013. “The effect of ground leases
on house prices in Helsinki.” Journal of Housing and the Built Environment, 1–20.Weitzman, Martin L. 1998. “Why the Far-Distant Future Should Be Discounted at Its Lowest Possible
Rate.” Journal of Environmental Economics and Management, 36(3): 201 – 208.Weitzman, Martin L. 2001. “Gamma Discounting.” American Economic Review, 91(1): 260–271.Weitzman, Martin L. 2007. “A Review of the Stern Review on the Economics of Climate Change.”
Journal of Economic Literature, 45(3): 703–724.Weitzman, Martin L. 2013. “Tail-Hedge Discounting and the Social Cost of Carbon.” Journal of Eco-
28

nomic Literature, 51(3): 873–882.Westminster City Council. 2013. “Homing in on the Issues: Perspectives on the housing crisis.”Wong, Siu Kei, KW Chau, CY Yiu, and MKW Yu. 2008. “Intergenerational discounting: A case from
Hong Kong.” Habitat International, 32(3): 283–292.
29
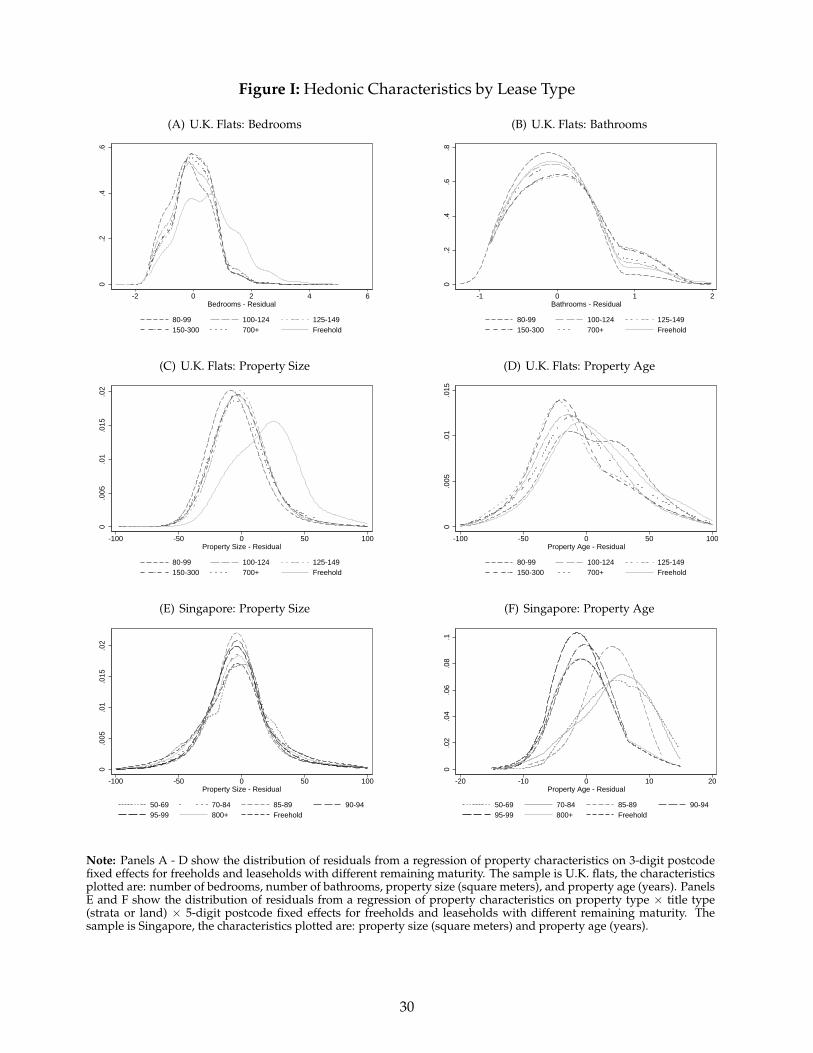
Figure I: Hedonic Characteristics by Lease Type
(A) U.K. Flats: Bedrooms
0.2
.4.6
-2 0 2 4 6Bedrooms - Residual
80-99 100-124 125-149150-300 700+ Freehold
(B) U.K. Flats: Bathrooms
0.2
.4.6
.8
-1 0 1 2Bathrooms - Residual
80-99 100-124 125-149150-300 700+ Freehold
(C) U.K. Flats: Property Size
0.0
05.0
1.0
15.0
2
-100 -50 0 50 100Property Size - Residual
80-99 100-124 125-149150-300 700+ Freehold
(D) U.K. Flats: Property Age
0.0
05.0
1.0
15
-100 -50 0 50 100Property Age - Residual
80-99 100-124 125-149150-300 700+ Freehold
(E) Singapore: Property Size
0.0
05.0
1.0
15.0
2
-100 -50 0 50 100Property Size - Residual
50-69 70-84 85-89 90-9495-99 800+ Freehold
(F) Singapore: Property Age
0.0
2.0
4.0
6.0
8.1
-20 -10 0 10 20Property Age - Residual
50-69 70-84 85-89 90-9495-99 800+ Freehold
Note: Panels A - D show the distribution of residuals from a regression of property characteristics on 3-digit postcodefixed effects for freeholds and leaseholds with different remaining maturity. The sample is U.K. flats, the characteristicsplotted are: number of bedrooms, number of bathrooms, property size (square meters), and property age (years). PanelsE and F show the distribution of residuals from a regression of property characteristics on property type × title type(strata or land) × 5-digit postcode fixed effects for freeholds and leaseholds with different remaining maturity. Thesample is Singapore, the characteristics plotted are: property size (square meters) and property age (years).
30
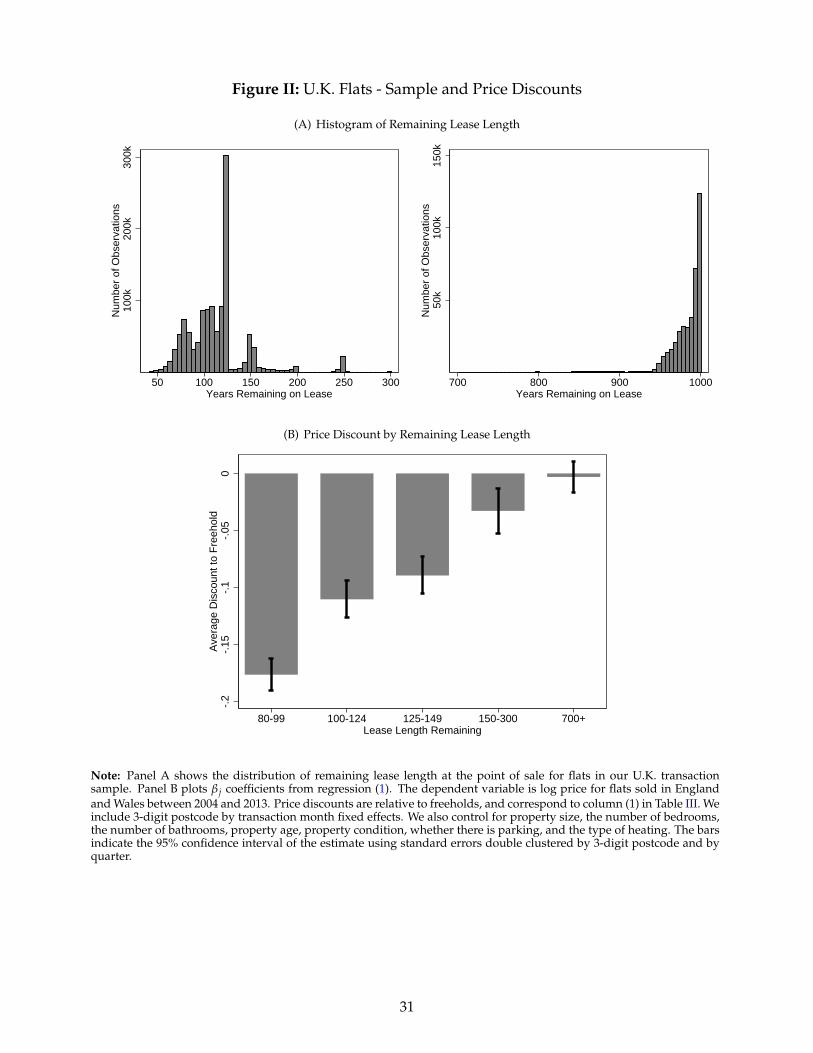
Figure II: U.K. Flats - Sample and Price Discounts
(A) Histogram of Remaining Lease Length10
0k20
0k30
0kN
umbe
r of
Obs
erva
tions
50 100 150 200 250 300Years Remaining on Lease
50k
100k
150k
Num
ber
of O
bser
vatio
ns
700 800 900 1000Years Remaining on Lease
(B) Price Discount by Remaining Lease Length
-.2
-.15
-.1
-.05
0A
vera
ge D
isco
unt t
o F
reeh
old
80-99 100-124 125-149 150-300 700+Lease Length Remaining
Note: Panel A shows the distribution of remaining lease length at the point of sale for flats in our U.K. transactionsample. Panel B plots β j coefficients from regression (1). The dependent variable is log price for flats sold in Englandand Wales between 2004 and 2013. Price discounts are relative to freeholds, and correspond to column (1) in Table III. Weinclude 3-digit postcode by transaction month fixed effects. We also control for property size, the number of bedrooms,the number of bathrooms, property age, property condition, whether there is parking, and the type of heating. The barsindicate the 95% confidence interval of the estimate using standard errors double clustered by 3-digit postcode and byquarter.
31
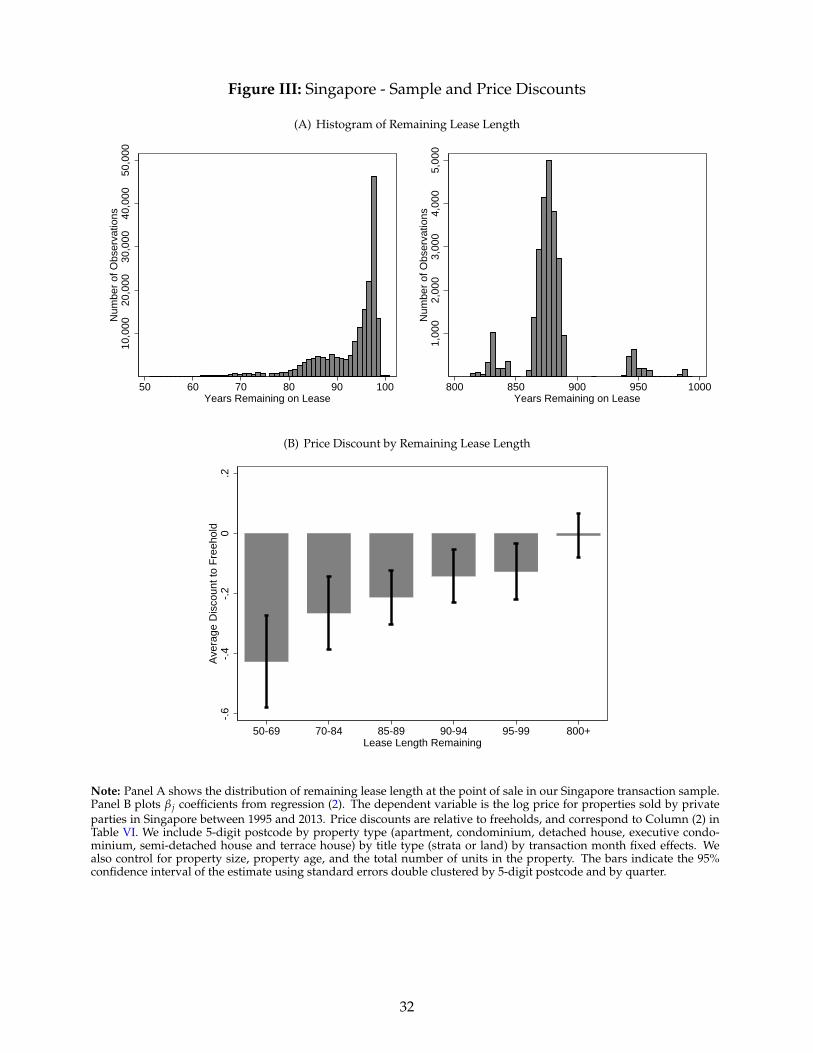
Figure III: Singapore - Sample and Price Discounts
(A) Histogram of Remaining Lease Length10
,000
20,0
0030
,000
40,0
0050
,000
Num
ber
of O
bser
vatio
ns
50 60 70 80 90 100Years Remaining on Lease
1,00
02,
000
3,00
04,
000
5,00
0N
umbe
r of
Obs
erva
tions
800 850 900 950 1000Years Remaining on Lease
(B) Price Discount by Remaining Lease Length
-.6
-.4
-.2
0.2
Ave
rage
Dis
coun
t to
Fre
ehol
d
50-69 70-84 85-89 90-94 95-99 800+Lease Length Remaining
Note: Panel A shows the distribution of remaining lease length at the point of sale in our Singapore transaction sample.Panel B plots β j coefficients from regression (2). The dependent variable is the log price for properties sold by privateparties in Singapore between 1995 and 2013. Price discounts are relative to freeholds, and correspond to Column (2) inTable VI. We include 5-digit postcode by property type (apartment, condominium, detached house, executive condo-minium, semi-detached house and terrace house) by title type (strata or land) by transaction month fixed effects. Wealso control for property size, property age, and the total number of units in the property. The bars indicate the 95%confidence interval of the estimate using standard errors double clustered by 5-digit postcode and by quarter.
32

Figure IV: Rental Data Analysis
(A) Price Discount by Remaining Lease Length, Properties with Rental Data
-.2
-.15
-.1
-.05
0A
vera
ge D
isco
unt t
o F
reeh
old
80-99 100-124 125-149 150-300 700+
Full Data Data with Rental Observation
(B) Rental Discount by Remaining Lease Length
-0.2
0-0
.15
-0.1
0-0
.05
00.
050.
10A
vera
ge D
isco
unt t
o F
reeh
old
80-99 100-124 125-149 150-300 700+Lease Length Remaining
Note: Panel A shows β j coefficients from regression (1) as in column (1) of Table III, allowing for a different coefficientfor properties for which we observe rental data (second bar). Panel B shows β j coefficients from regression (1), as incolumn (2) of Table VII. The dependent variable in Panel B is the log of monthly rents. The sample for rent data is theuniverse of London flats for which rent and hedonic characteristics are available on rightmove.co.uk during 2011 and2012. We control for 3-digit postcode by listing month fixed effects, as well as for property size, the number of bedrooms,the number of bathrooms, property age, property condition, whether there is parking, and the type of heating. The barsindicate the 95% confidence interval of the estimate using standard errors double clustered by 3-digit postcode and bylisting month.
33
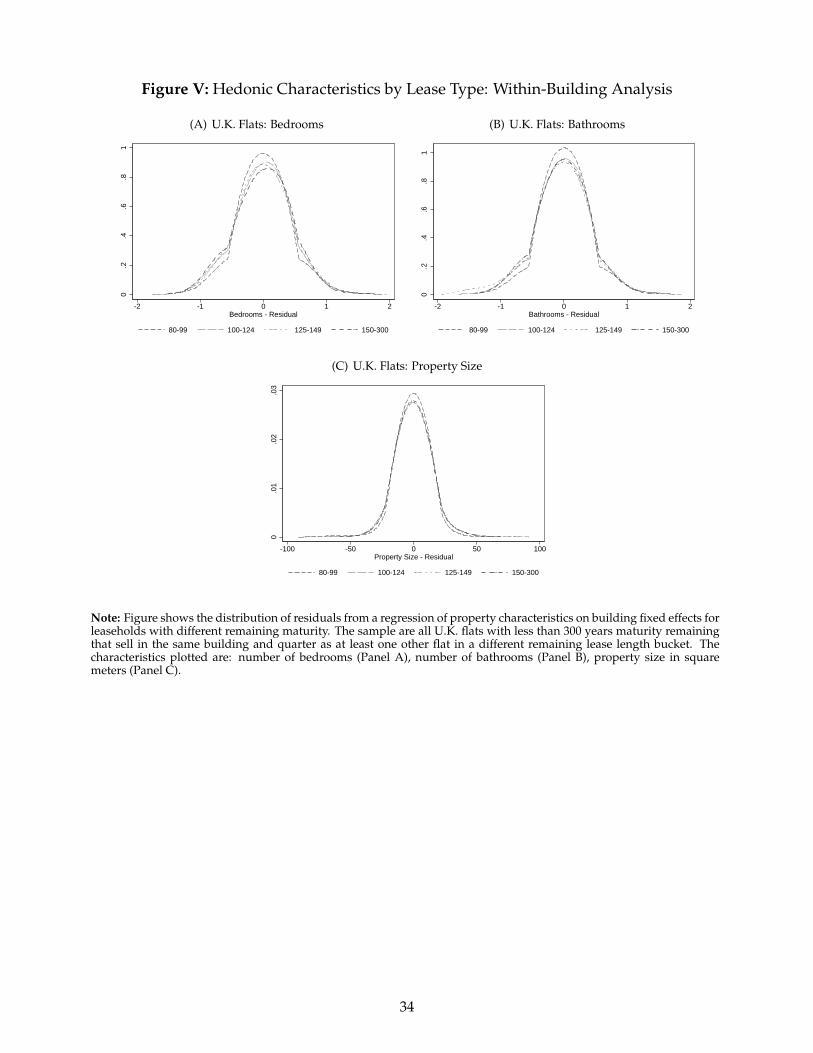
Figure V: Hedonic Characteristics by Lease Type: Within-Building Analysis
(A) U.K. Flats: Bedrooms0
.2.4
.6.8
1
-2 -1 0 1 2Bedrooms - Residual
80-99 100-124 125-149 150-300
(B) U.K. Flats: Bathrooms
0.2
.4.6
.81
-2 -1 0 1 2Bathrooms - Residual
80-99 100-124 125-149 150-300
(C) U.K. Flats: Property Size
0.0
1.0
2.0
3
-100 -50 0 50 100Property Size - Residual
80-99 100-124 125-149 150-300
Note: Figure shows the distribution of residuals from a regression of property characteristics on building fixed effects forleaseholds with different remaining maturity. The sample are all U.K. flats with less than 300 years maturity remainingthat sell in the same building and quarter as at least one other flat in a different remaining lease length bucket. Thecharacteristics plotted are: number of bedrooms (Panel A), number of bathrooms (Panel B), property size in squaremeters (Panel C).
34

Figure VI: Gordon Growth Model and Estimated Discounts
(A) U.K.
80−99 100−124 125−149 150−300 700+−0.25
−0.2
−0.15
−0.1
−0.05
0
Leasehold maturity
Dis
count
Gordon Growth Model
Data
(B) Singapore
50−70 71−85 86−90 91−95 96−100 800+−0.45
−0.4
−0.35
−0.3
−0.25
−0.2
−0.15
−0.1
−0.05
0
Leasehold maturity
Dis
count
Gordon Growth Model
Data
Note: Figure shows the discounts for leaseholds observed in the U.K. (Panel A) and Singapore (Panel B) together withdiscounts predicted by a Gordon growth model with r− g = 1.9%.
Figure VII: U.K. Gilts Real Yield Curve
4 6 8 10 12 14 16 18 20 22 240
0.5
1
1.5
2
2.5
3
Real yield curve, 1998−2007Real yield curve, 2008−2013Real yield curve, 1998−2013
Note: The figure plots the real yield curve for U.K. gilts as computed by the Bank of England.
35
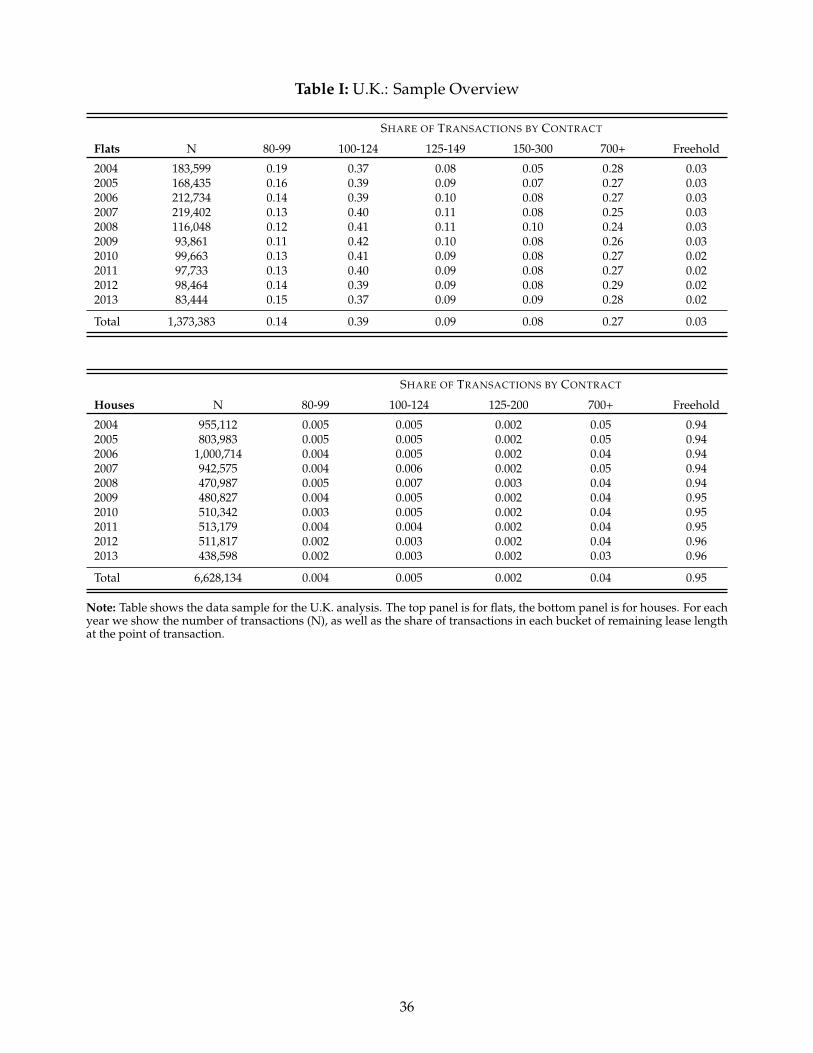
Table I: U.K.: Sample Overview
SHARE OF TRANSACTIONS BY CONTRACT
Flats N 80-99 100-124 125-149 150-300 700+ Freehold
2004 183,599 0.19 0.37 0.08 0.05 0.28 0.032005 168,435 0.16 0.39 0.09 0.07 0.27 0.032006 212,734 0.14 0.39 0.10 0.08 0.27 0.032007 219,402 0.13 0.40 0.11 0.08 0.25 0.032008 116,048 0.12 0.41 0.11 0.10 0.24 0.032009 93,861 0.11 0.42 0.10 0.08 0.26 0.032010 99,663 0.13 0.41 0.09 0.08 0.27 0.022011 97,733 0.13 0.40 0.09 0.08 0.27 0.022012 98,464 0.14 0.39 0.09 0.08 0.29 0.022013 83,444 0.15 0.37 0.09 0.09 0.28 0.02
Total 1,373,383 0.14 0.39 0.09 0.08 0.27 0.03
SHARE OF TRANSACTIONS BY CONTRACT
Houses N 80-99 100-124 125-200 700+ Freehold
2004 955,112 0.005 0.005 0.002 0.05 0.942005 803,983 0.005 0.005 0.002 0.05 0.942006 1,000,714 0.004 0.005 0.002 0.04 0.942007 942,575 0.004 0.006 0.002 0.05 0.942008 470,987 0.005 0.007 0.003 0.04 0.942009 480,827 0.004 0.005 0.002 0.04 0.952010 510,342 0.003 0.005 0.002 0.04 0.952011 513,179 0.004 0.004 0.002 0.04 0.952012 511,817 0.002 0.003 0.002 0.04 0.962013 438,598 0.002 0.003 0.002 0.03 0.96
Total 6,628,134 0.004 0.005 0.002 0.04 0.95
Note: Table shows the data sample for the U.K. analysis. The top panel is for flats, the bottom panel is for houses. For eachyear we show the number of transactions (N), as well as the share of transactions in each bucket of remaining lease lengthat the point of transaction.
36
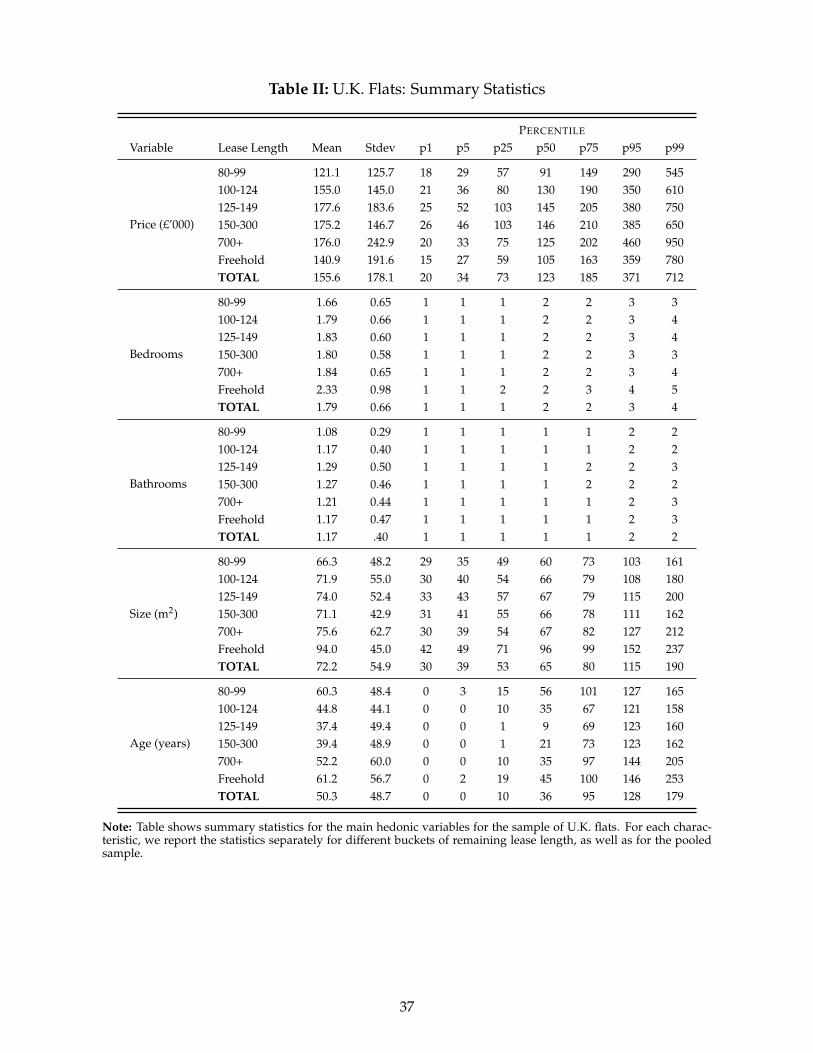
Table II: U.K. Flats: Summary Statistics
PERCENTILE
Variable Lease Length Mean Stdev p1 p5 p25 p50 p75 p95 p99
Price (£’000)
80-99 121.1 125.7 18 29 57 91 149 290 545100-124 155.0 145.0 21 36 80 130 190 350 610125-149 177.6 183.6 25 52 103 145 205 380 750150-300 175.2 146.7 26 46 103 146 210 385 650700+ 176.0 242.9 20 33 75 125 202 460 950Freehold 140.9 191.6 15 27 59 105 163 359 780TOTAL 155.6 178.1 20 34 73 123 185 371 712
Bedrooms
80-99 1.66 0.65 1 1 1 2 2 3 3100-124 1.79 0.66 1 1 1 2 2 3 4125-149 1.83 0.60 1 1 1 2 2 3 4150-300 1.80 0.58 1 1 1 2 2 3 3700+ 1.84 0.65 1 1 1 2 2 3 4Freehold 2.33 0.98 1 1 2 2 3 4 5TOTAL 1.79 0.66 1 1 1 2 2 3 4
Bathrooms
80-99 1.08 0.29 1 1 1 1 1 2 2100-124 1.17 0.40 1 1 1 1 1 2 2125-149 1.29 0.50 1 1 1 1 2 2 3150-300 1.27 0.46 1 1 1 1 2 2 2700+ 1.21 0.44 1 1 1 1 1 2 3Freehold 1.17 0.47 1 1 1 1 1 2 3TOTAL 1.17 .40 1 1 1 1 1 2 2
Size (m2)
80-99 66.3 48.2 29 35 49 60 73 103 161100-124 71.9 55.0 30 40 54 66 79 108 180125-149 74.0 52.4 33 43 57 67 79 115 200150-300 71.1 42.9 31 41 55 66 78 111 162700+ 75.6 62.7 30 39 54 67 82 127 212Freehold 94.0 45.0 42 49 71 96 99 152 237TOTAL 72.2 54.9 30 39 53 65 80 115 190
Age (years)
80-99 60.3 48.4 0 3 15 56 101 127 165100-124 44.8 44.1 0 0 10 35 67 121 158125-149 37.4 49.4 0 0 1 9 69 123 160150-300 39.4 48.9 0 0 1 21 73 123 162700+ 52.2 60.0 0 0 10 35 97 144 205Freehold 61.2 56.7 0 2 19 45 100 146 253TOTAL 50.3 48.7 0 0 10 36 95 128 179
Note: Table shows summary statistics for the main hedonic variables for the sample of U.K. flats. For each charac-teristic, we report the statistics separately for different buckets of remaining lease length, as well as for the pooledsample.
37
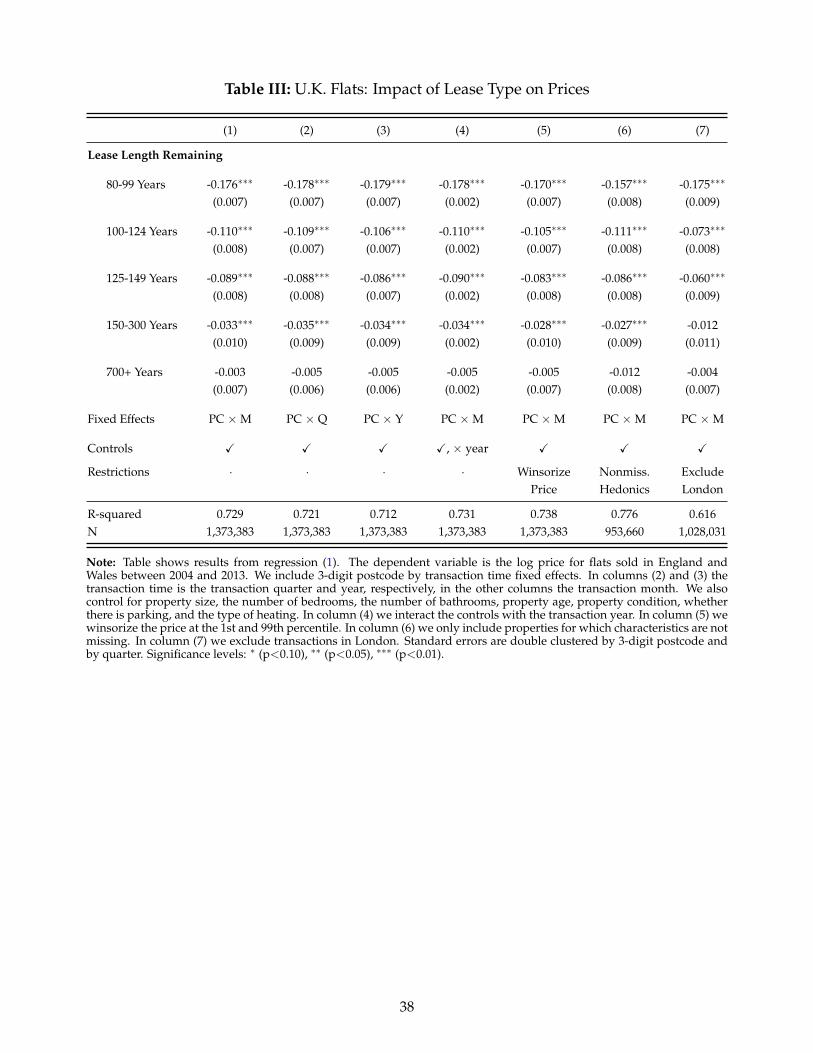
Table III: U.K. Flats: Impact of Lease Type on Prices
(1) (2) (3) (4) (5) (6) (7)
Lease Length Remaining
80-99 Years -0.176∗∗∗ -0.178∗∗∗ -0.179∗∗∗ -0.178∗∗∗ -0.170∗∗∗ -0.157∗∗∗ -0.175∗∗∗
(0.007) (0.007) (0.007) (0.002) (0.007) (0.008) (0.009)
100-124 Years -0.110∗∗∗ -0.109∗∗∗ -0.106∗∗∗ -0.110∗∗∗ -0.105∗∗∗ -0.111∗∗∗ -0.073∗∗∗
(0.008) (0.007) (0.007) (0.002) (0.007) (0.008) (0.008)
125-149 Years -0.089∗∗∗ -0.088∗∗∗ -0.086∗∗∗ -0.090∗∗∗ -0.083∗∗∗ -0.086∗∗∗ -0.060∗∗∗
(0.008) (0.008) (0.007) (0.002) (0.008) (0.008) (0.009)
150-300 Years -0.033∗∗∗ -0.035∗∗∗ -0.034∗∗∗ -0.034∗∗∗ -0.028∗∗∗ -0.027∗∗∗ -0.012(0.010) (0.009) (0.009) (0.002) (0.010) (0.009) (0.011)
700+ Years -0.003 -0.005 -0.005 -0.005 -0.005 -0.012 -0.004(0.007) (0.006) (0.006) (0.002) (0.007) (0.008) (0.007)
Fixed Effects PC ×M PC × Q PC × Y PC ×M PC ×M PC ×M PC ×M
Controls X X X X, × year X X X
Restrictions · · · · Winsorize Nonmiss. ExcludePrice Hedonics London
R-squared 0.729 0.721 0.712 0.731 0.738 0.776 0.616N 1,373,383 1,373,383 1,373,383 1,373,383 1,373,383 953,660 1,028,031
Note: Table shows results from regression (1). The dependent variable is the log price for flats sold in England andWales between 2004 and 2013. We include 3-digit postcode by transaction time fixed effects. In columns (2) and (3) thetransaction time is the transaction quarter and year, respectively, in the other columns the transaction month. We alsocontrol for property size, the number of bedrooms, the number of bathrooms, property age, property condition, whetherthere is parking, and the type of heating. In column (4) we interact the controls with the transaction year. In column (5) wewinsorize the price at the 1st and 99th percentile. In column (6) we only include properties for which characteristics are notmissing. In column (7) we exclude transactions in London. Standard errors are double clustered by 3-digit postcode andby quarter. Significance levels: ∗ (p<0.10), ∗∗ (p<0.05), ∗∗∗ (p<0.01).
38
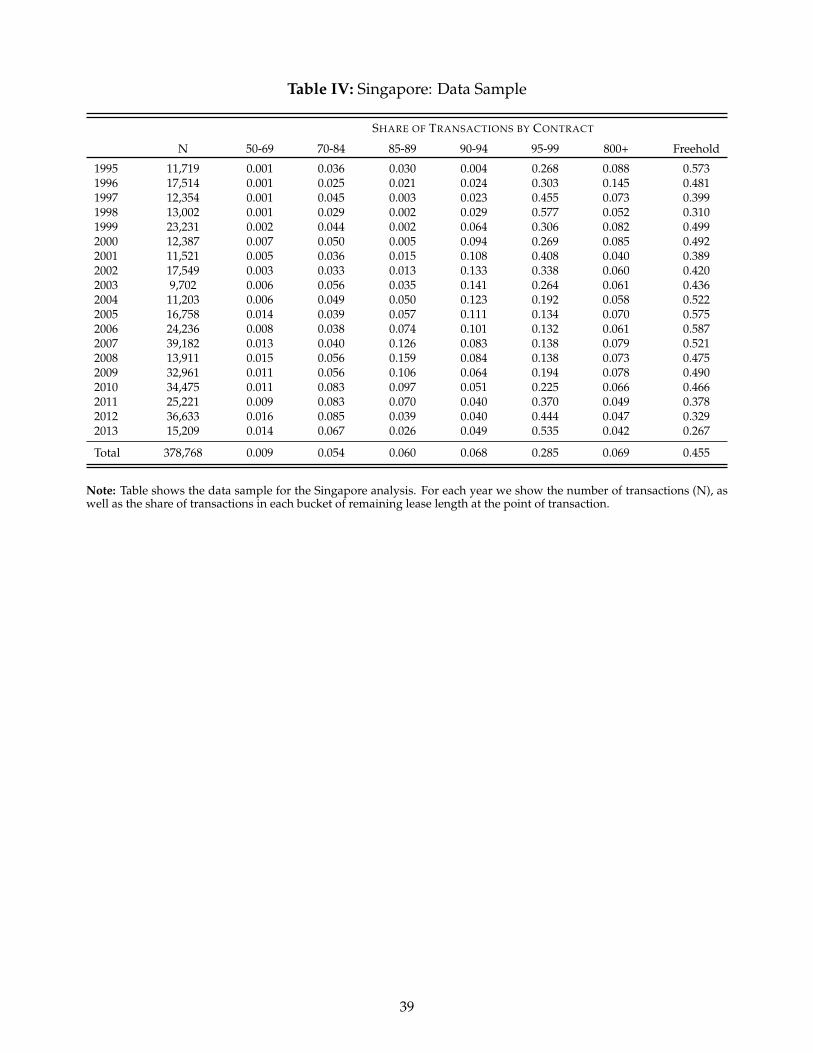
Table IV: Singapore: Data Sample
SHARE OF TRANSACTIONS BY CONTRACT
N 50-69 70-84 85-89 90-94 95-99 800+ Freehold
1995 11,719 0.001 0.036 0.030 0.004 0.268 0.088 0.5731996 17,514 0.001 0.025 0.021 0.024 0.303 0.145 0.4811997 12,354 0.001 0.045 0.003 0.023 0.455 0.073 0.3991998 13,002 0.001 0.029 0.002 0.029 0.577 0.052 0.3101999 23,231 0.002 0.044 0.002 0.064 0.306 0.082 0.4992000 12,387 0.007 0.050 0.005 0.094 0.269 0.085 0.4922001 11,521 0.005 0.036 0.015 0.108 0.408 0.040 0.3892002 17,549 0.003 0.033 0.013 0.133 0.338 0.060 0.4202003 9,702 0.006 0.056 0.035 0.141 0.264 0.061 0.4362004 11,203 0.006 0.049 0.050 0.123 0.192 0.058 0.5222005 16,758 0.014 0.039 0.057 0.111 0.134 0.070 0.5752006 24,236 0.008 0.038 0.074 0.101 0.132 0.061 0.5872007 39,182 0.013 0.040 0.126 0.083 0.138 0.079 0.5212008 13,911 0.015 0.056 0.159 0.084 0.138 0.073 0.4752009 32,961 0.011 0.056 0.106 0.064 0.194 0.078 0.4902010 34,475 0.011 0.083 0.097 0.051 0.225 0.066 0.4662011 25,221 0.009 0.083 0.070 0.040 0.370 0.049 0.3782012 36,633 0.016 0.085 0.039 0.040 0.444 0.047 0.3292013 15,209 0.014 0.067 0.026 0.049 0.535 0.042 0.267
Total 378,768 0.009 0.054 0.060 0.068 0.285 0.069 0.455
Note: Table shows the data sample for the Singapore analysis. For each year we show the number of transactions (N), aswell as the share of transactions in each bucket of remaining lease length at the point of transaction.
39

Table V: Singapore: Summary Statistics
PERCENTILE
Variable Lease Length Mean Stdev p1 p5 p25 p50 p75 p95 p99
Price ($’000)
50-69 1005.8 693.0 210 295 565 875 1272 2149 390070-84 929.9 567.5 305 390 590 808 1070 1920 320085-89 933.9 644.4 350 418 600 788 1080 1800 328090-94 1038.2 1220.1 380 435 610 783 1100 2203 503095-99 977.1 855.1 408 471 618 789 1054 1982 4069800+ 1401.6 1292.9 450 580 820 1083 1543 3080 6200Freehold 1583.1 1807.9 411 535 788 1114 1732 4046 8129TOTAL 1281.9 1431.9 382 478 685 922 1378 3135 6500
Size (m2)
50-69 149.0 84.3 38 66 104 139 163 304 42970-84 139.4 64.9 68 81 103 122 157 244 35585-89 131.1 59.0 66 82 106 116 137 241 35190-94 128.5 69.4 52 64 97 114 133 266 35795-99 116.4 55.6 43 55 90 111 127 202 311800+ 175.5 147.3 42 64 107 134 193 396 705Freehold 173.1 197.0 37 51 99 129 182 394 941TOTAL 149.7 147.0 40 55 96 119 156 320 651
Age (years)
50-69 23.0 12.5 0 0 23 27 31 36 3970-84 13.6 6.4 0 0 12 13 17 24 2885-89 7.9 2.3 0 3 7 8 10 11 1290-94 2.4 2.0 0 0 0 2 4 6 795-99 .04 0.2 0 0 0 0 0 0 1800+ 4.5 7.4 0 0 0 0 7 21 31Freehold 5.2 8.8 0 0 0 0 8 24 37TOTAL 4.2 7.6 0 0 0 0 6 21 32
Note: Table shows summary statistics for the main hedonic variables for the Singapore sample. For each characteristic,we report the statistics separately for different buckets of remaining lease length, as well as for the pooled sample.
40

Table VI: Singapore: Impact of Lease Type on Prices
(1) (2) (3) (4) (5) (6)
Lease Length Remaining
50-69 Years -0.409∗∗∗ -0.426∗∗∗ -0.464∗∗∗ -0.487∗∗∗ -0.424∗∗∗ NA(0.069) (0.079) (0.034) (0.085) (0.074)
70-84 Years -0.275∗∗∗ -0.264∗∗∗ -0.469∗∗∗ -0.273∗∗∗ -0.262∗∗∗ -0.328∗∗
(0.054) (0.061) (0.047) (0.074) (0.058) (0.139)
85-89 Years -0.215∗∗∗ -0.212∗∗∗ -0.111∗∗ -0.216∗∗∗ -0.210∗∗∗ NA(0.040) (0.046) (0.049) (0.054) (0.043)
90-94 Years -0.148∗∗∗ -0.142∗∗∗ -0.169∗∗∗ -0.146∗∗∗ -0.142∗∗∗ -0.179(0.040) (0.045) (0.044) (0.052) (0.042) (0.675)
95-99 Years -0.125∗∗∗ -0.127∗∗∗ -0.127∗∗ -0.132∗∗∗ -0.129∗∗∗ -0.213(0.042) (0.048) (0.055) (0.049) (0.045) (0.621)
800+ Years -0.010 -0.007 0.019 -0.002 -0.008 0.006(0.033) (0.038) (0.049) (0.043) (0.036) (0.127)
Fixed Effects PC × Q PC ×M PC ×M PC ×M × PC ×M PC ×M× Prop Type × Prop Type × Prop Type × Prop Type × Prop Type × Prop Type× Title Type ×Title Type × Title Type × Title Type
Controls X X X X X X
Restrictions · · New Only Private Strata Only No StrataBuyer
R-squared 0.977 0.979 0.981 0.978 0.977 0.985N 378,768 378,768 223,810 220,044 333,684 45,084
Note: Table shows results from regression (2). The dependent variable is the log price for properties sold by private partiesin Singapore between 1995 and 2013. We include 5-digit postcode by property type (apartment, condominium, detachedhouse, executive condominium, semi-detached house and terrace house) by title type (strata or land) by transaction timefixed effects. In column (1), the transaction time is transaction quarter, in columns (2) - (6) it is transaction month. We alsocontrol for property age, property size, and the total number of units in the property. In column (3) we focus on propertiesthat were built within 3 years of the transaction date. In column (4) we focus on properties that were bought by privateindividuals (and not the HDB). In columns (5) and (6) we conduct the analysis for strata and non-strata titles separately.Standard errors are double clustered by 5-digit postcode and by quarter. Significance levels: ∗ (p<0.10), ∗∗ (p<0.05), ∗∗∗(p<0.01).
41

Table VII: Rents and Time on Market Analysis
Dependent variable: LOG(RENT) LOG(TIME ON MARKET)(1) (2) (3) (4) (5) (6)
Lease Length Remaining
80-99 Years -0.021 0.001 0.008 0.059∗∗∗ 0.060∗∗∗ 0.047∗∗∗
(0.028) (0.023) (0.018) (0.010) (0.010) (0.014)
100-124 Years -0.024 -0.004 0.003 0.048∗∗∗ 0.048∗∗∗ 0.022∗
(0.028) (0.024) (0.019) (0.008) (0.008) (0.013)
125-149 Years -0.005 0.007 0.014 0.063∗∗∗ 0.060∗∗∗ 0.059∗∗∗
(0.030) (0.026) (0.021) (0.015) (0.015) (0.020)
150-300 Years -0.020 -0.001 0.009 0.080∗∗∗ 0.076∗∗∗ 0.071∗∗∗
(0.033) (0.030) (0.024) (0.011) (0.010) (0.017)
700+ Years 0.037 0.051∗∗ 0.057∗∗∗ 0.028∗∗∗ 0.028∗∗∗ 0.017∗∗∗
(0.029) (0.025) (0.018) (0.005) (0.005) (0.006)
Fixed Effects PC and M PC ×M PC ×M PC ×M × PC ×M × PC ×M ×Prop Type Prop Type Prop Type
Controls X X X X X, × year X
Restrictions Nonmiss. Nonmiss. Nonmiss. · · Nonmiss.Hedonics Hedonics Hed, Winsor. Hedonics
R-squared 0.674 0.746 0.766 0.070 0.092 0.073N 29,020 29,020 29,020 2,409,181 2,409,181 1,290,825
Note: Table shows results from regression (1). The dependent variable is the log of monthly rents in columns (1) to (3), andthe log of time on market between listing and sale in days in columns (4) to (6). The sample for rent data is the universeof London flats for which rent and hedonic characteristics are available on Rightmove.co.uk during 2011 and 2012. Thesample for the time on market analysis is restricted to the sales of properties (both houses and flats) for which Rightmoveobserves a ”for sale” listing. In column (3) we winsorize the dependent variable at the 1st and 99th percentile. We controlfor property size, the number of bedrooms, the number of bathrooms, property age, property condition, whether thereis parking, and the type of heating. Standard errors are double clustered by 3-digit postcode, and by transaction month(columns 1 - 3) of transaction quarter (columns 4 - 6). Significance levels: ∗ (p<0.10), ∗∗ (p<0.05), ∗∗∗ (p<0.01).
42
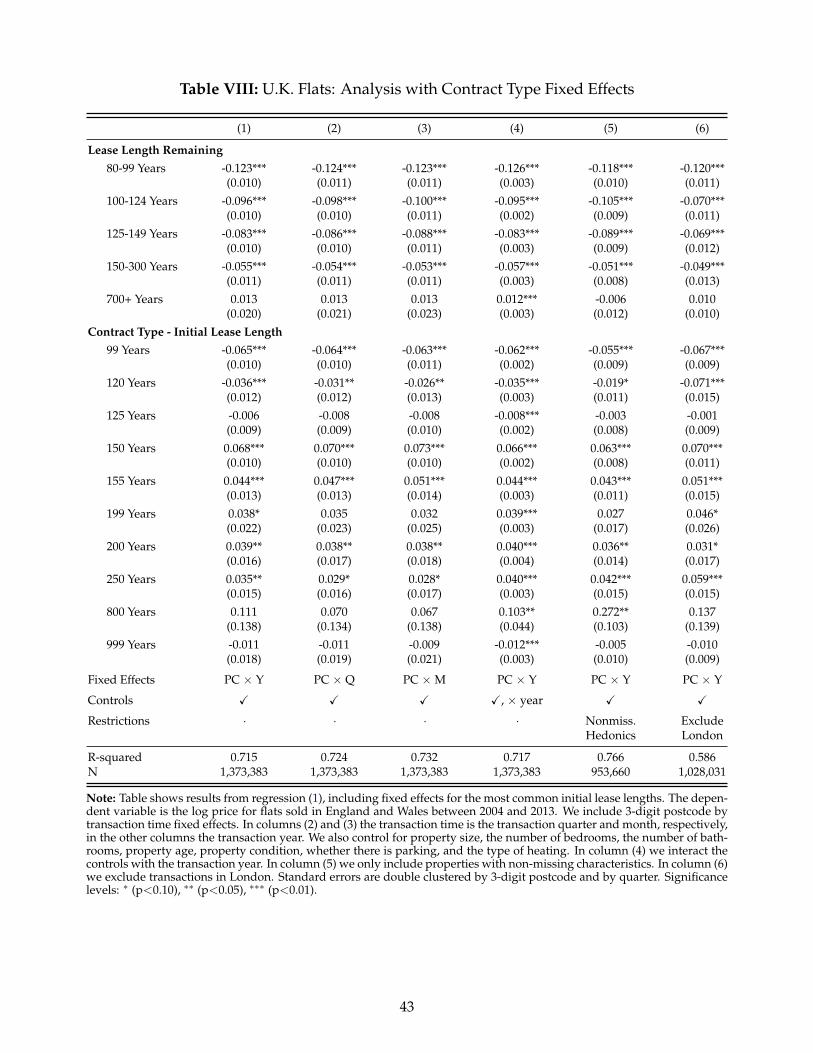
Table VIII: U.K. Flats: Analysis with Contract Type Fixed Effects
(1) (2) (3) (4) (5) (6)
Lease Length Remaining80-99 Years -0.123*** -0.124*** -0.123*** -0.126*** -0.118*** -0.120***
(0.010) (0.011) (0.011) (0.003) (0.010) (0.011)100-124 Years -0.096*** -0.098*** -0.100*** -0.095*** -0.105*** -0.070***
(0.010) (0.010) (0.011) (0.002) (0.009) (0.011)125-149 Years -0.083*** -0.086*** -0.088*** -0.083*** -0.089*** -0.069***
(0.010) (0.010) (0.011) (0.003) (0.009) (0.012)150-300 Years -0.055*** -0.054*** -0.053*** -0.057*** -0.051*** -0.049***
(0.011) (0.011) (0.011) (0.003) (0.008) (0.013)700+ Years 0.013 0.013 0.013 0.012*** -0.006 0.010
(0.020) (0.021) (0.023) (0.003) (0.012) (0.010)Contract Type - Initial Lease Length
99 Years -0.065*** -0.064*** -0.063*** -0.062*** -0.055*** -0.067***(0.010) (0.010) (0.011) (0.002) (0.009) (0.009)
120 Years -0.036*** -0.031** -0.026** -0.035*** -0.019* -0.071***(0.012) (0.012) (0.013) (0.003) (0.011) (0.015)
125 Years -0.006 -0.008 -0.008 -0.008*** -0.003 -0.001(0.009) (0.009) (0.010) (0.002) (0.008) (0.009)
150 Years 0.068*** 0.070*** 0.073*** 0.066*** 0.063*** 0.070***(0.010) (0.010) (0.010) (0.002) (0.008) (0.011)
155 Years 0.044*** 0.047*** 0.051*** 0.044*** 0.043*** 0.051***(0.013) (0.013) (0.014) (0.003) (0.011) (0.015)
199 Years 0.038* 0.035 0.032 0.039*** 0.027 0.046*(0.022) (0.023) (0.025) (0.003) (0.017) (0.026)
200 Years 0.039** 0.038** 0.038** 0.040*** 0.036** 0.031*(0.016) (0.017) (0.018) (0.004) (0.014) (0.017)
250 Years 0.035** 0.029* 0.028* 0.040*** 0.042*** 0.059***(0.015) (0.016) (0.017) (0.003) (0.015) (0.015)
800 Years 0.111 0.070 0.067 0.103** 0.272** 0.137(0.138) (0.134) (0.138) (0.044) (0.103) (0.139)
999 Years -0.011 -0.011 -0.009 -0.012*** -0.005 -0.010(0.018) (0.019) (0.021) (0.003) (0.010) (0.009)
Fixed Effects PC × Y PC × Q PC ×M PC × Y PC × Y PC × Y
Controls X X X X, × year X X
Restrictions · · · · Nonmiss. ExcludeHedonics London
R-squared 0.715 0.724 0.732 0.717 0.766 0.586N 1,373,383 1,373,383 1,373,383 1,373,383 953,660 1,028,031
Note: Table shows results from regression (1), including fixed effects for the most common initial lease lengths. The depen-dent variable is the log price for flats sold in England and Wales between 2004 and 2013. We include 3-digit postcode bytransaction time fixed effects. In columns (2) and (3) the transaction time is the transaction quarter and month, respectively,in the other columns the transaction year. We also control for property size, the number of bedrooms, the number of bath-rooms, property age, property condition, whether there is parking, and the type of heating. In column (4) we interact thecontrols with the transaction year. In column (5) we only include properties with non-missing characteristics. In column (6)we exclude transactions in London. Standard errors are double clustered by 3-digit postcode and by quarter. Significancelevels: ∗ (p<0.10), ∗∗ (p<0.05), ∗∗∗ (p<0.01).
43

Table IX: U.K. Flats: Initial Lease Length Analysis
PANEL A PANEL B(1) (2) (3) (4) (5) (6)
Contract Type Initial Lease Length80-99 years, -0.133*** -0.133*** -0.133*** -0.133*** 99 Years -0.065*** -0.067***Init. Lease >99 (0.008) (0.010) (0.008) (0.010) (0.013) (0.018)
80-99 years, -0.185*** -0.183*** -0.185*** -0.183*** 100 Years -0.138*** -0.141***Init. Lease <=99 (0.008) (0.008) (0.008) (0.008) (0.020) (0.026)
100-124 years, -0.096*** -0.097*** 105 Years 0.025 0.054Init. Lease >125 (0.014) (0.017) (0.067) (0.085)
100-124 years, -0.102*** -0.107*** 120 Years -0.052*** -0.037*Init. Lease <=125 (0.007) (0.008) (0.016) (0.022)
100-124 years -0.102*** -0.107*** 124 Years 0.013 0.003(0.007) (0.008) (0.027) (0.036)
125-149 years -0.056*** -0.060*** -0.056*** -0.060*** 125 Years -0.036** -0.041*(0.007) (0.008) (0.007) (0.008) (0.018) (0.026)
150-300 years -0.024** -0.023** -0.024** -0.023** 126 Years -0.074*** -0.088***(0.009) (0.010) (0.009) (0.010) (0.025) (0.034)
700+ years 0.002 0.004 0.002 0.004 130 Years -0.025 -0.016(0.006) (0.007) (0.006) (0.007) (0.024) (0.032)
Fixed Effects PC × Y PC ×M PC × Y PC ×M PC × Y PC ×M
Controls X X X X X X
Restrictions · · · · 80-100 Years Remaining
R-squared 0.714 0.731 0.714 0.731 0.772 0.787N 1,373,383 1,373,383 1,373,383 1,373,383 197,341 197,341
Note: Panel A shows results from regression (1), where the dummies for buckets of remaining lease length are interacted with indicators for the initial lease length ofthe contract. The dependent variable is log price, for flats sold in England and Wales between 2004 and 2013. Columns (1) and (2) interact the indicator for the groupof transactions with 80-99 years remaining with an indicator of whether the initial length of the leasehold transacted was below or above 99 years. Columns (3) and (4)also interact the indicator for the group of transactions with 100-124 years remaining with an indicator of whether the contract had initial lease length above or below125 years. Panel B runs the same hedonic regression restricted to leaseholds that transact with 80-99 years remaining, and includes fixed effects for the 8 most commoninitial lease lengths. In all regressions, we include 3-digit postcode by transaction time fixed effects. In columns (1), (3) and (5) the transaction time is the transaction year,in the other columns the transaction month. We also control for property size, the number of bedrooms, the number of bathrooms, property age, property condition,whether there is parking, and the type of heating. Standard errors are double clustered by 3-digit postcode and by quarter. Significance levels: ∗ (p<0.10), ∗∗ (p<0.05),∗∗∗ (p<0.01).
44
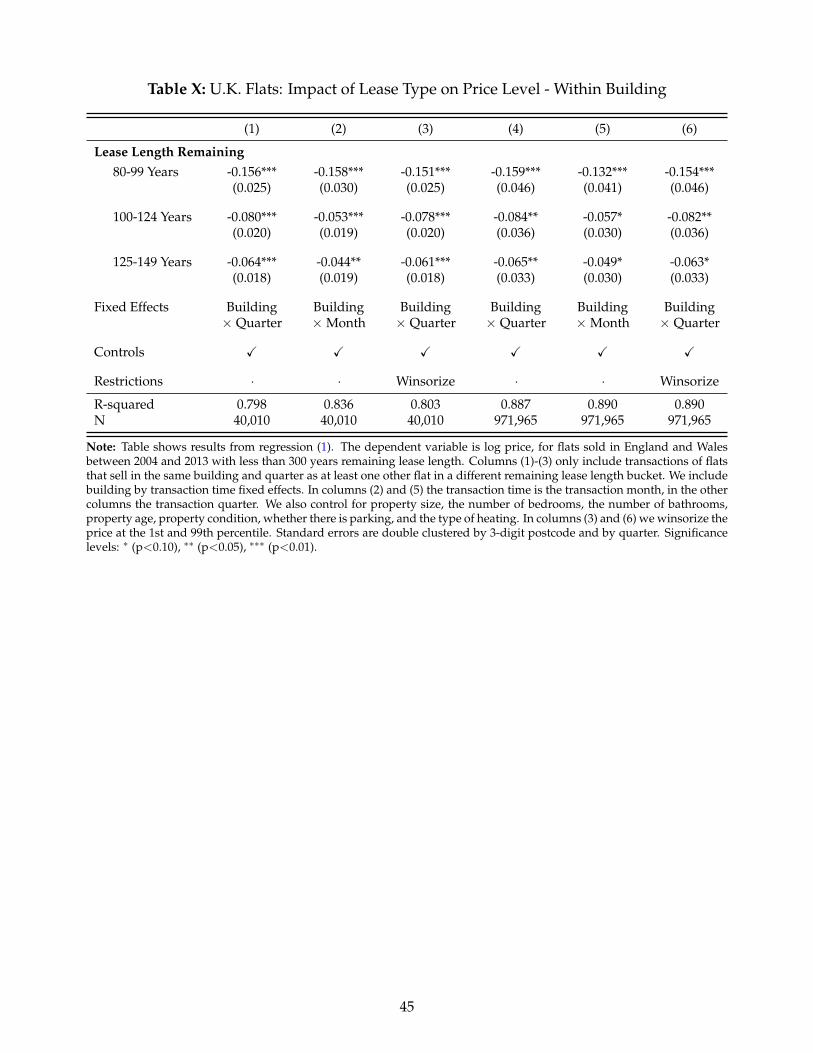
Table X: U.K. Flats: Impact of Lease Type on Price Level - Within Building
(1) (2) (3) (4) (5) (6)
Lease Length Remaining80-99 Years -0.156*** -0.158*** -0.151*** -0.159*** -0.132*** -0.154***
(0.025) (0.030) (0.025) (0.046) (0.041) (0.046)
100-124 Years -0.080*** -0.053*** -0.078*** -0.084** -0.057* -0.082**(0.020) (0.019) (0.020) (0.036) (0.030) (0.036)
125-149 Years -0.064*** -0.044** -0.061*** -0.065** -0.049* -0.063*(0.018) (0.019) (0.018) (0.033) (0.030) (0.033)
Fixed Effects Building Building Building Building Building Building× Quarter ×Month × Quarter × Quarter ×Month × Quarter
Controls X X X X X X
Restrictions · · Winsorize · · Winsorize
R-squared 0.798 0.836 0.803 0.887 0.890 0.890N 40,010 40,010 40,010 971,965 971,965 971,965
Note: Table shows results from regression (1). The dependent variable is log price, for flats sold in England and Walesbetween 2004 and 2013 with less than 300 years remaining lease length. Columns (1)-(3) only include transactions of flatsthat sell in the same building and quarter as at least one other flat in a different remaining lease length bucket. We includebuilding by transaction time fixed effects. In columns (2) and (5) the transaction time is the transaction month, in the othercolumns the transaction quarter. We also control for property size, the number of bedrooms, the number of bathrooms,property age, property condition, whether there is parking, and the type of heating. In columns (3) and (6) we winsorize theprice at the 1st and 99th percentile. Standard errors are double clustered by 3-digit postcode and by quarter. Significancelevels: ∗ (p<0.10), ∗∗ (p<0.05), ∗∗∗ (p<0.01).
45
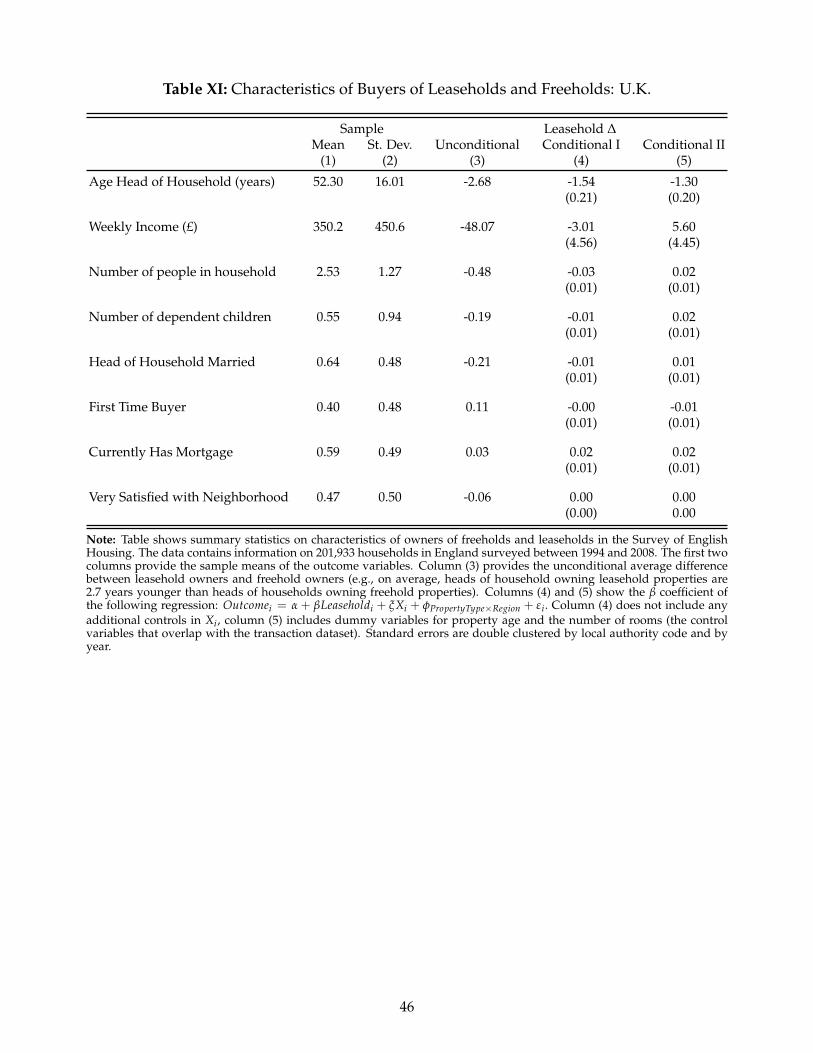
Table XI: Characteristics of Buyers of Leaseholds and Freeholds: U.K.
Sample Leasehold ∆Mean St. Dev. Unconditional Conditional I Conditional II
(1) (2) (3) (4) (5)
Age Head of Household (years) 52.30 16.01 -2.68 -1.54 -1.30(0.21) (0.20)
Weekly Income (£) 350.2 450.6 -48.07 -3.01 5.60(4.56) (4.45)
Number of people in household 2.53 1.27 -0.48 -0.03 0.02(0.01) (0.01)
Number of dependent children 0.55 0.94 -0.19 -0.01 0.02(0.01) (0.01)
Head of Household Married 0.64 0.48 -0.21 -0.01 0.01(0.01) (0.01)
First Time Buyer 0.40 0.48 0.11 -0.00 -0.01(0.01) (0.01)
Currently Has Mortgage 0.59 0.49 0.03 0.02 0.02(0.01) (0.01)
Very Satisfied with Neighborhood 0.47 0.50 -0.06 0.00 0.00(0.00) 0.00
Note: Table shows summary statistics on characteristics of owners of freeholds and leaseholds in the Survey of EnglishHousing. The data contains information on 201,933 households in England surveyed between 1994 and 2008. The first twocolumns provide the sample means of the outcome variables. Column (3) provides the unconditional average differencebetween leasehold owners and freehold owners (e.g., on average, heads of household owning leasehold properties are2.7 years younger than heads of households owning freehold properties). Columns (4) and (5) show the β coefficient ofthe following regression: Outcomei = α + βLeaseholdi + ξXi + φPropertyType×Region + εi. Column (4) does not include anyadditional controls in Xi, column (5) includes dummy variables for property age and the number of rooms (the controlvariables that overlap with the transaction dataset). Standard errors are double clustered by local authority code and byyear.
46