abstract title: baltimore supersite: highly time and …
TRANSCRIPT

ABSTRACT
Title: BALTIMORE SUPERSITE: HIGHLY TIME AND SIZE RESOLVEDCONCENTRATIONS OF URBAN PM2.5 AND ITS CONSTITUENTS FORRESOLUTION OF SOURCES AND IMMUNE RESPONSES
REVISION 1, December 15, 1999
Investigators:J. M. Ondov, Department of Chemistry and Biochemistry, University of Maryland, CollegePark, MD; T. J. Buckley, School of Hygiene and Public Health, Johns-Hopkins University,Baltimore, MD; P. K. Hopke, Clarkson University, Potsdam, NY; M. B. Parlange, Johns-Hopkins University, Baltimore, MD; W. F. Rogge, Department of Civil and EnvironmentalEngineering, Florida International University, Miami, Florida; K. S. Squibb, Department ofPathology, University of Maryland at Baltimore; and A. S. Wexler, University of Delaware,Newark, DE
Project Period: January 1, 2000 to December 31, 2003Project Cost: $3,400,000
PROJECT SUMMARYWe propose to conduct a Supersite project in Baltimore to provide an extended, highly time, size, andcompositionally resolved data set, including an indicator of cardiopulmonary response in support of testinghypotheses relating to source attribution and health effects of PM. Such information is needed to supportdevelopment of State Implementation Plans and the setting of National Ambient Air Quality Standards.Specific hypotheses involve investigations of the toxicity of aerosol components as affected by age,industrial vs urban character, and seasonal differences in source terms and atmospheric chemistry. Thetoxicological metrics chosen, i.e., cytokine and reactive oxygen species (ROS) assays, will be used incorrelations with PM metrics, in much the same manner as EPA’s Integrated Air Cancer Program usedmutagenicity assays to apportion ambient PM mutagenicity among air pollution sources. The project willencompass hourly resolved cytokine/ROS assays of PM2.5 as a metric of toxic response; along withsimilarly time-resolved measurements of PM mass, number vs size distribution, light-scattering coefficient;PM sulfate, nitrate, organic carbon, and elemental carbon using commercial continuous and semi-continuous monitors. In addition, three important new instruments will be fielded: UMCP’s semi-continuous monitor for quantitatively determining aerosol metals and trace elements; UDE’s thirdgeneration single particle mass-spectrometric analysis system (RSMS III) for continuous size and semi-quantitative determination of individual aerosol particle constituents, from 10 nm to 2.5 µm; and JHU’sadvanced 3 wavelength LIDAR for three dimensional mapping of Baltimore’s wind fields and aerosolconcentrations, including plumes from discrete sources. Traditional 24-hr collections for FRM mass and

selected aerosol constituents will provide the link with PM network data. Extensive exploratory organiccompound analyses will be performed to reveal the presence of potentially useful tracer species forreceptor modeling, and identities and concentrations of potentially toxic PM organic constituents, especially,water soluble polar organic compounds which might contribute to cardiopulmonary-related responses. Gram quantities of PM2.5 will be collected weekly and archived for subsequent use by the researchcommunity The Highly-time (hourly and subhourly) size, and species resolved composition metrics will permitresolution of their contributions by sources, thus, providing the link between the health effects metric andsources. Source allocations will be reinforced by inclusion of the standard meteorological data in themultivariate analyses and 3-dimensional wind field and particle concentration maps. Plume width and, thus,time of influence on a fixed site increases with increasing distance from the source. Thus, with highly time-resolved pollutant metrics local (even individual), more distant, and regional source contributions will likelybe readily resolved into different factors by multilinear regression and advanced factor analysis techniques.The 3-D maps will powerfully and visually document the movement of particles from the sources to thereceptor, and ultimately improve our understanding of atmospheric stability and seasonal-mesoscale flowpatterns in driving aerosol fields over Baltimore city. Note that Baltimore, like most of the largenortheastern deepwater port cities, experiences highly complicated local flow patterns which make source-based modeling extremely difficult. Time-resolved rotating drum impactors (RDI) will be used to separate fresh accumulation aerosol fromnearby sources from aged and cloud processed aerosol, and from tailing coarse particle fractions. Thespectra determined from RDI measurements will be used to confirm plume “hits” and as a calibrationreference for single particle measurements. Cytokine and ROS assays on selected RDI samples will beperformed to investigate differences in aerosol age. Mulitvariate calibration models will be used tostatistically interpret and interrelate data developed by the variety of new and established techniques.Professor Hopke will utilize his considerable experience in both aerosol measurements and advanced dataanalysis methods (MLR, PLS, and back propagation neural networks), to provide these critical dataanalyses. The equipment will be installed in trailers and deployed to a primary urban site, an industrially influencedurban residential site, and community sites, in support of hypotheses suggested above. Measurements willbe made continuously over a 12 month period and will encompass 45-day intensive campaigns to beconducted in summer and winter in South Baltimore to test hypotheses regarding effects of industrialinfluence and source resolving power of our measurement strategy.
The influence of emissions from source regions at various distances, the variety and severity of localsources, the rich regional and interpretive contexts provided by the IMPROVE site at the ShenandoahNational Park, the NARSTO upper air station at Ft. Meade, and abundance of prior regional sourceattribution studies make Baltimore an excellent location for the proposed measurements and hypothesistesting. Given the severity of diverse sources in close proximity to densely populated areas combined withthe complex wind fields, the Baltimore community of scientists and regulators desperately needs theextensive, array of high-quality data which we propose to develop.

Supplemental Keywords : Receptor modeling, aerosol particles, trace elements
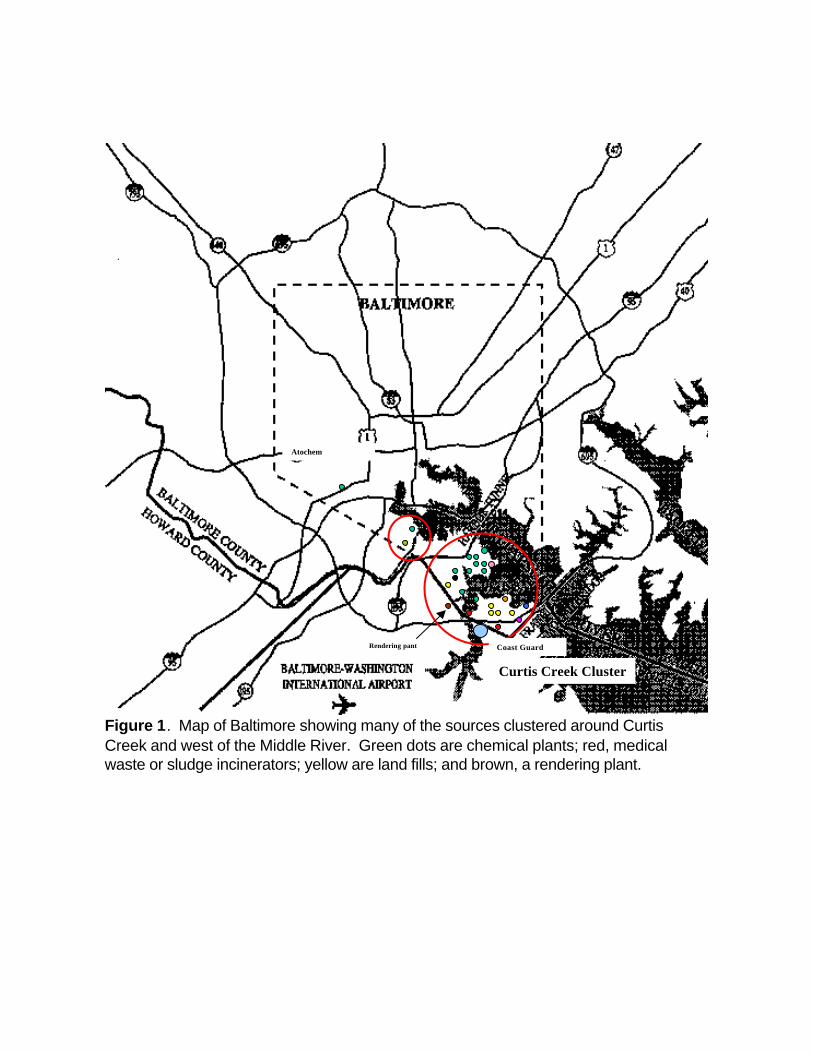
Curtis Creek Cluster
Atochem
Rendering pant Coast Guard
Figure 1. Map of Baltimore showing many of the sources clustered around CurtisCreek and west of the Middle River. Green dots are chemical plants; red, medicalwaste or sludge incinerators; yellow are land fills; and brown, a rendering plant.

Platform 2
Platform 1
Non-UrbanBackground
Community Site
Principal UrbanSupersite
EQUIPMENT LOCATION GOAL
To assess the air pollution levels entering Baltimore City
)
n=90 days
n=275 days
To provide time / space / chemically resolved PM measurements in support of existing exposure and health studies.
)
To provide time / space / chemically resolved PM measurements to provide general ambient characterization and to identify source contributions.
)
Industry / UrbanResidential Site
To provide time / space / chemically resolved PM measurements to identify source contributions.
)
____________________________________________________________________

Summary of Proposed Measurements
Instrument/Sampler Instrument Sites Frequency DurationCommercial Continuous/Semicontinuous Monitors Ultrafine/near accumulation aerosol 0.02 to 0.5 µm Scanning Mobility Particle Spectrometer, Forward
Scanning Laser Spectrometer1,2 5 min 12 months
Far accumulation aerosol/coarse size spectrum 0.5 to > 10 µm Optical Particle Counter 1,2 5 min 12 months Accumulation aerosol vs. aerodynamic size spectra 0.5 to > 10 µm Aerodynamic Particle Spectrometer 2 5 min Intensives Light Scattering entire range Integrated Nephalometer, Radiance Res. 1,2 2 sec 12 months Mass concentration PM2.5 TEOM, 1400A 1,2 5 min 12 months Sulfate concentration PM2.5 To be determined (e.g. R&P, HSPH) 1,2 10 min 12 months Nitrate concentration PM2.5 To be determined (e.g. R&P, HSPH) 1,2 10 min 12 months EC/OC PM2.5 R&P Series 5400-99-004-743-0025 1,2 30 to 60 min 12 months Temp (2 heights), RH, Wind speed and direction, barometric pressure, solar insulation
RM Young/Campbell Sci. met station 1,2 12 months
Sensible latent heat and momentum fluxes 3-D Sonic Annemometer & Krypton hygrometer 1 12 months Ozone TECO 1 12 months NOx, NO2, NO TECO 1 12 months SO2 TECO 1 12 months VOC Hewlet Packard GC 1 12 monthsSpecial Measurements 1 1 hr 12 months As, Cu, Mn, Ni, Cr PM2.5 UMCP SEAS 1 1 hr 12 months Cd, Se, Ag, Pb, Al, Fe, Zn, Ca, V, Ti, Be, Ba PM2.5 UMCP SEAS, retrospective analysis 1 1 hr Intensives Single particle classification by composition and size (most metals,e.g., Na, Mg, K, Cr, Cu, Zn, Cd, Cs, La, Pb, some valence information, NH4SO4, sulfites, hydroxymethane sulfonic acid, methane sulfonic acid, EC/OC, polynuclear aromatic hydrocarbons) 10nm to2.5 µm
UDE RSMS III
1
approx 1 minevery 10 min
12 months
3-D PM/wind fields, and mixing height JHU 3-wavelength Lidar area 1 scan every 6hrs
12 months
210° scan at 5°intervals horizontal by 75° vertical, 8 km range JHU Eye-Safe Lidar area 1 scan every hour Intensives 210° scan at 1/2° intervals horizontal by 75° vertical, 8 km range JHU Eye-Safe Lidar area 1 scan every hour Intensives Selective plume mapping and time series scans JHU Eye-Safe Lidar area 1 scan every hour Intensives
Collections for Off-Line Analyses FRM Mass Conc. <2.5 µm RAAS 2.5 - 100 1,2 24 hr 12 months Speciation Sampler (for elemental and EC/OC analysis)
<2.5 µm RAAS 2.5 - 400 1 24 hr 12 months
Size Segregated Aerosol <0.3 to 10 µm 3 Stage RDI 1 24 hr 12 months Highly-Size Resolved Aerosol <0.069 to 10
µm3 Stage RDI 1 24 hr hrly
resolution12 months
PM2.5 for Cytokine/ROS assays <2.5 µm UMHFAS 1 1 hr 12 months Bulk PM <2.5 µm UMUHVS 1 1 week 12 months Organic Compounds <2.5 µm 2-HP HVS 1 24 hr 12 months 1 1 to 2 hrs Intensives

C-1
Fresno Supersite Phases 2 and 3
Project Summary: This project enhances and extends monitoring at the existing Fresno Supersite suchthat a continuous record of advanced air quality measurements is available from May 15, 1999 throughMarch 31, 2003. Fresno is one of two prototype Supersites that were initiated during 1999 with Phase1 measurements acquired until March 31, 2001. The observables and duration for the Phase 1 periodare insufficient to support health studies planned for California. Phase 2 will enhance the measurementsbegun in Phase 1 to accommodate the needs of simultaneous health-related studies in the Fresno area. Phase 3 will extend monitoring through March 31, 2003 and will fully integrate Fresno Supersitemeasurements with those from other Supersites and with simultaneous health-related studies.
Objectives: Phase 2 and 3 objectives are: 1) test and evaluate non-routine monitoring methods, withthe intent to establish their comparability with existing methods and determine their applicability to airquality planning, exposure assessment, and health impact determination; 2) increase the knowledgebase of aerosol characteristics, behavior, and sources so regulatory agencies can develop standardsand strategies that protect public health; and 3) acquire measurements that can be used to evaluaterelationships between aerosol properties, co-factors, and observed health end-points.
Hypotheses: Phases 2 and 3 hypotheses require a multi-year data set that includes large extremes inmeteorology, aerosol composition, and emissions. Objective 1 hypotheses are: 1) PM2.5 and PM10
measurements by different methods are comparable; 2) mass from number count equals gravimetricmass; 3) hourly coarse particle concentrations can be reliably determined from continuous PM10 andPM2.5 measurements; 4) bioaerosols and endotoxins constitute a constant fraction of coarse particlemass; 5) photoionization measurements are correlated with organic particle concentrations; and 6)chemiluminescent NO2 is equivalent to true NO2. Objective 2 hypotheses are: 1) statistical aggregatesof particle indicators for a single year deviate by less than sampling error from a three-year distribution;2) continuous carbon measurements differentiate carbon sources from each other; 3) statisticalindicators of source contributions do not significantly vary from year to year; 4) particle size, number,surface area, and major chemical component indictors are highly correlated and are equivalentindicators of health risk; and 5) PM2.5 and PM10 mass concentrations were higher during drought yearsthan in years with normal precipitation. Objective 3 hypotheses are: 1) respiratory and cardiovasculardistress are related to PM2.5 concentrations and other indicators; 2) concentration thresholds exist forair quality indicator relationships to health effects; 3) particle characteristics have different effects on theonset and severity of short-term reductions in lung function, asthma attacks, and cardiovascularailments; 4) animals react differently to different particle size, surface area, chemical, and masscharacteristics; and 5) particles in human lungs are similar to those in urban air. Objective 3hypotheses are to be tested in concurrent epidemiological, toxicological, exposure, and clinical studiesthat will use Fresno measurements in real time to conduct experiments and retrospectively to analyzethe results.
Approach: Supersite observables include in situ, continuous, short duration (one hour or less)measurements of: 1) PM2.5, PM10, and coarse (PM10 minus PM2.5) mass; 2) PM2.5 sulfate, nitrate,carbon, light absorption, and light extinction; 3) numbers of particles in discrete size bins ranging from0.01 to ~10 µm; 4) criteria pollutant gases (O3, CO, NOx); 5) reactive gases (NOy, NO2, HNO3,NH3); and 6) single particle characterization by time of flight mass spectrometry. Field sampling and

C-2
laboratory analysis are applied for: 1) gaseous and particulate organic compounds (light hydrocarbons,heavy hydrocarbons, carbonyls, polycyclic aromatic hydrocarbons [PAH] and other semi-volatiles);and 2) PM2.5 mass, elements, ions, and carbon. Observables common to other Supersites, including:1) daily PM2.5 24-hour average mass with Federal Reference Method (FRM) samplers; 2) continuoushourly and five minute average PM2.5 and PM10 mass with Beta Attenuation Monitors (BAM) andTapered Element Oscillating Microbalances (TEOM); 3) daily PM2.5 chemical speciation with an EPAspeciation monitor and protocol; 4) coarse particle mass by dichotomous sampler and differencebetween PM10 and PM2.5 BAM and TEOM measurements; 5) coarse particle chemical composition;and 6) high sensitivity and time resolution scalar and vector wind speed, wind direction, temperature,relative humidity, barometric pressure, and solar radiation. Three satellite sites are operated next to anearby heavily traveled roadway, in a nearby neighborhood that is influenced by wintertime woodburning, and in a non-urban area south of the Fresno city limits. These sites will evaluate deviations inSupersite measurements owing to source proximity and isolation from urban emitters. Satellite sites areequipped with nephelometers operating continuously and with Minivol Teflon and Quartz filter samplersoperating for 24-hours every 6th day to quantify mass, elemental, ion, and carbon concentrations. Dataanalysis activities have been defined that relate every set of measurements to the hypotheses that will betested.
Expected Results: 1) a long-term record of simultaneous advanced particle measurements thatincludes a large range of concentration levels, particle sizes, and aerosol compositions, suitable formany purposes; 2) supportable conclusions about specific hypotheses concerning measurement methodperformance, causes of excessive pollution levels, and effects on health; 3) continuing linkages andcollaboration among air quality scientists, toxicologists, epidemiologists, exposure specialists, andclinicians that better integrate and communicate their scientific findings; 4) a research infrastructure inCalifornia that can serve research needs after Supersite monitoring is completed; and 5) peer-reviewed,scientifically sound publications that support local, state, and national decision-making related tostandard setting and pollution controls.
Leveraging: The California Air Resources Board has committed substantial support for siteoperation, quality auditing, and data management. Planned and pending health studies using Supersitedata include: 1) Particulate Air Pollution and the Natural History of Childhood Asthma; 2) ParticulateAir Pollution and the Natural History of Adult Asthma; 3) Estimating Indoor Exposure from AmbientConcentrations; 4) Health Effects of Concentrated Ambient Particles from the Central Valley ofCalifornia; and 5) Relationships Among Air Quality Indicators and Medical Health Records. Theseprojects have certain or pending support from the Air Resources Board, Department of Energy, theU.S. EPA, and other sources.
Supplemental Keywords: PM2.5, PM10, PM HEALTH EFFECTS, ULTRAFINE, CONTINUOUSAEROSOL MONITOR

C-3
Table 1. Observables, measurement methods, sample durations, frequencies and monitoring periodsfor the Fresno Supersite.
Observable and Method Size Range Avg Time Frequency Period
Gases
NO/NOx (TEI 42 chemiluminescence)c gas 1-hr daily 1990 onward a
Ozone (API 400 UV absorption)c gas 1-hr daily 1990 onward a
Carbon monoxide (Dasibi 3008 infrared absorption) gas 1-hr daily 1990 onward a
Non-methane hydrocarbons gas 1-hr daily 1990 onward a
NOy (high sensitivity TEI 42 with external convertersand denuders)c
gas 5-min daily 12/15/99 to 3/31/03
HNO3 (high sensitivity TEI 42 or Ecophysicschemiluminescent monitor with external converters,denuders & sequencers)d
gas 5-min daily 12/1/00 to 3/31/03
Ammonia (TEI 17C high sensitivity with NOx
scrubbers and oxidizers) dgas 5-min daily 12/1/00 to 3/31/03
Filter Mass and Chemistry
TSP mass (hivol w/ quartz filters) and lead TSP 24-hr 12th day 1990 onward a
PM10 mass, sulfate, nitrate, chloride, and ammonium(hivol SSI w/ quartz filters)
0 to 10 µm 24-hr 6th day 1990 onward a
PM2.5 and coarse mass, elements (dichotomoussamplers with Teflon filters)
0 to 2.5 µm0 to 10 µm
24-hr 6th day 1990-11/1/00 a
PM2.5 and coarse mass, elements. Coarse endotoxins,spores, molds, fungi (dichotomous samplers withTeflon filters)
0 to 2.5 µm0 to 10 µm
24-hr every day 11/1/00-12/3/05 a,e
PM2.5 mass (collocated Andersen sequential FRM w/Teflon filters)
0 to 2.5 µm 24-hr daily for primary6th day collocated
3/1/99 onward a
PM2.5 mass, light absorption, elements, ions, andcarbon (two single-channel FRMs w/ Teflon andquartz filters)
0 to 2.5 µm 24-hr 6th day 7/5/99 to 6/29/00 (method evaluation)
PM2.5 mass, elements, ions, and carbon (six-channelAndersen RAAS speciation sampler w/ denuders andbackup filters)
0 to 2.5 µm 24-hr 6th day 7/5/99 to 6/29/00 (method evaluation)
Particle morphology (Airmetrics Minivol w/ polycarbonate filters andscanning electron microscopy)
0 to ~30 µm 24-hr 6th day 7/5/99 to 6/29/00(method evaluation)
PM2.5 mass, elements, ions, and carbon (two-channel speciation sampler)
0 to 2.5 µm 24-hr 3rd day 2001 onward a
PM2.5 mass, elements, ions, volatilized nitrate,carbon, and ammonia at three neighborhood (satellite)sites (six Airmetrics MiniVols w/ Teflon/citric acidcellulose and quartz/NaCl cellulose filter packs)
0 to 2.5 µm 24-hr 6th day 12/1/99 to 3/31/03

C-4
Table 1. (continued)
Observable and Method Size Range Avg Time Frequency Period
Filter Mass and Chemistry (continued)
PM2.5 mass, elements, ions, carbon, and ammonia(two-channel sequential filter sampler w/ denudersand backup filters; mass on all, chemistry on 100samples) c
0 to 2.5 µm 24-hr daily 12/1/99 to 1/31/01 b
PM2.5 mass, elements, ions, and carbon (two-channelsequential filter sampler w/ denuders and backupfilters) c
0 to 2.5 µm 3-, 5-, and8-hr
5/day
daily on episode days
15 episode days 12/1/00 to 1/31/01 b
PM10 mass, elements, ions, carbon, and fugitive dustmarkers (methods to be specified by CRPAQS) c
0 to 10 µm 24-hr daily sampling withselected
characterization
9/15/00 to 11/15/00 b
Toxic species (metals, chromium VI, aldehydes)(Xontec 920)
0 to ~30 µm 24-hr 12th day 1996 onward a
Continuous Particle Mass and Chemistry
PM2.5 mass (30 °C TEOM) 0 to 2.5 µm 1-hr daily 7/5/99 to 3/31/03
PM10 mass (30 °C TEOM) 0 to 10 µm 1-hr daily 7/5/99 to 3/31/03
PM2.5 mass (ambient temperature BAM) c 0 to 2.5 µm 1-hr daily 5/15/99 onward a
PM10 mass (ambient temperature BAM) c 0 to 10 µm 1-hr daily 5/15/99 onward a
PM2.5 nitrate and sulfate (ADI flash volatilization with TEI NOx detector) d
0 to 2.5 µm 10-min daily 9/23/99 to 3/31/03
PM2.5 nitrate and sulfate (ADI flash volatilization with TEI SO2 detector) d
0 to 2.5 µm 10-min daily 2/1/00 to 3/31/03
PM2.5 organic and elemental carbon (R&P Series 5400 carbon monitor) c
0 to 2.5 µm 30-min daily 12/15/99 to 3/31/03
PM2.5 organic and elemental carbon (MET ONE in situ analyzer)
0 to 2.5 µm 30-min daily 4/1/01 to 3/31/03
Individual particle size and chemistry (UC Riverside time-of-flight spectrometer)
0 to 10 µm 5-min daily on episode days
15 episode days 12/1/00 to 1/31/01 b
Organic Gases and Particles
Toxic hydrocarbons (Xontec 910 canister sampler) gas 24-hr 12th day 1995 onward
Carbonyls (Xontec 925 DNPH sampler) c gas 24-hrsummer
4/day
12th day 3rdday
1995 onward a 1995onward a
Light hydrocarbons (canister & GC/FID) c gas 5- to 8-hr, 4/day
daily for episodes 15 episode days 12/1/00 to 1/31/01 b
Organic Gases and Particles (continued)
Heavy hydrocarbons (TENAX & GC/TSD/FID) c gas 5- to 8-hr, 4/day
daily for episodes 15 episode days 12/1/00 to 1/31/01 b
Aldehydes (DNPH & HPLC) c gas 5- to 8-hr, 4/day
daily for episodes 15 episode days 12/1/00 to 1/31/01 b
PM2.5 organic compounds (Teflon-coatedglass-fiber/PUF/XAD filters and GCMS) c
0 to 2.5 µm 5- to 8-hr, 4/day
daily for episodes 15 episode days 12/1/00 to 1/31/01 b

Observable and Method Size Range Avg Time Frequency Period
C-5
PM2.5 organic compounds (Teflon-coatedglass-fiber/PUF/XAD filters and GCMS)
0 to 2.5 µm 24-hr 6th day 6/1/00-9/30/00 b
PM2.5 organic compounds (Minivol w/ Teflon-coatedglass-fiber filters and GCMS) (aggregated for 60sample polycyclic aromatic hydrocarbon [PAH]analysis) c
0 to 2.5 µm 24-hr 6th day 2/1/00 to 1/31/01 b
Continuous particle-bound PAHs (EcoChemAnalytics PAS2000 w/ UV radiation andphotoelectric aerosol sensors)
0 to 1 µm 5-min daily 9/30/99 to 3/31/03
Continuous Light Scattering
Ambient particle light scattering (Optec NGN2 ambient-temperature nephelometer at550 nm)
0 to ~30 µm 5-min daily 5/15/99 to 3/31/03
Dry particle light scattering (Optec NGN3 heated nephelometer at 550 nm)
0 to 2.5 µm 5-min daily 5/15/99 to 12/31/99 (method evaluation)
Total particle light scattering (Radiance M903 nephelometer with smart heater at530 nm) c
0 to ~30 µm 5-min daily 12/15/99 to 3/31/03
PM2.5 particle light scattering (Radiance M903 nephelometer with smart heater at530 nm)
0 to 2.5 µm 5-min daily 12/15/99 to 3/31/03
Light scattering (TSI- DUSTRACK photometer at 780 nm)
0 to 2.5 µm 5-min daily 5/15/99 to 3/31/01
Light Absorption
Coefficient of haze (AISI paper tape sampler) 0 to ~30 µm 2-hr daily 1990 onward a
Light absorption (McGee aethalometer at 880 nm) c 0 to 2.5 µm 5-min daily 5/15/99 to 3/31/03
Light absorption (McGee multi-color [450, 570, 590, 615, 660, 880,and 950 nm] aethalometer)
0 to 2.5 µm 30-min daily 5/15/99 to 3/31/03
Particle Sizes
Scanning mobility particle sizer (TSI 3936L10 with3010S ultrafine condensation particle counter w/ TSI3080L electrostatic classifier and differential mobilityanalyzer and TSI 3900087 software) c
10 to 1,000 nm 5-min daily 12/15/99 to 3/31/03
Particle Sizes (continued)
Fine particle size distribution in 8 size fractions (0.1,0.2, 0.3, 0.4, 0.5, 0.7, 1.0, and 2.0 µm)(PMS Lasair 1003 optical particle counter) c
0.1 to 2 µm 5-min daily 11/1/99 to 3/31/03
Aerodynamic particle sizer (TSI 3926) 0.3 to 10 µm 5-min daily 2/1/01 to 3/31/03
Coarse particle size distribution in 16 size fractions(0.3, 0.4, 0.5, 0.63, 0.8, 1.0, 1.3, 1.6, 2.0, 2.5, 3.2, 4.0,5.0, 6.3, 8.0, and 10 µm)(Climet CI-500 optical particle counter) c
0.5 to 10 µm 5-min daily 12/15/99 to 3/31/03

Observable and Method Size Range Avg Time Frequency Period
C-6
Mass and ion size distribution in 9 size fractions(0.054, 0.105, 0.148, 0.37, 0.54, 1.0, 1.8, 3.2, 5.6, and15 µm) (MOUDI with Teflon filters and IC and AC)
0.054 to 15 µm 5- to 8-hr daily for episodes 15 Episode Days 12/1/00-1/31/01 b
Carbon size distribution in 9 size fractions (0.054,0.105, 0.148, 0.37, 0.54, 1.0, 1.8, 3.2, 5.6, and 15 µm) (MOUDI with aluminum filters and TOR)
0.054 to 15 µm 5- to 8-hr daily for episodes 15 Episode Days 12/1/00-1/31/01 b
Meteorology
Wind speed/direction (Met One 05305L high-sensitivity wind vane and anemometer) c
NA 5-min daily 5/15/99 onwardb
Temperature (Met One CS500L high-accuracy sensor) c
NA 5-min daily 5/15/99 onwardb
Relative humidity (Met One CS500L high-accuracy sensor) c
NA 5-min daily 5/15/99 onwardb
Solar radiation(Met One LI200X-L) c
NA 5-min daily 9/15/99 onwardb
Barometric pressure sensor c NA 5-min daily 9/15/99 onwardb
Data Acquisition and Processing
Campbell Scientific 24-input analogue data loggerwith modem dialup
NA All times daily 5/15/99 onwardb
PC-LABVIEW serial data logger with modem dialupc NA All times daily 12/1/99 onwardb

C-7
Table 1. (continued).
a Part of the California Air Resources Board’s compliance monitoring network.b Measurements from the California Regional Particulate Air Quality Study (CRPAQS) (Watson et al., 1998a). Three to five
wintertime episodes of four to eight day duration will be monitored based on a forecast of high PM2.5 concentrations underclear sky stagnation and stagnation with fog conditions.
c These ground-level measurements will also be taken at the non-urban Angiola site established by CRPAQS from 2/1/00 through1/31/01 and during pollution episodes. This site is located 100 km south of Fresno in a flat area of the San Joaquin Valleysurrounded by agricultural fields dominated by cotton and alfalfa. Simultaneous measurements from Angiola will be used withthose from the Fresno site to evaluate hypotheses about measurement equivalence in the absence of fresh urban emissions andto separate urban from non-urban contributions to the concentrations of measured observables. CRPAQS episodicmeasurements at Angiola will be taken at the same time as those acquired at Fresno.
d Measurements at Angiola are available from 12/1/00 through 1/31/01.
e Part of Particulate Air Pollution and the Natural History of Childhood Asthma sponsored by ARB.

GULF COAST AEROSOL RESEARCH AND CHARACTERIZATION PROGRAM
C.ABSTRACT
Sorting Code: Particulate Matter “Supersites” Program, 99-NCERQA-X1Title: Gulf Coast Aerosol Research and Characterization Program (GC-ARCH)Principal Investigator: David Allen, The University of Texas at Austin
Co-Principal Investigator: Matthew Fraser, Rice UniversityCo-investigators: D. Collins, Texas A&M; S. Dasgupta, Texas Tech; S. Hering, AerosolDynamics; P. Hopke, Clarkson University; A. Russell, Georgia Tech; A. Wexler, University ofDelawareCollaborating institutions: Brookhaven National Laboratory, City of Houston, Houston RegionalMonitoring Network, Mickey Leland National Urban Air Toxics Research Center, NOAA, TexasHazardous Substance Research Center, Texas Natural Resource Conservation Commission,Southern California Center for Airborne Particulate Matter, Southern Oxidants Study, University ofTexas Houston Health Science Center
Lead Institutions: The University of Texas at Austin, Rice University Project Period: 12/1/99 – 9/30/03Project Cost: Project Summary:A fine particulate matter (fine PM) “Supersite” for Southeastern Texas is proposed. This Supersite wouldbe located in a region where approximately 2.5 million people may be exposed to annual average PMconcentrations in excess of 15 µg/m3. Significant fine PM exposures are not the only rationale, however,for choosing Southeastern Texas as a location for a PM Supersite. The Houston area is home to the largestconcentration of petrochemical manufacturing facilities in the United States, and as a consequence theindustrial source signatures for PM and PM precursors are strong, particularly for organics. Emissions fromtypical urban anthropogenic sources and biogenic sources are also significant. Finally, exposure studies,toxicological studies, and a large ambient air quality field study are planned for the summer of 2000 inSoutheastern Texas. These studies will provide valuable data sets that can be combined with the data tobe collected by the program described in this proposal. Objectives: The specific objectives of the research program described in this proposal will be1. to collect physicochemical data on fine PM that can be used to characterize spatial and temporal
variability in fine PM source contributions and composition, in Southeastern Texas2. to characterize spatial and temporal variability in fine PM source contributions and composition,
throughout the southeastern United States, and3. to examine the physical and chemical process that govern PM formation and transformation in
Southeastern TexasThree additional objectives will be addressed by integrating the measurements made in this program withmeasurements to be made in separately funded studies. These objectives will be:4. to develop a combined database on PM, gas phase air pollutants and meteorological variables, suitable
for testing models of the formation and fate of fine PM; this objective will be achieved by coordinatingwith a large, integrated ozone and PM field study planned by the Southern Oxidants Study
5. to examine exposures to fine PM from specific source categories in Southeastern Texas; this objectivewill be achieved by coordinating with an exposure study currently underway in Houston, funded by theMickey Leland National Urban Air Toxics Research Center, and
GULF COAST AEROSOL RESEARCH AND CHARACTERIZATION PROGRAM
6. to relate the physicochemical data on fine particulate matter to mammalian cell responses; this objectivewill be achieved by coordinating with an EPA funded project currently underway at the University ofTexas Houston Health Science Center.
Approach: The proposed measurements would be made at 3 core sites. The core sites will be tied toapproximately 20 peripheral, fine PM monitoring sites operated by the Texas Natural ResourceConservation Commission and other organizations. Measurements will be made over a 16 month period,beginning in June, 2000. To maximize leveraging opportunities, a 6 week intensive sampling program,during August and September 2000, will be embedded in the 16 month field program. The specificmeasurements to be made, and the relationship of the measurements to the study objectives, are describedin detail in the proposal.Expected Results: The three primary objectives of the Supersites program, as described in the Requestfor Applications, are to characterize particulate matter and its sources, support health effects and exposureresearch, and to conduct methods testing. The proposed program will address each of these program goalsand will test a number of scientific hypotheses. Characterizing particulate matter and its sources: Spatial and temporal variability in fine PM sourcecontributions and composition will be assessed in Southeastern Texas and throughout the SoutheasternUnited States. In addition, the chemical and physical processes that control fine PM formation in regionswith substantial emissions of organics will be examined. Some of the hypotheses that will be examined are(a more complete list is given in the proposal):• Source profiles of PM in Southeastern Texas are substantially different than those in the Southeastern
U.S. east of the Mississippi River. Spatial gradients in fine PM concentrations and composition aregreater in the Houston area than in Atlanta and other southern cities. Maximum fine PM concentrationsare observed in the summer, when secondary PM generation peaks.
• Variations in fine PM concentration and composition on a 10-15 minute time scale are substantial andthis temporal variability will be related to variability in ozone concentrations.
• Rates of condensation of organics onto hydrophobic and hydrophilic PM are different, and thecondensation rates depend on the hydrophobic surface area available for condensation.
• Rates of PM growth are correlated with concentrations of semivolatiles, peroxides, and acid gases andgas/particle partitioning ratios for organics depend on the hydrophobic surface area available forcondensation.
Collaboration with investigators performing PM exposure and toxicology studies will allow the followinghypotheses related to health effects and exposure to be examined:• PM characteristics measured at ambient air quality sites can be different than ambient concentrations
outside of homes, and the relationship depends on the land cover surrounding the homes.• Source strengths for fine PM indoors and outdoors differ, and indoor penetration of PM in hot and
humid climates is a strong function of PM size.• Human alveolar macrophage response depends on source contributions and PM composition.Finally, methods testing, and evaluation of different methods of characterizing PM will be quantitativelyexamined in both the 6 week and 16 month programs.
Supplemental Keywords: air; fine particulate matter, measurement methods; EPA Region 6; Texas

GULF COAST AEROSOL RESEARCH AND CHARACTERIZATION PROGRAM
1. Map of Core and Peripheral PM monitoring sites.
A dot on a site indicates that the Federal Reference Method sampler for fine PM will be operated at the site. An S indicates that speciation measurements (trace metals, inorganic ions and organic/elemental carbon) will be made. The core sites are a privately operated site (HRM Site #3) near Clinton, Deer Park, and Aldine.
GULF COAST AEROSOL RESEARCH AND CHARACTERIZATION PROGRAM
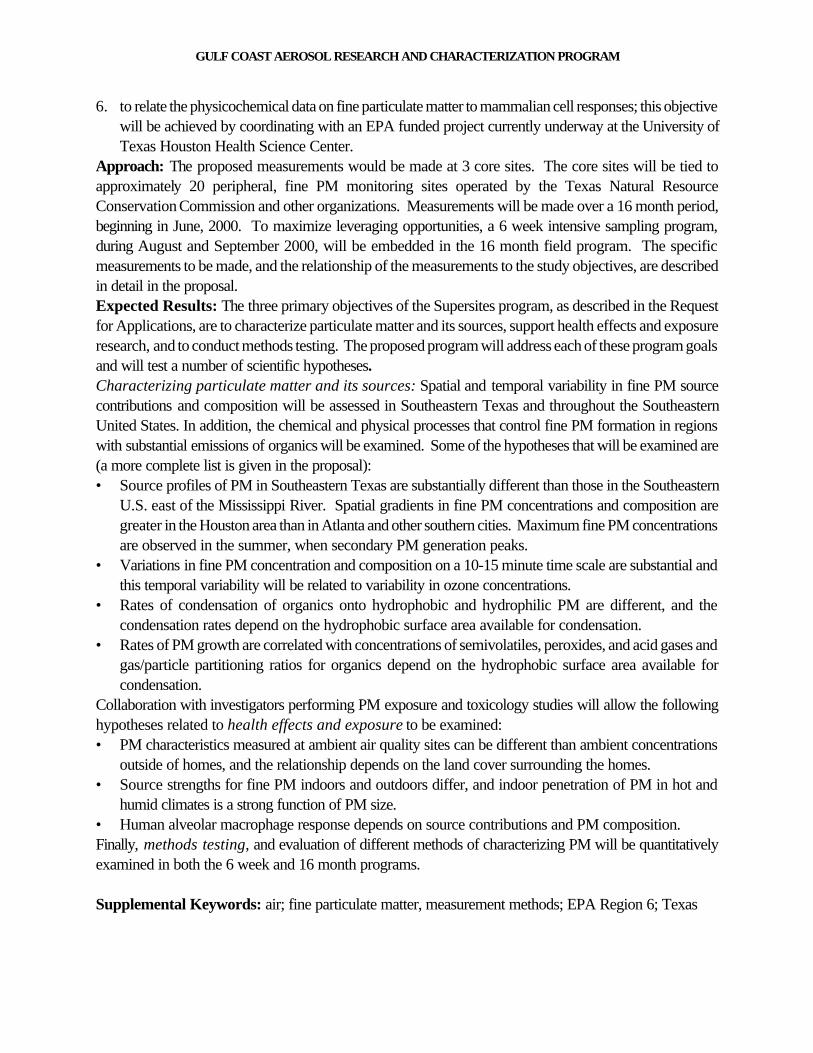
2a. MEASUREMENTS to be made at the core sites
Measurement Houston Regional
Monitoring (HRM)
Network Site 3
(downwind industrial)
Deer Park (upwind
industrial)
Aldine (downwind
urban)
PM
measurementsFederal Reference
Method (FRM)
Every sixth day PM10 and
PM 2.5 (HRM)
Every third day PM10 and
PM 2.5 (TNRCC)
Every third day PM10 and
PM 2.5 (TNRCC)Continuous PM Mass
(TEOM)
HRM TNRCC TNRCC
Inorganic ions Every third day at nearby
TNRCC site (TNRCC)
Every third day (TNRCC) Every third day (TNRCC)
OC/EC Every third day at nearby
TNRCC site (TNRCC)
Every third day (TNRCC) Every third day (TNRCC)
Trace metals Every third day at nearby
TNRCC site (TNRCC)
Every third day (TNRCC) Every third day (TNRCC)
Near real time sulfate HRM using Aerosol
Dynamics instrument
Aerosol Dynamics,
(ADI)-GCARCH
Aerosol Dynamics,
(ADI)-GCARCHNear real time nitrate ADI -GCARCH ADI-GCARCHNear real time
carbon
HRM ADI -GCARCH ADI –GCARCH
Molecular
characterization of
organic fractions
Selected dates from filter
samples collected every
third day (Rice-
GCARCH)
Selected dates from filter
samples collected every
third day (Rice-
GCARCH)
Selected dates from filter
samples collected every
third day (Rice-
GCARCH)Gas measurementsOzone, CO Continuous (HRM) Continuous (TNRCC) Continuous (TNRCC)NO, NOx Continuous (HRM) Continuous (TNRCC) Continuous (TNRCC)NOy Continuous (TNRCC) Continuous (TNRCC)Denuder HNO3 Third day (Rice-
GCARCH)
Third day (Rice-
GCARCH)
Third day (Rice-
GCARCH) Denuder NH3 Third day (Rice-
GCARCH)
Third day (Rice-
GCARCH)
Third day (Rice-
GCARCH)SO2 Continuous (HRM) Continuous (TNRCC) Continuous (TNRCC)

GULF COAST AEROSOL RESEARCH AND CHARACTERIZATION PROGRAM
PAMS hydrocarbons Auto-GC (HRM) Auto-GC (TNRCC) Canister (UT-GCARCH)Carbonyls On forecast (HRM) Third day (TNRCC) Third day (Rice-
GCARCH)Met. Data* HRM TNRCC TNRCC*Meteorological data includes wind speed, wind direction, relative humidity and solar radiation

GULF COAST AEROSOL RESEARCH AND CHARACTERIZATION PROGRAM
2b. METHODS to be used at the core sites
Measurement MethodPM measurements
1 Federal Reference Method (FRM) Standard Reference Method 2 Continuous PM Mass (TEOM)3 Inorganic ions EPA Speciation Network 4 OC/EC EPA Speciation Network5 Trace metals EPA Speciation Network6 Near real time sulfate Method of Stolzenburg & Hering (1998, 1999)7 Near real time nitrate Method of Stolzenburg & Hering (1998, 1999)8 Near real time carbon Method of Stolzenburg & Hering (1998, 1999)9 Molecular characterization of organic
fractionsGas chromatography/mass spectometry
Gas measurements10 Ozone, CO CAMS method 11 NO, NOx CAMS method12 NOy CAMS method13 Denuder HNO3 Ion chromatography14 Denuder NH3 Ion chromatography15 SO2 CAMS method16 PAMS hydrocarbons -Gas chromatographs (Auto-GC)
-Cryofocussed and analyzed by gas chromatography with flame ionization detection (US.EPA, 1989)-Canister sampling.
17 Carbonyls 2,4-dinitrophenyl-hydrazine (DNPH) samplingtechniques
18 Met. Data* CAMS method*Meteorological data includes wind speed, wind direction, relative humidity and solar radiation

GULF COAST AEROSOL RESEARCH AND CHARACTERIZATION PROGRAM
3a. Particulate Phase measurements to be performed at core sites during 6 week intensive
Measurement HRM Site #3(downwind industrial)
Deer Park /LaPorte(upwind industrial)
Aldine (downwindurban)
Particulate mattermeasurements
FRM Every sixth day PM10
and PM 2.5 (HRM),Daily at nearby TNRCCsite (TNRCC)
Every third day PM10
and PM 2.5 (TNRCC)Every third day PM10
and PM 2.5 (TNRCC)
Continuous PM Mass HRM TNRCC TNRCCInorganic ions Every third day at
nearby TNRCC site(TNRCC)
Every third day(TNRCC)
Every third day(TNRCC)
OC/EC Every third day atnearby TNRCC site(TNRCC)
Every third day(TNRCC)
Every third day(TNRCC)
Trace metals Every third day atnearby TNRCC site(TNRCC)
Every third day(TNRCC)
Every third day(TNRCC)
Near real time sulfate HRM using AerosolDynamics instrument,Texas Tech instrument
Aerosol Dynamics,(ADI)-GCARCH
Aerosol Dynamics,(ADI)-GCARCH
Near real time nitrate Texas Tech Instrument ADI -GCARCH ADI-GCARCHNear real time carbon HRM ADI -GCARCH ADI –GCARCHMolecular characterizationof organic fractions
Selected dates fromfilter samples collectedevery third day (Rice-GCARCH)
Selected dates fromfilter samples collectedevery third day (Rice-GCARCH)
Selected dates fromfilter samples collectedevery third day (Rice-GCARCH)
Size distributions GC-ARCH ADI -GCARCHSingle particle MS Univ. Del. (GC-ARCH)Organic compound classesof size resolved PM
Daily (UT-GCARCH)
Daily (UT-GCARCH)
Daily (UT-GCARCH)
Additional PMmeasurements, groundbased and aircraft
Year 2000 Field Study Year 2000 Field Study Year 2000 Field Study

GULF COAST AEROSOL RESEARCH AND CHARACTERIZATION PROGRAM
3b. Particulate phase Methods to be performed at core sites during 6-week intensive.
Measurement MethodParticulate matter measurements
1 FRM Standard Reference Method2 Continuous PM Mass3 Inorganic ions EPA speciation4 OC/EC EPA speciation5 Trace metals EPA speciation6 Near real time sulfate Method of Stolzenburg & Hering (1998,
1999)7 Near real time nitrate Method of Stolzenburg & Hering (1998,
1999)8 Near real time carbon Method of Stolzenburg & Hering (1998,
1999)9 Molecular characterization of organic
fractionsGas chromatography/mass spectometry
Size distributions DMA/CNC10 Single particle MS University of Delaware11 Organic compound classes of size
resolved PMLow Pressure Impactor/FTIR
12 Additional PM measurements, groundbased and aircraft
See attachments
GULF COAST AEROSOL RESEARCH AND CHARACTERIZATION PROGRAM
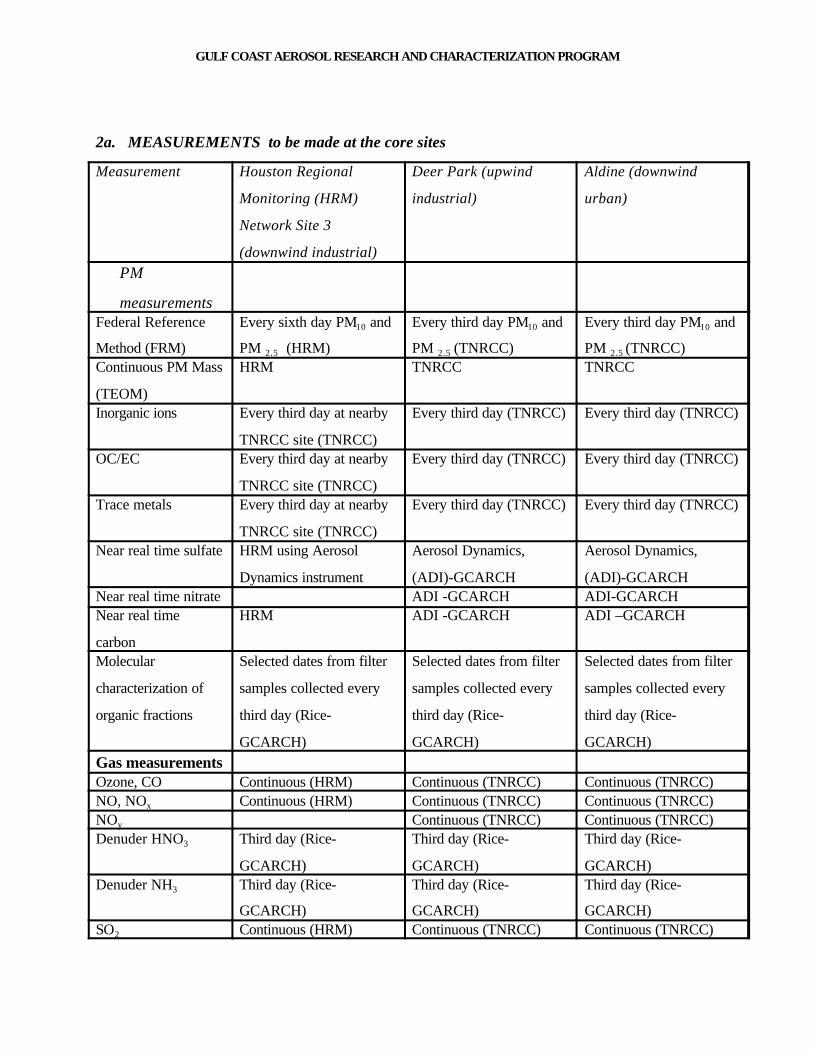
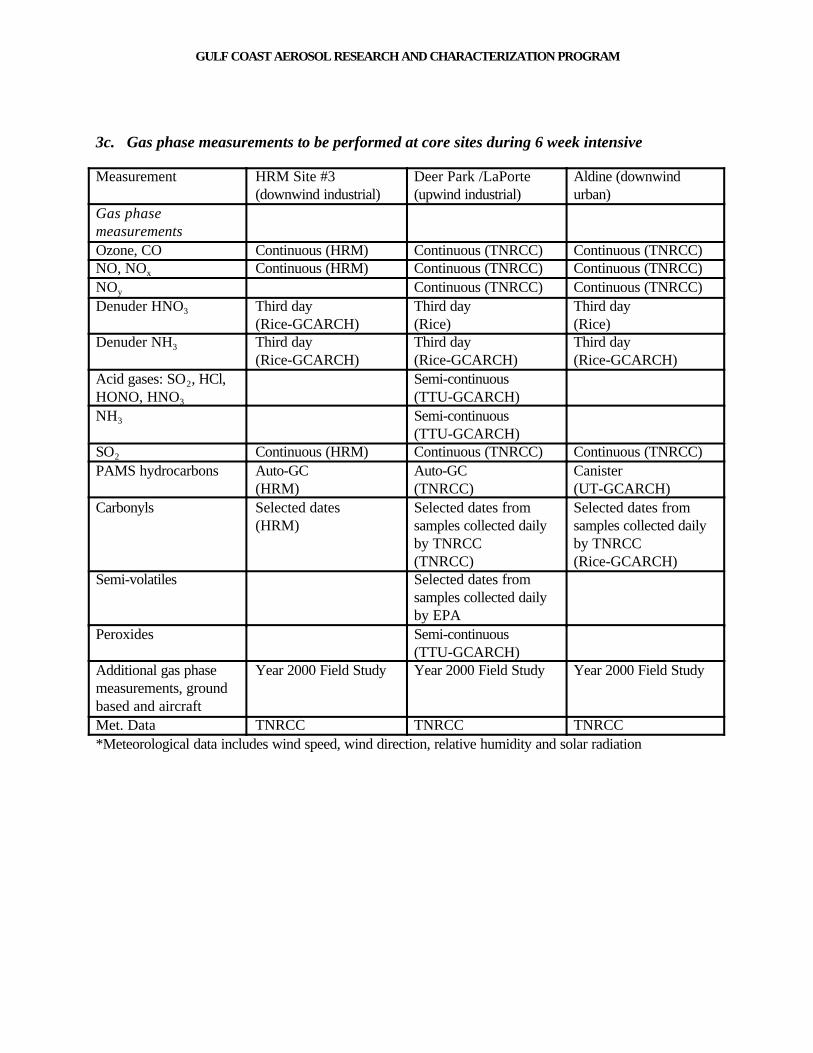
3c. Gas phase measurements to be performed at core sites during 6 week intensive
Measurement HRM Site #3(downwind industrial)
Deer Park /LaPorte(upwind industrial)
Aldine (downwindurban)
Gas phasemeasurementsOzone, CO Continuous (HRM) Continuous (TNRCC) Continuous (TNRCC)NO, NOx Continuous (HRM) Continuous (TNRCC) Continuous (TNRCC)NOy Continuous (TNRCC) Continuous (TNRCC)Denuder HNO3 Third day
(Rice-GCARCH)Third day(Rice)
Third day(Rice)
Denuder NH3 Third day(Rice-GCARCH)
Third day(Rice-GCARCH)
Third day(Rice-GCARCH)
Acid gases: SO2, HCl,HONO, HNO3
Semi-continuous(TTU-GCARCH)
NH3 Semi-continuous(TTU-GCARCH)
SO2 Continuous (HRM) Continuous (TNRCC) Continuous (TNRCC)PAMS hydrocarbons Auto-GC
(HRM)Auto-GC(TNRCC)
Canister(UT-GCARCH)
Carbonyls Selected dates (HRM)
Selected dates fromsamples collected dailyby TNRCC(TNRCC)
Selected dates fromsamples collected dailyby TNRCC(Rice-GCARCH)
Semi-volatiles Selected dates fromsamples collected dailyby EPA
Peroxides Semi-continuous(TTU-GCARCH)
Additional gas phasemeasurements, groundbased and aircraft
Year 2000 Field Study Year 2000 Field Study Year 2000 Field Study
Met. Data TNRCC TNRCC TNRCC*Meteorological data includes wind speed, wind direction, relative humidity and solar radiation

GULF COAST AEROSOL RESEARCH AND CHARACTERIZATION PROGRAM
3d. Gas phase methods to be used at the core sites during 6-week intensive
Measurement Method See Project DescriptionGas phase measurementsOzone, CONO, NOx
NOy
Denuder HNO3
Denuder NH3
Acid gases: SO2, HCl, HONO,HNO3
NH3
SO2
PAMS hydrocarbonsCarbonylsSemi-volatilesPeroxidesAdditional gas phasemeasurements, ground basedand aircraftMet. Data*Meteorological data includes wind speed, wind direction, relative humidity and solar radiation

GULF COAST AEROSOL RESEARCH AND CHARACTERIZATION PROGRAM
4. Data to be collected at peripheral sites (all data to be collected by the TNRCC)
Site FRM TEOM InorganicIons
Trace Metals OC/EC Met.Data*
Aldine Daily XBaytown Every sixth day XChannelview Daily X X X X XClinton Daily X X X X XClute Every sixth day XConroe Every third day X X X X XCrawford Every third day XCroquet Every sixth day XGalveston XKingwood X XLeague City Every third day XLiberty Every sixth day XMae Drive X X X X XMonroe Every sixth day XNessler Pool Every sixth day XSugarland Every sixth day XBeaumont X XCarroll St.
Park
X X
Fannett Every third day X X X X XMauriceville X X X X XOrange Every sixth day XPort Arthur Daily X*Meteorological data includes wind speed and wind direction at all sites and relative humidity and solar radiation at selected sites

C. ABSTRACT
C.1 Research Category and Sorting Code: Particulate Matter “Supersites”Program, 99-NCERQA-X1
C.2 Title: Southern California Particulate Matter Supersite (SCPMS)
C.3 Investigators: Principal Investigator - John R. Froines Ph.D., Professor,Environmental Health Sciences, UCLA. Co-Principal Investigators - William C.Hinds, Sc.D., Professor, Environmental Health Sciences, UCLA, ConstantinosSioutas, Sc.D., Assistant Professor, Environmental Engineering, University ofSouthern California. Other Investigators - California Institute of Technology:Glen R. Cass, Ph.D., Research Scientist, Environmental Engineering. UCLA:Arthur K. Cho, Ph.D., Professor Emeritus, Pharmacology, Sheldon K. Friedlander,Ph.D., Parsons Professor, Chemical Engineering, Antonio H. Miguel, Ph.D.,Principal Development Engineer, Institute of the Environment. University ofCalifornia, Riverside: Janet Arey, Ph.D., Professor, Environmental Sciences andEnvironmental Sciences and Environmental Toxicology. University of SouthernCalifornia: Edward L. Avol, Associate Professor, Occupational and Environmental Health.
C.4 Institutions: University of California, Los Angeles (Los Angeles, CA) – leadcampus, California Institute of Technology (Pasadena, CA), University of California,Riverside (Riverside, CA), University of Southern California (Los Angeles, CA).
C.5 Project Period: January 1, 2000 – December 31, 2004
C.6 Project Cost: $3,499,908
C.7 Project Summary:The overall objective of the Southern California Particle Matter Supersite
(SCPMS) is to conduct research and monitoring that contributes to a betterunderstanding of the measurement, sources, size distribution chemical compositionand physical state, spatial and temporal variability and health effects of suspendedparticulate matter (PM) in the Los Angeles Basin (LAB). The research objectives ofthe Southern California Particulate Matter Supersite are:1. To characterize PM, its constituents and precursors, to better understand sources
and transport affecting human exposure and to support development of StateImplementation Plans (SIPs).
2. To obtain atmospheric measurements to support health studies designed toaddress causal factors; etiologic pathways and mechanisms of PM relatedmorbidity and mortality with particular emphasis on PM source-receptor-exposure-effects pathways.

Abstract
2
3. To conduct methods testing that will enable comparisons and evaluation ofdifferent technologies for characterizing PM including evaluation of newinstrumentation, sampling methods and federal reference methods.The LAB is home to more than 15 million individuals and it has been described
as the most polluted airshed in the nation, with a complex, persistent and uniqueairborne particulate matter. Despite considerable improvements in air quality overthe past two decades, Los Angeles continues to exhibit the most severe ozone and PMair quality problem in the U.S. Los Angeles should be studied as a region by itselfbecause it epitomizes a noticeable and yet distinct fine particle air quality problem interms of particle composition, source mix, and meteorology. These factors representimportant considerations for Supersite location and they indicate that SouthernCalifornia is a particularly important environment and opportunity for additionalstudies. The proposed SCPMS activities will be integrated with the multidisciplinaryresearch in exposure assessment, toxicology, and epidemiology of the recently fundedby the EPA STAR Southern California Center for Airborne Particulate Matter(SCCAPM). The SCPMS will interact with the California Air Resources Board(ARB) and the South Coast Air Quality Management District (SCAQMD) tomaximize the use and value of the data collected by the SCPMS and the State andLocal Agencies on PM. The monitoring activities of the SCPMS will be also linkedwith toxicology studies in the LAB using a mobile PM concentrator facility toinvestigate health effects associated with exposures to ultrafine, fine and coarseparticles. These studies are funded by the SCCAPM, the Health Effects Institute(HEI), the ARB and the National Institute of Environmental Health Sciences(NIEHS). The SCPMS will therefore become an invaluable resource to the majorongoing and planned PM health and modeling studies in the LAB.
Specific projects in the category of PM Characterization provide the informationthat is needed to understand the relationship between PM sources and receptors, aswell as providing insight into the factors that affect the spatial and temporalvariability of PM characteristics. These projects are: 1) Comprehensivecharacterization of Particulate Matter in the LAB and correlations between particlesize distribution, chemical composition and gaseous co-pollutants; 2) Determinationof the occurrence, frequency and prevalence of PM2.5 sub-modes in different locationsof the LAB; 3) Systematic evaluation of sampling artifacts of the Federal RegisterMethod (FRM) in measuring PM2.5, PM10 and Coarse PM concentrations; 4) Study ofPM formation and growth mechanisms in different locations of the LAB; 5) Testing ofthe hypothesis of that 2.5 µm represents a clear cutpoint between coarse and fine PMand does not depend on location or season; 6) Determination of the seasonal andspatial variation of ultrafine, accumulation and coarse PM in the LAB and theirrelation to sources. These studies will be conducted in collaboration with AQMD andARB; 7) Comparison between the true PM2.5, PM10 and coarse PM concentrationswith those determined gravimetrically with a FRM and evaluate sampling artifactsrelated to the loss of volatile or semi-volatile PM compounds.
Abstract
3
Projects in the category of Support of Health Effects and Exposure Research are:1) Detailed physico-chemical characterization of concentrated PM used in ongoingtoxicity studies currently under way in the LAB; 2) Measurement of within-community PM variability for improved dispersion models describing personalexposure indices based on traffic-based emissions for use in ongoing epidemiologicalinvestigations of chronic respiratory health effects of ambient particle matter inchildren; 3) Measurement of the size distribution as well as the spatial and seasonalvariation of particle bound PAH, oxy-PAH, nitro-PAH, quinones and other polarPAHs in the LAB; 4) Determination of the contribution of volatile and semi-volatilespecies to Total Suspended PM2.5 mass and assess any resulting bias in interpretingepidemiological results; 5) Measurement of aerosol oxidant partitioning in theultrafine, accumulation and coarse PM modes; 6) Analysis of particle-bound PAHand related compounds as a function of distance from freeways; Measurement ofprotein, allergens and other biological constituents of urban airborne particulatematter.
Projects in the category of Methods Testing are: 1) Comparison between theactual 24-hour averaged PM10 and PM2.5 concentrations with those determined usingcontinuous PM mass monitors, including the Scanning Mobility Particle Sizer(SMPS), Aerodynamic Particle Sizer (APS), Tapered Element OscillatingMicrobalance (TEOM), Continuous Ambient Mass Monitor (CAMM) and the Real-Time Ambient Monitor (RAM); 2) Comparison between the real-time sizedistribution and mass concentration determined with the SMPS and APS with the24-hour averaged mass-based size distribution measured with the MicroorificeUniform Deposit Impactor; 3) Development of a semi-continuous monitor for size-dependent nitrate, carbon and sulfate measurement; 4) Evaluation and comparisonof new and emerging measurement methods for single-particle analysis.
Intensive aerosol measurements that collect PM data beyond the traditionalPM2.5 mass, sulfate and nitrate concentrations will be conducted 5 discrete areas ofthe Los Angeles Basin. These areas will be chosen to provide a wide geographicalcoverage, and thus to be as representative as possible of human exposures to thesepollutants. A mobile Particle Instrumentation Unit (PIU), funded separately by theSCCAPM, will be deployed to these locations to conduct PM measurements. Sampling in each site will last for 6 months and measurements will be repeated on a2.5-year cycle. During the first of the 6 months, the PIU will be deployed to 5discrete locations downwind and one location upwind to a freeway close to the centralsite to determine PM characteristics as a function of freeways distance. A number ofexisting PM sites operated by AQMD will be used as satellite sites, in addition to the5 SCPMS sites, to obtain spatial PM variability in the LAB as a function of size andcomposition.
C.8 Supplemental Keywords: airborne particulate matter, size distribution,PAH, within-community variability, freeways, measurement artifact, diesel exhaust,fine, ultrafine and coarse particulate matter, mobile sources, PM2.5

Abstract
4
______________________________________________________________________________________________________
Selected Supersite Sampling Locations

Abstract
5
Equipment for Particle Instrumentation Unit
Monitor PM PropertyAveragingTime
SamplingFrequency
PM MeasurementsScanning Mobility Particle Sizer(SMPS 3934, TSI Inc.)
Particle number, surface andvolume distribution (size range:0.01–0.7 µm).
15-min Daily
Aerodynamic Particle Sizer (APS3310, TSI Inc.)
Particle number, surface andvolume size distribution (size range:0.5–20 µm).
15-min Daily
PM10 and PM2.5 Tapered ElementOscillating Microbalance (TEOMModel 1400, R&P, Inc.)
Continuous measurement of thenon-volatile component ofambient PM2.5 and PM10.
1-hr Daily
PM2.5 Continuous Ambient MassMonitor (CAMM; Babich et al,1999)
continuous PM10 and PM2.5particulate mass concentrationsfrom the pressure drop acrossporous membrane filters
1-hr Daily
Continuous nitrate, sulfate andcarbon monitor (ADI/R&P)
Size-segregated measurement ofPM10 carbon, nitrate and sulfatecontent
1-hr Daily
Real-Time Ambient Mass (RAM)Monitor (DataRAM, Mie Inc.)
Near-continuous massconcentrations of PM10 and PM2.5.
1-hr Daily
Micro-Orifice Uniform DepositImpactor (MOUDI, MSP Corp.)
Size-fractionated PM10 mass,sulfate, nitrate
4-to-8 hr 6th day
MOUDI Size-fractionated PM10 metals andelements
4-to-8 hr 6th day
MOUDI Size-fractionated PM10 PAH,nitro-PAH
24-to-72 hr 6th day
MOUDI Size-fractionated PM10 EC/OC 24-hour 6th dayHigh-Volume Particle Size Classifier(HVPSC)
Size-fractionated PM10 PAH,nitro-PAH
24-hour 6th day
PM10 and PM2.5 FRM (AndersenSamplers)
PM10 and PM2.5 mass, nitrate,sulfate concentrations
24-hour 6th day
PM10 and PM2.5 FRM PM10 and PM2.5 EC and OCconcentrations
24-hour 6th day
PM10 and PM2.5 HoneycombDenuders Samplers (HDS)
PM10 and PM2.5 nitrateconcentration
24-hour 6th day
PM10 and PM2.5 Multi-channelDenuder Sampler (MDS, Eatough etal, 1993)
PM10 and PM2.5 artifact-freeEC/OC concentrations
24-hour 6th day
PM10 Time-of-Flight MassSpectrometer
PM10 individual particle chemicalcomposition
15 min, 1, 4,12 and 24 hr
Daily onepisodes,Riversideonly
Hering Low-Pressure Impactor(LPI, Hering and Friedlander, 1978)
Size distribution of particle-boundreactive oxidants and PM surfaceanalysis
15 min, 1, 4,12 and 24 hr
Selectedsamplingdays
Gaseous Pollutant MonitorsContinuous ChemiluminescenceAnalyzer (Monitor Labs Model
Nitrogen Dioxide 15 min, 1, 4,12 and 24 hr
Daily

Abstract
6
8840)Thermo Environmental Inc. Model48C trace level
Carbon Monoxide 15 min, 1, 4,12 and 24 hr
Daily
UV photometer (Dasibi Model 1003AH)
Ozone 15 min, 1, 4,12 and 24 hr
Daily
Continuous Ammonia Monitor(Thermo Env Inc. model 17C)
Ammonia 15 min, 1, 4,12 and 24 hr
Daily
NMHC Thermo Environmental Inc.,Model 55
Non-methane Hydrocarbons hourly Daily
MeteorologyVaisala Model MP113Y Temperature and Relative
Humidity15 min, 1, 4,12 and 24 hr
Daily
Met One High-Sensitivity Windvane
Wind direction 15 min, 1, 4,12 and 24 hr
Daily
Met One High SensitivityAnemometer
Wind velocity 15 min, 1, 4,12 and 24 hr
Daily
______________________________________________________________________________________________________________

Abstract
7
Proposed Timetable
Activity/Task Year1
Year2
Year3
Year4
Year5
Program Plan ---PIU installation at UCLA --Development of new technologies instruments(HVPSC, CNSCM)
-------
PIU installation and operation in Mira Loma/Rubidoux ----- --- ----
PIU installation and operation at Downey ---- ----PIU installation and operation in San Dimas/Azusa ---- ----PIU installation and operation in LongBeach/Anaheim
---- ---
Chemical analysis ----- ------- ------- ------- -------Data validation and interpretation ---- ------- ------- ------- -------

i
ABSTRACTParticulate Matter "Supersites" Program - U.S. Environmental Protection Agency
A joint solicitation of EPA's Office of Air and Radiation and Office of Research & DevelopmentSorting Code: 99-NCERQA-X1
PM2.5 Technology Assessment and Characterization Study in New York (PMTACS-NY)
Principal Invesigator: Kenneth L. Demerjian ASRC, University at AlbanyG. Lala, J. Schwab, V. Mohnen, and U. Roychowdhury, ASRC, University at Albany
P. Galvin, R. Gibbs, D. Felton and T. Lanni, New York State DECC. Kolb, M. Zanhiser, Aerodyne Research, Inc.
S. Herring, Aerosol Dynamics, Inc.L. Newman, Brookhaven National Laboratories
P, Hopke, Clarkson UniversityW. Brune, Penn State University
L. Husain, N. Kim, X. Zhou, NYS Department of HealthJ. Zamurs, NYS Department of Transportation
H. Patashnick, Rupprecht and Patashnick Co., Inc.
Project Period: Feburary 1, 2000 – December 1, 2004
Project Cost: Total Project Cost $7,512,689; Total Request to EPA $ 3,499,826.
Project Summary: The PMTACS-NY is designed to address a series of science policy relevantquestions related to hypotheses to be tested using measurement data collected under the program.
Objective I. Measure the temporal and spatial distribution of the PM2.5/co-Pollutant complexincluding: SO2, CO, VOCs/Air Toxics, NO, NO2, O3, NOy, H2CO, HNO3, NH3, HONO, PM2.5(mass, SO4
=, NO3-, OC, EC, Trace Elements), single particle aerosol composition, CN, OH and
HO2 to support regulatory requirements to develop cost effective mitigation strategies PM2.5 andits co-pollutants and to establish trends in the relevant precursor concentrations to assess theimpact of recent and future emission reductions in terms of emission control effectiveness and airquality response.
Objective II. Monitor the effectiveness of new emission control technologies [i.e. CompressedNatural Gas (CNG) bus deployment and Continuously Regenerating Technology (CRT)]introduced in New York City and its impact on ambient air quality, thorough remote open pathroadside, mobile platform, and fixed site measurements of CO2, CO, NO, H2CO, HONO, CNand aerosol chemical composition.
Objective III. Test and evaluate new measurement technologies and provide tech-transfer ofdemonstrated operationally robust technologies for network operation in support of thedevelopment of process science and observation based analysis tools and health based exposureassessments.

ii
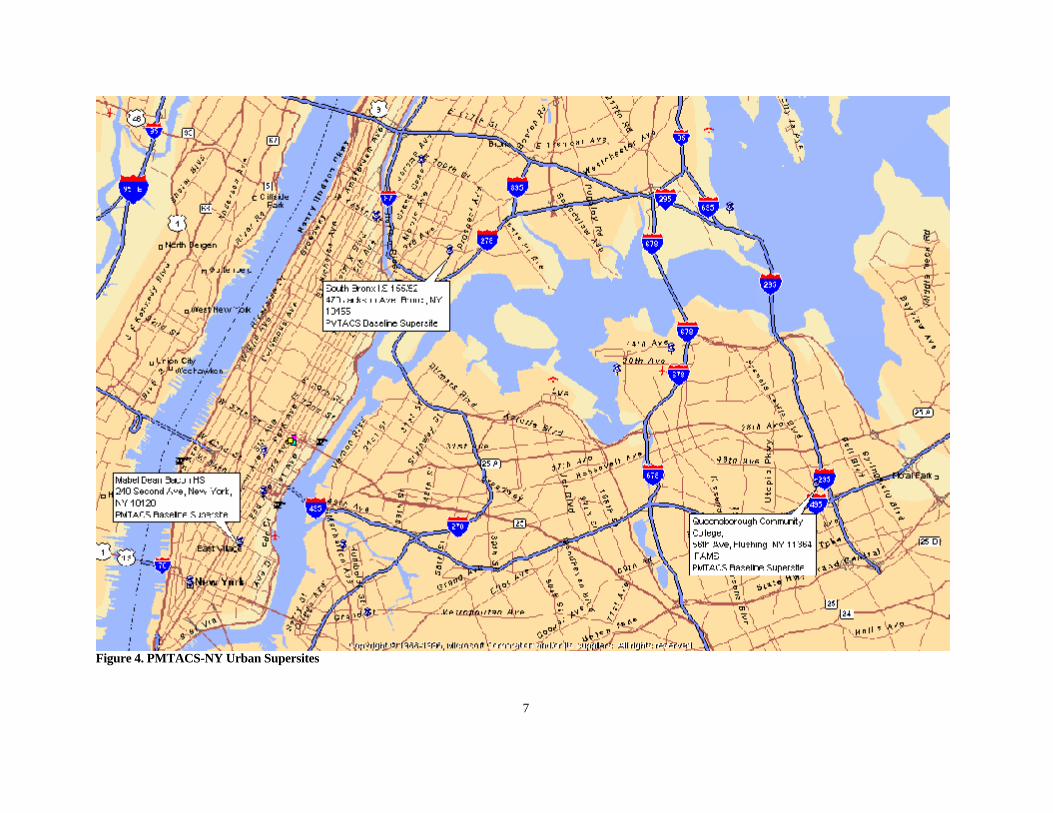
Approach: Comprehensive measurement of PM2.5 mass, chemical speciation and gaseousprecursors will be collected at six monitoring sites located in the New York City and at regionalrepresentative locations in upstate NY and operate through out the entire 5 year monitoringprogram. These sites include two regional research monitoring sites, Whiteface Mountain(Wilmington, NY) operational since 1973 and Pinnacle State Park (Addison, NY) operationalsince 1995 and three urban monitoring sites (NYS DEC SLAMS/PAMS sites), Mable DeanBacon (Manhattan, NY), Intermediate School I.S. 155 (South Bronx, NY) and QueensboroughCommunity College (Queens, NY). Standard routine measurements of criteria pollutants and themandated PM2.5 mass and chemical speciation measurements, will be supplemented withadvance instrumentation providing complimentary chemical and temporal specificity. The highlyrelevant measurements provided over the course of the program, fill a substantial data needassociated with the characterization of the chemical composition of PM2.5 within New YorkCity and the transport-impacted regional background of upstate NY.
Special intensive studies: In addition to the PMTACS, PM2.5 Supersite measurement network,two special intensive field studies will be carried out, the first in the summer of 2001 and thesecond in the winter of 2003. Both studies will be deployed from a host site that will likely beone of the urban measurement sites. The 4-6 weeks intensive studies will engage several researchgroups performing research grade measurements using emerging measurement technologies. Themeasurements will provide detailed real-time chemical and physical characterization of thePM/co-pollutant complex to 1) help elucidate the operative gas-to-particle transformationprocesses occurring in urban centers; 2) enhance the chemical source signature data base insupport of source attribution studies; and 3) intercompare emerging technologies and evaluatetheir performance and in comparison with the operational routine measurement systems.
The CEPEX (CNG/CRT Emission Perturbation Experiments) performed as part of the specialintensives, is designed to monitor on-road vehicle emissions of the CNG/CRT modified busesand traditional diesel-fueled buses being replaced, using open-path roadside remote sensing anda mobile measurement platform. In addition, the fixed-site supersite monitors will be used todiscern changes in ambient air quality as a result of the implemented control technologies.
New PM2.5 instrumentation data will be used to evaluate/compare EPA FRM filter-basedmeasurements and explore sources of error in the various approaches. The detailed data set ofchemical and physical measurements of the PM2.5/co-pollutant complex in urban and regionalenvironments will provide direct insights into the formation mechanisms for the PM2.5/co-pollutant complex and the controlling factors (chemical precursor, meteorological, and sourceattribution factors) that influence its production in the atmosphere. The suite of gaseous andchemical particulate measurements can be used to track, through direct observation, changes inprecursor concentrations in response to implemented control programs, thereby supporting theconcept of “Accountability in Air Quality Management Systems ”. These data will also be used bythe health and regulatory communities in support of exposure assessments and the developmentof mitigation strategies.
Supplemental Keywords: ambient air, atmosphere, ozone, particulates, metals, nitrogen oxides,sulfates, organics, atmospheric chemistry, monitoring, measurement methods, Northeast.
1
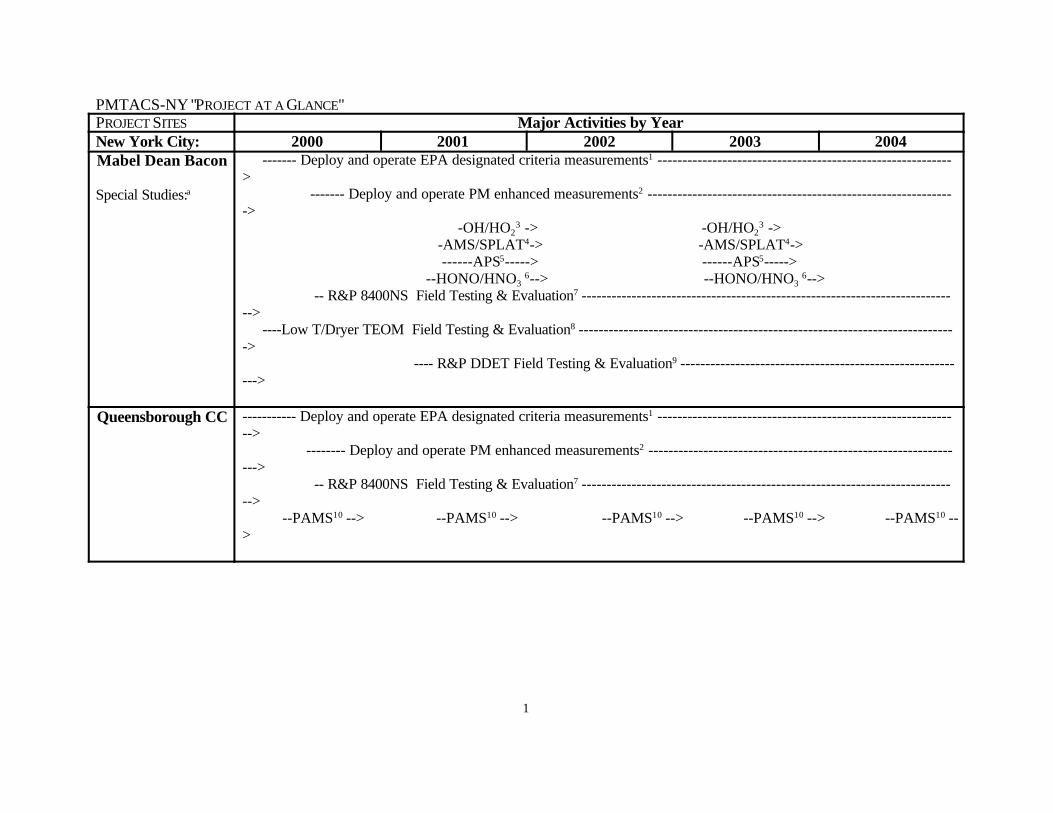
PMTACS-NY "PROJECT AT A GLANCE"PROJECT SITES Major Activities by YearNew York City: 2000 2001 2002 2003 2004Mabel Dean Bacon
Special Studies:a
------- Deploy and operate EPA designated criteria measurements1 -----------------------------------------------------------> ------- Deploy and operate PM enhanced measurements2 --------------------------------------------------------------> -OH/HO2
3 -> -OH/HO23 ->
-AMS/SPLAT4-> -AMS/SPLAT4-> ------APS5-----> ------APS5-----> --HONO/HNO3
6--> --HONO/HNO3 6-->
-- R&P 8400NS Field Testing & Evaluation7 ----------------------------------------------------------------------------> ----Low T/Dryer TEOM Field Testing & Evaluation8 ----------------------------------------------------------------------------> ---- R&P DDET Field Testing & Evaluation9 ---------------------------------------------------------->
Queensborough CC ----------- Deploy and operate EPA designated criteria measurements1 -------------------------------------------------------------> -------- Deploy and operate PM enhanced measurements2 ----------------------------------------------------------------> -- R&P 8400NS Field Testing & Evaluation7 ----------------------------------------------------------------------------> --PAMS10 --> --PAMS10 --> --PAMS10 --> --PAMS10 --> --PAMS10 -->

2
South Bronx ----------- Deploy and operate EPA designated criteria measurements1 -------------------------------------------------------------> -------- Deploy and operate PM enhanced measurements2 ---------------------------------------------------------------->
-- R&P 8400NS Field Testing & Evaluation7 ---------------------------------------------------------------------------->
CEPEX-NYC
SpecialStudies:
-Mobile Meas.11-> -Mobile Meas.11-> -Mobile Meas.11-> -Open Path 12---> -Open Path 12---> -Open Path 12--->
Upstate/Regional:
2000 2001 2002 2003 2004
PinnacleStatePark
SpecialStudies:
----------- Deploy and operate research grade baseline measurements3 -------------------------------------------------------------> -------- Deploy and operate PM enhanced measurements4 ---------------------------------------------------------------> -- R&P 8400NS Field Testing & Evaluation7 ----------------------------------------------------------------------------> ----Low T/Dryer TEOM Field Testing & Evaluation8 ----------------------------------------------------------------------------> ---- R&P DDET Field Testing & Evaluation9 ---------------------------------------------------------->
3
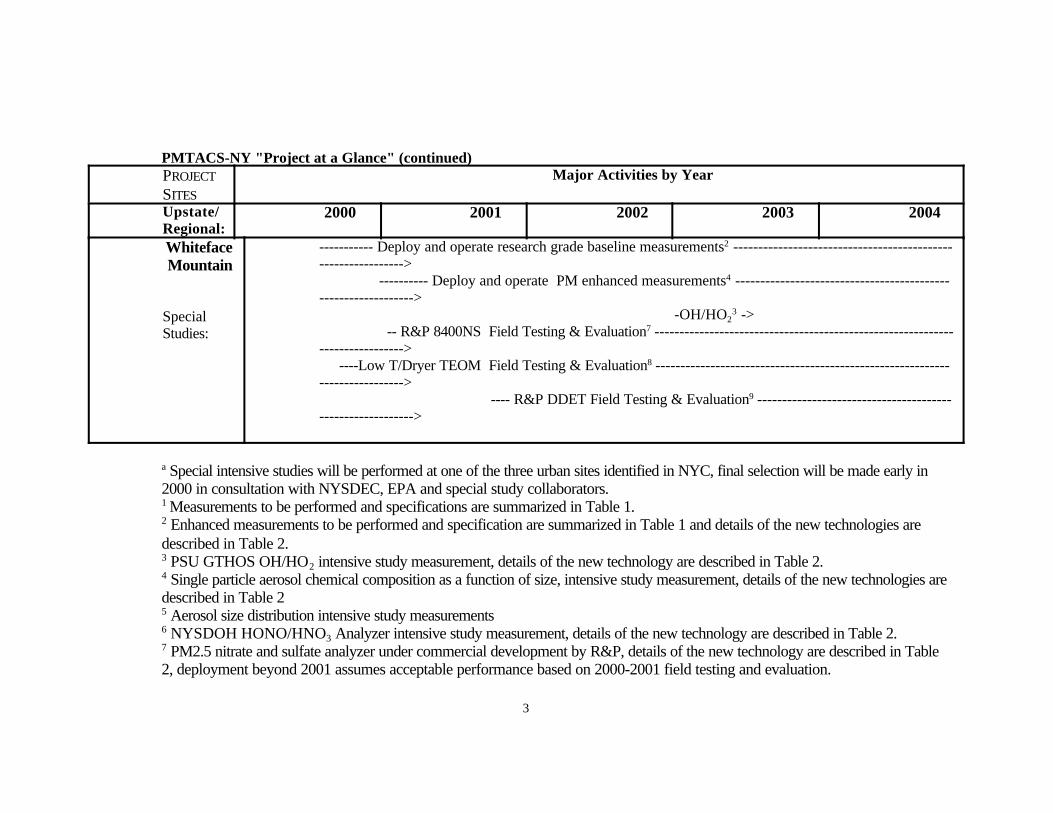
PMTACS-NY "Project at a Glance" (continued)PROJECTSITES
Major Activities by Year
Upstate/Regional:
2000 2001 2002 2003 2004
WhitefaceMountain
SpecialStudies:
----------- Deploy and operate research grade baseline measurements2 -------------------------------------------------------------> ---------- Deploy and operate PM enhanced measurements4 --------------------------------------------------------------> -OH/HO2
3 -> -- R&P 8400NS Field Testing & Evaluation7 -----------------------------------------------------------------------------> ----Low T/Dryer TEOM Field Testing & Evaluation8 ----------------------------------------------------------------------------> ---- R&P DDET Field Testing & Evaluation9 ---------------------------------------------------------->
a Special intensive studies will be performed at one of the three urban sites identified in NYC, final selection will be made early in2000 in consultation with NYSDEC, EPA and special study collaborators.1 Measurements to be performed and specifications are summarized in Table 1.2 Enhanced measurements to be performed and specification are summarized in Table 1 and details of the new technologies aredescribed in Table 2. 3 PSU GTHOS OH/HO2 intensive study measurement, details of the new technology are described in Table 2.4 Single particle aerosol chemical composition as a function of size, intensive study measurement, details of the new technologies aredescribed in Table 25 Aerosol size distribution intensive study measurements 6 NYSDOH HONO/HNO3 Analyzer intensive study measurement, details of the new technology are described in Table 2.7 PM2.5 nitrate and sulfate analyzer under commercial development by R&P, details of the new technology are described in Table2, deployment beyond 2001 assumes acceptable performance based on 2000-2001 field testing and evaluation.
4
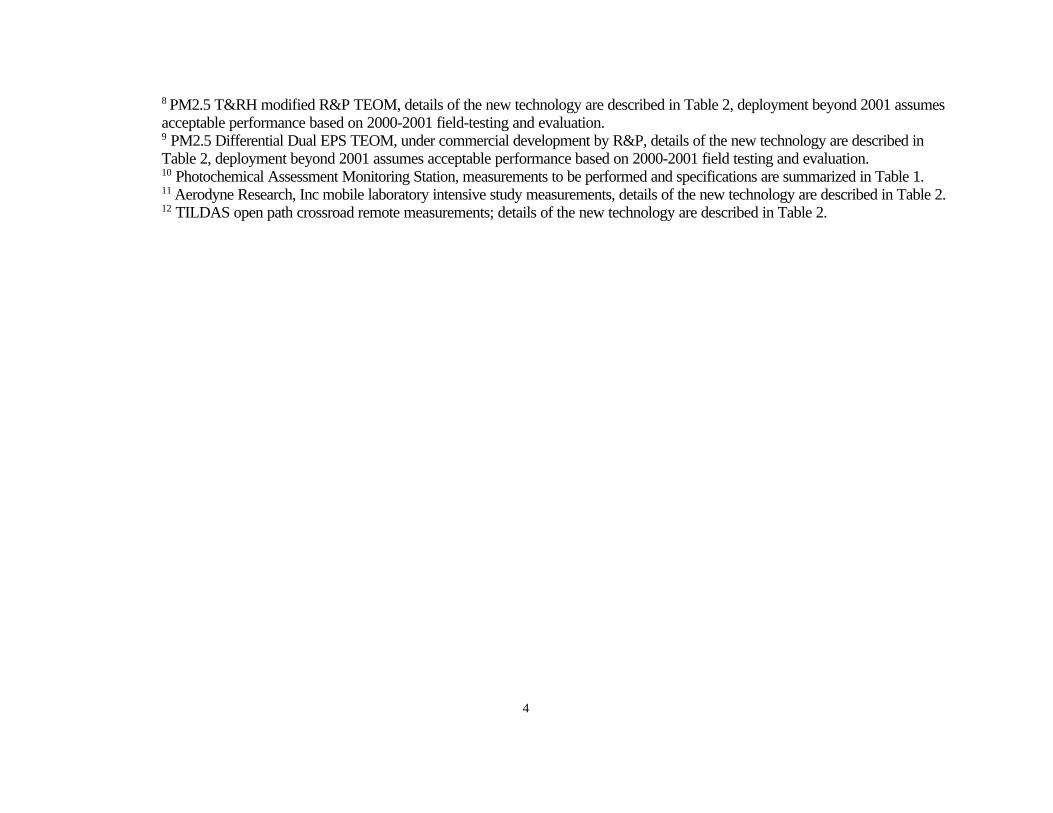
8 PM2.5 T&RH modified R&P TEOM, details of the new technology are described in Table 2, deployment beyond 2001 assumes
acceptable performance based on 2000-2001 field-testing and evaluation.9 PM2.5 Differential Dual EPS TEOM, under commercial development by R&P, details of the new technology are described inTable 2, deployment beyond 2001 assumes acceptable performance based on 2000-2001 field testing and evaluation.10 Photochemical Assessment Monitoring Station, measurements to be performed and specifications are summarized in Table 1.11 Aerodyne Research, Inc mobile laboratory intensive study measurements, details of the new technology are described in Table 2.12 TILDAS open path crossroad remote measurements; details of the new technology are described in Table 2.

5

6
Figure 3. PMTACS-NY Supersite Network
7
Figure 4. PMTACS-NY Urban Supersites

8
TABLE 1. PMTACS-NY Sites, Measurement Parameters And SpecificationsParameter/Method Sites* Operator** Period Averaging Frequency
PM Filter Mass and ChemistryPM2.5 mass, sulfate, nitrate /IonChromatograph
WFML DEC, ASRC April 1, 2000 -December 1, 2004
24-hr daily
PM2.5 (Chemical Species Measurements, asoutlined in EPA, 1999)
QCC DEC AnalyticalLab (to bedecided)
April 1, 2000 –December 1, 2004
24-hr 3rd day
PM10 mass, sulfate, nitrate /Ion Chrom WFML, MDB, SB DEC, ASRC April 1, 2000 –December 1, 2004
24-hr 6th day
PM2.5 mass (FRM-R&P Partisol Sampler) PSP, WFML,MDB, SB, QCC
DEC, ASRC April 1, 2000 –December 1, 2004
24-hr daily
PM2.5 metals Mg, Al, K, Ca, V, Cr, Mn, Ni,Fe, Zn, As, Se, Cd, Sb, Hg, and Pb /ICP/AES, ICP/MS, & neutron activation
PSP, MDB, SB,QCC, NNJ
DEC, ASRC,DOH
July 1, 2000 –June 30, 2001 24-hr daily
PM2.5 SO4=, NO3
-, NO2-, Cl-, Br- /Ion
Chromatograph PSP, MDB, SB,QCC, NNJ
DEC, ASRC,DOH
July 1, 2000 –June 30, 2001
24-hr daily
PM2.5 metals Mg, Al, K, Ca, V, Cr, Mn, Ni,Fe, Zn, As, Se, Cd, Sb, Hg, and Pb/ XRF
PSP, MDB, SB,QCC, NNJ
DEC, ASRC July 1, 2001 –December 1, 2003
24-hr 6th day
PM2.5 SO4=, NO3
-, NO2-, Cl-, Br- /Ion
Chromatograph PSP, MDB, SB,QCC, NNJ
DEC, ASRC July 1, 2001 –December 1, 2003
24-hr 6th day
PM2.5 metals Mg, Al, K, Ca, V, Cr, Mn, Ni,Fe, Zn, As, Se, Cd, Sb, Hg, and Pb /ICP/AES, ICP/MS, & neutron activation
PSP, MDB, SB,QCC, NNJ
DEC, ASRC,NYSDOH
Intensive: 4 weeks ea. Summer 2001Winter 2003
6-hr daily
PM2.5 SO4=, NO3
-, NO2-, Cl-, Br- /Ion
Chromatograph PSP, MDB, SB,QCC, NNJ
DEC, ASRC,DOH
Intensive: 4 weeks ea. Summer 2001Winter 2003
6-hr daily
PM10/PM2.5 Particle Concentrator (R&PChemTox Model 2400)
PSP MDB or SB
DEC, ASRC Seasonal year 2000Seasonal 2001-2003
variable variable

9
Table 1. PMTACS-NY Sites, Measurement Parameters and Specifications (continued)Continuous PM Mass and ChemistryPM2.5 mass (heated R&P TEOM 1400AB) PSP, WFML,
MDB, SB, QCCDEC,ASRC June 1, 2000 –
December 1, 200410-min daily
PM10 mass (heated R&P TEOM 1400AB) MDB, SB DEC,ASRC 10-min dailyPM2.5 mass (T/RH modified R&P TEOM1400AB)
PSP, WFML,MDB
DEC,ASRC June 1, 2000 –May 31, 2003
10-min daily
PM2.5 mass (Differential ESP R&P TEOM)
PSP, MDB ASRC June 1, 2001 –December 31, 2004
5-min daily
PM2.5 nitrate and sulfate (R&P flashvolatilization 8400NS)
PSP, WFML,MDB, SB, QCC
DEC,ASRC (3) June 1, 2000 -(2) June 1, 2001 – December 1, 2004
10-min daily
PM2.5 Organic and elemental carbon (R&P5400)
PSP, WFML,MDB, SB, QCC
DEC,ASRC June 1, 2001 –December 1, 2004
1-hr daily
Single particle chemical speciation(Aerodyne, Inc Aerosol Mass Spectrometer[AMS])
MDB/QCC ASRCIntensive: 4 weeksea. Summer 2001Winter 2003
TBD TBD
Single particle chemical speciation(BNL Single Particle Laser Ablation Timeof Flight Mass Spectrometer [SPLAT-MS])
MDB/QCC BNLIntensive: 4 weeksea. Summer 2001Winter 2003
TBD TBD
Gases NO - TECO 42s PSP, WFMS,
MDB, SB, QCCDEC,ASRC April 1, 2000 –
December 1, 20045-min daily
NO2-photolytic titration modified TECO42s
PSP, WFMS,MDB, SB, QCC
DEC,ASRC June 1, 2000 –December 1, 2004
5-min daily
NOy Moly. Modified TECO 42s PSP, WFMS,MDB, SB, QCC
DEC,ASRC June 1, 2000 –December 1, 2004
5-min daily
SO2 TECO 43b PSP, WFMS,MDB, SB, QCC
DEC,ASRC April 1, 2000 –December 1, 2004
5-min daily
O3 TECO PSP, WFML,MDB, SB, QCC
DEC,ASRC April 1, 2000 –December 1, 2004
5-min daily
10
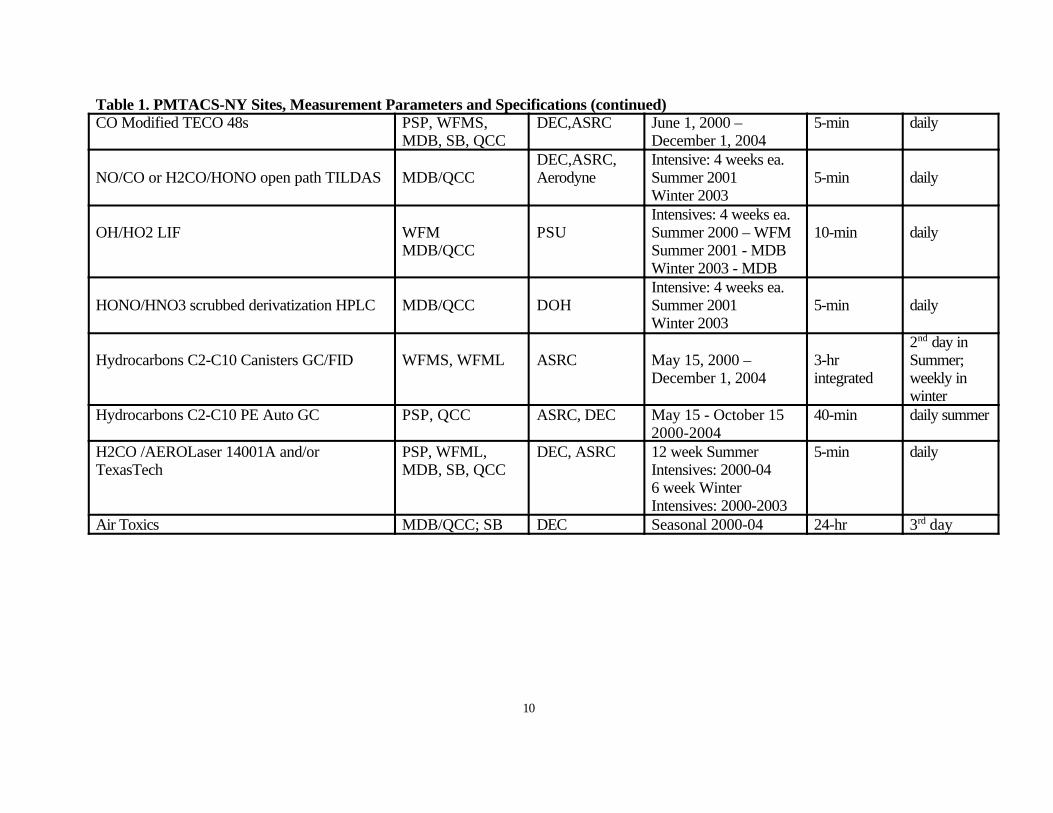
Table 1. PMTACS-NY Sites, Measurement Parameters and Specifications (continued)CO Modified TECO 48s PSP, WFMS,
MDB, SB, QCCDEC,ASRC June 1, 2000 –
December 1, 20045-min daily
NO/CO or H2CO/HONO open path TILDAS MDB/QCCDEC,ASRC,Aerodyne
Intensive: 4 weeks ea. Summer 2001Winter 2003
5-min daily
OH/HO2 LIF WFMMDB/QCC
PSUIntensives: 4 weeks ea.Summer 2000 – WFM Summer 2001 - MDBWinter 2003 - MDB
10-min daily
HONO/HNO3 scrubbed derivatization HPLC MDB/QCC DOHIntensive: 4 weeks ea. Summer 2001Winter 2003
5-min daily
Hydrocarbons C2-C10 Canisters GC/FID WFMS, WFML ASRC May 15, 2000 –December 1, 2004
3-hrintegrated
2nd day inSummer;weekly inwinter
Hydrocarbons C2-C10 PE Auto GC PSP, QCC ASRC, DEC May 15 - October 152000-2004
40-min daily summer
H2CO /AEROLaser 14001A and/orTexasTech
PSP, WFML,MDB, SB, QCC
DEC, ASRC 12 week SummerIntensives: 2000-04 6 week WinterIntensives: 2000-2003
5-min daily
Air Toxics MDB/QCC; SB DEC Seasonal 2000-04 24-hr 3rd day
11
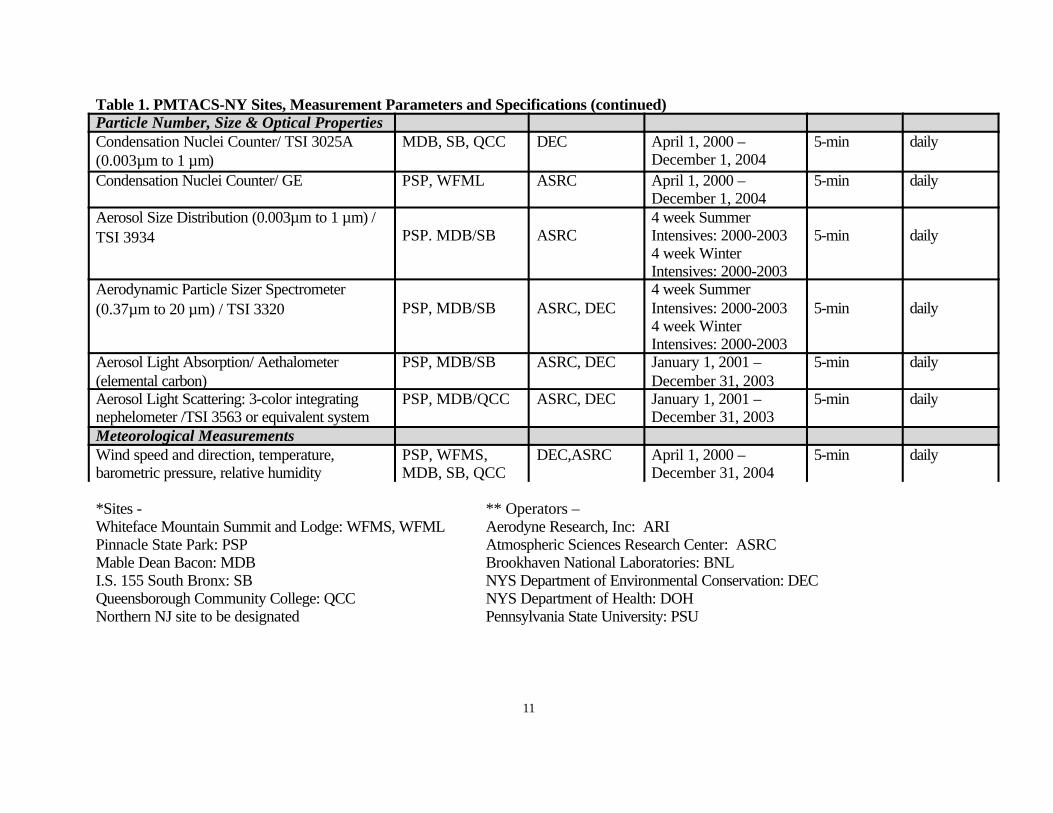
Table 1. PMTACS-NY Sites, Measurement Parameters and Specifications (continued)Particle Number, Size & Optical PropertiesCondensation Nuclei Counter/ TSI 3025A(0.003µm to 1 µm)
MDB, SB, QCC DEC April 1, 2000 –December 1, 2004
5-min daily
Condensation Nuclei Counter/ GE PSP, WFML ASRC April 1, 2000 –December 1, 2004
5-min daily
Aerosol Size Distribution (0.003µm to 1 µm) /TSI 3934 PSP. MDB/SB ASRC
4 week SummerIntensives: 2000-20034 week WinterIntensives: 2000-2003
5-min daily
Aerodynamic Particle Sizer Spectrometer(0.37µm to 20 µm) / TSI 3320 PSP, MDB/SB ASRC, DEC
4 week SummerIntensives: 2000-20034 week WinterIntensives: 2000-2003
5-min daily
Aerosol Light Absorption/ Aethalometer(elemental carbon)
PSP, MDB/SB ASRC, DEC January 1, 2001 –December 31, 2003
5-min daily
Aerosol Light Scattering: 3-color integratingnephelometer /TSI 3563 or equivalent system
PSP, MDB/QCC ASRC, DEC January 1, 2001 –December 31, 2003
5-min daily
Meteorological Measurements Wind speed and direction, temperature,barometric pressure, relative humidity
PSP, WFMS,MDB, SB, QCC
DEC,ASRC April 1, 2000 –December 31, 2004
5-min daily
*Sites -Whiteface Mountain Summit and Lodge: WFMS, WFMLPinnacle State Park: PSPMable Dean Bacon: MDBI.S. 155 South Bronx: SBQueensborough Community College: QCCNorthern NJ site to be designated
** Operators –Aerodyne Research, Inc: ARIAtmospheric Sciences Research Center: ASRC Brookhaven National Laboratories: BNLNYS Department of Environmental Conservation: DECNYS Department of Health: DOHPennsylvania State University: PSU

C-1
ABSTRACT
Title: The Pittsburgh PM Supersite Program: A Multi-Disciplinary Consortium for Atmospheric AerosolResearch
Investigators: Spyros Pandis, Cliff Davidson, Allen Robinson (Carnegie Mellon Univ.), AnthonyWexler, Murray Johnston (Univ. of Delaware), Wolfgang Rogge (Florida Intern. Univ.), MarkHernandez (Univ. of Colorado), Jeff Collett (Colorado State Univ .), Susanne Hering (AerosolDynamics), Jonathan Kahl (Univ. Wisconsin), Barbara Turpin (Rutgers Univ.), John Ondov, StevenBuckley (Univ. of Maryland), RJ Lee, Inc., Kevin Crist (Ohio University), Antonio Miguel (Univ. Calif.Riverside), Delbert Eatough (Brigham Young University), Urs Baltensperger (Paul Scherrer Inst.),Jonathan Samet (Johns Hopkins), Richard Sextro (Lawrence Berkeley Nat. Lab), Thomas Feeley (DOE-NETL).
Institutions : Carnegie Mellon University, Pittsburgh, Pennsylvania – University of Delaware, Newark,Delaware - Florida International University, Miami, Florida - University of Colorado, Boulder, Colorado– Colorado State University, Ft. Collins, Colorado – Aerosol Dynamics, Berkeley, California – Universityof Wisconsin, Milwaukee, Wisconsin – Rutgers University, New Brunswick, New Jersey – University ofMaryland, College Park, Maryland - RJ Lee, Monroeville, Pennsylvania - Ohio University, Athens, Ohio -University of California, Riverside, California - Brigham Young University, Provo, Utah - Paul ScherrerInstitute, Villigen, Switzerland – Johns Hopkins University, Baltimore, Maryland – Lawrence Berkeley Nat.Lab, Berkeley, California – DOE/NETL, Pittsburgh, Pennsylvania.
Project Period: January, 2000 – December, 2004
Project Cost: $3,500,000
Project Summary: Airborne particulate matter (PM) continues to pose serious health risks for susceptiblemembers of the U.S. population and for sensitive ecosystems. Design of cost-effective PM controlstrategies is limited by the lack of understanding of the PM-health effects links which is exacerbated by apaucity of physiological data, the difficulty of establishing the PM source-receptor relationships, and finallythe limitations of existing instrumentation for PM measurements. A comprehensive multidisciplinary studyis proposed for the Pittsburgh region, which will address all of the above issues.
The proposed hypothesis-driven program will have six components:• Ambient monitoring in a central supersite and a set of satellite sites in the region (leveraged against
Department of Energy Federal Energy Technology Center (DOE/FETC) funds).• An epidemiological study (to be leveraged against funds from NIH and others).• An indoor monitoring study (extension of work currently funded by DOE and EPA).• An instrument development and evaluation study (leveraged against current NSF and other EPA
funds).• A comprehensive modeling component (currently funded by the EPA STAR program).• A data analysis and synthesis component (hypothesis testing).
In addition to the above resources the program leverages funds and resources from local industry (Bayer),local government (Allegheny County Health Department), state government (Pennsylvania Department ofEnvironmental Protection), and cost sharing by Carnegie Mellon University.
The objectives of the EPA-funded part of the Pittsburgh Supersite Program are: to characterize PM(size, surface, and volume distribution, chemical composition as a function of size and on a single particle

C-2
basis, morphology, and temporal and spatial variability) in the Pittsburgh region; to quantify the impact ofthe various sources (transportation, power plants, biogenic, etc.) to the PM concentrations in the area; andto develop and evaluate the next generation of atmospheric aerosol monitoring techniques (single particlemeasurements, continuous composition measurements, ultrafine aerosol measurements, improved organiccomponent characterization, etc.). Combining the ambient monitoring study supported by the EPASupersites program with the proposed indoor, health, and modeling studies (funded by other sources) willallow the proposed program to: elucidate the links between PM characteristics and their health impacts;quantify the relationship between indoor and outdoor concentrations; and quantify the responses of PMcharacteristics to changes in emissions to support SIP development. These objectives address all the goalsof the EPA Supersites Program and will be achieved through the investigation of approximately twentyhypotheses addressing issues in ambient aerosol characterization, measurement methods, atmosphericprocesses, aerosol properties, source-receptor relationships, health effects, and indoor exposure.
The measurement program will feature a central supersite located in Pittsburgh near the CMUcampus and a set of satellite sites. Baseline monitoring is planned for an 18-month period that will includedetailed characterization of PM size, surface, and volume distributions, chemical composition as a functionof size, continuous single-particle size and composition measurements, organic aerosol speciation,measurement of the distribution and composition of ultrafine aerosols, semi-continuous measurements ofmetals, nitrate, sulfate, and aerosol carbon, measurements of bioaerosols, aerosol precursors, cloud andfog composition in the area, aerosol optical and hygroscopic properties, and meteorological variables.Three intensive sampling periods are planned to examine temporal variations and to collect detailed datafor model testing and validation. The data from this project will be made available through an easilyaccessible electronic database. The Supersite team with the help of the CMU Computer Science Schoolwill post “immediately” the available raw data (real-time and continuous measurements) and the remainingdata as soon as they become available to a web site accessible by the EPA researchers. This rapidexchange of information will facilitate the collaboration with our EPA colleagues. Throughout the program,we will look for opportunities to minimize adverse environmental effects of the sampling effort withoutcompromising the quality of the data.
The following benefits are expected from the Pittsburgh Supersite program:• Comprehensive characterization of the PM in the Pittsburgh area. This will include, size distribution,
composition as a function of size and for individual particles, temporal and spatial variation, optical andhygroscopic properties, and morphology.
• Development and evaluation of state-of-the-art instrumentation and measurement approaches (singleparticle instruments, continuous measurement approaches, etc.)
• Apportionment of the measured PM (both primary and secondary) to sources as a function of time.These results should be valuable for SIP development.
• Establishment of links between the PM characteristics and health effects in the study area.• Quantification of the relationship between indoor and outdoor PM levels in the region.
• Development of a dataset (in coordination with the other Supersites) for the evaluation of theapproaches used for the description of PM processes in atmospheric chemistry models.

C-3
Figure 1. Map of Pittsburgh region showing the approximate location of the Supersite, the fourDOE/NETL UORVP sites that will be used as satellite sites, and five candidate satellite sites that arecurrently Allegheny County Health Department sampling sites.
_______________________________________________________________________________
2000 2001 2002 2003Task W Sp Su F W Sp Su F W Sp Su F W Sp Su FSiteSite preparationSite restorationQA/QCFinalize QA/QCQual. Management PlanSamplingBaselineIntensivesData AnalysisPreliminary analysisHypothesis testingReportingPlanning reportsProgress reportsFinal reportAdditional StudiesIndoor StudyEpidemiology

C-4
Table 1. Measurements in the Pittsburgh Supersite Program
Measurements Instrumentation FrequencyRegular
FrequencyIntensives
Investigator
Aerosol numberdistribution
Aerosol surfacedistribution
Aerosol volumeDistribution
Ultrafine SMPS 1, SMPS 2, APS3, ELPI 4, Ultrafine CPC 5
Ultrafine SMPS, SMPS, APS,ELPI, Ultrafine CPC,Epiphaniometer
Ultrafine SMPS ,SMPS, APS,ELPI, Ultrafine CPC
10 min
10 min
10 min
5 min
5 min
5 min
Pandis
Pandis
Pandis
PM2.5 mass
PM10 mass
PMx mass
FRM 6, TEOM 7, CMU Sampler8,LPI 9, MOUDI 10
FRM, TEOM, CMU Sampler, LPI,MOUDI
LPI, MOUDI
1 day
1 day
1 day
4-6 hr
4-6 hr
4-6 hr
Davidson
Davidson
DavidsonPM2.5 ions and elementsPM2.5-10 ions, elementsHNO3 vaporNH3 vapor
CMU Sampler/ IC 11 & ICPMS12
CMU Sampler/ IC & ICPMSCMU Sampler/ IC & ICPMSCMU Sampler/ IC & ICPMS
1 day1 day1 day1 day
4-6 hr4-6 hr4-6 hr4-6 hr
DavidsonDavidsonDavidsonDavidson
Size-resolved ions andmetals
MOUDI/IC and ICPMS - 4-6 hr Davidson
PM 2.5 OC and EC 13
PM10 OC and EC
PMx OC and EC
Organic speciation
Organic size-resolvedcharacterization
Polycyclic Aromatic Hydrocarbons
Polar Organics
Organic sampler/thermalPC-BOSS system 14
In-situ carbon analyzer
Organic sampler/thermalR&P sampler 15
ELPI/thermal
Organic sampler/GC-MS 16
LPI/FTIR 17
MOUDI-PUF system 18/GC-MS,HPLC 19-fluorescence
RSMS-II 20
1 day--
1 day1 hr
-
2 weeks
-
-
Continuous
4-6 hr4-6 hr1-2 hr
4-6 hr1 hr
4-6 hr
4-12 hr
24 hr
12 hr
Continuous
RobinsonEatoughTurpin
RobinsonRobinson
Robinson
Rogge
Turpin
Miguel
WexlerSingle ParticleChemical Composition
RSMS-IIFilter/SEM 21
LIBS
Continuous--
Continuous4-6 hr
Continuous
WexlerRJ Lee
BuckleySemi-continuous metalsContinuous nitrateContinuous sulfateContinuous carbon
HFAS/GFAA 22
ICVCICVCICVC
-ContinuousContinuousContinuous
10-60 minutesContinuousContinuousContinuous
OndovHeringHeringHering
Bioaerosols Epi-fluorescent microscopy, 1 day Variable Hernandez

C-5
Molecular biology assays
Visibility NephelometerPhotos/Visual Range
Continuous6 hr
Continuous1 hr
Pandis
Growth with RHCCN concentration
TDMA 23/RSMS-IICCN Counter 24
VariableVariable
VariableVariable
PandisPandis
RH, T, WindUV and SolarTrajectories
ContinuousContinuous
1 day
ContinuousContinuous
4 hr
DavidsonPandisKahl
VOCsHydrogen PeroxideOrganic PeroxidesO3
NO and NO2
SO2
CO
GC-FID 25, GC-MSCSU MonitorCSU MonitorOzone MonitorNOx MonitorSO2 Monitor, FilterCO Monitor
6 days12 hr12 hr1 hr1 hr1 hr1 hr
4-6 hr1 hr1hr1 hr1 hr1 hr1 hr
PandisCollettCollettPandisPandisPandisPandis
Fog and cloudcomposition
CSU Collector 26 Variable 1 hr Collett
1 Ultrafine SMPS: Scanning Mobility Particle Spectrometer (TSI model 3936N25) for 0.003-0.150 µm2 SMPS: Scanning Mobility Particle Spectrometer (TSI model 3934L) for 0.01-1.0 µm3 APS: Aerodynamic Particle Sizer Spectrometer (TSI model 3320) for 0.5-1.0 µm4 ELPI: Electrical Low Pressure Impactor (Dekati)5 Ultrafine CPC: Ultrafine Condensation Particle Counter (TSI model 3025A) for 0.003-10 µm6 FRM: Federal Reference Method PM2.5 Sampler7 TEOM: Tapered Element Oscillating Microbalance PM2.5 Sampler8 CMU Sampler: Carnegie Mellon University system shown in Figure 29 LPI: Low Pressure Impactor developed by Susanne Hering10 MOUDI: Micro-Orifice Uniform Deposit Impactor11 IC: Ion Chromatography12 ICPMS: Inductively Coupled Plasma Mass Spectrometer13 OC and EC: Organic Carbon and Elemental Carbon14 PC-BOSS: Particle Concentrator-Brigham Young University Organic Sampling System.15 R&P sampler: Ruprecht and Patashnik sampling system16 GC-MS: Gas Chromatography-Mass Spectrometry17 FTIR: Fourier Transform Infrared Spectroscopy18 MOUDI-PUF system: MOUDI-Polyurethane Foam plug preceded by a cyclone and denuder19 HPLC: High Performance Liquid Chromatography20 RSMS-II: University of Delaware Single Particle Mass Spectrometer21 SEM: Scanning Electron Microscopy22 HFAS/GFAA: High Frequency Aerosol Sampler/Graphite Furnace Atomic Absorption Spectrophotometry23 TDMA: Tandem Differential Mobility Analyzer24 CCN Counter: Cloud Condensation Nuclei Counter manufactured by DH Associates25 GC-FID: Gas Chromatography-Flame Ionization Detector26 CSU collector: Colorado State University cloudwater collector
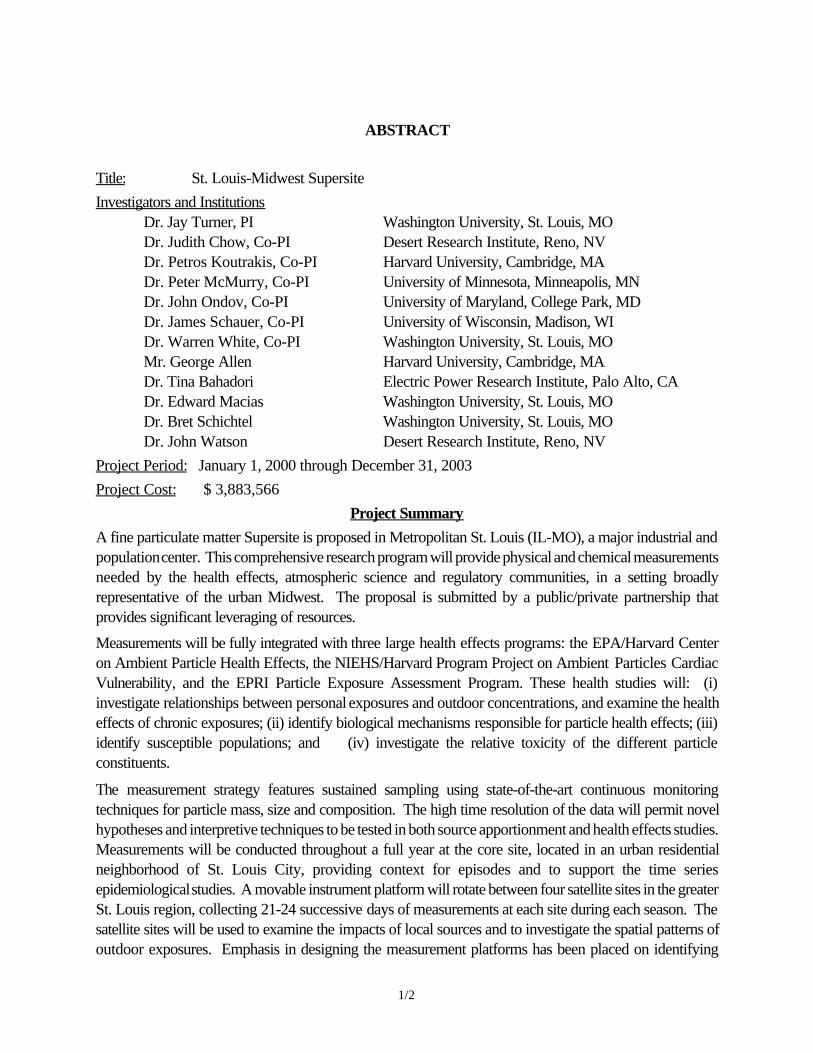
1/2
ABSTRACT
Title: St. Louis-Midwest Supersite
Investigators and InstitutionsDr. Jay Turner, PI Washington University, St. Louis, MODr. Judith Chow, Co-PI Desert Research Institute, Reno, NVDr. Petros Koutrakis, Co-PI Harvard University, Cambridge, MADr. Peter McMurry, Co-PI University of Minnesota, Minneapolis, MNDr. John Ondov, Co-PI University of Maryland, College Park, MDDr. James Schauer, Co-PI University of Wisconsin, Madison, WIDr. Warren White, Co-PI Washington University, St. Louis, MOMr. George Allen Harvard University, Cambridge, MADr. Tina Bahadori Electric Power Research Institute, Palo Alto, CADr. Edward Macias Washington University, St. Louis, MODr. Bret Schichtel Washington University, St. Louis, MODr. John Watson Desert Research Institute, Reno, NV
Project Period: January 1, 2000 through December 31, 2003
Project Cost: $ 3,883,566
Project Summary
A fine particulate matter Supersite is proposed in Metropolitan St. Louis (IL-MO), a major industrial andpopulation center. This comprehensive research program will provide physical and chemical measurementsneeded by the health effects, atmospheric science and regulatory communities, in a setting broadlyrepresentative of the urban Midwest. The proposal is submitted by a public/private partnership thatprovides significant leveraging of resources.
Measurements will be fully integrated with three large health effects programs: the EPA/Harvard Centeron Ambient Particle Health Effects, the NIEHS/Harvard Program Project on Ambient Particles CardiacVulnerability, and the EPRI Particle Exposure Assessment Program. These health studies will: (i)investigate relationships between personal exposures and outdoor concentrations, and examine the healtheffects of chronic exposures; (ii) identify biological mechanisms responsible for particle health effects; (iii)identify susceptible populations; and (iv) investigate the relative toxicity of the different particleconstituents.
The measurement strategy features sustained sampling using state-of-the-art continuous monitoringtechniques for particle mass, size and composition. The high time resolution of the data will permit novelhypotheses and interpretive techniques to be tested in both source apportionment and health effects studies.Measurements will be conducted throughout a full year at the core site, located in an urban residentialneighborhood of St. Louis City, providing context for episodes and to support the time seriesepidemiological studies. A movable instrument platform will rotate between four satellite sites in the greaterSt. Louis region, collecting 21-24 successive days of measurements at each site during each season. Thesatellite sites will be used to examine the impacts of local sources and to investigate the spatial patterns ofoutdoor exposures. Emphasis in designing the measurement platforms has been placed on identifying

2/2
advanced methods with demonstrated or potential ability to operate reliably for extended periods withlimited attendance.
In situ measurements will obtain temporally resolved data for particle size, mass, nitrate, sulfate, organicand elemental carbon, and five metals of environmental significance. Instrumentation newly developed atthe University of Minnesota will continuously measure particle size distributions as well as integral momentsof the particle size distribution (range 3 nm – 10 µm). The latter method shows promise as a cost-effectiveapproach for obtaining particle size data for health effects studies, and will be validated using conventionalparticle sizing techniques. Continuous instruments developed by Harvard University for particle mass,nitrate and sulfate will be deployed at both the core and satellite sites to provide data for health effectsstudies and assessing temporal and spatial variability. A semi-continuous carbon analyzer will be used atthe core site to obtain hourly average elemental and organic carbon concentrations. A novel semi-continuous elemental analysis system developed by the University of Maryland will be operated at the coresite to provide hourly-average data for five heavy metals of significant interest to the health effects andsource apportionment communities. The experience to be gained through the field testing of theseadvanced monitoring techniques will be shared with the scientific and instrument manufacturing communities.
Substrate methods will be used for 24-hour integrated measurements of particle mass and composition.These measurements will feature enhancements to the chemical speciation network methods and will beused to: (a) evaluate the continuous monitoring techniques; and (b) provide detailed chemicalcharacterization of particles beyond the baseline analyses for the chemical speciation network (precursorgases, particle acidity, an expanded suite of particulate ions, and water soluble metals). Elemental analysisstrategies are emphasized because of their importance to health effects and source apportionment studies. Collocated samples will be used to compare four distinct analytical methods - XRF, ICPMS, INAA andGFAA. Based on the results, one method will be chosen to analyze the full year of daily samples for boththe core and satellite sites. 24-hour integrated measurements at both sites will provide data to: (a) evaluatethe performance of the continuous monitors in various environments; (b) investigate temporal and spatialvariations in particle mass and composition; and (c) support the health effects studies.
Samples will also be collected for retrospective analysis of trace element and organic compoundcomposition. About 500 one-hour integrated samples will be analyzed for twelve trace elements in additionto the sustained hourly-average measurements for five elements. Detailed organic speciation will beperformed for more than 100 of the 24-hour integrated samples. These analyses will provide data tosupport both health effects and source apportionment studies.
A consortium of six universities from across the country has been assembled to undertake the proposedSt. Louis Supersite program. The investigators include experts in methods development, particle chemistryand physics, field studies, data processing and analysis, source apportionment, exposure assessment, andquality assurance. The Principal Investigator – Dr. Jay Turner of Washington University – will work closelywith the Executive Management Team consisting of Dr. Judith Chow (Desert Research Institute), Dr.Petros Koutrakis (Harvard University), Dr. Peter McMurry (University of Minnesota) and Dr. WarrenWhite (Washington University) to guarantee successful execution of this project.
This proposed project runs from January 2000 through December 2003. First year activities focus onstudy planning and design with measurements phased in during the 4th Quarter. Sustained monitoring withthe full suite of measurements will be conducted from January 1, 2001, through December 31, 2001. Thetwo remaining years will be used for chemical characterization, data analysis and reporting.

3/2
Proposed measurements for the St. Louis - Midwest Supersite - aerosol physical properties.1
In Situ Measurements (Continuous or Semi-Continuous Automated Measurements) Size Range Duration Core Satellite
Aerosol Size DistributionNano-Scanning Mobility ParticleSpectrometer (SMPS) (University of Minnesota)
3-20 nm 5 min X
Scanning Mobility Particle Spectrometer(SMPS) (University of Minnesota)
20-500 nm 5 min X
LasAir Optical Particle Counter (Universityof Minnesota)
0.2-2 µm 5 min X
Aerodynamic Particle Sizer (University of Minnesota)
0.3-10 µm 5 min X
Integral Moments of Physical Aerosol PropertiesNumber Concentration (TSI 3025 UltrafineCPC) (University of Minnesota)
>3 nm 2 sec X X
“Dry” Light Scattering Coefficient(Nephelometer) (University of Minnesota)
<2.5 µm 2 sec X X
Electrical Charge Integral (University of Minnesota)
<2.5 µm 2 sec X X
Transmittance through filter deposits(Aethalometer) (Harvard University)
<2.5 µm 5 min X X
Total Mass Concentration (CAMMS)(Harvard University)
<2.5 µm 1 hour X X
Substrate Methods (Time-Integrated Manually-Operated Samplers) Particle Mass Concentration Size Range Duration Core Satellite
Harvard Impactor (Harvard University) - PM1 <1.0 µm 24 h X X - PM2.5 <2.5 µm 24 h X X - PM10 <10 µm 24 h X XHEADS (Harvard University) - PM2.5 <2.5 µm 24 h X XSequential FRM (City of St. Louis) - PM2.5 <2.5 µm 24 h X (X)2
Non-Sequential FRM (City of St. Louis) - PM10 <10 µm 24 h
(1-in-6 days)X (X)2

4/2
High Resolution Dichotomous Sampler(Harvard University) - fine PM (PM2.5) <2.5 µm 24 h X X - coarse PM (PM10 – PM2.5) 2.5-10 µm 24 h X X

5/2
Proposed measurements for the St. Louis - Midwest Supersite - aerosol chemical properties.1
In Situ Measurements (Semi-Continuous Automated Measurements) Size Range Duration Core Satellite
Sulfate (e.g., R&P/ADI, HSPH, ARA)(Harvard University)
<2.5 µm 10 min X X
Nitrate (e.g., R&P/ADI, HSPH, ARA)(Harvard University)
< 2.5 µm 10 min X X
OC/EC (Sunset Laboratory Instrument)(University of Wisconsin)
<2.5 µm 1 hour X
Substrate Methods (Time-Integrated Manually-Operated Samplers)Size Range Duration Core Satellite
HEADS: sulfate, nitrate, ammonium,potassium and sodium ions, acidity, ammonia,nitric/nitrous acid, SO2(Harvard University)
<2.5 µm 24 hour X X
OC/EC (NIOSH method 5040)(University of Wisconsin)
<2.5 µm 24 hour X X
Trace Metals (analytical method to bedetermined)
<2.5 µm 24 hour X X
Coarse PM Trace Metals3 (analytical methodto be determined)
<10 µm- or -
2.5-10 µm
24 hour X X
12+ elements (from As, Cu, Mn, Ni, Cr, Cd,Se, Ag, Pb, Al, Fe, Zn, Ca, V, Ti, Be, Ba)(HFASS-GRAAZ) (University of Maryland)
<2.5 µm 1 hour(retrospective
analysis @∼1200 samples)
X
Organic compound speciation(University of Wisconsin)
<2.5 µm 24 hour(retrospective
analysis @∼110 samples)
X
Toxicological sampling(1630 m3 sampling volume)(Harvard University)
<2.5 µm 1 week(retrospective
analysis)
X

6/2
Proposed measurements for the St. Louis - Midwest Supersite – other measurements.1
Duration Core SatelliteAirborne Bioallergens(St. Louis County and Washington University)
24 hour Clayton, MO
Meteorological Parameters(Washington University)- wind speed- wind direction- temperature- relative humidity- barometric pressure- solar radiation
5 min X
Criteria Gas Pollutants(City of St. Louis)- nitric oxide / nitrogen oxides- ozone- carbon monoxide- sulfur dioxide
1 hour X (X)1
FOOTNOTES:
(1) All measurements will be sustained for an entire year. Thus, the sampling frequency is thereciprocal of the duration (e.g., 24 hour samples will be collected 1/day, hourly samples will becollected 24/day) unless other noted.
(2) Criteria gaseous pollutants, PM2.5 and PM10 will be available at satellite sites collocated withcompliance network monitors. Responsible agencies include the City of St. Louis, St. Louis County,Missouri Department of Natural Resources, and Illinois Environmental Protection Agency.
(3) Analysis of either PM10 samples or dichotomous sampler coarse filter samples.

7/2
ILLINOIS
MISSOURI
St. Louis (MO-IL) Metropolitan Statistical Area.
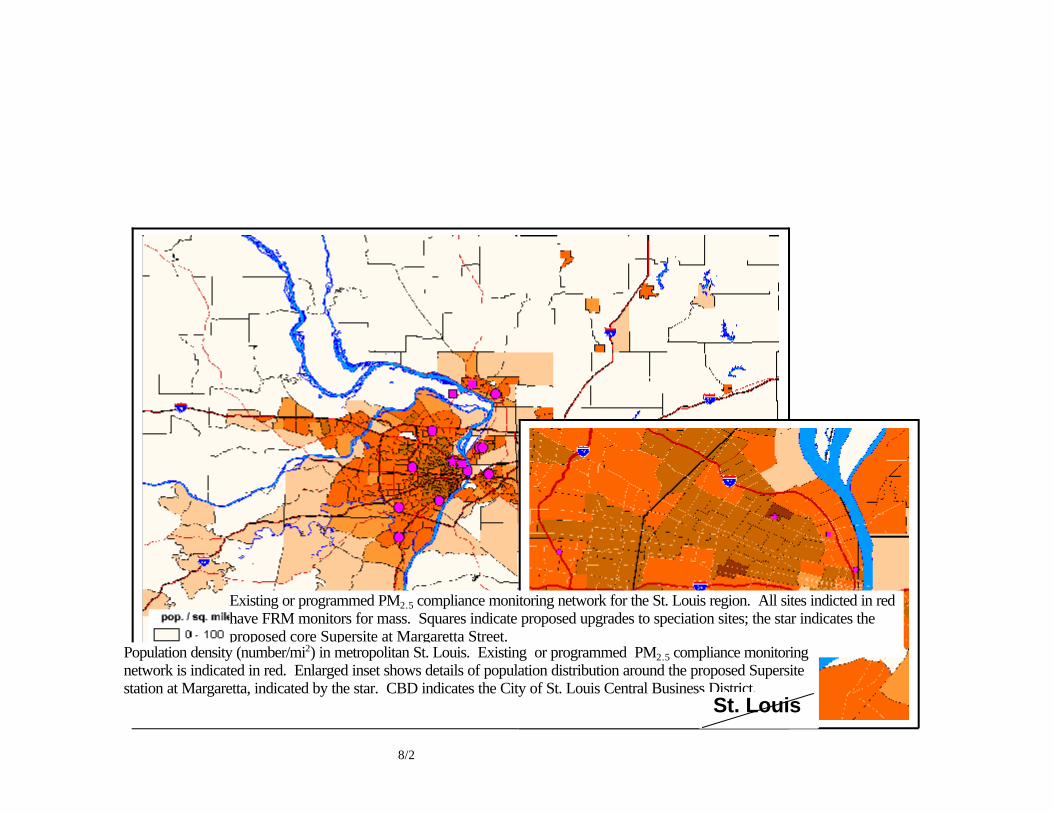
8/2
Existing or programmed PM2.5 compliance monitoring network for the St. Louis region. All sites indicted in redhave FRM monitors for mass. Squares indicate proposed upgrades to speciation sites; the star indicates theproposed core Supersite at Margaretta Street.
Population density (number/mi2) in metropolitan St. Louis. Existing or programmed PM2.5 compliance monitoringnetwork is indicated in red. Enlarged inset shows details of population distribution around the proposed Supersitestation at Margaretta, indicated by the star. CBD indicates the City of St. Louis Central Business District.
CBDSt. LouisSt. Louis

9/2
plus three satellite sites,each visited by a movableplatform for 3-4 weeks per
quarter (locations TBD)
core site(fixed platform)