abstract title of thesis: the influence of … · measuring student-teacher closeness ... factors...
TRANSCRIPT

ABSTRACT
Title of Thesis: THE INFLUENCE OF STUDENT AND TEACHER
CHARACTERISTICS ON STUDENT-TEACHER CLOSENESS
Ho Lam Yiu, Master of Arts, 2011
Thesis directed by: Professor Gary D. Gottfredson
Department of Counseling and Personnel Services
Close student-teacher relations correlate positively with students‘ academic,
behavioral, and social competences. The present study examined predictors of student-
teacher closeness, extending previous studies by including Asian Americans students as
well as teacher beliefs about students in a multilevel analysis. Results indicated that
students‘ race, gender, in-class behaviors, and academic achievement affected how close
teachers felt to them. Teachers‘ race, grade taught, and beliefs about Asian students
explained additional variance in closeness. Gender match and Black student-teacher
racial match influenced teacher-perceived closeness. Furthermore, teacher beliefs about
students moderated the association between race and closeness in expected ways.
Findings showed that teachers display reliable individual differences in closeness, and
race and beliefs are important in predicting student-teacher closeness.

THE INFLUENCE OF STUDENT AND TEACHER CHARACTERISTICS ON
STUDENT-TEACHER CLOSENESS
by
Ho Lam Yiu
Thesis submitted to the Faculty of the Graduate School of the
University of Maryland, College Park in partial fulfillment
of the requirements for the degree of
Master of Arts
2011
Advisory Committee:
Professor Gary D. Gottfredson, Chair
Assistant Professor Matthew J. Miller
Professor Sylvia A. Rosenfield

Copyright © 2011 by
Ho Lam Yiu

ii
Acknowledgements
Data used in this research were collected in part with support of a grant from the
Institute for Education Sciences, U.S. Department of Education (R305F050051).
Opinions expressed do not necessarily reflect the position of the U.S. Department of
Education.
I thank Prince William County Public Schools for their participation in the study
that developed the data used here. These data would not be available without the
involvement of administrators, facilitators, teachers, and other school staff. Kathy Aux
and Jennifer Cassata led the project in the school system. I would like to thank my thesis
committee, Professors Gary Gottfredson, Matthew Miller, and Sylvia Rosenfield for their
advice. Many thanks to Jill Berger, Lauren Kaiser, Deborah Nelson, Kate Shanahan,
Megan Veganek, and Phuong Vu for their participation in organizing or obtaining the
data used in this research. Lee Ann Annotti, Julie Grossman, Marissa McMurray, Janaiha
Nelson, and Benjamin Schwinke provided counsel on a previous version of this paper.

iii
TABLE OF CONTENTS
List of Tables ..................................................................................................................... vi
List of Figures ................................................................................................................... vii
List of Abbreviations ....................................................................................................... viii
Theoretical Rationale .......................................................................................................... 1
Importance of Positive Student-Teacher Relationships .................................................. 1
Defining Student-Teacher Closeness ........................................................................... 2
Academic Outcomes .................................................................................................... 4
Academic achievement. ........................................................................................... 4
Behavioral engagement. ........................................................................................... 6
Psychosocial Outcomes ............................................................................................... 7
Psychological adjustment......................................................................................... 8
Social competence. .................................................................................................. 8
Externalizing behaviors. .......................................................................................... 9
Fear about school violence....................................................................................... 9
Measuring Student-Teacher Closeness ......................................................................... 10
Student-Teacher Relationship Scale .......................................................................... 10
Factors Influencing Student-Teacher Relations ............................................................ 12
Student Characteristics .............................................................................................. 13
Gender, socioeconomic status, and grade-level. .................................................... 13
Race........................................................................................................................ 13
English proficiency. ............................................................................................... 14
Behavioral engagement. ......................................................................................... 15
Externalizing and internalizing behaviors. ............................................................ 15
Externalizing. ..................................................................................................... 16
Internalizing. ...................................................................................................... 17
Achievement. ......................................................................................................... 18
Teacher Characteristics .............................................................................................. 18
Gender. ................................................................................................................... 18
Grade-level taught. ................................................................................................. 18
Teacher beliefs. ...................................................................................................... 18
Teacher-Child Interactions ........................................................................................ 19
iv
Racial match........................................................................................................... 19
Gender match. ........................................................................................................ 20
Present Study ............................................................................................................. 20
Hypotheses................................................................................................................. 23
Method .............................................................................................................................. 24
Participants ................................................................................................................ 24
Procedure ................................................................................................................... 24
Measures .................................................................................................................... 25
Student predictor variables. ................................................................................... 26
Gender. ............................................................................................................... 26
Race. ................................................................................................................... 26
English for Speakers of Other Languages (ESOL). ........................................... 26
Free and reduced meal (FARM)......................................................................... 26
Academic achievement. ..................................................................................... 26
Behavioral engagement. ..................................................................................... 26
Internalizing behaviors. ...................................................................................... 27
Externalizing behaviors. ..................................................................................... 27
Teacher predictor variables. ................................................................................... 27
Grade-taught. ...................................................................................................... 28
Gender. ............................................................................................................... 28
Race. ................................................................................................................... 28
Beliefs about teaching and learning. .................................................................. 28
Outcome Variable ...................................................................................................... 28
Student-teacher closeness. ..................................................................................... 29
Data Analysis ............................................................................................................. 29
Reliability and predictive validity of the closeness measure. ................................ 29
Hierarchical linear modeling (HLM). .................................................................... 29
Missing data. .......................................................................................................... 33
Results ............................................................................................................................... 33
Closeness Scale.......................................................................................................... 33
Reliability. .............................................................................................................. 33
Predictive validity. ................................................................................................. 34
Multicollinearity Diagnostics .................................................................................... 34

v
Correlations. ........................................................................................................... 34
Multiple regression. ............................................................................................... 35
Model specification. ............................................................................................... 35
Sources of Variations in Student-Teacher Closeness ................................................ 36
Student Effects on Closeness ..................................................................................... 36
Teacher Effects on Closeness .................................................................................... 38
Interactions Between Student and Teacher Characteristics ....................................... 40
Gender match. ........................................................................................................ 41
Racial match........................................................................................................... 41
Student race and related teacher belief. ................................................................. 42
Discussion ......................................................................................................................... 42
Teacher-Rated Closeness ........................................................................................... 42
Research Question One ............................................................................................. 44
Research Question Two ............................................................................................. 47
Research Question Three ........................................................................................... 50
Limitations ................................................................................................................. 51
Virtues ....................................................................................................................... 52
Implications and Future Research ............................................................................. 53
Culture and closeness using Asian Americans as an example. .............................. 53
School-based interventions. ................................................................................... 55
Appendices ........................................................................................................................ 71
Appendix A ................................................................................................................... 71
Appendix B ................................................................................................................... 72
Appendix C ................................................................................................................... 73
Appendix D ................................................................................................................... 74
References ......................................................................................................................... 82

vi
List of Tables
Table 1 Sample Race and Gender ..................................................................................... 58
Table 2 Student Age in Years by Grade Level .................................................................. 59
Table 3 Student Demographics by Grade Level ............................................................... 60
Table 4 Longitudinal Inter-teacher Correlations of Closeness Ratings ........................... 61
Table 5 Proportion of Variance in Closeness Explained by the Predictors ..................... 62
Table 6 Predictive Validity: Longitudinal Correlations of Teachers' Ratings of Student
Behaviors .......................................................................................................................... 63
Table 7 Bivariate Correlations Among Student-Level Variables ..................................... 64
Table 8 Multicollinearity Diagnostics: Standardized Regression of Closeness on
Predictors .......................................................................................................................... 65
Table 9 Estimated Student Characteristic Effects on Closeness: Coefficients for Student-
Level Covariates in a Two-Level Model ........................................................................... 66
Table 10 Estimated Teacher Effects on Student-Covariate-Adjusted Closeness .............. 67
Table 11 Mean Raw Scores on Teacher Belief Items by Teacher Race ............................ 68
Table 12 Within-Teacher Model: Interaction Effects from HLM ..................................... 69
Table 13 Means and Standard Deviations of z-Standardized Continuous Variables by
Student Race and Gender.................................................................................................. 73

vii
List of Figures
Figure 1. Teacher self-reported agreement to belief items by teacher race. ..................... 70
viii
List of Abbreviations
ESOL = English for Speakers of Other Languages
FARMS = Free and Reduced Meals Services
STR = Student-teacher relational
STRS = Student-Teacher Relationship Scale
TOCA-R = Teacher Observations of Classroom Adaptation-Revised
TRSB = Teacher Report on Student Behaviors
TSR = Teacher Self-Report

1
Theoretical Rationale
Research on social development, attachment theory, and educational psychology
has shown that adult-child relationships contribute to the social context in which children
develop (Pianta & Steinberg, 1992). Kellam, Branch, Agrawal, and Ensminger‘s (1975)
Life Course-Social Field model proposed that young children are most influenced by
their families and the classroom. In the United States where education is mandated by
law, meaning that every child must receive schooling and thus must form a relationship
with an instructor, one important child-adult relationship is with the teacher. Because
teachers interact with children almost daily, investigations of teacher-student
relationships are required to obtain a complete picture of school-aged children‘s
development. This student-teacher relationship is one focus of the present inquiry. Also,
in view of the ethnic diversity of the U.S., the influence of race or ethnicity on this
relationship is a second focus.
Importance of Positive Student-Teacher Relationships
Students‘ basic psychological needs must be met to allow for adaptive
development (Connell & Wellborn, 1991). These needs have been conceptualized as the
needs to be competent, autonomous, and related to others (Skinner & Belmont, 1993).
Skinner and Belmont studied teacher-reported classroom structure to foster competence,
their level of autonomy support for students, and their involvement with students; they
found that the latter was the strongest and most consistent correlate with students‘
perceptions of their teachers as providers of these basic psychological needs. In order for
learning to take place for every student, effective communication between the teacher and
each individual student must occur. In this way, ―a teacher forms an interpersonal

2
relationship with each student. . . [and] teaching must be viewed as an interpersonal
communication process‖ (McCroskey & McCroskey, 1986, p. 158). Accordingly, Pianta
and Steinberg (1992) proposed that children‘s relations with their teachers are especially
important in their educational experience and linked to their adjustment. This is also
echoed in Skinner and Belmont‘s findings of the importance of teacher warmth and
affection in students‘ positive classroom experience.
According to the Kellam et al. (1975) theory, teachers are natural raters of
children once they reach school-going age, and as such define adjustment for the children.
That is, the adjustment task for children is more or less to please the teacher. In effect, the
teacher becomes the environment in which students develop. One need not adopt this
perspective, however, to see that teacher-student relationships affect students‘ school
adjustment in terms of academic and psychosocial outcomes. Several studies, reviewed
here, support this conclusion.
Defining Student-Teacher Closeness
What is interpersonal closeness? It has been described as the perception of
warmth and affection (Pianta, 2001), the perceived psychological distance (Ho & Chau,
2009), and the degree of fondness or affinity (McCroskey & McCroskey, 1986) between
two individuals. Obviously, the closeness between a student and a teacher is different
from that between peers or between romantic partners. Regardless, student-teacher
closeness is important to study because effective communication (i.e., student learning) is
more likely to occur when people like each other (McCroskey & McCroskey, 1986).
Appendix D summarizes the literature reviewed and the way in which student-
teacher relational closeness was construed, the instruments used to measure this construct,

3
and how the measure correlated with other measures. When researchers have investigated
the role of positive student-teacher relations in producing student outcomes, terms used to
describe this positive relationship have included positive interactions, involvement,
bonding, relatedness, relationship quality, emotional support, and closeness. The varied
conceptualizations of positive student-teacher relations make it difficult for practitioners
to obtain a clear understanding of which aspect of positive student-teacher relationships
to target in order to improve student outcomes. Nonetheless, from the descriptions of how
they measured positive student-teacher relations, it appeared that all of the researchers
implicitly agreed that such a construct described how close psychologically the student
and teacher felt toward one another, as opposed to a physical closeness, a burdening
dependence, or mere interaction frequencies.
Little research on the student-teacher relationship has attended to the cultural
dimension of interpersonal relations. This omission is alarming because classrooms today
serve students from diverse backgrounds which might affect how comfortable teachers or
students feel in building a close bond with one another. For example, cultures heavily
influenced by Confucian philosophy, learning and education are greatly valued, and
teachers are seen as elderly figures to be respected (den Brok, Levy, Rodriguez, &
Wubbels, 2002). In both Hispanicand Asian cultures, students might not expect to
become close to their teachers in the sense that teachers could be confidants for personal
problems, so they may not exhibit closeness-related behaviors toward teachers. Instead,
den Brok et al. suggested that compared to their American peers, these students might be
more likely to be ―culturally influenced to expect their teachers to be more powerful,
authoritative figures‖ (p. 450). To Asian students, then, close student-teacher relations

4
may mean acquiring instrumental help that help them succeed academically (Ang, 2005),
because that is what a good teacher is expected to do—invest in student learning. These
perspectives about the role of the teacher may influence what student-teacher closeness
means to students from diverse backgrounds.
Despite possibly differing cultural expectations about what a close student-teacher
relationship looks like, closeness as defined by the mainstream culture is important
because this conceptualization may be the schema from which teachers operate,
especially when most public school teachers are White (Schools and Staffing Survey,
2008). In addition, the literature largely supports the benefits of positive student-teacher
relations in promoting student outcomes, as discussed below.
Academic Outcomes
Academic achievement. Controlling for student gender, socioeconomic status
(SES), and previous student-teacher relational conflict and closeness ratings at 54 months
and in kindergarten, Pianta and Stuhlman (2004) reported that the higher the first grade
teacher‘s perception of student-teacher closeness, the higher the teacher rated the student
in academic achievement (β = .22). Conversely, first grade teachers rated students
slightly lower on achievement if they also reported a more conflictual relationship with
the students (β = -.10). The variance in academic rating explained by student-teacher
closeness and conflict was significant beyond that explained by the covariates (ΔR2 = .06).
The students sampled in this study were mostly White (86%). Hamre and Pianta (2005)
used measures of children‘s attention, externalizing behavior, social skills, and academic
competence as indicators of the student‘s risk status for school failure. When previous
academic performance was held constant, the researchers found that, in their sample

5
(79% Caucasian, 11% African American, 5% Hispanic, 4% other), students in classrooms
with higher emotional support as rated using the Classroom Observation System for First
Grade (COS-1) had academic performance similar to their lower risk peers, while higher
risk students in classrooms with lower levels of emotional support performed slightly
worse than their lower risk peers (d = .01). The COS-1 classified classrooms with
emotional support as having teachers who showed positive regard and warmth in
interactions with students; were sensitive to children needs, moods, interests, and
capabilities; and were tactful to allow for student autonomy in classroom activities.
Similarly, Pianta, Belsky, Vandergrift, Houts, and Morrison (2008) tracked
children from first through fifth grade. They believed that they had identified two types
of readers: ―Typical‖ readers who showed steady growth extended over a longer period
of time, and ―fast‖ readers who showed rapidly increasing growth early and then
decelerated. Although Pianta et al. did not observe significant correlations between an
emotionally supportive classroom (as defined using the COS) and fast readers‘ reading
achievement, the researchers found that the emotional support provided by teachers in the
classroom was a significant predictor for reading achievement of third and fifth grade
typical readers (for every point above the mean, scores increased by 1.60 points (SD =
15.84) for third graders and 3.65 points (SD = 14.51) for fifth graders), suggesting that
emotionally supportive teacher-student relations were more helpful for typically-
achieving students than for faster readers.
Baker, Grant, and Morlock (2008) examined the amount of variance explained in
(a) reading grades, (b) positive habits, and (c) classroom adjustment by student-teacher
closeness/conflict, externalizing/internalizing behaviors, four interactions between the

6
student-teacher relationship and student behavioral variables, and the teacher rater, in a
sample of 68 teachers and 423 students who were mostly African American (63%) or
Caucasian (21%). An interaction was found such that students who displayed
externalizing behavior problems did slightly better in reading if they had a closer
relationship with their teachers than if they did not (partial η2 = .02). Although Baker et al.
accounted for error variance due to the nested nature of students within classrooms by
using teachers as a fixed factor in the analyses, the authors did not to adjust for student
gender or race.
Behavioral engagement. Using teacher ratings of students‘ behavioral risk
(Achenbach‘s Child Behavior Scale) and the student-teacher relationship (Pianta‘s
Student Teacher Relationship Scale), student self-reports of peer relationships
(sociometric nomination procedures), and student achievement measures (Wide Range
Achievement Test-Revised), Ladd and Burgess (2001) asked 151 teachers in the Midwest
to rate 385 kindergarten and first grade students (77% Caucasian, 18% African
Americans, and 6% other). Findings revealed that relationship ‗protectors‘ (i.e., peer
acceptance, number of mutual friendships, and teacher-child closeness) explained
additional, albeit small, variance in students‘ cooperative participation in the classroom
and fondness for school (ΔR2 = .07 and .06, respectively) beyond the variance explained
by the students‘ gender and early aggressive risk status. Specifically, Ladd and Burgess
showed that more student-teacher closeness incrementally contributed to students‘
cooperative participation in the classroom (β = .14) and fondness for school (β = .19).
Student-teacher closeness was an even stronger predictor of cooperative participation and
school liking for students who were chronically aggressive (β = .18 and .28, respectively).

7
Since both measures were teacher-rated, criterion contamination is possible. Plus, the
positive relational predictors (i.e., teacher-child closeness, number of mutual friendships,
and peer acceptance) were entered as a block in the regression analyses, which makes it
difficult to determine whether any variable by itself was influential in predicting
closeness. Moreover, while the authors controlled for gender and aggression risk by
entering those blocks prior to later predictors of interest, other demographic variables
such as SES and race were not accounted for in the regression model. The omission is
noteworthy because these variables have also been shown to explain variance in school
adjustment (e.g., Kuperminc, Blatt, Shahar, Henrich, & Leadbeater, 2004).
Students in Skinner and Belmont‘s (1993) study were found to engage more in
classrooms in which they perceived their teachers as more affectionate (e.g., liking and
enjoyment of the student), more attuned (e.g., understanding and knowledgeable of the
student), dedicated more time and energy to students, and more dependable (r = .60
to .65). Furrer and Skinner (2003) measured relatedness to teachers with items gauging
students‘ agreement to statements such as feeling accepted and special, and not ignored
nor unimportant. They observed that, after taking into account student-reported
relatedness to parents and to peers, students‘ sense of relatedness to their teachers was a
significant predictor of their behavioral engagement (β = .14 and .26 for teacher- and
student-reported, respectively), as well as their emotional engagement (β = .17 and .40
for teacher- and student-reported, respectively).
Psychosocial Outcomes
Research about student-teacher relationships and psychological outcomes are less
common than studies on academic outcomes, perhaps because of the emphasis on
8
achievement tests. Nonetheless, the relationship in which a children engages with their
teacher undoubtedly plays an influential role in their psychosocial development.
Psychological adjustment. Ladd and Burgess (2001) found that ratings on
chronic aggression or on student-teacher conflicts did not predict thought problems,
operationalized by items such as ―hears things‖ or ―can‘t get mind off certain thoughts.‖
The interaction between these two predictors, however, was statistically significant. After
accounting for student gender and being rated repeatedly as aggressive, kindergarten and
first grade students with higher student-teacher conflict ratings concurrently had more
teacher-rated behavioral misconduct (β = .15) and attention problems (β = .15). Again,
this study did not examine the role of race. This is important because it has been shown
that teachers perceive behaviors of students differently according to the student‘s race
(Chang & Sue, 2003).
Social competence. First graders‘ social competence as rated by their teachers
and neutral observers was predicted by teacher ratings of student-teacher closeness in
Pianta and Stuhlman‘s (2004) study (β = .32 and .10, respectively, adjusting for student
gender, SES, and previous teacher-rated conflict and closeness with students). Also,
teacher perceived level of conflict with students was negatively correlated with their
ratings of students‘ social competence (β = -.38, adjusting for the same conditions).
Similarly, in Ladd and Burgess‘s (2001) study, scores on student-teacher closeness had a
weak-positive correlation with peer acceptance ratings for the kindergarteners sampled.
On the other hand, students who scored lower on the closeness measure received slightly
higher scores on a peer rejection measure from kindergarten through the first grade (r ≈ -
.20, p < .001).

9
Externalizing behaviors. Using hierarchical multiple regression analyses,
Meehan, Hughes, and Cavell (2003) found that teachers‘ (79% Caucasian) ratings of the
degree of supportive relationships with students (37% Caucasian, 41% African
Americans, and 22% Hispanic) as measured by the Network of Relationships Inventory
explained substantial variance in teacher-rated student level of aggression (β = -.49,
adjusting for previous year aggression, minority status, and negative parenting, and
previous year‘s teacher-rated support). Ladd and Burgess (2001) reported similar findings
using student-teacher conflicts assessed through Pianta‘s Student-Teacher Relationship
Scale and student aggressive behaviors as measured by the teacher form of Achenbach‘s
Child Behavior Scale. Again, teachers rated both the supportive relationship as well as
aggression, so results may simply reflect a tendency for there to be a halo in teacher
ratings.
Positive student-teacher relations may serve as a protective factor for higher risk
status students against negative outcomes such as problem behaviors. Meehan et al.‘s
(2003) study also explored student race as a moderator for how much the student
benefited from having a more supportive student-teacher relationship. They found that
higher teacher support predicted lower teacher-rated aggression in Caucasian, African,
and Hispanic students, but the variance explained by a more supportive relationship was
significantly greater for the minority than for the Caucasian students (ΔR2 = .03,
controlling for previous year‘s aggression rating).
Fear about school violence. Gainey and Seyfrit (2001) found that the more a
high school student in their sample felt that they were integrated into a social community,
the less likely the individual would be fearful of potential victimization in violence or

10
crimes. Teachers play an important role in the social community of the school. Akiba
(2010) investigated the relationship between teacher-student bonding and student reports
of being fearful of school violence in a national sample of students from publicly
available data collected for the Program for International Student Assessment. Student-
teacher bonding was assessed by asking students to indicate their levels of agreement to
items such as ―students get along well with most teachers,‖ ―most teachers are interested
in students‘ well-being,‖ ―most of my teachers really listen to what I have to say,‖ ―if I
need extra help, I will receive it from my teachers,‖ and ―most of my teachers treat me
fairly.‖ Using a student nested within school design to explain variance observed in
student reports of fear of school violence, characterized by the degree of agreement to
items such as ―my school is a place where I often feel as if someone will attack or harm
me,‖ Akiba found that student-teacher bonding explained variation in school fear.
Measuring Student-Teacher Closeness
Although an exact definition for student-teacher closeness has not been agreed
upon, Pianta‘s Student-Teacher Relationship Scale (STRS) is commonly used to assess
the quality of student-teacher relations.
Student-Teacher Relationship Scale
The STRS (Pianta, 2001) contains 28 items related to three factors: Conflict,
Closeness, and Dependency. Teachers rated students on a Likert-type, five-point scale
ranging from ―Definitely does not apply‖ to the highest ―Definitely applies,‖ in response
to statements about their relationships with their students. The STRS Closeness scale is
composed of 11 items that relate to the teacher‘s perception of the students‘ expression of

11
positive affect in their interactions, and include items that tap into the teacher‘s feelings
of warmth and openness in their relationship with the child.
Previous studies have demonstrated good internal consistency for STRS
Closeness (α coefficient > .85; Hamre & Pianta, 2001; Ladd & Burgess, 1999).
Researchers who employed the STRS in their investigations reported moderate negative
correlations between Closeness and Conflict scales, whereas Closeness and Dependency
were statistically unrelated (Doumen, Vershueren, Buyse, De Munter, Max, & Moens,
2009; Ladd & Burgess, 1999).
Doumen et al. (2009) found that STRS Closeness showed convergent validity
with other measures that tap student-teacher relational closeness, such as students‘ self-
report of their feelings about mutual fondness in the student-teacher relationship as
measured by the Feelings About School interview (FAS; Valeski & Stipek, 2001), and a
peer nomination procedure to determine students‘ perception of which classmates were
the closest to their teachers. Doumen et al. also found evidence that STRS Closeness was
positively correlated with teacher-student interactions as observed using the Attachment
Q-Set‘s (Waters, 1995) Enjoyment of Physical Contact scale, which measured behaviors
expected to be displayed by students if they were engaged in student-teacher relationships
characterized by warmth and closeness.
The STRS Closeness scale‘s discriminant validity, however, is less established. In
Doumen et al.‘s (2009) study, although STRS Closeness correlated negatively with STRS
Conflict as predicted, this negative correlation was stronger than the convergent
correlation between STRS Closeness and closeness as measured by the other instruments
(i.e., the FAS and peer nominations). In other words, not surprisingly, teacher ratings of
12
student-teacher relational conflicts were more powerful predictors of teacher ratings of
student-teacher closeness than were student self- or peer-reported student-teacher
closeness. The negative correlations observed between STRS Closeness and the peer
nominated student-teacher conflicts and dependency scores provided validity evidence
for the measures. Although it is not a perfect measure of the student-teacher relation
construct, Pianta‘s (2001) STRS is currently one of the most established instruments to
measure student-teacher relationship in the field.
Factors Influencing Student-Teacher Relations
Although it is the more common practice to use teachers as raters of the student-
teacher relationship, a relationship, by definition, involves more than one individual. The
importance of studying the interaction between an individual and his or her environment
when investigating developmental phenomena calls for a multimethods analysis approach
(Cicchetti, 2008). In other words, to approximate the student-teacher relationship
construct more closely, multiple methods of measurement must be employed. Not only
should the child‘s inherent qualities such as gender be considered, but the teacher‘s
attributes should be accounted for as well. Past studies of student-teacher relations have
emphasized student characteristics as predictors, with a lack of focus on teacher
characteristics that affect the degree of closeness in these relationships (Yoon, 2002). For
instance, student academic orientation, in-class behaviors, and social competence have
been the foci of many studies that investigated variability in teacher-student relations
(e.g., Eisenhower, Baker, & Blacher, 2007; Murray & Murray, 2004). Yet, student-
teacher relations are products of individual characteristics, student-teacher interactions,
and the classroom and school context (Pianta, 1999). Although students influence the

13
student-teacher relationship, teacher traits also affect this bond. Furthermore, students are
customarily clustered within a classroom run by a teacher, making it obvious that
teachers affect student-teacher relations for many students. The present study focuses on
student-teacher closeness by examining both student and teacher characteristics, as well
as the interactions between the two groups‘ traits.
Despite increasing racial diversity in the U.S., the role of race has largely been
ignored in studies about student-teacher relations. In the few studies that examined race,
Asians have not been a focus of inquiry. Yet, this minority group is the second fastest
growing racial minority group in the U.S.; the Asian population is predicted to double by
2050 (U.S. Census Bureau, 2008). School-based studies about Asian American students
are necessary. The present study aims to add to this literature.
Student Characteristics
Gender, socioeconomic status, and grade-level. Many studies have shown that
teachers, on average, feel closer to girls than to boys (e.g., Murray & Murray, 2004; Saft
& Pianta, 2001). Ladd, Birch, and Buhs (1999) found that children from lower
socioeconomic status had more distant relationships with their teachers than their
wealthier peers. The grade-level of the student affects student-teacher closeness as well.
Students in middle school reported less secure relationships with their teachers than
children in elementary grades (Lynch & Cicchetti, 1997). Lynch and Cicchetti defined
―secure‖ as relational patterns characterized by high levels of positive emotion and
average to high levels of psychological closeness.
Race. In a recent study using a large sample (N = 25,642 students rated by 1,186
teachers), Yiu (2010) found that only Caucasian students received student-teacher

14
closeness ratings above the grand mean using an adaptation of Pianta‘s (2001) STRS, and
the remaining three racial minority groups (i.e., African American, Hispanic, and Asian)
obtained ratings that were lower than their non-minority peers. Surprisingly, Asian
American students were not rated by teachers as being the closest even though, on
average, Asian American students were rated the highest on an adaptation of the Teacher
Observation of Classroom Adaptation-Revised (TOCA-R; Werthamer-Larsson, Kellam,
& Wheeler, 1991) behavioral engagement scale and the lowest on externalizing behaviors.
This finding was contrary to expectations because previous studies had demonstrated that
higher on-task behaviors resulted in higher closeness in the student-teacher relationship.
For instance, Skinner and Belmont (1993) found that teachers‘ ratings of their liking,
appreciation, and enjoyment, as well as their understanding, sympathy, and knowledge of
students, correlated with teacher-perceived student behavioral engagement in the
classroom (r = .56). Thus, race may moderate the effect of student behavior on the
student-teacher relations. Yiu‘s exploratory study did not examine the role of teacher race
on student-teacher relations.
English proficiency. Fumoto, Hargreaves, and Maxwell (2007) reported that
early childhood teachers‘ ratings of the degree of closeness in the student-teacher
relationship was lower for four year-old children with less experience in spoken English
than those who were more proficient English speakers in the beginning of the school year,
but that these differences were not observed by the end of the academic year. The authors
conjectured that such results indicated the importance of oral communication in the
closeness of student-teacher relationships, which is heavily influenced by the student‘s
level of English proficiency.

15
Behavioral engagement. In a comprehensive review by Fredricks, Blumenfield,
and Paris (2004), school engagement has been identified as a multifaceted construct with
three distinct dimensions: behavioral, emotional, and cognitive. Research on elementary
school students‘ school engagement tends to focus on the behavioral aspect of
engagement. Behavioral engagement entails such behaviors as observed student effort in
school-related activities, persistence, attention, concentration, and on-task behaviors.
Positive behavioral engagement has been shown to correlate with positive academic
outcomes (r > .40, p < .001; Finn, Pannozzo, & Voelkl, 1995). Since higher academic
achievement correlates with more positive student-teacher relations, behavioral
engagement is important when assessing the student-teacher relationship.
Externalizing and internalizing behaviors. Ladd and Burgess (1999) and
Henricsson and Rydell (2004) investigated the trajectories of interpersonal relationship
development in children as influenced by the child‘s behaviors. Ladd and Burgess were
interested in the differences in these interpersonal outcomes for children rated more
severely as aggressive and/or withdrawn by their teachers, versus their peers who
received average ratings on these behaviors. Research have shown that children with
confrontive forms of aggression (e.g., arguing, hitting, and pushing; Ladd & Burgess,
2001) are at risk for negative relationship development (Coie & Dodge, 1983). Ladd and
Burgess reasoned that negative relational outcomes resulted from these behaviorally at-
risk children‘s tendency to distance themselves from others. Further, others might feel
less invested in developing a relationship with aggressive children because it might
require more effort to engage in such relationships with aggressive children than with
children without such behaviors (Ladd & Burgess, 1999). On the other hand, children

16
who are withdrawn tend to engage in activities alone. As a result, children who exhibit
withdrawn behaviors fail to learn social skills such as reciprocity and building emotional
ties that allow for creating and continuing interpersonal relationships (Hartup, 1983, as
cited in Ladd & Burgess, 1999). Naturally, children who display comorbid aggressive
and withdrawn behavioral patterns may be at even greater risk for undesirable relational
development trajectories.
In their longitudinal study of two cohorts totaling 250 children and 34 teachers
from kindergarten through second grade, Ladd and Burgess (1999) tested the above
hypotheses using a combination of student self-reports, teacher ratings of student
behaviors, and peer friendship nomination and ratings data administered at four time
points throughout the study. Using teacher ratings, students were classified as normative,
aggressive, withdrawn, or comorbid aggressive and withdrawn. Taking a slightly
different approach, Henricsson and Rydell (2004) also examined teacher-child relations
by analyzing classroom interactions, as well as both the child‘s and teacher‘s perceptions
of their relationship, in a sample of 95 Swedish first grade students selected from a pool
of 526 students based on their teacher-rated (N = 23 teachers) behavioral scores (n = 26
externalizing, 25 internalizing, and 44 problem-free). The following paragraphs describe
the results from these two studies.
Externalizing. Ladd and Burgess (1999) found that, on the Student-Teacher
Relationship Scale: Closeness subscale (range 1 to 5), children who were comorbid
aggressive and withdrawn were rated lowest at all measurement points (M = 3.34),
followed by students who were only aggressive (M = 3.61), only withdrawn (M = 3.84),
and the closest to the normative behavior group (M = 4.12). Findings by Henricsson and

17
Rydell (2004) showed that, contrary to expectations, children characterized by
externalizing behaviors had more positive teacher interactions than problem-free students.
At the same time, however, externalizing students had more mutual anger interactions
with teachers than nonproblematic children. This leads to the question of what was
actually measured when using frequency of interactions with teachers as a proxy for the
student-teacher relation construct, implying a need to distinguish between number of
interactions and relationship quality.
Externalizing students had the most conflicts with their teachers (Henrisson &
Rydell, 2004), while internalizing students received the lowest conflictual relation ratings
out of the three groups studied (i.e., externalizing, internalizing, and problem-free).
Similarly, on the teacher-student conflict measure, Ladd and Burgess (1999) reported that
students in the aggressive and comorbid groups were rated as having more conflictual
relationships than were students in the withdrawn and normative groups.
Internalizing. Children classified as shy have been reported to be less likely to
initiate social interactions with peers than their non-shy peers (Rydell, Bohlin, & Thorell,
2005). This may be attributed as a lower level of social competence, or, Rudasill and
Konold (2008) suggested that shy children were also more likely than their peers to
exhibit other forms of prosocial behaviors, such as showing empathy and conscience.
Rydell et al. further hypothesized that shy children may be less likely to engage in
conflictual relationships with their teachers because of their generally lower rates of
antisocial behaviors. On the other hand, Yiu (2010) found a negative relationship
between internalizing behaviors and student-teacher closeness (r = -.46), and a positive
association between internalizing behaviors and student-teacher conflicts (r = .26).

18
Achievement. Buriel (1983) demonstrated that, as might be expected, student
achievement was negatively correlated with teacher criticism. In other words, students
who performed better in school received less teacher criticism than their lower-
performing peers. Along the same lines, Murray and Murray (2004) found that teacher-
perceived student academic orientation, as measured by student attendance and teacher-
rated student effort, explained an additional six percent of the variance on the STRS
closeness subscale when student demographic variables (i.e., race, gender, and disability
status) were held constant.
Teacher Characteristics
Gender. Little research has examined the effect of teacher gender in student-
teacher closeness, usually due to the small samples of male teachers in studies (e.g., Saft
& Pianta, 2001). Nonetheless, since teachers generally rate closer relationships with girls
than boys, teacher gender likely affects student-teacher closeness as well.
Grade-level taught. As students progress in grades, teachers are less likely to rate
student-teacher closeness as highly as when students were in lower grades (Pianta &
Stuhlman, 2004).
Teacher beliefs. Attitudes and beliefs that teachers form about populations
influence how they interact with students from these populations (Pianta, 1999). For
instance, Asian students, who may be believed by teachers to be the ―model minority,‖
are expected to be academically oriented and well-behaved, yet quiet and reserved
(Chang & Demyan, 2007; Chang & Sue, 2003; Rosenbloom & Way, 2004). Other studies
revealed differences in teacher perceptions of the appropriateness of student behavior due
to the student‘s race (e.g., Entwisle & Alexander, 1988; Pigott & Cowen, 2000). Such
19
assumptions may lead teachers to interact with students from diverse races differently by
reacting to students according to implicit biases, ultimately affecting student-teacher
closeness.
Teacher-Child Interactions
Racial match. Kesner‘s (2000) study revealed that Caucasian teachers rated
minority students as significantly more dependent than Caucasian students. In his
correlational study, Buriel (1983) observed that Mexican American students received less
teacher affirmation for correct responses than Caucasian students. Buriel also found that
teacher affirmation was correlated with positive academic achievement for the Mexican
American students, but not for Caucasian students. Buriel only sampled from five
classrooms, which might limit the generalizability of the results to other settings. Along
the same lines, Saft and Pianta (2001) employed teacher-student racial match as a
predictor for teacher-student relationship outcomes in regression analyses whereas
Zimmerman, Khoury, Vega, Gil, & Warheit (1995) utilized analysis of variance
procedures to observe mean differences between teacher (N = 236) rated student behavior
scores for 2,389 subjects of various racial groups (68% Hispanic, 14% African American,
18% White). Both studies found evidence that teachers were significantly more likely to
rate children more positively if their own race matched the students‘ race. In particular,
Saft and Pianta found racial match to be significant for all three racial groups examined
(Caucasian, African American, and Hispanics), in explaining variance in STRS overall
ratings (i.e., Conflicts, closeness, dependency; β = .16). They also found that the positive
influence of racial matching was most significant for the Hispanic dyads. Racial match
was the only significant predictor of Closeness (β = .16; other predictors were the child‘s

20
age, race, gender, and interaction terms among these predictors). On the other hand,
Zimmerman et al., who looked at teacher-rated behavior problems as predicted by
student-teacher racial match, found that racial match was significant only for the African
American teacher-student dyads but not for Hispanic and Caucasian students.
Gender match. Research has found that girls consistently get higher teacher-
rated closeness than boys do (e.g., Saft & Pianta, 2001), but these studies did not have a
large enough sample of male teachers to use teacher gender as a predictor for student-
teacher closeness.
Present Study
Taken together, the evidence points to the positive influence of emotional support
provided by close teacher-student relationships on children‘s adjustment, both
academically and psychosocially. Since close student-teacher relations are associated
with important student outcomes, it makes sense to examine the factors that lead to
increased closeness between students and teachers in order to understand better how
teachers can provide an optimal environment in which their students may develop.
Several studies (e.g., Ladd & Burgess, 2001; Pianta & Stuhlman, 2004) used multiple
methods such as different raters to gauge protective and risk factors like emotional
support and aggression in the classroom. Some studies (e.g., Meehan et al., 2003) lacked
statistical conclusion validity due to their small sample sizes. Specifically, small sample
sizes restricted the studies‘ statistical power, and small effects may have gone undetected.
Even with larger student samples, the number of teachers determined the effective sample
size for the studies because students were rated by their teachers. Nonetheless, many of
the studies cited (e.g., Hamre & Pianta, 2005; Pianta et al., 2008) possessed good

21
statistical power by having larger sample sizes. On the other hand, these studies derived
their samples from the same study, and were also conducted by some of the same
researchers. Replications in other samples are needed. The use of teachers as the primary
rater for both response and predictor variables threatens the construct validity of these
studies, as it is unclear whether the results indicated theorized constructs, or merely
reflected method variance due to the use of teacher ratings. In these cases, designs that
allowed for the separate estimation of influences of construct and method variance would
have helped to reduce this confound. Few studies employed a nested design in their
analytic approach. Moreover, in every study reviewed, the students sampled were mainly
identified as Caucasian, with African Americans being the largest racial minority, which
showed that differences exist between teacher ratings of this minority group and their
peers. None of the studies had a sample large enough to list Asian American students as a
major subgroup. Thus, the generalizability of the results to all students is unclear,
especially in regard to Asian American students.
A gap exists in the literature for students of Asian descent. Due perhaps to their
typically higher academic performance than students of other racial groups, psychosocial
wellbeing of Asian American students has often been ignored (Qin, Way, & Mukherjee,
2008). Although Asian American students may outperform their non-Asian peers
academically, how teacher-student relations affect their psychosocial wellbeing must not
be overlooked. Suh and Satcher‘s (2005) small-scale, qualitative study on interventions to
increase school adjustment for Korean American students suggested that these students
may require teacher sensitivity and personal (i.e., one-on-one) involvement. As noted by
22
the U.S. Department of Health and Human Services (2001), a limited research base exists
on the mental health status of Asian American and Pacific Islander children.
One purpose of this study is to extend previous research to see if findings also
apply to Asian American students.
Although the literature has established student-teacher relations characterized by
warmth and closeness as significant social bonds for children that correlate with
increased academic achievement and social adjustment, these studies were predominately
descriptive and correlational rather than experimental. To my knowledge, no study had
investigated the predictors for student-teacher relational closeness using a nested analysis
approach and examining teacher beliefs about students as sources of variations in student-
teacher closeness.
A second aim of the current study is to examine the plausibility of some causal
hypotheses about factors that lead to close student-teacher relations.
A third, incidental, goal of the study is to examine the criterion-related validity
and stability of an adaptation of Pianta‘s (2001) Student-Teacher Relationship Scale:
Closeness.
In short, the present study investigates factors that predict closeness in student-
teacher relationships using both student- and teacher-level variables, as well as the
interactions between them. The operational definition for student-teacher closeness for
this study is Pianta‘s (2001). Specifically, student-teacher closeness is the social
relationship between a teacher and a specific student characterized by the teacher‘s
perception that the child is warm and affectionate, who makes initiatives to seek
23
emotional support from the teacher. The following specific questions guided the main
analyses:
1. How much individual student variance observed in teacher ratings of
closeness is accounted for by student attributes such as race, gender, socio-economic
status, English Speaker of Other Languages (ESOL) status, academic achievement, and
in-class behaviors?
2. Beyond individual student differences, how much do teacher characteristics,
such as race, and personal beliefs regarding how groups of students learn, explain the
variance observed in teacher ratings of closeness in student-teacher relationships?
3. To what extent are predictors of student-teacher closeness the same or
different for students of different races? Does teacher race interact with student race in
predicting closeness?
Hypotheses
Based on the reviewed literature, I hypothesize that, on average, student-teacher
relational (STR) closeness scores would be higher for girls than for boys, for students of
higher SES, and for students not in the ESOL program. Students who demonstrate higher
engagement and lower levels of externalizing and internalizing behaviors are predicted to
obtain higher STR closeness ratings on average. Students of minority racial status are
predicted to receive lower STR closeness ratings than their non-minority peers, on
average. Finally, students with lower achievement are predicted to be rated lower on
closeness.
I hypothesize that teachers who teach lower grades would feel closer to their
students. Female teachers are predicted to feel closer to students than are male teachers,

24
and that teachers of lower grade-levels would feel closer to students than teachers who
teach higher grade-levels. I predict no effect of teacher race on student-covariate-adjusted
closeness ratings. I also hypothesize that teachers with more positive beliefs about
specific groups of students would feel closer to students in general.
Finally, I hypothesize that a racial match or a gender match between student and
teacher will contribute unique variance in STR closeness beyond the contribution of other
variables. Teachers with more positive beliefs about certain groups of students will feel
closer to that specific student group than students from other racial groups.
Method
Participants
As part of a larger study, teachers in first through fifth grades in 45 elementary
schools within the same suburban school district rated their students‘ behaviors. A
sample of general education teachers (N = 873) rated a total of 18,609 students‘ behaviors.
After filtering out subjects with incomplete data, the final dataset included N = 754
teachers and N = 16,084 students. Descriptions of the sample in terms of race and gender
are presented in Table 1. Students‘ mean age by grade level is presented in Table 2. Table
3 presents demographics by grade.
Procedure
Forty-five elementary schools in a large, suburban school district located in a
Mid-Atlantic state were recruited for a study (Rosenfield & Gottfredson, 2004) of the
effectiveness of Instructional Consultation Teams (Rosenfield & Gravois, 1996). The
study involved four waves of annual data collection beginning with the 2005-06 school
year. The present study examined predictors in the final wave of data (2008-09).

25
Student demographics were extracted from school system records. Teacher
demographics were provided by the schools‘ program evaluation office and from a
teacher self-report survey.
All teachers in the 45 participating schools were asked by the district to complete
a Teacher Report on Student Behaviors (TRSB) questionnaire for each of their students
in the beginning of the second semester of the academic year. Only general education
teachers were included in the present study. Each student was rated by exactly one
teacher for that academic year. The TRSB survey was administered via the school
district‘s intranet. The school district allocated time and computer access for teachers to
complete the survey. The response rate for the TRSB survey was 93% in 2008-09.
Separately, the University of Maryland research group asked teachers to complete
a teacher self-report (TSR) questionnaire. The TSR was administered online using
SurveyMonkey and participation was voluntary. One week prior to survey collection, a
memo was sent to each teacher in the schools along with a small gift (a notepad). On the
first day of data collection, electronic mail with an invitation and instructions on
completing the survey were sent to teachers. In addition, paper memoranda were placed
in teachers‘ school mailboxes to encourage response. Survey directions included a web
link to access the questionnaire on SurveyMonkey. Every four to five days, a reminder
email was sent to teachers who had not yet responded. The response rate for the TSR was
84% in the 2009 data collection. The teacher self-report survey is described by Vu et al.
(2010).
Measures

26
Student predictor variables. These were student gender, race, English Speaker
of Other Languages status, free and reduced meal program status, academic achievement,
and teacher-rated behaviors (engagement, externalizing, internalizing).
Gender. School records identified each student or teacher as male (1) or female
(0).
Race. School records indicated the racial group membership of students using
seven categories: American Indian/Alaskan Native, Asian, Black, Hispanic, Caucasian,
Hawaiian, and unspecified. Race was coded as three dummy variables with Caucasians
serving as the reference group.
English for Speakers of Other Languages (ESOL). School records identified
students as ESOL (1) or not (0).
Free and reduced meal (FARM). School records indicated if students received
FARM services (1) or not (0). FARM was used as an indicator of disadvantaged
socioeconomic status.
Academic achievement. Students‘ average report card grade (GPA) from the prior
year was used to measure academic performance. GPA was measured as continuous, with
the highest score at 4.00. Using the previous year‘s GPA was an attempt to remove
potential criterion contamination between teacher-rated academic performance and
teacher-rated closeness scores.
Behavioral engagement. Based on a factor from the Teacher Observation of
Classroom Adaptation-Revised (TOCA-R, Werthamer-Larsson, Kellam, & Wheeler,
1991), the engagement scale measured teachers‘ perceptions of students‘ behavioral
engagement in educational tasks versus off-task behavior or distractibility in the past

27
month. The eight items asked teachers to rate how easily distracted a student was or how
eager the student was to learn on a four-point scale from zero (―Never/Almost Never‖) to
three (―Very Often‖). The internal consistency of the scale in this sample was high, with
α = .92. The score was the average of the eight items, which was standardized to M = 0,
SD = 1.
Internalizing behaviors. Based on the TOCA-R, the eight-item internalizing scale
assessed the student‘s anxious, shy or withdrawal behaviors through four-point items
such as ―seems sad‖ and ―interacts with teachers.‖ The internal consistency of the scale in
this sample was moderately high (α = .84). The metric is again the average rating for the
eight items (range = 0 to 3), which was transformed to M = 0, SD = 1.
Externalizing behaviors. In a recent study, Yiu (2010) observed that teacher
ratings of students‘ aggressive behavior using an adaptation of the TOCA-R (Werthamer-
Larsson et al., 1991) had a correlation of .76 with teachers‘ ratings of STR conflict using
items adapted from Pianta‘s (2001) Conflict scale, which indicated that the two measures
did not show discriminant validity. Thus, only the externalizing behaviors scale was used
the present research. The scale contains eight items from the TOCA-R in which teachers
used a 4-point scale to rate statements such as ―defies teacher or other school personnel,‖
―is disruptive,‖ or ―is physically aggressive or fights with others.‖ The internal
consistency of the scale in this sample was moderately high (α = .90). The metric is again
the average rating for the eight items (range = 0 to 3), which was linearly transformed to
M = 0, SD = 1.
Teacher predictor variables. These were teacher characteristics, including
gender, race, grade-taught, and teacher beliefs about teaching and learning.
28
Grade-taught. Students were nested within teachers and students were assigned to
teachers by grade-level. Since there was no variation among students in grade-level
within teacher, it was treated as a teacher-level predictor. Grade-taught data were
extracted from school records and dummy coded, with fifth grade as the reference group.
Gender. Teachers‘ gender was extracted from school records and coded as an
indicator variable (male = 1, female = 0).
Race. In most cases, teacher race was obtained from school district records. In
cases for which the teacher had a missing race datum in the school-provided demographic
file, self-reported race from the teacher self-report (TSR) questionnaire was used. Race
was coded as four dummy variables (Asian, Black, Hispanic, Native American) with
Caucasians serving as the reference group. No other racial groups for teachers were in the
sample.
Beliefs about teaching and learning. Three items in the TSR assessed teacher
beliefs regarding instruction and learning for racial minority students, which were: (a) I
believe African American males learn differently from other students, (b) I should not be
expected to provide the language services that English Language Learners (ELL) students
require, and (c) I believe Asian students are often difficult to get to know. Items were
Likert-type with five response options from ―Strongly Disagree‖ to ―Strongly Agree.‖
Items were coded so that the most desired responses were assigned a value of 5 and the
least desired a value of 1. Scores were then transformed to M = 0, SD = 1. The three
items were each treated as separate predictors of STRS closeness as they do not form an
internally consistent scale (Johnstun & Yiu, 2010).
Outcome Variable

29
Student-teacher closeness. Derived from Pianta‘s (2001) STRS Closeness scale,
the four-item closeness scale measured the degree of a close teacher-student relationship.
Sample items included ―I share a caring, warm relationship with this child‖ and ―This
child spontaneously shares his/her feelings and experiences with me.‖ Teachers rated
students on a five-point scale ranging from ―Definitely does not apply‖ to ―Definitely
applies.‖ Alpha reliability in this sample was moderately high at .86. The average rating
across the four items was linearly transformed to M = 0, SD =1.
Data Analysis
Due to very small sample sizes of students identified as Alaskan Indian/Native
American and Hawaiian, these subjects were excluded from the predictive analyses.
Further, because the current study focused on racial match as a predictor of student-
teacher closeness, students and teachers who identified as unspecified or other race were
also excluded.
Reliability and predictive validity of the closeness measure. Reliability of the
closeness scale was interpreted from (a) the correlations among students‘ annual
closeness ratings across the four years of the main study, and (b) the intraclass correlation
coefficient and lambda reliability coefficient from the fully unconditional hierarchical
linear model. Predictive validity was examined using the longitudinal correlations of
closeness ratings with other teachers‘ ratings for the same student on other behaviors in
future years.
Hierarchical linear modeling (HLM). The dependent variable was teacher
ratings of individual student-teacher closeness, a student-level variable. Because these
individual ratings of the students were clustered within teachers‘ classrooms, a two-level

30
hierarchical model was required. Data were analyzed using HLM (Raudenbush & Bryk,
2002). The level 1 model included student-level variables: Student race, gender, ESOL
status, FARM status, behavioral engagement, internalizing behaviors, externalizing
behaviors, and previous year‘s GPA. To examine the influence of student characteristics
on closeness, the regression equations were:
0
1
H
ij j hij hij ij
h
Y X r
(1)
0 00j ju (2)
where Yij represents the closeness z-score for child i, rated by teacher j;
β0j is the mean for the reference category (i.e., Caucasian, female, non-ESOL, non-
FARM) evaluated at a value of zero for the remaining covariates;
βhij is the deviation from the reference group mean associated with a unit change in the
respective covariate;
X1ij = Asian student i in classroom j (1 if Asian, 0 otherwise);
X2ij = Black student i in classroom j (1 if Black, 0 otherwise);
X3ij = Hispanic student i in classroom j (1 if Hispanic, 0 otherwise);
X4ij = gender for student i in classroom j (0 = female, 1 = male);
X5ij = ESOL status for student i in classroom j (0 = non-ESOL, 1 = ESOL);
X6ij = FARM services for student i in classroom j (0 = non-FARM, 1 = FARM);
X7ij = Engagement z-score for student i in classroom j;
X8ij = Internalizing behavior z-score for student i in classroom j;
X9ij = Externalizing behavior z-score for student i in classroom j;
X10ij = Previous year‘s GPA z-score for student i in classroom j; and
31
rij is the term due to remaining individual differences and error for student i in
classroom j.
In equations 1 and 2, race, gender, ESOL, and FARM were uncentered indicator
variables; and engagement, internalizing, and externalizing behaviors, as well as previous
year‘s GPA were—because they are z-scores—grand-mean centered. An error term was
included at level 2 to account for the design effect of students nested within teachers. The
regression coefficients in this model reflect the influence of each student characteristic
controlling for the other variables in the model.
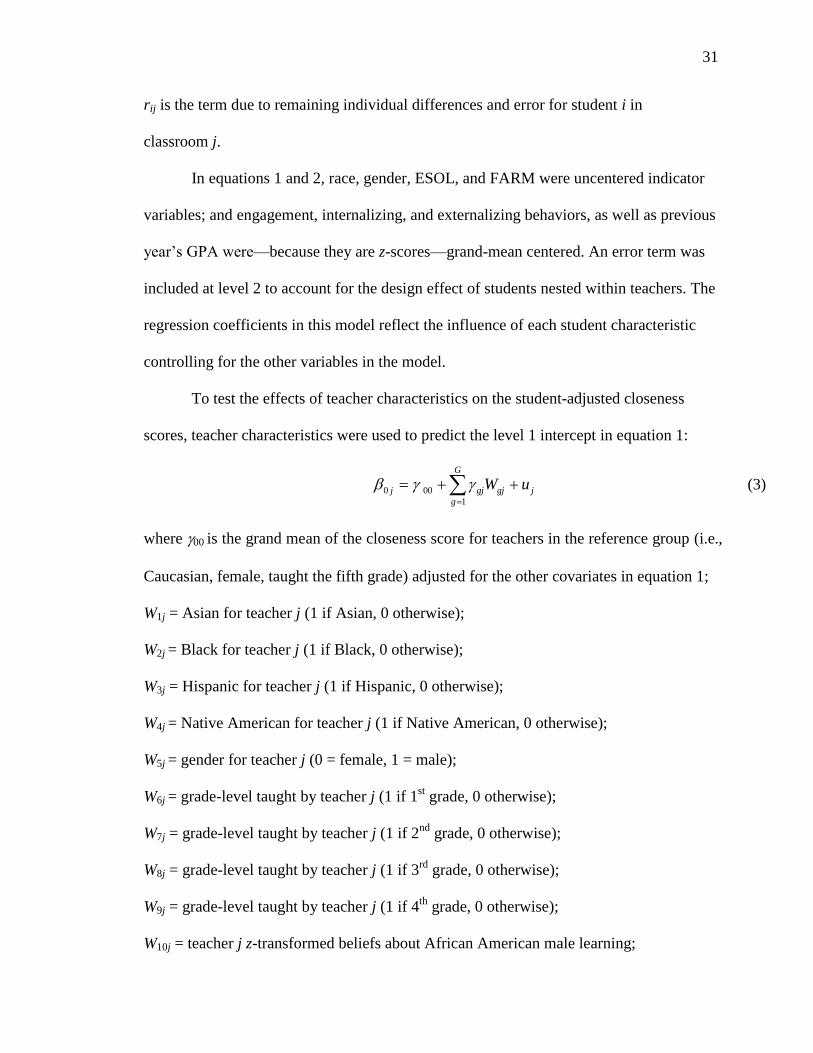
To test the effects of teacher characteristics on the student-adjusted closeness
scores, teacher characteristics were used to predict the level 1 intercept in equation 1:
0 00
1
G
j gj gj j
g
W u
(3)
where 00 is the grand mean of the closeness score for teachers in the reference group (i.e.,
Caucasian, female, taught the fifth grade) adjusted for the other covariates in equation 1;
W1j = Asian for teacher j (1 if Asian, 0 otherwise);
W2j = Black for teacher j (1 if Black, 0 otherwise);
W3j = Hispanic for teacher j (1 if Hispanic, 0 otherwise);
W4j = Native American for teacher j (1 if Native American, 0 otherwise);
W5j = gender for teacher j (0 = female, 1 = male);
W6j = grade-level taught by teacher j (1 if 1st grade, 0 otherwise);
W7j = grade-level taught by teacher j (1 if 2nd
grade, 0 otherwise);
W8j = grade-level taught by teacher j (1 if 3rd
grade, 0 otherwise);
W9j = grade-level taught by teacher j (1 if 4th
grade, 0 otherwise);
W10j = teacher j z-transformed beliefs about African American male learning;

32
W11j = teacher j z-transformed beliefs about providing services to ELLs;
W12j = teacher j z-transformed beliefs about getting to know Asian American students;
uj is the error term at the teacher level for teacher j.
To test interaction effects between teacher and student characteristics, the level 2
model also included teacher variables that might account for variability in other
coefficients at level 1. Thus, in addition to equation 3, the slopes were predicted using
teacher variables:
0
1
G
hj h gj gj j
g
W u
(4)
Whether coefficients should be fixed or free across teachers was tested using
group-mean centering at level 1. If the null hypothesis of equal coefficients was not
rejected at the p < .05 level, they were fixed in the model. For instance, if random
variance was found in the coefficients for race at level 1, then further analyses were
conducted using the level 1 student race coefficients as the dependent variables to
evaluate the extent to which teacher race moderates the effect of student race (a cross-
level interaction). However, if the homogeneity hypothesis were retained, then the slope
for the variable was fixed in the model. Regardless, grand-mean centering was used to
test for main effects of teacher-level continuous variables on student-teacher closeness.
Specifically, level 2 effects on the intercept at level 1 (using β0j as the dependent variable)
used uncentered indicator variables and grand-mean centered continuous z-transformed
variables. When βhj (h ≠ 0) was the dependent variable, group-mean centering was used at
level 1 because then these beta coefficients were estimates of the within-teacher
regression coefficients to show the effects of interactions between a teacher and the
students whom she rated, after adjusting for the deviation of student characteristics from

33
the classroom mean. Thus, Equation 5 is exchanged for Equation 1 as the level-1
equation.
0
1
( )H
h jij j hij hij ij
h
Y X X r
(5)
Missing data. A variable was constructed to indicate whether a student had
complete data on the teacher rating scales and previous year‘s GPA (coded 0) or had
missing data (coded 1). The assumption of randomly missing data was then tested using
multilevel logistic regression analysis, regressing the log odds that children had missing
data on the student predictors at level 1. Examination of the data revealed significant
differences in the rate of missingness of the TRSB rating scales among the various
student racial groups at the p < .05 level. A multiple imputation procedure using the
NORM software (Schafer, 2000) was used in which ten sets (Rubin, 1987) of imputed
data were estimated and then averaged to impute missing data.
Results
Closeness Scale
Reliability. Table 4 shows the correlations among students‘ closeness ratings by
teachers over four consecutive years. These are predominantly different teachers in
different years because pupils change teachers as they advance through the grades.
Accordingly error associated with rater and error associated with time are both included
in the definition of error when these correlations are viewed as reliability coefficients. All
correlations were significantly different from zero at p < .001 and fluctuated around r
= .20 in size. The intraclass correlation coefficient indicated that 41% of the variance in
closeness ratings was between teachers (see Table 5). One interpretation of the intraclass
correlation is that the single-occasion reliability of a rating of a single student as a

34
measure of the teacher’s rating disposition is .41. Each teacher rated many students and a
mean rating can be calculated. An estimate of the reliability of the mean rating as a
measure of the teacher’s rating disposition for teachers with the average number of
students rated is lambda-hat (Raudenbush & Bryk, 2002) and for this sample equals .94.
Predictive validity. Table 6 shows the correlations among all teachers‘ ratings of
students during the baseline year and correlations among measures over all four years.
Longitudinal correlations involving closeness ratings over time were small in size but
significantly different from zero at p < .001, and the relationships ranged from an
absolute value of r = .1 to .2. In other words, approximately 1 to 4% of the variance in the
other teacher rated student behaviors in future years is associated with student-teacher
closeness. The longitudinal correlations were about .2 between closeness and engagement;
about -.1 between closeness and externalizing behaviors; about -.2 between closeness and
internalizing behaviors; and about -.1 between closeness and student-teacher conflicts.
The table shows only weak evidence of convergent and discriminant validity, as the
correlation of closeness in one year with closeness ratings in other years is generally only
slightly higher in absolute value than its correlation with other rating scales—indeed it is
sometimes less than correlations with ratings of other student characteristics.
Multicollinearity Diagnostics
Correlations. The bivariate correlations among student-level variables are shown
in Table 7. Student-teacher closeness was statistically significantly correlated with all
student-level predictors at the .05 level. In general, lower STR closeness was associated
with students who were non-Caucasian (r = -.07 to -.02), male (r = -.18), ESOL (r = -.05),
FARM-eligible (r = -.08), rated as more internalizing (r = -.46), or more externalizing (r

35
= -.22). Higher student-teacher closeness scores were associated with students who were
Caucasian (r = .09), rated as more engaged (r = .40), or had higher GPA (r = .16). A high
degree of association between being Hispanic and ESOL status was observed (r = .69), as
well as between engagement and externalizing (r = -.52). Special attention to these
predictors was given in the subsequent procedure to assess multicollinearity.
Multiple regression. Student-level covariates were tested for presence of
multicollinearity by comparing the standardized partial regression coefficients obtained
from a multiple regression of closeness on all student characteristics with the
corresponding zero-order correlation for each covariate (see Table 8). When ESOL was
included in the model, inflated coefficients were observed, and ESOL was dropped from
the model. Similarly, FARM status introduced inflations in the coefficients when it was
included. Both ESOL and FARM were dropped from the final model.
Level-2 predictors were then added one by one in order to evaluate changes in the
coefficients observed as a new predictor was added. No dramatic increases in the partial
regression coefficients from their respective zero-order relationship with closeness were
observed. Multicollinearity among the level-2 variables was not of concern.
Model specification. The student level model initially included all proposed
variables at level-1 with no predictors or error terms at level-2 to determine which student
characteristics significantly predicted closeness. Using a backward elimination procedure,
non-significant covariates were deleted from the model. The resulting student-level
model included the student race indicator variables, gender, engagement rating,
externalizing rating, internalizing rating, and previous year‘s GPA. ESOL and FARM

36
indicator variables were dropped. This conclusion converged with that of the
multicollinearity diagnostic check described earlier.
Sources of Variations in Student-Teacher Closeness
The intraclass correlation coefficient (ρ) calculated from the fully unconditional
model supported between-teacher differences in student-teacher closeness ratings (see
Table 5). The ρ of .41 means that 41% of the variance in closeness lied between teachers;
59% of the variance was within teacher (individual child differences and error).
Whether level 1 slopes should be fixed or random was determined by first
allowing all slopes to vary to test whether the null hypothesis of equal between-teacher
slopes could be retained. Group mean centering was used at level-1. HLM results
indicated that the slopes for student being Hispanic, male, engagement, externalizing
behaviors, internalizing behaviors, and the previous year‘s GPA varied between teachers.
The level-1 slopes for student Asian and Black indicator variables were fixed and did not
vary between teachers.
Student Effects on Closeness
Table 9 displays the results for student effects on closeness while taking into
account the nested nature of students within teachers by including an error term at level-2
in HLM. The intercept refers to the average closeness rating for Caucasian, female
students, adjusted for externalizing, internalizing, and engagement ratings and prior
grades. The parameter estimates may be interpreted as the average effect of student
characteristics across teachers. Generally, teachers rated their relations with boys as less
close than with girls (β4 = -.242, SE = .012). In other words, boys scored almost a fourth
of a standard deviation lower than girls on the student-covariate-adjusted closeness score.

37
Student race accounted for significant variance when student gender; engagement,
externalizing, and internalizing ratings; and previous year‘s GPA were statistically
controlled. Being Asian, Black, or Hispanic resulted in lower closeness ratings, on
average (β = -.172, -.076, and -.085, respectively; SE = .022, .015, and .016, respectively).
Specifically, on average, Asian students scored the lowest on closeness when other
student traits were accounted for, scoring about one sixth of a standard deviation lower
than Caucasian students on the covariate-adjusted closeness score. Next were Hispanic
students, who scored about one 12th
of a standard deviation lower than Caucasians; and
Black students scored about one 13th
of a standard deviation lower than Caucasians.
In terms of students‘ in-class behaviors as predictors for student-teacher closeness,
internalizing behaviors had the largest standardized partial regression coefficient. On
average, as students‘ internalizing behavior rating increased by one standard deviation
above the grand mean, teachers rated them almost a third of a standard deviation lower on
closeness (β6 = -.308, SE = .009). Student engagement had the next biggest coefficient,
with more engaged students receiving higher closeness ratings (β5 = .160, SE = .010).
Thus, when the other covariates were held constant, as students‘ engagement score
increased by one standard deviation above the grand mean, they were rated about a sixth
of a standard deviation higher on closeness. Finally, students‘ level of externalizing
behaviors had a much smaller partial coefficient. When the other covariates were held
constant, as students‘ level of externalizing behaviors increased by one standard deviation
above the grand mean, teachers rated them about one 12th
of a standard deviation lower
on closeness (β7 = -.083, SE = .009).
38
Students‘ academic achievement was a significant, negative predictor of student-
teacher closeness (β8 = -.062, SE = .008) beyond the variance explained by student race,
gender, and in-class behaviors. A higher GPA in the previous year was correlated with
lower closeness ratings such that as students‘ previous year‘s GPA increased by one
standard deviation above the grand mean, teachers rated them about one 16th
of a
standard deviation lower on closeness, on average.
Teacher Effects on Closeness
To determine which teacher characteristics predicted closeness after adjusting for
student characteristics, the intercept at level-1 was regressed on all proposed teacher
covariates with grand mean centering at level-1 as presented in Table 10. After taking
into account student characteristics, teacher race, grade-level taught, and belief about
Asian students contributed additional variance to closeness scores. Though in the
expected direction, the effect of the teacher being male did not predict closeness ratings
statistically significantly. Teachers‘ beliefs about African American and ESOL students
also were not unique predictors of student-adjusted closeness scores. The intercept (γ00
= .027) refers to the mean student-adjusted closeness rating given by Caucasian teachers
who taught the fifth grade, and responded at the grand mean on the belief item (i.e., z-
score = 0).
Controlling for the grade-level taught, and beliefs about Asian students, the
intercept-as-outcome model indicated significant effects of teacher race on closeness
ratings adjusted for student characteristics: Asian teachers were more likely than
Caucasian teachers to give higher student-teacher closeness ratings (γ1 = .225, SE = .063).
Teachers identified as Black or Hispanic gave lower closeness ratings than did Caucasian

39
teachers (γ2 = -.172, SE = .079 for Black teachers; γ3 = -.259, SE = .115 for Hispanic
teachers). In other words, Asian teachers felt almost a fourth of a standard deviation
closer to students than did Caucasian teachers, whereas Black teachers felt about one
sixth of a standard deviation less close to students, and Hispanic teachers felt more than a
fourth of a standard deviation less close to students than did Caucasian teachers. Due to
the tiny sample size for Native American teachers, the results from these teachers are not
interpreted.
The grade-level taught was significant in predicting how close teachers felt to
students after adjusting for student characteristics. On average, teachers who taught lower
grades reported feeling closer to students than teachers who taught higher grade-levels.
The regression coefficients for first through fourth grades were γ = .318, .258, .206,
and .164, respectively (SE ranged from .068 to .075). Fifth grade served as the reference
category. Teachers who taught grades one through four gave higher closeness ratings
than teachers who taught the fifth grade, with teachers in grade one feeling the closest to
their students (about a third of a standard deviation higher than fifth grade teachers),
followed by teachers in grade two, then grade three, four, and finally, fifth grade teachers
felt the least close to their students.
The mean raw scores of teacher belief items by teacher race are presented in
Table 11 and the standardized deviations from the mean by race—rescaled so that group
differences are easier to interpret in terms of the standard deviation of each item‘s
distribution—are graphically presented in Figure 1. Asian teachers are most likely to
believe that African American students learn differently, are relatively likely to believe
that helping English language learners is their responsibility, and reject the notion that
40
Asian students are difficult to get to know. Hispanic teachers are also positively disposed,
on average, to the notion that they have responsibility for helping English language
learners.
Teacher beliefs about Asian students predicted student-covariate-adjusted
closeness uniquely. After controlling for teacher race and grade taught, teachers who
more strongly believed that Asian students were not difficult to get to know felt closer to
students, on average (β = .089, SE = .025). A one standard deviation increase in
agreement with the statement that Asian students were not difficult to get to know was
associated with an increase of one 11th
of a standard deviation in closeness. Teachers‘
beliefs about ESOL and African American students‘ learning did not affect the student-
adjusted closeness ratings.
Interactions Between Student and Teacher Characteristics
The slopes determined to vary across teachers in previous steps (i.e., Hispanic
students and student gender) were predicted in a slope-as-outcome model to assess cross-
level interactions. In addition, although the slopes for Asian and Black did not vary
across teachers, they were considered random in separate analyses because of a
theoretical interest to examine the effect of a student-teacher racial match on student-
teacher closeness. For each slope-as-outcome model, only teacher characteristics with
obvious possible relevance to the student characteristic the slope for which was being
examined were included. Specifically, teacher gender was entered as a predictor for the
student gender slope; teacher Asian indicator, beliefs about teaching ESOL students, and
beliefs about getting to know Asian students were entered as predictors for the slope of
Asian students; teacher Black indicator and teacher beliefs about African American

41
students were entered as predictors for the slope of Black students; and teacher Hispanic
indicator and belief about teaching ESOL students were entered as predictors for the
slope of Hispanic students.
The ESOL belief item was examined for an interaction effect with Hispanic and
Asian students‘ slopes to explain closeness scores because the bivariate correlations
indicated that these two racial groups were significantly and positively related to ESOL
status. The results concerning cross-level interaction effects are reproduced in Table 12.
The intercept-as-outcome equation included only those teacher variables
determined in the previous steps to be significant predictors of student-teacher closeness.
This was included for completeness.
Gender match. Holding constant student race, in-class behavior ratings, and
previous GPA, male teachers rated higher student-teacher closeness with students who
were boys than with students who were girls (γ4,5 = .106, SE = .046), on average. When
the other covariates were held constant, a male teacher rated boys about a tenth of a
standard deviation higher in closeness than they rated girl students.
Racial match. Holding constant student gender, in-class behavioral ratings, and
previous GPA, Black teachers gave higher closeness scores for Black students than
students of other races (γ2,2 = .096, SE = .040). When the other covariates were held
constant, Black teachers rated Back students almost a tenth of a standard deviation higher
in closeness than they rated other students, on average. Though in the expected, positive
direction, a significant racial match interaction was not observed for the Asian or
Hispanic dyads.

42
Student race and related teacher belief. Holding other student predictors
constant, teachers who agreed more strongly that it is not difficult to get to know Asian
students rated Asian students higher than other students on closeness (γ1,12 = .077, SE
= .024). A one standard deviation increase in disagreement level with the statement that
Asian students are often difficult to get to know resulted in an increase in closeness by
one 13th
of a standard deviation. Teacher beliefs about support for ESOL students did not
interact significantly with Asian student racial identity to influence the closeness rating.
Teachers who more strongly believed that it was their responsibility to provide
learning support for ESOL students felt closer to Hispanic students than students of other
races when other student characteristics were held constant (γ3,11 = .044, SE = .016). Thus,
as teachers increased by one standard deviation on their agreement level with the
statement that they should be expected to support ESOL students, closeness increased by
one 23rd
of a standard deviation.
Teacher beliefs about African American male student learning differently from
other students or not did not account for significant variance in the slope for Black
students in predicting student-adjusted closeness ratings.
Discussion
Teacher-Rated Closeness
The literature on student-teacher closeness is confusing. No clear definition of this
construct has been operationalized, and it is convoluted with terms like ―emotional
support‖ or the degree of ―warmth‖ in the relationship. Needless to say, the psychometric
properties of a scale that purports to measure a murky construct have not been thoroughly
investigated. The present study found that 41% of the variance in student-teacher
43
closeness ratings was between teachers. This finding suggests that the current adaptation
of Pianta‘s (2001) STRS Closeness scale provides a reliable measure of teachers’
disposition for closeness at the classroom level ( = .94). In other words, this scale may
reflect teacher personality. Though not an entirely new finding, this result has not been a
focus of the student-teacher closeness literature in the past. For example, Baker, Grant,
and Morlock‘s (2008) study to predict elementary students‘ school adaptation variables
consistently showed that classroom teachers contributed the most variance to the
criterion variables among other predictors such as STRS Closeness and Conflict.
The current adaptation of a scale to tap student-teacher closeness contained four
items, three of which described children‘s tendencies to approach their teachers socially,
and the remaining item approximated the degree of social reciprocity in the student-
teacher relationship. Thus, besides the scale potentially reflecting teacher disposition, it
may also have culturally-loaded elements. For example, in the case of Asian students,
some cultural psychologists make a distinction between Western societies as
individualistic in which individuals are expected to take initiatives and approach others
openly, and Eastern societies as collectivist in which individuals are expected to blend in
and keep more defined personal boundaries, especially between generations (Kingston &
Forland, 2008; Lin & Fu, 1990). Parallel arguments related to Black persons‘ and
Hispanic persons‘ differing cultural expectations about close student-teacher relationships
could be made. Therefore, a legitimate question about the closeness scale is which aspect
of closeness it might be measuring, assuming that relational closeness is a construct with
different aspects especially when cultural differences are taken into account.

44
Although the current closeness scale may possess cultural ―glitches,‖ and despite
a strong tendency for teachers to rate in a certain direction, race and beliefs still influence
student-teacher closeness as measured from a perspective that approximates how
European Americans view closeness. This finding is important because according to
Kellam et al. (1975), psychological adjustment has two components, one of which
involves others‘ perception of the individual. Thus, students might be expected to exhibit
this aspect of closeness in order to adapt optimally as residents of the United States. It is
primarily from this perspective that student-teacher closeness as currently measured
remains an important metric by which to assess students‘ positive adaptation in our
society that the results are interpreted.
Research Question One
An important finding from this analysis is that student race does predict student-
teacher closeness. Here, a conceptual question arises about the meaning of using
categorical race indicators as predictors in modeling closeness. Do these dummy race
variables represent some latent ―race‖ construct that causes student-teacher closeness?
Eagly and Chin (2010) argued that such membership categories ―have a psychological
reality at deeper levels than the surface of the human body‖ because these readily
observable phenotypes are linked with certain worldviews about these categories in the
minds of social perceivers (p. 934). According to this position, student race has an
indirect effect on closeness via the thoughts activated in teachers‘ cognition when they
see their students whom they spontaneously socially categorize (Allport, 1954). Future
research could test this theory.

45
As Yiu (2010) had earlier found in the data for these schools, teachers on average
felt the closest to Caucasian students. Of the four racial groups examined (Asian, Black,
Hispanic, and Caucasian), Asian students were rated the lowest in closeness when gender,
in-class behaviors, and academic achievement were held constant. Given the literature on
the associations between positive teacher ratings on student-teacher relations and better
academic and psychosocial outcomes for students, that teachers in general feel less close
(i.e., less positive in this aspect) with Asian students likely negatively influences Asian
students‘ performance in school settings. What is it about students being Asian that cause
teachers to feel less close to them? Referring back to the closeness items, Asian students‘
lower ratings may be an accurate reflection of their behavior in light of widely published
notions of Asian cultural values of discreetness (Kim, 2009) and respect for authority
(Lin & Fu, 1990). If teachers perceive such behaviors as characteristic of internalizing
behaviors, then it would be expected that student-teacher closeness ratings would be
compromised since students‘ internalizing behaviors negatively affect student-teacher
closeness. It appears that teachers feel the closest to students who show fewer behaviors
such as being a loner, feeling sad, being shy or timid around adults, seeming anxious or
worried, and being withdrawn.
As for the effect of other in-class behaviors on student-teacher closeness, the
current study corroborates the existing literature. Specifically, more engaged students
were closer to their teachers, while students who displayed internalizing or externalizing
behaviors received lower student-teacher closeness ratings. Contrary to expectations,
externalizing behaviors was found to be one of the weaker predictors of student-teacher

46
closeness when student demographic variables and other in-class behaviors were taken
into account. Girls were also found to receive higher closeness ratings than boys.
It is worrisome that being an Asian American student predicted the lowest
student-teacher closeness rating, especially in the face of the ―model minority‖ stereotype
which posits Asians as a well-adjusted group. Specifically, Asian students might not be
receiving the teacher support that they need to facilitate adaptive psychosocial
development. Further research on this issue is needed, as school-based research regarding
Asian students is relatively rare. This finding also leads to another question: Given that
other traits are equal, what makes teachers feel less close to Asian students than non-
Asian students? From the current analyses, teachers‘ stronger belief that Asian students
are not difficult to get to know allowed them to feel closer to Asian students. Perhaps an
important role for school-based mental health professionals (psychologists and
counselors) is to educate teachers about Asian American culture to dispel misconceptions
of Asian American students that may exist. Yiu (2010) reported elevated internalizing
behavior ratings for Asian students compared to their peers. In other words, teachers were
more likely to perceive Asian students as shy or timid, withdrawn, and anxious or
worried. Although it might be true that Asian American students truly are more
internalizing than their peers, an alternative explanation is that confirmation bias operates
such that teachers perceive Asian students as more internalizing because they believe that
they are difficult to get to know. Specifically, the internalizing measure, because it is
based on teacher ratings, may be flawed and may simply reflect a teacher bias rather than
a real difference in internalizing. If the latter explanation applied, then teachers can opt to
initiate contact with Asian students in order to get to know them better. Scheduled

47
lunches with a few students at a time toward the beginning of the school year might serve
as a bridge between teachers and students to get to know one another in a non-threatening
environment. This and other ideas about ways to promote cross-group familiarity may be
worthy of experimental tests in schools.
An interesting finding was that, after controlling for the other student covariates,
students‘ previous year‘s GPA actually predicted lower closeness ratings, although its
zero-order correlation with closeness was weak positive. Also, students‘ ESOL and
FARM status were not found to be unique predictors of STR closeness after race, gender,
in-class behaviors, and previous academic achievement were taken into account. Thus,
except for the finding on the relationship between previous GPA and closeness, and the
non-significance of ESOL and FARM as predictors, my first hypothesis was supported
by the current findings.
Overall, it appears that the primary source of information used by teachers to rate
the degree of closeness with students is most affected by students‘ behaviors. This
finding suggests a re-examination of the current adaptation of the STRS Closeness scale
to evaluate what construct is actually measured (i.e., behavior or interpersonal closeness).
Research Question Two
Contrary to expectations that teacher race would have no effect on how close
teachers felt to students after adjusting for student characteristics, Asian teachers, in
general, felt closer to students than did Caucasian teachers. Asian teachers were the only
minority group who gave higher closeness ratings than Caucasian teachers (Native
American teachers disregarded because of their sample size of n = 2). The opposite was

48
true for Black and Hispanic teachers, who felt less close to students than did Caucasian
teachers.
Of the four racial groups with at least ten teachers (Asian, Black, Caucasian, and
Hispanic), teachers being Asian predicted the highest student-adjusted closeness scores.
This is interesting because although generally teachers did not feel as close to Asian
students as to other students, Asian teachers perceived closer relationships to students
than non-Asian teachers. If Asian students share a similar relational style as Asian
teachers, it is possible to speculate that even though teachers feel less close to Asian
students, Asian students nonetheless feel closer to their teachers than their peers do. This
is important because the subjective experience of the individual is an important
component of defining mental health (Kellam et al., 1975). Still, another essential
component of mental health comes from external pressures, which involves the
community‘s judgment of the person‘s performance, or one‘s social adaptational status
(Kellam et al., 1975). To attain equal opportunities to succeed, Asian Americans require
acceptance from mainstream society. Thus, if the general public regarded Asians as more
internalizing than others, this perception itself may negatively affect Asian children‘s
mental health status, and could jeopardize their opportunity to reach the same level of
success that may currently be implicitly reserved for individuals not members of a racial
minority.
My hypothesis that female teachers would give higher closeness ratings is also
refuted: Teacher gender did not reach the .05 significance level to qualify as a statistically
significant predictor of student-teacher closeness when student characteristics were taken
into account. Nonetheless, the regression coefficient for teacher being male yielded an

49
effect in the expected (negative) direction when predicting closeness, with a significance
value at .10. The non-significant finding may be attributable to the fact that a majority of
the teachers were females, with only about 8% (n = 64) of whom identified as males. A
small sample size is more susceptible to the Type I error, which states that a hypothesis is
incorrectly refuted when in fact a true difference exists.
My hypothesis that teachers with more positive beliefs about specific groups of
students would feel closer to students is only partially supported. The results indicate that
teachers‘ self-reported beliefs about minority student groups can have an influence on the
degree of closeness in their relationships with students. On average, teachers who
believed more strongly that Asian students are not difficult to get to know felt closer to
students than their colleagues who agreed less readily to this statement. This finding
suggests that one barrier to increased closeness between students and teachers is the
teacher‘s perception that certain students are more difficult to get to know. It is important
to note that this perception may not reflect reality accurately and is based on the teacher‘s
beliefs. School administrators might consider it a goal to foster positive classroom
environments by encouraging teachers to get to know their students on a more personal
level to increase opportunities for close relationship development. Even though Belief
Item 6 here specifically assessed teachers‘ attitudes toward getting to know Asian
students, teachers who believe that Asian students are not difficult to get to know might
hold similar beliefs toward other students in general, and minority students more
specifically. Assessing such a possibility requires further research. The other two items
that assessed beliefs about male African American students‘ learning style and teaching

50
responsibility toward ESOL students, however, did not affect how teachers rated
closeness in general.
Research Question Three
The hypothesis that the presence of a racial match between student and teacher
would contribute unique variance in closeness beyond the other covariates was only
observed for student and teacher pairs who were Black. In other words, when student
gender, engagement, internalizing behaviors, externalizing behaviors, and academic
achievement are held constant, Black teachers felt closer to students who were also Black
than to students of other races. Although the effects were in the expected, positive
direction, racial match was not found to predict student-adjusted closeness ratings
significantly for Asian nor Hispanic students, but the sample sizes of Asian and Hispanic
teachers were small (n = 11 and 21, respectively). Furthermore, even though teachers on
average felt closer to female students, an interaction between teacher and student genders
existed such that male teachers felt closer to male students when student race,
engagement, internalizing behaviors, externalizing behaviors, and academic achievement
were accounted for. These findings on student-teacher matches in terms of phenotypic
qualities like race and gender corroborate the social psychological literature on liking
(Clark and Lemay, 2010), in which similarity is often found to be the strongest predictor
of how much people like others.
As for the interaction between teachers‘ beliefs about a specific group of students,
my hypothesis was only partially supported. Asian students received higher closeness
ratings if their teachers believed that they are not difficult to get to know. This result is
not surprising because teachers who find it less difficult to get to know students can also

51
be expected to find it easier to relate to their students on a more personal and closer level.
In addition, Hispanic students were rated as being slightly closer to teachers who adhered
more to the belief that it was their responsibility to provide learning support to ESOL
students. One interpretation of this finding is that teachers who feel more personally
responsible for a group of students‘ learning outcomes would naturally want to get to
know these students better in order to understand better the conditions under which they
learn best. On the other hand, teacher beliefs about African American students‘ learning
style did not interact significantly with how close they felt toward Black students. This
final finding demonstrates discriminant validity for the closeness scale in measuring the
STR closeness construct. Specifically, since closeness taps into the social relationship
between students and teachers, teachers‘ perceptions of how African American students
learn should not affect how they relate to these students.
Limitations
The sample is from a single suburban school district in a Mid-Atlantic state. The
generalizability of results to districts with different teacher and student compositions is
unknown. All data on relationship quality and student psychosocial and academic
characteristics (including classroom grades) are derived from teachers‘ perspective.
Students‘ in-class behaviors are measured in terms of the teachers‘ perceptions of the
students. The degree of closeness perceived by the teacher may not be the same as that
felt by the student in the pair‘s relationship. Information on how students perceived the
student-teacher relationship is not available. It is somewhat reassuring in this regard that
Skinner and Belmont (1993) demonstrated that teacher-reported emotional involvement
with students was the strongest correlate of student perceptions of the same construct.

52
The interrater correlation between teacher- and student-reported teacher emotional
involvement in Skinner and Belmont‘s study was .23 (p < .01), which is not uncommonly
low in the interrater reliability literature on teachers and children (Nebbergall, 2009).
The current research employed assumptions about causal ordering to infer causal
influences of teacher and student characteristics on student-teacher closeness. Thus, the
conclusions drawn are only as good as the assumptions of the model. In other words, the
inferences based on the results of the analyses are valid only if the model were specified
properly using relevant and sufficient predictor variables. Causal ordering cannot be
definitely established between some predictor variables and the hypothesized outcome
variable in the present examination. For instance, the relationship between a student‘s
externalizing behaviors and STR closeness is ambiguous. It may be that a student acts out,
resulting in a more distant student-teacher relationship. On the other hand, it is also
possible that a more distant relationship between the teacher and the student causes the
student to feel alienated, and displays his negativity through externalizing behaviors. Or,
as Bandura (1985) might say, the relationship is reciprocal. Similar scenarios occur with
the engagement and internalizing scales as well. Finally, to the extent in which
measurement errors exist, in other words, if the scales do not measure the intended
constructs or measure them with error, causal inferences are to that degree weakened.
Virtues
Despite these limitations, the current study utilized a large sample from a diverse
school district. This diverse sample of students with a large Asian American subgroup
allows for inferences to be drawn about Asian American students based on the analyses
with some confidence. This type of quantitative analysis to predict teacher-student
53
closeness in Asian American students has not been previously performed. Furthermore,
measures of teacher characteristics were included. To my knowledge, no previous study
controlled for these potential sources of variance even though teachers have been the only
raters of both predictor and response variables.
Implications and Future Research
Culture and closeness using Asian Americans as an example. Compared to
studies on Hispanic and African American student populations, fewer studies focus on
Asian students. The current discussion aims to add to the literature by emphasizing the
present findings as they relate to Asian students in the U.S. The lower closeness ratings
for Asian students suggest that more investigation into interpersonal style in the teacher-
child context would be helpful. Much literature supports the concept of similarity
between people as a foundation for liking and close relationships (for a review, see Clark
& Lemay, 2010). Some earlier research has examined relations between college
undergraduates and professors, or graduate students and advisors, but investigations of
student-teacher relations in the K-12 context are less prevalent. The issue is complicated
by differing cultural expectations of interpersonal style. A study comparing Chinese (Ho
& Chau, 2009) relational style to that of Western Europeans suggested that in this East
Asian culture, more emphasis is placed upon the relationship itself rather than on the
individuals inside the relationships. Surveying Taiwanese international students in the
U.S., Lee, Bei, and DeVaney (2007) found that these students experienced culture shock
when they discovered the different interpersonal styles between graduate students and
their advisors in the U.S. On average, Taiwanese students perceived a greater hierarchical
relationship between students and faculty than did U.S. students.
54
It has been observed that student-teacher relationships differ between Asian and
Western European cultures. For example, using archival data from the Trends in
International Mathematics and Science Study (TIMSS) 1999 study, Leung (2005) found
that the student to teacher spoken word ratio was the lowest in Asian societies such as
Hong Kong and Japan, while the United States had the highest ratio. It appears that in
Asian cultures, students may be used to exchanging fewer words with their teachers
compared to their peers who go to school in the U.S. Because communication plays an
important role in the development of dyadic relations in our society, the lower frequency
of verbal communication expected of Asian students toward their teachers may
negatively affect their relationship with teachers as students in the U.S. This may be
further complicated by differently prioritized values across cultures. For instance, filial
piety and obedience to elders are important cultural values in Chinese cultures (Lin & Fu,
1990), whereas individualism and an inquisitive nature are expected of U.S. children
(Kingston & Forland, 2008). In other words, some Asian students may be expected to be
obedient and respectful toward their teachers (Lee, Lam, & Li, 2003). The salience of a
hierarchical relationship between teacher and student in Asian families may hinder Asian
American students from forming positive relationships with their teachers as valued in
North American cultures. This is problematic since the majority of teachers in the U.S.
school system are Western European (Schools and Staffing Survey, 2008). Terms such as
large power distance (Hofstede, 1980) and relationship dominance (Ho, Peng, Lai, &
Chan, 2001) have been used to describe the relational style of East Asians.
What, then, are the implications of different conceptualizations of student-teacher
closeness in the applied setting? The current literature generally measures STR closeness
55
in terms of the teacher‘s perception that the relationship is warm and that the student
makes initiatives to seek psychosocial support from the teacher. A challenging question
that arises from the current findings is whether educators should expect all students to
express the qualities valued by Western societies as features of a close relationship, or if
teachers should be the ones to adjust to their students with varying cultural backgrounds
instead. The current trend in the field is an emphasis on training for multicultural
awareness and competence in order for U.S. education to accommodate to the rapidly
changing demography of students.
School-based interventions. Young people do not possess the legal and social
status required to make decisions about their own psychosocial wellbeing, and must rely
on external agents such as their families and school personnel as providers of mental
health resources (Takeuchi, Bui, & Kim, 1993). From a community health framework, all
persons in need are afforded services in order to prevent mental illness in the larger
community (Kellam et al., 1975). Public school systems are part of the community that
has the responsibility to ensure its members‘ welfare in order for it to continue proper
functioning. Accordingly, schools have an obligation to participate in the prevention and
early treatment of mental dysfunctions for their students.
The finding here that teachers‘ personal beliefs interacted with student race can be
interpreted as consistent with the hypothesis (Murray, Bellavia, Holmes, Griffin, &
Dolderman, 2002) that perceived similarity may predict closeness differently than actual
similarity. Results of this study may have implications for students‘ academic and
psychosocial adjustments as well. Future research and intervention efforts may address
whether interventions to help teachers become more aware of the importance of

56
developing closer relationships with these students leads to better outcomes. One such
intervention may be in the form of teacher professional development to support teachers
in understanding how their attitudes might affect their students. Many studies have
focused on reducing conflicts in the student-teacher relationship as an intervention to
prevent future behavioral and academic problems (e.g. Hamre & Pianta, 2005), but
interventions to increase the closeness between a student and a teacher are less prevalent.
Perhaps for students who are not overtly displaying a risky status (i.e., they are
performing well in their academics), attention should be given to increase their closeness
with teachers. Closer student-teacher relationships may allow teachers to gain insight into
how students are doing beyond their academic performance, and to intervene in a timely
manner as necessary. This is especially critical for students from families whose parents
are less involved in school for one reason or another. For instance, if Asian families value
discreetness in regards to mental health needs, there exists potential for teachers of Asian
students to fill the gap as a resource to enhance the students‘ psychosocial wellbeing
(Kim, 2009). As the adult figure who occupies a majority of school-going children‘s
waking hours, teachers can become the active force to initiate contact with students‘
families through getting to know their students on a closer level to provide a common
conversational ground to instigate parent-school relations. A future study might examine
the effect of a closer student-teacher relationship on outcomes such as the level of family
involvement in school, parental attention given to mental health issues, as well as
changes in patterns of utilization of mental health services.
Kalyanpur and Harry (1999) proposed the concept of the posture of cultural
reciprocity in facilitating the professional-parent relationship to enhance the student‘s

57
school and home lives simultaneously. This posture of cultural reciprocity may be
manifested within the professional (e.g., school psychologists, counselors, teachers), as
well as in the actions performed by the professional. According to this perspective, in
fostering trust in home-school relations, it is critical that the professional become aware
of potential cultural differences that may exist between hers and the student‘s social
milieus, and to take action to reduce conflicts that may arise as a result. At the same time,
the bond built between the school and the family can serve as a support within
mainstream society from which families may seek advice and support in the future. This
bond may be important for families not from the mainstream culture to feel more
integrated into their communities. Regardless of the merits of these speculations, the
finding that teachers‘ ratings of their relationships with their students depend on racial
congruence and race-related beliefs in some instances deserves research attention and
concern. The present results may stimulate further research on this phenomenon.

58
Table 1
Sample Race and Gender
Students
Teachers
N % N %
Asian 1250 7.8
11 1.5
Black 3546 22.0
78 10.3
Hispanic 4301 26.7
21 2.8
Caucasian 6987 45.1
643 85.2
Native American 0 .0
2 .3
Female 7914 49.2
691 91.5
Male 8170 50.8
64 8.5
Total 16084 100.0
755 100.0

59
Table 2
Student Age in Years by Grade Level
Grade M N SD Min. Max.
First 5.6 3357 .53 5 8
Second 6.6 3192 .54 5 8
Third 7.6 3142 .56 6 10
Fourth 8.6 3300 .58 7 11
Fifth 9.6 3093 .57 8 12
Total 7.6 16084 1.54 5 12

60
Table 3
Student Demographics by Grade Level
First Second Third Fourth Fifth
N
(%)
N
(%)
N
(%)
N
(%)
N
(%)
Asian 268 245 228 254 255
(8) (8) (7) (8) (8)
Black 680 673 720 754 719
(20) (21) (23) (23) (23)
Hispanic 973 897 861 814 756
(29) (28) (27) (25) (24)
Caucasian 1436 1377 1333 1478 1363
(43) (43) (42) (45) (44)
Male 1706 1635 1596 1694 1539
(51) (51) (51) (51) (50)
ESOL 1052 917 805 771 681
(31) (29) (26) (23) (22)
FARM 1250 1143 1113 1104 1036
(37) (36) (35) (34) (34)
Total 3357 3192 3142 3300 3093
Note. ESOL = English for Speakers of Other Languages; FARM =
Free and Reduced Meals.

61
Table 4
Longitudinal Inter-teacher Correlations of Closeness Ratings
Occasion Year 1 Year 2 Year 3 Year 4
Year 1 -
Year 2 .220 -
Year 3 .202 .227 -
Year 4 .176 .187 .201 -
Note. p < .001 for all. Pairwise Ns > 6,300 students for each r.

62
Table 5
Decomposition of Variance Within and Between Teachers
Origin Variance sig. (τ) ρ
Between Teacher (τ) .410 < .001 .41
Within Teacher (σ2) .590
.59

63
Table 6
Concurrent and Longitudinal Correlations Among Teachers' Ratings of Student Behaviors and Teacher Relations with Students
. Year 1 . . Year 2 . . Year 3 . . Year 4 .
Year Eng Ext Int Clos Conf Eng Ext Int Clos Conf Eng Ext Int Clos Conf Eng Ext Int Clos Conf
1 Eng -
Ext -.52 -
Int -.43 .10 -
Clos .39 -.20 -.47 -
Conf -.56 .76 .23 -.33 -
2 Eng .56 -.36 -.21 .20 -.36 -
Ext -.34 .52 .02 -.12 .45 -.52 -
Int -.24 .03 .40 -.20 .10 -.42 .12 -
Clos .16 -.09 -.18 .22 -.10 .38 -.21 -.45 -
Conf -.34 .46 .08 -.13 .42 -.55 .74 .24 -.34 -
3 Eng .54 -.36 -.20 .18 -.36 .58 -.35 -.22 .18 -.37 -
Ext -.32 .48 .02 -.10 .40 -.34 .50 .01 -.08 .44 -.52 -
Int -.24 .04 .37 -.20 .10 -.24 .03 .40 -.20 .12 -.44 .15 -
Clos .17 -.11 -.16 .20 -.11 .20 -.12 -.19 .22 -.15 .40 -.25 -.44 -
Conf -.32 .42 .08 -.12 .36 -.34 .42 .08 -.12 .41 -.56 .74 .26 -.37 -
4 Eng .50 -.34 -.18 .19 -.34 .56 -.35 -.21 .18 -.36 .58 -.36 -.23 .19 -.36 -
Ext -.29 .44 .02 -.10 .36 -.31 .47 .02a -.09 .41 -.34 .50 .03 -.11 .41 -.53 -
Int -.22 .05 .34 -.17 .12 -.23 .02 .38 -.18 .09 -.22 .02a .40 -.18 .08 -.44 .14 -
Clos .12 -.09 -.16 .18 -.10 .14 -.07 -.18 .18 -.10 .16 -.11 -.17 .20 -.12 .38 -.22 -.45 -
Conf -.28 .36 .06 -.11 .33 -.30 .38 .08 -.10 .36 -.32 .40 .10 -.12 .38 -.55 .74 .26 -.34 -
Note. Eng = Engagement; Ext = Externalizing behaviors; Int = Internalizing behaviors; Clos = Student-teacher closeness; Conf = Student-teacher
conflicts. Boldface values show correlations of closeness with other variables. Underlined values show correlations among closeness measures
for different years (and different teachers).
a p < .05 except for the two cells marked by ―a.‖
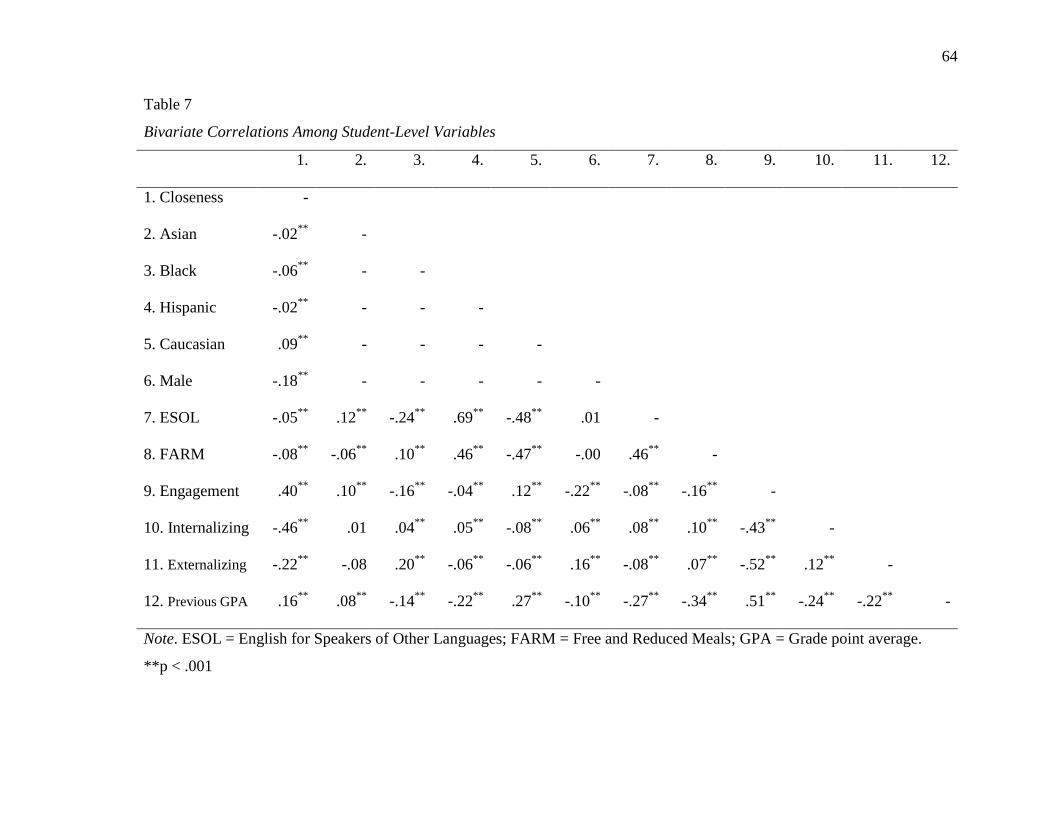
64
Table 7
Bivariate Correlations Among Student-Level Variables
1. 2. 3. 4. 5. 6. 7. 8. 9. 10. 11. 12.
1. Closeness -
2. Asian -.02**
-
3. Black -.06**
- -
4. Hispanic -.02**
- - -
5. Caucasian .09**
- - - -
6. Male -.18**
- - - - -
7. ESOL -.05**
.12**
-.24**
.69**
-.48**
.01 -
8. FARM -.08**
-.06**
.10**
.46**
-.47**
-.00 .46**
-
9. Engagement .40**
.10**
-.16**
-.04**
.12**
-.22**
-.08**
-.16**
-
10. Internalizing -.46**
.01 .04**
.05**
-.08**
.06**
.08**
.10**
-.43**
-
11. Externalizing -.22**
-.08 .20**
-.06**
-.06**
.16**
-.08**
.07**
-.52**
.12**
-
12. Previous GPA .16**
.08**
-.14**
-.22**
.27**
-.10**
-.27**
-.34**
.51**
-.24**
-.22**
-
Note. ESOL = English for Speakers of Other Languages; FARM = Free and Reduced Meals; GPA = Grade point average.
**p < .001

65
Table 8
Multicollinearity Diagnostics: Standardized Regression of Closeness on Predictors
Student-level covariate ryh ̂ Tolerance VIF
Asian -.021 -.047 .808 1.237
Black -.069 -.040 .731 1.367
Hispanic -.028 -.028 .384 2.602
Male -.179 -.105 .945 1.058
ESOL -.053 -.013 .429 2.330
FARM -.084 -.016 .649 1.541
Engagement .400 .232 .464 2.157
Internalizing -.458 -.358 .791 1.265
Externalizing -.221 -.054 .687 1.455
Previous GPA .156 -.089 .639 1.564
Note. ESOL = English for Speakers of Other Languages; FARM = Free and
Reduced Meals; GPA = grade point average; VIF = Variance Inflation Factor.

66
Table 9
Estimated Student Characteristic Effects on Closeness: Coefficients for Student-
Level Covariates in a Two-Level Model
Covariate β SE t df p
β0 for reference .190 .022 8.80 754 < .001
β1 for Asianij -.172 .022 -7.98 16075 < .001
β2 for Blackij -.076 .015 -4.94 16075 < .001
β3 for Hispanicij -.085 .016 -5.34 754 < .001
β4 for Maleij -.242 .012 -19.18 754 < .001
β5 for Engagementij .160 .010 15.70 754 < .001
β6 for Internalizingij -.308 .009 -32.86 754 < .001
β7 for Externalizingij -.083 .009 -9.02 754 < .001
β8 for Previous GPAij -.062 .008 -8.21 754 < .001
Note. Variables are uncentered, except that continuous variables are in z-score
form.

67
Table 10
Estimated Teacher Effects on Student-Covariate-Adjusted Closeness
Coefficient Est. SE t df p
For intercept β0j
γ0,0 .027 .061 .44 742 .658
γ0,1 for teacher Asian .225 .063 3.56 742 .001
γ0,2 for teacher Black -.172 .079 -2.16 742 .030
γ0,3 for teacher Hispanic -.259 .115 -2.24 742 .025
γ0,4 for teacher Native Am. .418 .108 3.88 742 < .001
γ0,5 for teacher Male -.154 .095 -1.61 742 .107
γ0,6 for Grade 1 .318 .068 4.66 742 < .001
γ0,7 for Grade 2 .258 .071 3.62 742 < .001
γ0,8 for Grade 3 .206 .072 2.84 742 .005
γ0,9 for Grade 4 .164 .075 2.18 742 .029
γ0,10 for African Am. Belief Item -.029 .020 -1.43 742 .153
γ0,11 for ESOL Belief Item .026 .020 1.28 742 .200
γ0,12 for Asian Belief Item .089 .025 3.50 742 .001
γ1,0 for student Asian, β1 -.172 .022 -8.00 16063 < .001
γ2,0 for student Black, β2 -.073 .015 -4.79 16063 < .001
γ3,0 for Student Hispanic, β3 -.084 .016 -5.30 754 < .001
γ4,0 for Student Male, β4 -.242 .012 -19.18 754 < .001
γ5,0 for Engagement, β5 .160 .010 15.65 754 < .001
γ6,0 for Internalizing, β6 -.307 .009 -32.71 754 < .001
γ7,0 for Externalizing, β7 -.082 .009 -8.94 754 < .001
γ8,0 for Previous GPA, β8 -.062 .008 -8.03 754 < .001
Note. Variables are uncentered, except that continuous variables are in z-score
form.
68
Table 11
Mean Raw Scores on Teacher Belief Items by Teacher Race
Item 4 Item 5 Item 6
Teacher race N
M
(SE)
M
(SE)
M
(SE)
White 643 3.62 3.96 4.23
(.04) (.04) (.03)
Black 78 3.33 3.83 4.21
(.15) (.11) (.10)
Hispanic 21 3.38 4.19 4.24
(.22) (.24) (.12)
Asian American 11 3.00 4.27 4.45
(.43) (.19) (.21)
Native American 2 4.00 4.50 4.50
(.00) (.50) (.50)
Total 755 3.58 3.96 4.23
(.04) (.04) (.03)
Note. Item 4 = I believe African American males learn differently from
other students; Item 5 = I should not be expected to provide the language
services that English Language Learners (ELL) students require; Item 6 =
I believe Asian students are often difficult to get to know. Items are
rescaled such that rejecting each item earns a higher score (range 1 to 5).
69
Table 12
Within-Teacher Model: Interaction Effects from HLM
Coefficient γ SE t df p
β0
γ00 -.204 .068 -2.96 745 .004
γ0,1 for Teacher Asian .240 .094 2.56 745 .011
γ0,2 for Teacher Black -.151 .090 -1.68 745 .093
γ0,3 for Teacher Hispanic -.175 .129 -1.36 745 .176
γ0,4 for Teacher Native Am. .583 .184 3.16 745 .002
γ0,6 for Grade 1 .396 .078 5.05 745 < .001
γ0,7 for Grade 2 .298 .082 3.63 745 .001
γ0,8 for Grade 3 .182 .083 2.19 745 .029
γ0,9 for Grade 4 .184 .085 2.17 745 .030
γ0,12 for Belief item 6 (Asians) .119 .024 4.84 745 < .001
Student Asiana (β1)
γ10 -.174 .021 -8.20 751 < .001
γ1,1 for Teacher Asian .024 .156 .153 751 .879
γ1,11 for Belief item 5 (ESOL) .016 .023 .682 751 .495
γ1,12 for Belief item 6 (Asians) .077 .024 3.10 751 .002
Student Blacka (β2)
γ20 -.084 .016 -5.14 752 < .001
γ2,2 for Teacher Black .096 .040 2.36 752 .018
γ2,10 for Belief item 4 (African Am.) .016 .013 1.16 752 .246
Student Hispanica (β3)
γ30 -.086 .016 -5.30 752 < .001
γ3,3 for Teacher Hispanic .018 .073 .25 752 .799
γ3,11 for Belief item 5 (ESOL) .044 .016 2.76 752 .006
Student Malea (β4)
γ40 -.254 .012 -19.62 753 < .001
γ4,5 for Teacher Male .106 .046 2.26 753 .024
γ5,0 for Engagementa (β5) .151 .010 14.84 754 < .001
γ6,0 for Internalizinga (β6) -.301 .010 -31.61 754 < .001
γ7,0 for Externalizinga (β7) -.086 .009 -9.33 754 < .001
γ8,0 for Previous GPAa (β8) -.058 .008 -7.56 754 < .001
Note. Level-1 predictors are group mean centered. Level-2 variables are uncentered,
except that continuous variables are in z score form; Item 5 = I should not be expected
to provide the language services that English Language Learners (ELL) students
require; Item 6 = I believe Asian students are often difficult to get to know. Items are
rescaled such that rejecting each item earns a higher score (range 1 to 5). aGroup-mean centered variable

70
Figure 1. Teacher self-reported agreement to belief items by teacher race. Native
American teachers were excluded due to a very small sample size of n = 2. Item 4 = I
believe African American males learn differently from other students; Item 5 = I should
not be expected to provide the language services that English Language Learners (ELL)
students require; Item 6 = I believe Asian students are often difficult to get to know.
Items are rescaled such that rejecting each item earns a higher score.
-1.00
-0.80
-0.60
-0.40
-0.20
0.00
0.20
0.40
0.60
0.80
1.00
Item 4 Item 5 Item 6
Tea
cher
Sel
f-R
eport
ed L
evel
of
Agre
emen
t (Z
-sta
ndar
diz
ed)
Belief Item
White Black Hispanic Asian American

71
Appendices
Appendix A
Reduced Teacher Observation of Classroom Adaptation-Revised (TOCA-R) Scales
1. Interacts with teachers (reverse score)c
2. Easily distracted (reverse score)a
3. Seems sadc
4. Defies teacher or other school
personnelb
5. Accomplishes assignments
independentlya
6. Makes friends easily (reverse score)c
7. Argues or quarrels with othersb
8. Withdrawn doesn't get involved with
others c
9. Teases or taunts othersb
10. Seems anxious or worriedc
11. Takes others property without
permissionb
12. Eager to learna
13. Is physically aggressive or fights with
othersb
14. Gossips or spreads rumorsb
15. Works to overcome obstacles in
schoolworka
16. Shy or timid around classmates or
adultsc
17. Socializes or interacts with classmates
(reverse score)c
18. Says things like "I can't do it" when
work is difficult (reverse score)a
19. Is a lonerc
20. Is disruptiveb
21. Stays on taska
22. Breaks rulesb
23. Pays attentiona
24. Learns up to abilitya
a Engagement items
b Externalizing behaviors items
c Internalizing behaviors items
72
Appendix B
Reduced Student-Teacher Relationship Scales (STRS)
1. I share a warm caring relationship with this child.a
2. This child and I always seem to be struggling with each other.b
3. If upset this child will seek me out for support.a
4. This child values his relationship with me.a
5. This child‘s feelings toward me can be unpredictable or change suddenly.b
6. This child is sneaky or manipulative with me.b
7. Dealing with this child drains my energy.b
8. This child spontaneously shares his feelings and experiences with me.a
a Closeness items
b Conflict items

73
Appendix C
Table 13
Means and Standard Deviations of z-Standardized Continuous Variables by Student Race and Gender
Closeness Engagement
Internalizing
Behaviors
Externalizing
Behaviors
Previous Year‘s
GPA
M SD M SD M SD M SD M SD
Asian -.07 1.05 .34 .90 .04 1.01 -.28 .67 .30 .88
Black -.13 1.02 -.30 1.04 .06 .99 .38 1.26 -.28 1.04
Hispanic -.04 1.01 -.06 .98 .08 1.02 -.11 .86 -.36 .96
Caucasian .10 .96 .13 .96 -.09 .98 -.07 .91 .31 .89
Female .18 .92 .22 .92 -.06 .98 -.16 .84 .10 .96
Male -.18 1.04 -.21 1.02 .06 1.02 .15 1.11 -.10 1.02
Total .00 1.00 .00 1.00 .00 1.00 .00 1.00 .00 1.00

74
Appendix D
Akiba (2010) Baker, Grant, & Morlock (2008) P
urp
ose
- Examine characteristics of students who fear
being victimized by school violence
- Examine teacher & school traits associated with
students‘ fear
- Predict school adaptation of elementary school
children with significant behavior problems
using STRS closeness & conflict
- potentially moderating effects of positive
teacher relationship on association between
behavior problems & school adaptation
Def
init
ion
- Student-teacher bonding (to indicate school
community sense)
- Perceived teacher support
- positive STR = high degrees of warmth and
trust and low negativity
- negativity = conflict & dependence
- positive STR provide kids with the emotional
security necessary to engage fully in learning
activities and scaffold the development of
social, behavioral, and self-regulatory
competencies needed in the school environment
- **no real definition of ―closeness‖
Inst
rum
ents
- Student-reported student-teacher bonding
o Students get along well with most teachers
o Most teachers interested in student well-
being
o Most of my teachers really listen to what I
have to say
o If I need extra help, I‘ll receive it from my
teachers
o Most of my teachers treat me fairly
- Student-reported perceived teacher support
o (academic support, not closeness)
- STRS (Pianta & Nimetz, 1991)
o 9 items total, 2 factor solution
o 5-item closeness
o 4-item conflict
Co
rrel
atio
n - r = .41 with perceived teacher support
- r = .30 with student belonging
- r = -.49 with STRS conflict
- r = .46 with classroom adjustment
Rel
iab
ilit
y
- Student-Teacher bonding: Alpha = .83
- Perceived teacher support: .85
- STRS closeness alpha: .80
- STRS conflict alpha: .86
- In all regression analyses to predict Reading
Grades, Positive Habits, and Classroom
Adjustment from STRS, behavioral predictors,
and classroom teacher, classroom teacher
came out as contributing the most variance
Res
ult
s
- Student-teacher bonding explained variation in
school fear
- Classroom teacher makes largest contribution
to positive school adjustment of variables
considered (effect size = .27)
- Closeness associated with school adaptation,
accounting for additional 5% variance
- STR characterized by trust & warmth positively
associated with school adaptation

75
Appendix D (Continued)
Buriel (1983) Decker, Dona, & Christenson (2007) P
urp
ose
- Relationship of teacher-student interactions to
students‘ achievement
- What does quality of STR look like from
student & teacher perspectives?
- Is quality of STR predictive of student
outcomes?
- Whose perspective is more important in
predicting outcomes?
- Any dyadic patterns of student & teacher
perceptions that predict STR?
Def
init
ion
- Interactions - STRS Closeness
Inst
rum
ents
- Brophy-Good Dyadic Interaction Observation
System to code classroom interactions
- STRS (Pianta, 2001)
- Relatedness Scale (Wellborn & Connell, 1987)
o Psychological Proximity Seeking: S‘s desire
to be psychologically closer to T
o Emotional Quality: overall emotional tone of
relationship from student perspective
Co
rrel
atio
n
- n/a - r = .42 with Emotional Quality
- Non-sig. correlation with Psychological
Proximity seeking
- r = .47 with teacher report student social skills
- r = .38 with teacher reported student
engagement
- r = .42 with student reported student
engagement
Rel
iab
ilit
y - Included only scores with intercoder reliability
> 80%
- Internal consistency reliability for:
o STRS = .80
o Psychological Proximity Seeking = .86
o Emotional Quality = .77
Res
ult
s
- Ethnicity main effects:
o Anglo receive greater proportion of product
questions (F(1, 79) = 8.29, p < .01)
o Anglo more teacher affirmation following
correct responses (F(1, 79) = 5.01, p < .05)
- Sex main effect:
o Girls initial more work-related contacts with
teachers than boys (F(1, 79) = 8.65, p < .01)
- Teacher rated more negative relations, student
more positive
- STR more important predictor of social-
emotional functioning and engagement
outcomes versus academic outcomes
- STRS most important predictor of suspension
after controlling for all others
- S-rated Emotional Quality most important
predictor of behavior referrals & academic
engaged time after controlling all others
-

76
Appendix D (Continued)
Doumen, Vershueren, Buyse, E., De Munter,
Max, & Moens (2009)
Hamre and Pianta (2005) P
urp
ose
- Compare STRS against FAS and Attachment
Q-Set
- Multitrait-multimethod
- Classroom environment effects on student risk
outcomes
Def
init
ion
- STRS Closeness = degree of warmth and
openness in the relationship
- Emotional support encompasses classroom
warmth, negativity, child-centeredness,
teachers‘ sensitivity & responsiveness toward
specific children (NICHD ECCRN, 2002b)
Inst
rum
ents
- STRS (11 items on closeness)
- Peer nominations
- FAS: Child self-report
- Outcome = STRS Conflict
- COS-1: emotional & instructional support
o The emotional support composite included
ratings of overcontrol (reflected), positive
emotional climate, negative emotional
climate (reflected), effective classroom
management, teacher sensitivity,
intrusiveness (reflected), and detachment
(reflected).
o The instructional support composite included
ratings of literacy instruction, evaluative
feedback, instructional conversation, and
encouragement of child responsibility
Co
rrel
atio
n - r = .52 with peer nominated closeness
- r = .28 with FAS closeness
- r = -.53 with STRS conflict
- r = -.27 with peer nominated conflict
- no sig corr. with Dependency
- r = .57 with instructional support
Rel
iab
ilit
y - Alpha = .86 - Stable measure of classroom environment
because test-retest correlations > .70
Res
ult
s
- See correlations - When previous academic performance was
held constant, students in classrooms with
higher emotional support had academic
performance similar to their lower risk peers
- Higher risk students in classrooms with lower
levels of emotional support performed slightly
worse than their lower risk peers (d = .01)

77
Appendix D (Continued)
Ladd & Burgess (2001) Lynch & Cicchette (1997) P
urp
ose
- Links between behavioral & relational risk &
protective factors & children‘s adjustment
following transition to grade school
- Whether risk status of aggression predicted
psychological & school maladjustment
- Whether this association =
additively/contingently altered by peer and
teacher-child relationship risk/protective factors
- Descriptive data on perceived quality of
children‘s relationships w others as they
negotiate the transition from elementary to
middle school
Def
init
ion
- Closeness = warmth & open communication
between teacher & child; hypothesized to
increase student ability to engage in scholastic
tasks, participate in classroom activities
- Conflictual = acrimonious, noncompliant
interactions; hypothesized to operate as
stressors (e.g., causes of anger, resentment, or
anxiety) that interfere with student adjustment
- Relatedness
- Emotional quality = children‘s feelings of
specific positive & negative emotions when
with specified relationship figure
- Psychological proximity seeking = degree to
which kids wish they were psychologically
closer to relationship figure
Inst
rum
ents
- STRS Closeness (Pianta et al., 1995) - Relatedness Questionnaire: student self-report:
emotional quality & psychological proximity
seeking (4-point scales)
Co
rrel
atio
n
- r = -.39 to -.20 with STRS Conflict
- r = -.36 to -.23 with aggression in kindergarten,
non-significant in 1st grade
- r = -.29 to -.20 with peer rejection
- r = .18 to .21 with peer acceptance in
kindergarten, non-significant in 1st grade
- no significant correlation with peer
victimization or with number of mutual friends
- n/a
Rel
iab
ilit
y - Cited that scale has been found to be reliable
and valid
- Emotional quality alphas = .67 to .83 for
different figures
- Psychological proximity seeking = .83 to .93
for different figures
Res
ult
s
- Relational support measures correlated in
expected directions to each other
- Relationship ‗protectors‘ (peer acceptance,
number of mutual friendships, STR closeness)
explained additional variance in students‘
cooperative participation in the classroom and
fondness for school (ΔR2 = .07 & .06,
respectively) beyond the variance explained by
the students‘ gender and early aggressive risk
status
- Higher STRS Closeness linked to students‘
cooperative participation in the classroom (β
= .14) and fondness for school (β = .19)
- STRS closeness stronger predictor of
cooperative participation and school liking for
students who were chronically aggressive (β
= .18 and .28, respectively)
- Majority of children reported having optimal or
adequate pattern of relatedness with 3 of 4
relationship partners (67.5% w mothers, 78.5%
w best friends, 60.7% w classmates)
- Only 39.2% reported optimal/adequate patterns
with teachers
- Almost ½ reported disengaged patterns with
teachers

78
Appendix D (Continued)
Mashburn, Pianta, Hamre, Downer, Barbarin,
Bryant, Burchinal, & Early (2008)
Meehan, Hughes, & Cavell (2003) P
urp
ose
- Development of academic, language, & social
skills among 4-yr-olds in publicly supported
pre-K programs due to pre-K quality as
follows: (a) adherence to 9 standards of quality
related to program infrastructure & design, (b)
observations of overall quality of classroom
environments, & (c) observations of teachers‘
emotional & instructional interactions with
students in classrooms
- Teacher support as compensatory resource for
children under conditions of dual risk
(aggression & negative parenting or African
American/Hispanic minority status)
- Children‘s ethnicity as moderator of association
between positive STR & adjustment for
behaviorally at-risk children
Def
init
ion
- Emotional support o Positive climate, negative climate (reverse),
teacher sensitivity, overcontrol (reverse),
behavior management
- Instructional Support
o Concept development, quality of feedback
- Determined post hoc via factor analysis of
CLASS
- Student-teacher relationship quality
- More emphasis on CONFLICT than closeness
- Characterized as positive or negative
Inst
rum
ents
- Quality of overall environment: ECERS-R
36 items, space & furnishings, personal care
routines, language reasoning, activities,
interactions, program structure; 1 – 7 scale
- CLASS Quality of teacher-child
interactions: instructional & emotional support
- Social skills from Teacher-Child Rating Scale
-
- Network of Relationships Inventory (NRI):
structured interview, asks kids to rate persons
(mom, teacher, etc) in social network with
respect to 11 types of social support/conflict
o 5-point Likert-type scale
o Intimacy, affection, admiration, satisfaction,
and reliable alliance
- Parallel forms created for teachers and parents
to rate
- Seems like interpersonal support
Co
rrel
atio
n - r = .41 with instructional support
- r = .54 with overall quality (ECERS-R)
- None performed
Rel
iab
ilit
y - Acceptable intercoder reliability - ―adequate‖
Res
ult
s
- Teacher-child interactions in the classroom
most consistent and strongest correlate with
children‘s development
- Minority students lower scores on teacher-
support

79
Appendix D (Continued)
Murray & Murray (2004) Pianta, Belsky, Vandergrift, Houts, & Morrison
(2008) P
urp
ose
- Associations between child demographic
characteristics (i.e., race, gender, and disability
status), academic orientations (i.e., prior effort,
tardiness, and absences), behavioral
orientations (i.e., externalizing & internalizing
symptomology) and teachers‘ perceptions of
STR quality
- Association between observed classroom
supports (emotional & instructional) &
trajectories of achievement from 54-mo to fifth
grade
Def
init
ion
- STR quality
o Teacher perspective
- Emotional aspects of Student-Teacher
interactions (sensitivity and emotional warmth)
- Positive classroom climate
Inst
rum
ents
- STRS
o Originally designed to assess attachment like
qualities
o Cognitive and affective dimensions of
warmth, open communication, involvement,
dependency, and hostility
- Closeness, contains 11 items related to warmth,
communication, and involvement in teacher
child relations
- Classroom Observation System (COS)
o Classroom-level: overcontrol, chaos,
positive/negative emotional climate,
detachment of teacher, teacher sensitivity,
productive use of instructional time, richness
of instructional methods
o Emotional support = Reverse-overcontrol,
reverse-chaos, positive emotional climate,
reverse-negative emotional climate,
sensitivity
o Instructional support = productive time use,
instructional methods richness
Co
rrel
atio
n - r = -.51 with conflict
- r = -.33 with externalizing (CBCL)
- r = -.29 with internalizing (CBCL)
- r = -.19 with problem behaviors
- r = -.20 with STR conflict
- r = -.12 with teacher depression
- r = -.10 with child-teacher ratio
- r = -.17 with percent class poverty
Rel
iab
ilit
y - Alpha = .81 - Alpha for emotional support scale = .84
Res
ult
s
- 14% of the variance contributed by student
demo, ac orientation, behavioral orientation
(each contributed significantly)
- Greater closeness with females
- Lower closeness for students with disabilities
-
- 2 groups of reader (fast, start off faster, then
trail off vs. typical)
- 1 group in Math
- Teacher emotional support positively
significant for ―typical‖ readers

80
Appendix D (Continued)
Pianta & Stuhlman (2004) Saft & Pianta (2001) P
urp
ose
- Correlation between STRS with student social
& behavior outcomes
- Stability of teacher ratings from Pre-
Kindergarten – 1st grade
- Whether teachers‘ perceptions of their
relationships with students varied as a function
of child age, ethnicity, and gender, and teacher
ethnicity
Def
init
ion
- STRS - Teacher perception of relationship with S
- STRS Closeness positive items
Inst
rum
ents
- STRS (Pianta, 2001) short form
o Closeness = extent to which teacher feels
relationship with student = characterized by
warmth, affection, and open communication
- STRS (Pianta, 1993): Closeness
o a teacher's feelings about her relationship
with a student, the student's interactive
behavior with the teacher, and the teacher's
beliefs about the student's feeling toward the
teacher
Co
rrel
atio
n
Convergent:
- r = .25 between 54-mo & Kindergarten
- r = .18 between 54-mo & 1st grade
- r = .25 between K & 1st
- r = .41 (54-mo), .12 (K), and .23 (1st) with
social competence @ 54-mo
Discriminant:
- r = -.23 to -.30 with conflicts
- r = -.36 with internalizing
- r = -.10 with externalizing
- r = .01 with WJ-R Vocabulary
- Did not correlate with other predictors
Rel
iab
ilit
y - STRS Closeness r = .21 to .31 year-to-year
stability (across time & teacher)
- Not reported
Res
ult
s
- See correlations - Teacher-student ethnic match was the only
significant predictor (R2 change = .032) in
predicting teacher feelings of closeness with S

81
Appendix D (Continued)
Skinner & Belmont (1993) Stuhlman & Pianta (2001) P
urp
ose
- Reciprocal relationship between children‘s
engagement & teacher behavior
- Associations between relationship-focused
narratives & teachers‘ interactions w children
in the classroom
Def
init
ion
- Teacher-student interactions
- Involvement = quality of interpersonal
relationship with teachers and peers; its
opposite is rejection or neglect – teachers level
of involvement = extent they take time for,
express affection toward, enjoy interactions
with, are attuned to, & dedicate resources to
their Ss
- Relationship between STR & engagement
mediated by children‘s perceptions of teacher
behavior toward them
- Adult-child relationships as complex,
multifaceted systems
o Attachment
o Adult‘s representation of being a secure
base, a disciplinarian, a teacher, and a
caretaker to the child
- Teachers‘ internal working models of their
relation with a specific child examined through
narratives elicited in semi-structured interviews
Inst
rum
ents
- Teachers & students completed questionnaires
in Fall & Spring as part of district-wide
assessment
- Teacher & student self-reports containing 11 &
8 items each, respectively; 4-point Likert-type
- COS: Total interactions between teacher &
student teacher positive affect, negative
affect, teacher sensitivity
- Teacher Relationship Interviews
o Control/compliance (socialization)
o Child‘s achievement (instruction)
o Viewing oneself as a secure base for
providing support to the child (emotional
support)
Co
rrel
atio
n - r = .23 between student and teacher reports of
involvement
- more differentiation between involvement,
structure, autonomy support when reported by
teachers (r = .27 to .65); less differentiation
from student reports (r = .77 to .81)
- Fairly well agreement among coders to satisfy
research purposes, but low for applied/clinical
purposes
Rel
iab
ilit
y - r = .72 between fall & spring (teacher report)
- r = .55 between fall & spring (student percept)
- Teachers‘ positive or negative affect in
producing narratives stood out as the salient
variable that correlated with student and teacher
behaviors in the classroom
Res
ult
s
- Reciprocal student-teacher relationship - Unique contributions of relationship narratives
beyond teacher& student traits
o Teacher more neg. affect in narrative,
interacted more often with that specific kid
in classroom
o When teacher talked more about compliance
in ref to specific kid, observed to interact less
frequently w that kid
o Neg. affect more prominent in teachers‘
relationship narratives about kids toward
whom they expressed greater neg. affect in
classroom
o Significant interaction between Compliance
& Negative Affect and teacher experience

82
References
Allport, G. W. (1954). The nature of prejudice. Cambridge, MA: Addison-Wesley.
Akiba, M. (2010). What predicts fear of school violence among U.S. adolescents?
Teachers College Record, 112, 68-102.
Ang, R. P. (2005). Development and validation of the Teacher-Student Relationship
Inventory: Using exploratory and confirmatory factor analysis. Journal of
Experimental Education, 74, 55-73.
Baker, J. A., Grant, S., & Morlock, L. (2008). The teacher-student relationship as a
developmental context for children with internalizing or externalizing behavior
problems. School Psychology Quarterly, 23, 3-15.
Bandura, A. (1985). Model of causality in social learning theory. In M. J. Mahoney and
A. Freeman (Eds.), Cognition and psychotherapy (pp. 81-99). New York: Plenum
Publishing Corporation.
Buriel, R. (1983). Teacher-student interactions and their relationship to student
achievement: A comparison of Mexican-American and Anglo-American children.
Journal of Educational Psychology, 75, 889-897.
Chang, D. F., & Demyan, A. (2007). Teachers‘ stereotypes of Asian, Black, and White
students. School Psychology Quarterly, 22, 91-114.
Chang, D. F., & Sue, S. (2003). The effects of race and problem type on teachers‘
assessments of student behavior. Journal of Consulting and Clinical Psychology,
71, 235-242.
Cicchetti, D. (2008). A multiple-levels-of-analysis perspective on research in
development and psychopathology. In T. P. Beauchaine & S. P. Hishaw (Eds.),
Child and adolescent psychopathology (pp. 27-57), Hoboken, NJ: John Wiley &

83
Sons, Inc.
Clark, M. S., & Lemay, E. P., Jr. (2010). Close relationships. In S. T. Fiske, D. T. Gilbert
& G. Lindzey (Eds.), Handbook of social psychology (5th
ed., Vol. 2, pp. 898-940).
New York: Wiley.
Coie, J. D., & Dodge, K. A. (1983). Continuities and changes in children‘s social status:
A five-year longitudinal study. Merrill-Palmer Quarterly, 29, 261-282.
Connell, J. P., & Wellborn, J. G. (1991). Competence, autonomy, and relatedness: A
motivational analysis of self-system processes. In M. R. Gunnar & L. A. Sroufe
(Eds.), Self processes in development: Minnesota Symposium on Child
Psychology (Vol. 23, pp. 43-77). Hillsdale, NJ: Erlbaum.
den Brok, P. J., Levy, J., Rodriguez, R., & Wubbels, T. (2002). Perceptions of Asian-
American and Hispanic-American teachers and their students on teacher
interpersonal communication style. Teaching and Teacher Education, 18, 447-
467.
Doumen, S., Vershueren, K., Buyse, E., De Munter, S., Max, K., & Moens, L. (2009).
Further examination of the convergent and discriminant validity of the Student-
Teacher Relationship Scale. Infant and Child Development, 18, 502-520.
Eagly, A. H., & Chin, J. L. (2010). Are memberships in race, ethnicity, and gender
categories merely surface characteristics? American Psychologist, 65, 934-935.
Eisenhower, A. S., Baker, B. L., & Blacher, J. (2007). Early student-teacher relationships
of children with and without intellectual disability: Contributions of behavioral,
social, and self-regulatory competence. Journal of School Psychology, 45, 363-
383.
Entwisle, D. R., & Alexander, K. L. (1988). Factors affecting achievement test scores and

84
marks of black and white first graders. Elementary School Journal, 88, 449-471.
Finn, J. D., Pannozzo, G. M., & Voelkl, K. E. (1995). Disruptive and inattentive-
withdrawn behavior and achievement among fourth graders. The Elementary
School Journal, 95, 421-434.
Fredricks, J. A., Blumenfield, P. C., & Paris, A. H. (2004). School engagement: Potential
of the concept, state of the evidence. Review of Educational Research, 74, 59-109.
Fumoto, H., Hargreaves, D. J., & Maxwell, S. (2007). Teachers‘ perceptions of their
relationships with children who speak English as an additional language in early
childhood settings. Journal of Early Childhood Research, 5, 135-153.
Furrer, C., & Skinner, E. (2003). Sense of relatedness as a factor in children‘s academic
engagement and performance. Journal of Educational Psychology, 95, 148-162.
Gainey, R. R., & Seyfrit, C. L. (2001). Fear of crime among rural youth: Testing the
generality of urban models to rural areas. Sociological Focus, 34, 269-286.
Hamre, B. K., & Pianta, R. C. (2001). Early teacher-child relationships and the trajectory
of children‘s school outcomes through eighth grade. Child Development, 72, 625-
638.
Hamre, B. K., & Pianta, R. C. (2005). Can instructional and emotional support in the
first-grade classroom make a difference for children at risk of school failure?
Child Development, 76, 949-967.
Hartup, W. W. (1983). Peer relations. In E. M. Hetherington (Ed.), P. H. Mussen (Series
Ed.), Handbook of child psychology: Vol. 4. Socialization, personality, and social
development (pp. 103–196). New York: Wiley.
Henricsson, L., & Rydell, A. (2004). Elementary school children with behavior problems:
Teacher-child relations and self-perception. A prospective study. Merrill-Palmer

85
Quarterly, 50, 111-138.
Ho, D. Y. F., & Chau, A. W. L. (2009). Interpersonal perceptions and metaperceptions of
relationship closeness, satisfaction and popularity: A relational and directional
analysis. Asian Journal of Social Psychology, 12, 173-184.
Ho, D. Y. F., Peng, S., Lai, A. C., & Chan, S. F. (2001). Indigenization and beyond:
Methodological relationalism in the study of personality across cultural traditions.
Journal of Personality, 69, 925-953.
Hofstede, G. (1980). Motivation, leadership, and organization: Do American theories
apply abroad? Organizational Dynamics, 42-63.
Johnstun, M., & Yiu, H. L. (2010). Teacher attitudes and student learning. Unpublished
manuscript, University of Maryland, College Park, MD.
Kalyanpur, M., & Harry, B. (1999). Culture in special education: Building reciprocal
family – professional relationships. Baltimore, MD: Brookes.
Kellam, S. G., Branch, J. D., Agrawal, K. C., & Ensminger, M. E. (1975). Mental health
and going to school. Chicago: The University of Chicago Press.
Kesner, J. (2000). Teacher characteristics and the quality of child-teacher relationships.
Journal of School Psychology, 28, 133-149.
Kim, N. (2009). Asian parents’ perceptions of child disability and school contact for
services. Doctoral dissertation, University of Maryland, December, 2009.
Kingston, E., & Forland, H. (2008). Bridging the gap in expectations between
international students and academic staff. Journal of Studies in International
Education, 12, 204-221.
Kuperminc, G. P., Blatt, S. J., Shahar, G., Henrich, C., & Leadbeater, B. J. (2004).
Cultural equivalence and cultural variance in longitudinal associations of young

86
adolescent self-definition and interpersonal relatedness to psychological and
school adjustment. Journal of Youth and Adolescence, 33, 13-30.
Ladd, G. W., Birch, S. H., & Buhs, E. S. (1999). Children's social and scholastic lives in
kindergarten: Related spheres of influence? Child Development, 70, 1373-1400.
Ladd, G. W., & Burgess, K. B. (1999). Charting the relationship trajectories of aggressive,
withdrawn, and aggressive/withdrawn children during early grade school. Child
Development, 70, 910-929.
Ladd, G. W., & Burgess, K. B. (2001). Do relational risks and protective factors
moderate the linkages between childhood aggression and early psychological and
school adjustment? Child Development, 72, 1579-1601.
Lee, A., Bei, L., & DeVaney, S. A. (2007). Acculturation experiences of Taiwanese
students during exchanges in the United States. Journal of Family and Consumer
Sciences, 99, 56-61.
Lee, J., Lam, W., & Li, Y. (2003). Teacher evaluation and effectiveness in Hong Kong:
Issues and challenges. Journal of Personnel Evaluation in Education, 17, 41-65.
Leung, F. (2005). Some characteristics of East Asian mathematics classrooms based on
data from the TIMSS 1999 video study. Educational Studies in Mathematics, 60,
199-215.
Lin, C., & Fu, V. (1990). A comparison of child-rearing practices among Chinese,
immigrant Chinese, and Caucasian-American parents. Child Development, 61,
429-433.
Lynch, M., & Cicchette, D. (1997). Children‘s relationships with adults and peers: An
examination of elementary and junior high school students. Journal of School
Psychology, 35, 81-99.

87
McCroskey, J. C., & McCroskey, L. L. (1986). The affinity-seeking of classroom
teachers. Communication Research Reports, 3, 158-167.
Meehan, B. T., Hughes, J. N., & Cavell, T. A. (2003). Teacher-student relationships as
compensatory resources for aggressive children. Child Development, 74, 1145-
1157.
Murray, C., & Murray, K. M. (2004). Child level correlates of teacher-student
relationships: An examination of demographic characteristics, academic
orientations, and behavioral orientations. Psychology in the Schools, 41, 751-762.
Murray, S. L., Bellavia, G., Holmes, J. G., Griffin, D. W., & Dolderman, D. (2002).
Kindred spirits? The benefits of egocentrism in close relationships. Journal of
Personality and Social Psychology, 82, 563-581.
Nebbergall, A. (2009). An experimental evaluation of the effects of school-based
universal prevention program on parent and teacher ratings of student behavior.
Doctoral dissertation, University of Maryland, 2009.
Pianta, R. C. (1999). Enhancing relationships between children and teachers.
Washington, DC: American Psychological Association.
Pianta, R. C. (2001). STRS: Student-Teacher Relationship Scale: Professional manual.
Odessa, FL: Psychological Assessment Resources.
Pianta, R. C., Belsky, J., Vandergrift, N., Houts, R., & Morrison, F. J. (2008). Classroom
effects on children‘s achievement trajectories in elementary school. American
Educational Research Journal, 45, 365-397.
Pianta, R. C., & Steinberg, M. (1992). Teacher-child relationships and the process of
adjusting to school. New Directions for Child Development, 57, 61-80.
Pianta, R. C., & Stuhlman, M. W. (2004). Teacher-child relationships and children‘s

88
success in the first years of school. School Psychology Review, 33, 444-458.
Pigott, R. L., & Cowen, E. L. (2000). Teacher race, child race, racial congruence, and
teacher ratings of children‘s school adjustment. Journal of School Psychology, 38,
177-196.
Qin, D. B., Way, N., & Mukherjee, P. (2008). The other side of the Model Minority story:
The familial and peer challenges faced by Chinese American adolescents. Youth
and Society, 39, 480-506.
Raudenbush, S. W., & Bryk, A. S. (2002). Hierarchical linear models: Applications and
data analysis methods. Thousand Oaks, CA: Sage Publications.
Rosenbloom, S. R., & Way, N. (2004). Experiences of discrimination among African
American, Asian American, and Latino Adolescents in an urban high school.
Youth Society, 35, 420-451.
Rosenfield, S., & Gottfredson, G. (2004). Evaluating the Efficacy of Instructional
Consultation Teams. Unpublished grant proposal. University of Maryland,
Department of Counseling and Personnel Services. Retrieved August 11, 2009
from http://www.icteams.umd.edu/Proposal%20for%20Project.pdf
Rosenfield, S. A., & Gravois, T. A. (1996). Instructional Consultation Teams:
Collaborating for change. New York: Guildford Press.
Rubin, D. B. (1987). Multiple imputation for nonresponse in surveys. New York: Wiley.
Rudasill, K. M., & Konold, T. R. (2008). Contributions of children‘s temperament to
teachers‘ judgement of social competence from kindergarten through second
grade. Early Education and Development, 19, 643-666.
Rydell, A., Bohlin, G., & Thorell, L. B. (2005). Representations of attachment to parents
and shyness as predictors of children's relationships with teachers and peer
89
competence in preschool. Attachment and Human Development, 7, 187-204.
Saft, E. W., & Pianta, R. C. (2001). Teachers‘ perceptions of their relationships with
students: Effects of child age, gender, and race of teachers and children. School
Psychology Quarterly, 16, 125-141.
Schafer, J. L. (2000). NORM for Windows 95/98/NT: Multiple imputation of incomplete
multivariate data under a normal model (Version 2.03). Retrieved from
Pennsylvania State University, Development of Statistics Web site:
http://www.stat.psu.edu/~jls/misoftwa.html
Skinner, E. A., & Belmont, M. J. (1993). Motivation in the classroom: Reciprocal effects
of teacher behavior and student engagement across the school year. Journal of
Educational Psychology, 85, 571-581.
Suh, S., & Satcher, J. (2005). Understanding at-risk Korean American youth.
Processional School Counseling, 8, 428-435.
Takeuchi, D. T., Bui, K. T., & Kim, L. (1993). The referral of minority adolescents to
community mental health centers. Journal of Health and Social Behavior, 34,
153-164.
U.S. Census Bureau. Table 7. Projected Change in Population Size by Race and Hispanic
Origin for the United States: 2000 to 2050. (August 13, 2008). Retrieved 19
November 2008, from
http://www.census.gov/population/www/projections/summarytables.html.
U.S. Department of Health and Human Services. (2001). Mental Health: Culture, Race,
and Race—A Supplement to Mental Health: A Report of the Surgeon General.
Rockville, MD: U.S. Department of Health and Human Services, Substance
Abuse and Mental Health Services Administration, Center for Mental Health

90
Services.
Valeski, T. N., & Stipek, D. J. (2001). Young children‘s feelings about school. Child
Development, 72, 1198-1213.
Vu, P., Shanahan, K.B., Koehler, J., Kaiser, L., Rosenfield, S., Nelson, D., Gravois, T.,
Berger, J., Vaganek, M., & Gottfredson, G. (2010). The effects of Instructional
Consultation Teams on teacher beliefs and instructional practices. Unpublished
manuscript. Department of Counseling and Personnel Services, University of
Maryland, College Park.
Waters, E. (1995). Appendix A: The Attachment Q-set (Version 3.0). Monographs of the
Society for Research in Child Development, 60, 234-246.
Werthamer-Larsson, L., Kellam, S., & Wheeler, L. (1991). Effect of first-grade
classroom environment on shy behavior, aggressive behavior and concentration
problems. American Journal of Community Psychology, 19, 585-602.
Yiu, H. L. (2010). Teacher ratings of student behaviors and the student-teacher
relationship: A focus on Asian American students. Unpublished manuscript.
Department of Counseling and Personnel Services, University of Maryland,
College Park.
Yoon, J. S. (2002). Teacher characteristics as predictors of teacher-student relationships:
Stress, negative affect, and self-efficacy. Social Behavior and Personality, 30,
485-494.
Zimmerman, R. S., Khoury, E. L., Vega, W. A., Gil, A. G., & Warheit, G. J. (1995).
Teacher and parent perceptions of behavior problems among a sample of African
American, Hispanic, and non-Hispanic white students. American Journal of
Community Psychology, 23, 181-197.