abstract title page title: mixed methods evaluation of ... and affiliations: sarah brasiel, utah...
TRANSCRIPT

SREE Spring 2016 Conference Abstract Template
Abstract Title Page
Title: Mixed Methods Evaluation of Statewide Implementation of Mathematics Education
Technology for K-12 Students
Authors and Affiliations: Sarah Brasiel, Utah State University; Taylor Martin, National
Science Foundation; Soojeong Jeong, Utah State University; Min Yuan, Utah State
University

SREE Spring 2016 Conference Abstract
Abstract
Background
An extensive body of research has demonstrated that the use in a K-12 classroom of
technology, such as the Internet, computers, and software programs, enhances the learning of
mathematics (Cheung & Slavin, 2013; Cohen & Hollebrands, 2011). In particular, growing
empirical evidence supports that certain types of technology, such as intelligent tutoring systems
and adaptive learning systems, have a positive impact on students’ academic achievement in
math and their attitudes toward math (Arroyo, Burleson, Tai, Muldner, & Woolf, 2013; Ma,
Adesope, Nesbit, & Liu, 2014; Pane, Griffin, McCaffrey, & Karam, 2013; Steenbergen-Hu &
Cooper, 2013). These kinds of learning systems yield positive effects by providing students with
personalized instruction tailored to “the pace, order, location, and content of a lesson uniquely
for each student” (Enyedy, 2014, p. 3). For example, while learning math using a personalized
instructional system, different math quizzes and contents are delivered to different students based
on their present levels of understanding and mastery of a particular math lesson. Consequently,
these education technology systems can support mathematics teachers in effectively meeting the
needs of all students.
Research has identified a variety of factors that may influence teachers’ integration of
technology, including infrastructure (Armstrong, 2014), teachers’ attitudes and experience with
technology (O’Hanlon, 2009), teachers’ technical skills (Ertmer, 1999) and teachers’ self-
efficacy beliefs about technology use (Lee & Lee, 2014; Wang, Ertmer, & Newby, 2004). In
addition, Koehler and Mishra (2009) argue that teachers’ knowledge and perceptions about
technology integration into their teaching are also critical constructs to be considered in
maximizing the impact of educational technology.
Technological Pedagogical Content Knowledge (TPACK) is a conceptual framework that
focuses on three essential components—content, pedagogical, and technological knowledge—
that has been widely adopted to understand and examine the knowledge that teachers should
have to implement technology effectively in their classrooms (Koehler & Mishra, 2009; Mishra
& Koehler, 2006). In addition, the Mathematics Teacher TPACK Development Model has also
been proposed to provide details about what teachers may experience and feel while teaching
math using technology, and how they develop their mathematics TPACK knowledge (Niess et
al., 2009). This model includes four major themes, including Curriculum and Assessment,
Learning, Teaching and Access, each of which has a five-level developmental process when
incorporating a new technology into math teaching, including Recognizing (knowledge),
Accepting (persuasion), Adapting (decision), Exploring (implementation), and Advancing
(confirmation).
Objective
Education technology can support mathematics teachers in effectively teaching many
students with varying levels of mathematical skills and motivation in their classrooms. However,
despite the recognized benefits, many teachers still struggle with successfully integrating
technology into their instruction. Through funding from the state legislature, over 200,000 K-12
students were given access to 11 mathematics education technology products. We surveyed
teachers to understand the implementation successes and challenges. Our review of prior
research and the TPACK framework informed our research as we analyzed open-ended survey
SREE Spring 2016 Conference Abstract
data on teachers’ perceptions of the education technology implementation over one school year.
At the end of the year we collected data from the state office of education on student assessment
and demographic characteristics for use in a quasi-experiment to understand the impact of the
mathematics technology products. We were interested in addressing the following research
questions:
1. Is there any significant effect of using mathematics education technology through the
statewide grant program on student state achievement?
2. Is there any significant effect of using the technology for students who met the
fidelity of implementation benchmark?
3. How were the education technology products being used?
4. With what features of the products or experiences are teachers most satisfied?
5. What concerns or challenges have teachers experienced with use of the products?
6. What barriers limit teachers from using the products to their desired level?
7. How have teachers used the performance management features of the products?
Setting
This study was conducted in the North American Intermountain Region. Districts and
Charter Schools across the state were invited to apply to receive a grant to use education
technology products with their students.
Participants
Licenses were distributed to 193,213 students across the state. We collected demographic
data along with state assessment data from the state office of education for all students who had
evidence of usage of the products and who had parent permission to be included in the
evaluation. Based on the data file we were given from the state that included students in the grant
program and the rest of the students in the state we provide the comparison in the Appendix,
Table 1. This data does not represent the full sample of students given access to the licenses,
because the state only provided us with data for students in grades 4-12 who completed an
assessment in 2013-14 (baseline) and in 2014-15 (outcome).
Intervention
All providers of K-12 mathematics technology programs had to meet minimum
requirements of providing a system that was adaptive and personalized to meet individual
student needs. Eleven products were selected through a Request for Proposal process. The
product had to provide real time reporting to teachers and students of their progress and areas of
needs. It also had to provide supports to address student needs. We also asked the product
providers to share the fidelity of implementation benchmark for their product, which is the
recommended usage level to expect improved student achievement outcomes. In Table 1 we
provide a list of the products, the grades in which they were implemented across the state and the
description of the fidelity benchmark from the product provider.

SREE Spring 2016 Conference Abstract
Research Design
We are using a mixed methods design to understand the impact of the use of mathematics
education technology products on student achievement and to understand the experience of
teachers integrating technology into their classrooms.
Data Collection and Analysis
Each month we requested usage data from the providers and put this information into a
spreadsheet by school and district to compare the licenses distributed to the licenses requested
and to determine which licenses had evidence of usage. At the end of December, the providers
had distributed 141,437 licenses, but usage was only at about 52 percent overall. The state
agency sent districts reminder e-mails requesting that they work with the providers if there were
implementation issues to improve usage. At the end of the school year based on cumulative
usage through mid-June there were 193,213 licenses distributed with a 78 percent usage amount.
However, only 9 percent of students across products had used the products at the recommended
level (fidelity benchmark) set by product provider.
Next, we compare the achievement of students using the technology products with
students not using the technology products by matching students based on similar student
characteristics (prior achievement and student demographics). Once the students are matched we
will conduct a baseline characteristic comparison using appropriate statistical methods,
depending on the type of characteristic. Any meaningful differences will be controlled for with a
variable in the final set of analyses.
One added complexity to this impact analysis is that the assessment is a vertical scaled
score. We have to create matches for students taking the same test title. We just received the
state data and we are using propensity score matching to create this matched comparison group.
Through matching students in the program to students not in that program using the propensity
score, a quasi-experimental control group is formed which balances the two groups in terms of
important demographic and achievement variables related to the ultimate desired outcome—
student achievement in mathematics. Using the spring 2015 state achievement scores, we are
comparing the student achievement for the two groups to see if there is a meaningful difference.
While use of the scale scores would be best, we would have to analyze the data by test type
which significantly decreases our sample size per analysis. Therefore, we have decided to
combine all students regardless of test type, along with their matches, to conduct our analysis on
the met proficiency binary outcome (0/1 coded).
We will use a single level logistic regression with cluster corrected standard errors. We
are also doing an analysis to look at the effect for students who met the fidelity benchmark,
which reduces the sample size significantly by product; however, given the low usage rates it is
important to see if there are differences in effects when looking at students who met the fidelity
benchmark. We will also conduct an analysis of interactions between student subgroups and the
intervention effect for students in special education, English Language Learners, and students
who are eligible to receive free or reduced price lunch.
We administered the satisfaction/concerns survey to the teachers using Qualtrics, an
online survey platform. We used an open coding method for coding and categorizing
participants’ responses (Strauss & Corbin, 1998). Subsequently, themes emerged from the
analysis that we report in the Appendix section as percent of teachers’ responses with each theme
SREE Spring 2016 Conference Abstract
along with representative feedback as exemplars of each theme. We coded the same themes
across products in order to compare features with which teachers were satisfied or concerned
across products. We also coded themes in common constraints and barriers to implementation as
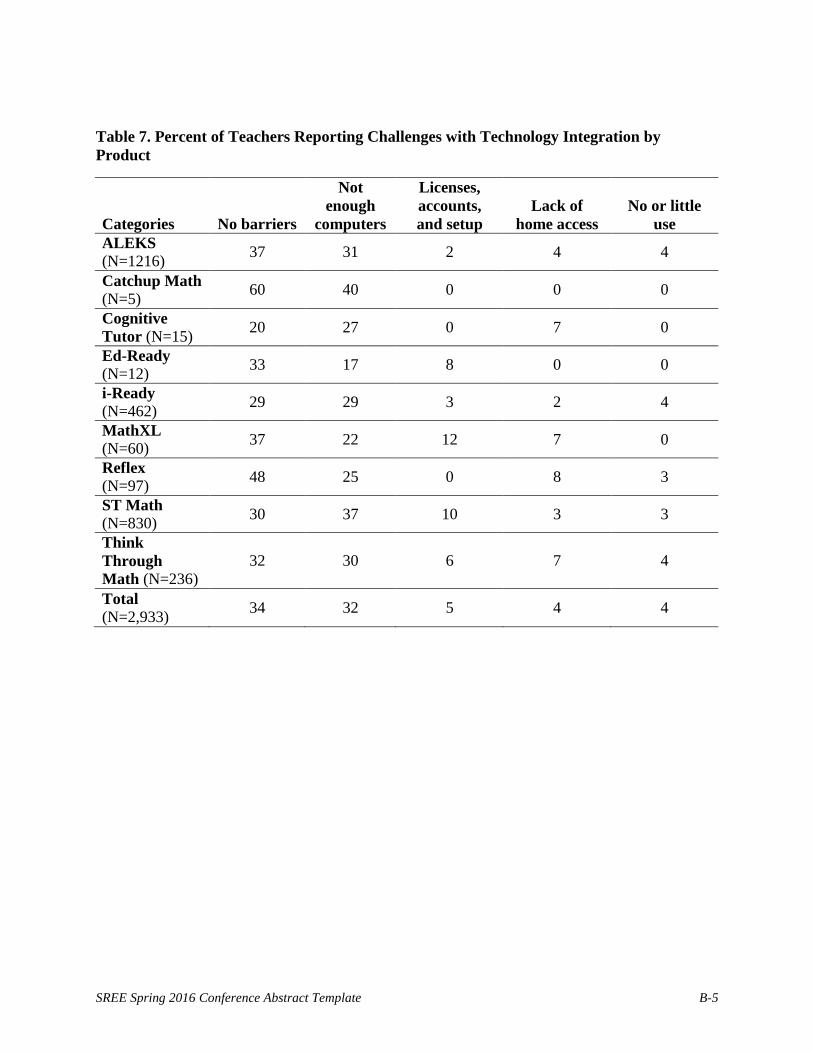
well as features of the performance management data that they found useful (see Appendix
Tables 3 to 7).
Findings
We are in the process of conducting the analysis of the impact of the technology products
on student achievement. Our analysis should be complete at the end of October 2015. However,
we have completed our analysis of the teacher feedback which we present a summary of in
Appendix B (Tables 3 to 7). There were 2,933 teachers who completed the survey to provide
feedback on their experience using the product. This included data for 9 of the 11 products. The
two products where no teacher feedback was provide were products that no district or charter
school requested to continue usage during year 2 of the project (2015-16 school year). We infer
that the experience was not positive, since they decided not to continue implementation.
Based on responses to the first survey question about usage of the products, 56 percent of
teachers reported using the product as a supplement and 28 percent reported using the product as
an intervention. Fifty-seven percent of the teachers reported overall satisfaction with the product
they were implementing. Eleven percent reported being most satisfied with the adaptive features
of the product that individualize instruction for the students. Ten percent reported being satisfied
with student engagement while using the product.
Very few teachers reported anything negative about the product, with the greatest
number, 6 percent, reporting technical difficulties with the program. Lack of access to computers
was the largest constraint to implementation reported by 32 percent of the teachers surveyed.
Thirty-four percent of the teachers had used the performance management features of the product
to monitor their students’ progress.
Conclusions
While the state assessment data is very important, we provide a detailed overview of
teacher feedback, because it sheds light on their experiences implementing the
products/programs and opportunities to learn lessons from implementation that can inform future
years of implementation. The work in this state is also a model for other states to consider to
ensure that a rigorous evaluation is conducted when public funds are used to assess best
practices, but also to understand the experiences of teachers and students involved in the
implementation. If there are significant effects found, we will also look at cost effectiveness with
a return on investment analysis. We emphasize in our work with the state, that when making
purchasing decisions it is important to consider cost-effectiveness and user satisfaction.

SREE Spring 2016 Conference Abstract
Appendices
Appendix A. References
Armstrong, A. (2014). Technology in the Classroom It’s Not a Matter of “If,” but “When” and
“How.” Education Digest, 79(5), 39–46.
Arroyo, I., Burleson, W., Tai, M., Muldner, K., & Woolf, B. P. (2013). Gender differences in the
use and benefit of advanced learning technologies for mathematics. Journal of
Educational Psychology, 105(4), 957.
Cheung, A. C., & Slavin, R. E. (2013). The effectiveness of educational technology applications
for enhancing mathematics achievement in K-12 classrooms: A meta-analysis.
Educational Research Review, 9, 88-113.
Cohen, J., & Hollebrands, K. F. (2011). Technology Tools to Support Mathematics Teaching. In
Focus in High School Mathematics: Technology to Support Reasoning and Sense
Making. Reston, VA: National Council of Teachers of Mathematics.
Enyedy, N. (2014). Personalized Instruction: New Interest, Old Rhetoric, Limited Results, and
the Need for a New Direction for Computer-Mediated Learning. Boulder, CO: National
Education Policy Center. Retrieved July, 13, 2015, from
http://nepc.colorado.edu/publication/personalized-instruction.
Ertmer, P. A. (1999). Addressing first-and second-order barriers to change: Strategies for
technology integration. Educational Technology Research and Development, 47(4), 47-
61.
Koehler, M., & Mishra, P. (2009). What is technological pedagogical content knowledge
(TPACK)?. Contemporary issues in technology and teacher education, 9(1), 60-70.

SREE Spring 2016 Conference Abstract
Lee, Y., & Lee, J. (2014). Enhancing pre-service teachers' self-efficacy beliefs for technology
integration through lesson planning practice. Computers & Education, 73, 121-128.
Ma, W., Adesope, O. O., Nesbit, J. C., & Liu, Q. (2014). Intelligent tutoring systems and
learning outcomes: A meta-analysis. Journal of Educational Psychology, 106(4), 901-
918.
Mishra, P., & Koehler, M. (2006). Technological pedagogical content knowledge: A framework
for teacher knowledge. The Teachers College Record, 108(6), 1017-1054.
Niess, M. L., Ronau, R. N., Shafer, K. G., Driskell, S. O., Harper, S. R., Johnston, C., ... &
Kersaint, G. (2009). Mathematics teacher TPACK standards and development model.
Contemporary Issues in Technology and Teacher Education, 9(1), 4-24.
O’Hanlon, C. (2009). Resistance is Futile. T H E Journal, 36(3), 32–36.
Pane, J. F., Griffin, B. A., McCaffrey, D. F., & Karam, R. (2013). Effectiveness of cognitive
tutor algebra I at scale. Educational Evaluation and Policy Analysis, 36(2), 141.
DOI:10.3102/0162373713507480.
Steenbergen-Hu, S., & Cooper, H. (2013). A meta-analysis of the effectiveness of intelligent
tutoring systems on K–12 students’ mathematical learning. Journal of Educational
Psychology, 105(4), 970-987. doi:http://dx.doi.org/10.1037/a0032447
Wang, L., Ertmer, P. A., & Newby, T. J. (2004). Increasing preservice teachers’ self-efficacy
beliefs for technology integration. Journal of Research on Technology in Education,
36(3), 231-250.

SREE Spring 2016 Conference Abstract Template B-1
Appendix B. Tables and Figures
Table 1. Comparison of Students in the Grant Program to Other Students in the State
Description Grant Program Comparison Students
Total Students 74,627 282,067
Percent Male 52% 51%
Percent ELL 4.3% 4.1%
Percent SPED 12.87% 10.87%
Percent Free/Reduced Lunch 41.27% 35.80%
Percent Ethnicity
African-American/Black 1.41% 1.33%
American Indian 1.67% 1.03%
Asian 1.42% 1.91%
Caucasian/White 75.74% 75.43%
Hispanic/Latino 16.30% 16.46%
Multiple Races 2.07% 2.24%
Pacific Islander 1.38% 1.60%
Mathematics Proficiency Baseline (2013-14)
Level 1: Below Proficient 21.15% 19.32%
Level 2: Approaching Proficient 15.86% 15.32%
Level 3: Proficient 15.37% 15.64%
Level 4: Highly Proficient 9.76% 10.27%
Table 2. List of Products, Grades Implemented, and Description of Fidelity Benchmarks
Product (Provider) Grades Description of Benchmark
ALEKS
(McGraw-Hill) K-5, 6-8, 9-12 Minimum of 480 minutes (8 hours)
Cognitive Tutor
(Carnegie Learning) 9-12 Not available
EdReady
(The NROC Project) 9-12 Not applicable*
Catchup Math
(Hot Math) 6-8, 9-12 Not available
i-Ready
(Curriculum Associates) K-5, 6-8 30 minutes per week

SREE Spring 2016 Conference Abstract Template B-2
Product (Provider) Grades Description of Benchmark
Math XL
(Pearson) 9-12 Not available
Odyssey Math
(Compass Learning) 6-8 Not available
Reflex
(Explore Learning) 6-8
An algorithm that includes fluency gains and
average number of logins per week.
ST Math
(Mind Research) K-5, 6-8
An algorithm based on content progress
and/or lab logins that differs by grade.
SuccessMaker
(Pearson) K-5 Not available **
Think Through Math
(Think Through Learning) K-5, 6-8 >20 lessons passed
Note. * ”Not applicable” is noted for EdReady, a product where usage decisions are left to the teacher; therefore,
there was no usage benchmark for recommended usage. ** “Not available” is noted when providers were not able to
provide a benchmark in their data set.
Table 3. Percent of Teachers Responding about Usage by Product
Categories Supplement
to instruction
Intervention or
Differentiation
Selected
materials for
homework
Practice for
developing
skill fluency
Review and
re-teaching
ALEKS
(N=1216) 49 26 16 6 10
Catchup Math
(N=5) 40 40 0 0 0
Cognitive
Tutor (N=15) 100 13 0 0 0
Ed-Ready
(N=12) 17 8 0 8 0
i-Ready
(N=462) 47 42 8 4 1
MathXL
(N=60) 25 8 53 3 0
Reflex
(N=97) 34 24 30 29 19
ST Math
(N=830) 70 23 13 10 5
Think
Through
Math (N=236)
75 36 13 15 8
Total
(N=2,933) 56 28 15 8 7

SREE Spring 2016 Conference Abstract Template B-3
Table 4. Percent of Teachers with Positive Satisfaction by Product
Categories
Satisfied
with
provided
technology
Learning is
adaptive and
individualized
for students
Students are
engaged
when using
technology
Develops
students’
knowledge or
skills
Student
success or
positive
experience
ALEKS
(N=1216) 59 16 3 3 5
Catchup Math
(N=5) 0 20 20 0 20
Cognitive
Tutor (N=15) 40 0 0 0 0
Ed-Ready
(N=12) 0 8 0 0 17
i-Ready
(N=462) 20 7 6 1 2
MathXL
(N=60) 53 8 2 0 2
Reflex
(N=97) 62 6 20 20 6
ST Math
(N=830) 77 5 18 9 7
Think
Through
Math (N=236)
52 19 22 17 8
Total
(N=2,933) 57 11 10 6 5
Table 5. Percent of Teachers with Negative Feedback by Product
Categories
Product
technical
problems
Not used the
technology
yet
Student
frustration
or difficulty
Lack of
challenge or
boring to
students
Need more
time to use
the product
ALEKS
(N=1216) 5 9 2 2 2
Catchup Math
(N=5) 0 0 0 0 0
Cognitive
Tutor (N=15) 7 0 13 0 7
Ed-Ready
(N=12) 0 0 0 0 0
i-Ready
(N=462) 5 2 1 2 7
MathXL 2 12 5 0 2

SREE Spring 2016 Conference Abstract Template B-4
Categories
Product
technical
problems
Not used the
technology
yet
Student
frustration
or difficulty
Lack of
challenge or
boring to
students
Need more
time to use
the product
(N=60)
Reflex
(N=97) 0 3 0 2 1
ST Math
(N=830) 7 2 3 2 1
Think
Through
Math (N=236)
10 1 10 6 1
Total
(N=2,933) 6 5 3 2 2
Table 6. Percent of Teachers Responding About Specific Use of Performance Management
Features by Product
Categories
Monitor
students’
progress
Did not Use Guide
instruction
Used to
determine
product usage
Used for
student IEP
or RTI
ALEKS
(N=1216) 31 21 15 17 4
Catchup Math
(N=5) 20 0 0 40 20
Cognitive
Tutor (N=15) 0 27 0 20 0
Ed-Ready
(N=12) 50 8 8 8 0
i-Ready
(N=462) 29 1 9 1 19
MathXL
(N=60) 35 8 12 12 10
Reflex
(N=97) 57 3 4 9 5
ST Math
(N=830) 31 38 11 4 9
Think
Through
Math (N=236)
61 4 9 6 12
Total
(N=2,933) 34 20 12 10 9
SREE Spring 2016 Conference Abstract Template B-5
Table 7. Percent of Teachers Reporting Challenges with Technology Integration by
Product
Categories No barriers
Not
enough
computers
Licenses,
accounts,
and setup
Lack of
home access
No or little
use
ALEKS
(N=1216) 37 31 2 4 4
Catchup Math
(N=5) 60 40 0 0 0
Cognitive
Tutor (N=15) 20 27 0 7 0
Ed-Ready
(N=12) 33 17 8 0 0
i-Ready
(N=462) 29 29 3 2 4
MathXL
(N=60) 37 22 12 7 0
Reflex
(N=97) 48 25 0 8 3
ST Math
(N=830) 30 37 10 3 3
Think
Through
Math (N=236)
32 30 6 7 4
Total
(N=2,933) 34 32 5 4 4