abstract - university of wisconsin system
TRANSCRIPT

ABSTRACT
WOLK, M.L. A biomechanical com~arison of the vertical jump and Marnaria Dower tests. M.S. in Physical Education- Human Performance, 1988, 82 p. (E.K. French).
A comparison of two power tests was conducted using 12 athletes (N - 7 males, N - 5 females) from the University of Wisconsin - La Crosse track and field teams. The subjects were filmed in an outdoor setting performing the Margaria stair run test and the vertical jump test. Anaerobic power output and average vertical velocity were computed for each test based upon two methods, a standard or commonly used procedure and a more complex cinematographic procedure involving center of gravity displacement techniques. Using dependent samples, paired t-tests were conducted on the various combinations to determine if a significant difference (p < .05) existed between the two methods. All differences were statistically significant except two. The two insignificant results were produced when power and velocity values were compared between the cimematographic method for the stair run and vertical jump test. This would indicate that when determining anaerobic power output based upon mechanical principles, the Margaria and vertical jump tests appeared to produce similar scientific measures. It was also found that the standard method of the vertical jump test appeared to overestimate power outputs whereas the Margaria stair run test appeared to underestimate power outputs when compared to the cinematographic methods. Although it is still uncertain which test will provide the best measure of anaerobic power, a conclusion drawn from this study was that both tests can be considered functional because of providing average values which estimate human power output.
A Biomechanical Comparison of the
Vertical Jump and Margaria Power Tests
A Thesis Presented
The Graduate Faculty
University of Wisconsin - La Crosse
In Partial Fulfillment
of the Requirements for the
Master of Science Degree
Mary Louise Wolk
December 1988
UNIVERSITY OF WISCONSIN - LA CROSSE College of Health, Physical Education and Recreation
La Crosse, Wisconsin 54601
Candidate: Marv Louise Wolk
We recommend acceptance of this thesis in partial fulfillment of this
candidate's requirements for the degree:
Master of Science Phvsical Education-Human Performance
The candidate has completed her oral report.
Thesis Committee Chairperson Date
r L -
Thesis Committee Member / "
- Thesis Committee Member
3 -3J-A9 Date
This thesis is approved for the College of Health, Physical Education and Recreation.
1
/ d ~ & ~ ~ & Dean, College of Health, Physical Education Date
and ~ecreation
&=-Jd -x9' ~&n&f Graduate Studies Date

ACKNOWLEDGEMENTS
I would like to thank my thesis committee for all their time
and efforts spent proofreading, and for their positive attitudes which
helped me to write a thesis I could be proud of.
I would like to express my sincere gratitude to Dr. Keith
French for acting as my thesis chairman. All of your biomechanical
expertise and never ending patience and support helped me to turn my
unpolished thoughts into a successful research project.
Also, I wish to express my appreciation to my committee members. I
Thank you Dr. William Floyd for contributing your knowledge of the
exercise sciences and for your inquisitive challenge that helped to
stay on the right track. Likewise, thank you Dr. Dennis O'Brien for
your mathematical expertise that helped me to understand the
statistical analysis and results of my research project.
A special thank you goes to my fellow graduate students who
helped as filming assistants, Further, my deepest thanks goes to the
1988 University of Wisconsin - La Crosse track and field team members
who participated in the study.
And lastly, I would like to thank my family and special friends
for their faith and encouragement throughout my graduate schooling,
which truly added to the success of it all,
iii

TABLE OF CONTENTS
ACKNOWLEDGEMENTS ................................................. iii CHAPTER
I . INTRODUCTION ................................................. 1 Purpose of the Study ....................................... 2 Statement of the Problem ................................... 2 Need for the Study ......................................... 3 Hypotheses ................................................. 4 Assumptions ................................................ 5 Delimitations . . . . . . . . . . . . . . . . . . . . . . . . . . . . . . . . . . . . . . . . . . . . . . 6 Limitations . . . . . . . . . . . . . . . . . . . . . . . . . . . . . . . . . . . . . . . . . . . . . . . . 6 Definitions of Terms . . . . . . . . . . . . . . . . . . . . . . . . . . . . . . . . . . . . . . . 6
I1 . REVIEW OF LITERATURE . . . . . . . . . . . . . . . . . . . . . . . . . . . . . . . . . . . . . . . . . 9
Components of Power Production . . . . . . . . . . . . . . . . . . . . . . . . . . . . . 9 . . . . . . . . . . . . . . . . . . . . . . . . . . . . . . . . . . Misuse of the Term Power 12
Measurement of Anaerobic Power . . . . . . . . . . . . . . . . . . . . . . . . . . . . . 16 Vertical Jump Test . . . . . . . . . . . . . . . . . . . . . . . . . . . . . . . . . . . . . . 16 Margaria Stair Test . . . . . . . . . . . . . . . . . . . . . . . . . . . . . . . . . . . . . 23 Evaluation of Power Tests . . . . . . . . . . . . . . . . . . . . . . . . . . . . . . . 24
Relationship of Power to Athletic Performance . . . . . . . . . . . . . 26 Factors Influencing Power Production . . . . . . . . . . . . . . . . . . . . . . 2 9 Summary . . . . . . . . . . . . . . . . . . . . . . . . . . . . . . . . . . . . . . . . . . . . . . . . . . . 37
I11 . METHODS . . . . . . . . . . . . . . . . . . . . . . . . . . . . . . . . . . . . . . . . . . . . . . . . . . . . . 38
Subject Selection . . . . . . . . . . . . . . . . . . . . . . . . . . . . . . . . . . . . . . . . . 38 Preliminary Investigation . . . . . . . . . . . . . . . . . . . . . . . . . . . . . . . . . . 39 Testing Procedures . . . . . . . . . . . . . . . . . . . . . . . . . . . . . . . . . . . . . . . . 39 Vertical Jump Test . . . . . . . . . . . . . . . . . . . . . . . . . . . . . . . . . . . . . . 39 Margaria Stair Test ..................................... 4 2
Cinematographic Procedures . . . . . . . . . . . . . . . . . . . . . . . . . . . . . . . . 4 5 Kinematic Analysis ........................................ 4 9 Statistical Treatment of Data ............................ 52
...................................... . IV RESULTS AND DISCUSSION 53
........................................ Summary of Results 53 Subject Characteristics .................................. 53 Vertical Jump Test ...................................... 5 4 Margaria Stair Test ..................................... 55 Statistical Analysis . . . . . . . . . . . . . . . . . . . . . . . . . . . . . . . . . . . . 56
Discussion of Results . . . . . . . . . . . . . . . . . . . . . . . . . . . . . . . . . . . . . 57

. . . . . . . . . V . SUl4MARY. FINDINGS. CONCLUSIONS. AND RECOMMENDATIONS 67
Swnmary ................................................... 67 Findings .................................................. 68 Conclusions ............................................... 69 Recommendations ........................................... 69
REFERENCES CITED .................................................. 71 . . . . . . . . . . . . . . . . . . . . . . . . . . . . . . . . . . . . . . . . . . . . . . . . . . . . . LIST OF FIGURES v
LIST OF TABLES .................................................... vi LIST OF APPENDICES . . . . . . . . . . . . . . . . . . . . . . . . . . . . . . . . . . . . . . . . . . . . . . . vii
LIST OF FIGURES
FIGURE 1 . Filming Set-up for Margaria Stair Test
FIGURE 2 . Filming Set-up for Vertical Jump Test
LIST OF TABLES
TABLE 1 . Subject Characteristics . . . . . . . . . . . . . . . . . . . . . . . . . . . . . . . . . 54 TABLE 2 . Vertical Jump Test Results .............................. 55 TABLE 3 . Margaria Stair Test Results ............................. 56 TABLE 4 . Paired T-Test Statistical Analysis . . . . . . . . . . . . . . . . . . . . . . 57

LIST OF APPENDICES
APPENDIX A . Informed Consent . . . . . . . . . . . . . . . . . . . . . . . . . . . . . . . . . . . . . 75
APPENDIX B . Lewis Nomogram ....................................... 77
APPENDIX C . Kinematic Data Input Procedure ....................... 79 APPENDIX D . Displacement and Time Data . . . . . . . . . . . . . . . . . . . . . . . . . . . 81
CHAPTER I
INTRODUCTION
With only fractions of a second separating many winning
performances, athletes are continually searching for ways to gain the
competitive edge. One area thought to be an important contributor to
the level of performance in many sports is that of anaerobic power, which
should be of considerable value to sport specialists interested in peak
performance. That may be why presently there has been more and more
talk about power athletes. However, coaches, trainers, and other sport
specialists have continued to misinterpret or overlook this concept of
human muscle power.
Anaerobic activities consist of high intensity movements of short
duration and are frequently described as explosive. Fundamentally
anaerobic power is defined as, "the exertion of force through a given
distance in as short a time as possible" (Beckenholdt & Mayhew, 1983;
p.326). By the nature of this definition a rate becomes associated with
the term power, and therefore can simply be referred to as the rate of
work done by the muscles. Although this concept appears to be a
theoretically valid approach, there is still some controversy
surrounding the tests used to measure human power output.
Two of the more functional tests used to estimate anaerobic power are
the stair climb and the vertical jump. At the present time however,
there does not appear to be a universally accepted test which produces a
single besttmeasure of maximal muscle power. Since anaerobic power is
1

considered a key component in many athletic events, it is unfortunate
that this phenomenon has not been accurately defined and tested.
Pur~ose of the Studv
Anaerobic power is a complex concept comprised of physiological,
mechanical, and psychomotor components. The purpose of this study was
to biomechanically investigate the physical trait of anaerobic power
through the use of cinematography. The Margaria stair test and the
vertical jump test were used to analyze this concept and to gain some
insight into the mechanical factors contributing to power output.
Statement of the Problem
The main problem of this study was to compare a standard method and
a cinematographic method for computing power output as generated by two
- customary field tests used to measure anaerobic power. The standard
method was based upon common procedures for determining the vertical
distance used to compute power output; whereas the cinematographic method
involved a center of gravity displacement procedure for determining the
vertical distance used to compute power output. Also, a subproblem of
the study was to examine the average vertical velocity for both the
Margaria and vertical jump tests as determined by the two methods.
Investigation of these problems will help determine the extent to which
the stair test and vertical jump test are comparable measurements of
power based upon mechanical principles.

Need for the Studv
Muscular power is quite apparent and of great importance in the
sporting environment. As stated by Barlow (1971) however, "because of
the importance of the use of power in athletic and physical performance,
tests of explosive power appear to be some of the most frequently used
but also misapplied measure in physical education" (p. 234). Although
anaerobic power plays an important role in many sports, a review of the
literature exposed a lack of sufficient biomechanical information,
leaving a gap as to how this concept of power should be interpreted and
applied to an athlete's training program.
Despite the widespread concern over power production, it may be one
of the most inconsistently used terms dealing with physical activity.
"The label of power has been applied too loosely in the sports medicine
literature, creating what now amounts to an identity problem for the
term" (Sapega & Drillings, 1983; p. 7). Also, judging by the improper
and inconsistent use of the term power throughout the literature, it
appeared that researchers have been neglecting the true physical
definition of anaerobic power. So until the confusion encompassing the
term power is resolved, one will have a hard time clearly understanding
and consistently applying this parameter we know as human muscle power.
The need for this study was invoked by the uncertainty surrounding
the tests and measurement of anaerobic power, which is at the base of all
of our existing knowledge. The validity of these tests is questionable
because of the lack of objective criteria against which they were
originated, and the implied over-generalization of the results (Barlow,

1971). Objectively investigating some of the kinetic and kinematic
factors related to the stair climb and vertical jump tests would not
only lend support to the validity of these tests used to measure
anaerobic power, but also help identify whether or not these easily
administered field tests are measuring power in its true mechanical
form. Specifically identifying biomechanical principles related to these
tests of anaerobic power might well enrich the existing body of
knowledge related to power, and in turn filter its way down from a
research level to a more practical level where it can improve athletic
performance .
Hmotheses
The following null hypotheses were proposed for this study:
a 1. There will be no significant difference between the power
output derived from the Margaria and vertical jump power tests as
determined by the standard methods.
2. There will be no significant difference between the power
output derived from the Margaria and vertical jump power tests as
determined by the cinematographic methods.
3 . There will be no significant difference between the power
output derived from the Margaria test as determined by the standard and
cinematographic methods.
4. There will be no significant difference between the power
output derived from the vertical jump test as determined by the standard
and cinematographic methods.
5 . There will be no significant difference between the average
vertical velocity derived from the Margaria and vertical jump tests as
determined by the standard methods.
6 . There will be no significant difference between the average
vertical velocity derived from the Margaria and vertical jump tests as
determined by the cinematographic methods.
7 . There will be no significant difference between the average
vertical velocity derived from the Margaria test as determined by the
standard and cinematographic methods.
8 . There will be no significant difference between the average
vertical velocity derived from the vertical jump test as determined by
the standard and cinematographic methods.
Assumv tions
The following assumptions were made for this study:
1. The subjects performed naturally and to the best of their
ability when executing both power tests.
2. The trials selected for biomechanical analysis were a true
representation of the subject's performance capabilities.
3 . The amount of learning that took place for each test was
minimal and the same for all subjects.
4 . The filming equipment and measurement devices were reliable and
valid.

Delimitations
The following delimitations were set for this study:
1. The selection of subjects was limited to volunteers from the
1988 University of Wisconsin-Lacrosse men's and women's track and field
teams.
2. The individual training methods for each subject were not
controlled, but all subjects were training inseason and considered to be
trained athletes.
3 . The staircase used in the Margaria power test met the required
standards (30-38cm for the height of two steps) set by the original
research (Margaria, Aghemo & Rovelli, 1966).
Limitations
The following limitations were imposed upon this study:
1. The researcher was unable to obtain three-dimensional
measurements from the film.
2. The subjects were allowed to use a natural arm swing and dip
when performing the vertical jump test.
Definition of Terms
Anaerobic Power - amount of work done per unit of time (force x distance/time) or simply the rate of doing work (force x velocity;
torque x angular velocity) (Laird & Rozier, 1979).
Cinematogravhic Method - a high speed film analysis procedure used to determine displacement of the body's center of gravity, which in turn
was used as the measurement of vertical distance in the computation of
power output.
Cinemato~ravhv - camera techniques that are commonly used to examine the external mechanics of human motion from a quantitative
standpoint (Miller & Nelson, 1973).
Center of Gravity - the central point around which the lines of gravity intersect and the mass is equally balanced, and as parts of the
body move so too does the body's center of gravity (Hay, 1985).
Exvlosive - describes the ability to develop fast-forceful
movements, which are related to strength but at the same time involves a
factor of speed (Councilman, 1976).
Kinematics - that branch of biomechanics concerned with describing
the motion of bodies (Hay, 1985).
Lewis Nomogram - an indirect method of determining anaerobic power from a jump and reach score and body weight (Fox & Mathews, 1981).
Marparia Stair Test - a measure of anaerobic power determined by a subject approaching from two meters and running up a set of stairs, two
at a time, at maximum speed with time being recorded between the second and
sixth steps. (Margaria et al., 1966).
Standard Method - a commonly used procedure for determining power
output. The standard method for the vertical jump involved use of the
Lewis Nomogram, and the standard method for the stair test involved use
of a fixed vertical distance between the second and sixth step.
I Velocitv - displacement of an object with respect to time (Laird & B
I Rozier, 1979). iT
1 Vertical J u m ~ Test - a measure of anaerobic power that is 5 E determined from the maximum height to which the subject can vertically
jump. (Fox & Mathews, 1981).
Watt - the metric unit for power (1 W - 0.73756 foot-pounds/second) (Laird & Rozier, 1979).
Work - a force moving a resistance through a distance (Laird 6
Rozier, 1979).

CHAPTER I1
REVIEW OF LITERATURE
Anaerobic power plays an integral part in the performance of many
sporting events. However, this element has often taken a backseat to
the more popular aerobic component. Although both are important factors
to physical activity, Margaria et al., (1966) commented that "measurement
of maximum anaerobic power has received little attention despite the
fact that it is indicative of a kind of work important in many common
situations" (p. 1662). The following review of literature will focus on
the anaerobic component of physical activity and will be presented
within a framework that examines the fundamental components needed for
power production, the misuse of the concept of power, the measurement
and assessment of power, the relationship of power to athletic
performance, and the factors that may influence power production.
Com~onents of Power Production
Many physical educators and coaches have been concerned with the
development of muscular power and its relationship to athletic performance.
Power athletes or power type activities have often been described as
explosive (Lamb, 1984; Councilman, 1976). Explosive activities consist
of high intensity movements of short duration and are often classified
as anaerobic. Mechanically, these type of activities are often
explained by looking at the force-velocity relationship in skeletal
muscles. Power is calculated as a function of time because the rate of
work performed is constantly changing throughout the movement. Muscle
power then becomes a product of the net muscle moment and the angular
velocity at any given joint (Winter, 1979).
Since force and velocity are the two components required for muscular
power, it is of value to understand this relationship when measuring
anaerobic power output. Basically, very heavy work can be performed for
a short amount of time, but as the total duration of the activity
increases the total power output will decrease (Wilkie, 1950a; Wilkie,
1950b; Davies & Reenie, 1968). The converse of this theory also holds
true. In the opinion of Wilkie (1950b), the force-velocity relationship is
not only of theoretical value, but also of practical value because it
determines the mechanical behavior of muscles loaded under various
conditions. According to Vandewalle, Peres, and Monod (1987) a set of
monarticular force-velocity tests may be more useful than the practical
tests of anaerobic power because they specify possible weaknesses in
different joints, which would be most helpful in planning individual
training programs. Therefore, seeing how force and velocity are
important mechanical characteristics of anaerobic power, this
relationship can become of great significance when assessing this
physical parameter.
The amount of resistance that has to be overcome to produce
movement will determine the speed at which a muscle shortens, so that if
a large amount of force is needed the slower the muscle will shorten and
vice versa (Wilkie, 1950a; Fox & Mathews, 1981). Therefore, the
g;eatest force or torque is obtained when the speed of movement is
slowest. In regards to power, as the velocity of the movement increases
an exponential increase in muscular power will occur (Fox & Mathews,
1981). An observation made from the power-velocity curve by Fox and
Mathews (1981) was that power increased more rapidly at lower speeds of
movement and less rapidly at higher speeds, with a possible leveling off
or decrease in power when very high velocities of movement were
produced. Theoretically, the amount of force and velocity that can be
developed has no limitation. However, human skeletal muscles have what
is known as muscle viscosity, which becomes a limiting factor when
trying to achieve muscle contractions at maximum velocity (Wilkie,
195Ob). Therefore, this viscosity factor would apparently pose a
limitation on human muscle power.
In order to achieve approximately 25 % efficiency of movement,
which is considered an optimal conversion of chemical to mechanical
energy, it is necessary for the force and speed of movement to be
appropriately matched to one another (Wilkie, 1950a). As cited in Wilkie
(1950a), this optimum movement is a result of the force being one-half
and the speed being about one-fourth of their respective maximal values.
According to Astrand and Rodahl (1986), a muscle contracting at a
velocity of 25-30 % of the maximal value combined with a force that is
approximately 30 % of maximum isometric strength will provide the
conditions to attain the highest power values. Also, it was noted that
in the muscles this conversion of chemical to mechanical energy is a one
way process; but regardless of the economy, in order to produce the
greatest power outputs a somewhat greater speed and somewhat lesser
force should be involved (Wilkie, 1950a).
The dynamic nature of muscle contractions is what produces the

classical force-velocity curve, which creates an S-shaped relationship
(Astrand & Rodahl, 1986). Examining the properties of muscular activity
is necessary for understanding the source of human muscle power.
Therefore when available, looking at force-velocity and power-velocity
curves can serve as a valuable tool when assessing human power output.
Misuse of the Term Power
Power may be one of the most inconsistently used terms dealing with
physical activity. According to Laird and Rozier (1979), power would
fall into a category labeled as definable terms. This would allow
researchers to subjectively describe power based on the needs of their
study, which could possibly explain some of the discrepancy surrounding
the power concept. However, to understand the literature related to
anaerobic power, one should become familiar with the true scientific
definition, and the terminology used to characterize it.
In general power is a term that can be used to describe muscular
activity. The true physical definition of power is the amount of work
done per unit of time, or the rate at which work is performed (Laird &
Rozier, 1979; Stamford, 1985; Knuttgen, 1978). A true measurement of
power should be expressed as Joules per second (Watts), horsepower, or
foot pounds per second, which are all common units of power (Sapega &
Drillings, 1983). Two synonymous interpretations of power are force
times velocity and torque times angular velocity. In essence, anything
that does not comply to the above guidelines is not power in its true
s,cientif ic realm.
One of the common mistakes associated with power is that it is used

interchangeably with the word strength, and that coaches and athletes
are unaware of the difference between the two (Stamford, 1985;
Counsilman, 1976). According to Stamford (1985) power can only be
increased if a shorter amount of time is taken to accomplish the same
amount of work, or the same amount of time is taken to do an increased
amount of work. In contrast, strength involves the amount of tension
each muscle fiber can generate during a muscle contraction and the
nerve's ability to recruit large numbers of muscle fibers needed to
produce a maximum amount of tension (Stamford, 1985). Therefore, one
can clearly see that an actual difference exists between power and
strength.
When dealing with power, speed becomes an important factor. This
is not to be misinterpreted as meaning that power and strength can be
measured based upon speed of the movement. Tests of fast muscular force
are not necessarily measurements of power nor tests of slow force
measurements of strength. Sapega and Drillings (1983) stated that power
can be measured regardless of the movement speed. This same principle
holds true for power when looking at contractile velocities of the
muscle. Output capabilities at high and low speed power can represent
measurements of fast and slow contractile velocities respectively
However,
When proper physical definitions are applied, measures of dynamic muscular performance cannot be separated into strength values and power values on the basis of movement speed or contractile velocity (Sapega & Drillings, 1983; p. 8).
Using an isokinetic device, Moffroid and Kusiak (1975) defined
power in the following ways: 1) conventional power; 2) peak power;
3) average power; 4) instantaneous power and; 5) contractile power.
The authors conventionally defined power as the rate of doing work.
Peak power was only suitable for isokinetic contractions and was defined
as the peak torque divided by the duration of the contraction (Moffroid
& Kusiak, 1975). In disagreement with this definition of peak power,
Sapega and Drillings (1983) pointed out that to be a genuine measure of
power one would have to include angular displacement in the computation
(torque x angular displacement/time). Therefore, simply using peak
torque divided by time to represent power would be incorrect, and should
not be expressed in true power units.
Power measured over a specified amount of time was termed average
power, and has also been used as a way of expressing muscular endurance
(Moffroid & Kusiak, 1975). The fourth term used to describe power was
instantaneous power and was defined as the power that could be generated
from the time muscular tension begins until peak torque is reached (peak
torque/time to reach peak torque). From the earlier discussion, one can
see that this may represent a functional definition of performance, but
once again would not be considered a true measurement of instantaneous
power because it did not include angular displacement (Sapega &
Drillings, 1983). Lastly, the rate at which a muscle develops tension
and the ability to sustain that tension within practical ranges of limb
speeds has been defined as contractile power (Moffroid & Kusiak, 1975).
From the five types of power previously mentioned, Sapega and
Drillings (1983) suggested that power should be measured and qualified
as either average or instantaneous. They agreed with Moffroid and
Kusiak (1975) in that average power should represent the rate of doing
work over some period of time, but indicated that instantaneous power
should represent the rate of doing work at some instant in time rather
than over a period of time (Sapega & Drillings, 1983).
Counsilman (1976) suggested that "explosive power" may provide a
more meaningful term to convey the ability to produce fast-forceful
movements. Although explosive power may sound like a redundant
connotation, it is used quite frequently to describe this physical
anaerobic trait. But according to Sapega and Drillings (1983),
There is no single correct muscular performance test for evaluating muscular power output. As long as a proper method of calculating muscular power is applicable, the actual muscular performance task can be selected in accordance with the functional and/or experimental requirements of the testing situation (p. 8).
Therefore, they advised that a more functional term be adopted by
researchers when describing these explosive type activities and, limit
the term power to its true physical definition.
After perusing the literature one will clearly become aware of the
improper use of the term power. In an attempt to add some consistency
throughout the literature, Knuttgen (1978) released a statement
describing guidelines for a number of terms commonly misused in the
professional field. These guidelines were to be followed when
submitting research articles to that particular journal. Power was one
such term that drew concern, and according to Knuttgen (1978) was only
to be used when indeed it was power in its true physical sense (force x
distance / time) and not simply work (force x distance).

Measurement of Anaerobic Power
Anaerobic power is looked upon as the maximal rate at which energy
can be produced or work can be done without a major contribution from
aerobic energy sources (Lamb, 1984). Traditionally, anaerobic power
activities require all-out muscular efforts lasting several seconds.
Some of the methods commonly used to estimate maximal anaerobic power
include the Wingate bicycling test, maximal stair climb, oxygen debt, 50
yard dash, and the vertical jump. This section will deal with two of
the more functional tests used for estimating human power, the vertical
jump and the Margaria stair climb.
Vertical J u m ~
In 1921 D.A. Sargent presented the vertical jump test which he
called "the physical test of man". His test generally consisted of
vertically jumping into the air as high as possible. To perform the
vertical jump Sargent (1921) had each subject jump toward a box
suspended above hisher head. The height of the jump was considered to
be the distance between standing height and the height reached with the
top of the head. The subject was instructed to swing the arms backward
and bend the knees about ninety degrees while leaning slightly forward.
The subject was then told to swing the arms forward and upward while
trying to jump as high as possible. Then just before one reached the
highest point of the jump, the subject was supposed to swing the arms
back down along side the body to complete the jump. After the jump was
completed, jump height and weight were used to determine power output,
which was expressed in terms of an efficiency index.
Sargent (1921) considered the vertical jump a test which combined
speed, strength, energy, and dexterity, which in his opinion was a fair
physical test of man. However, in 1924 L.W. Sargent viewed this
vertical jump test as a dimension of work instead of a dimension of
power. Also, the formulas used to determine the mechanical concept of
power were found to be invalid when measuring athletic or physical
ability (McCloy, 1932b). Primarily, McCloy (1932b) acknowledged the
Sargent jump test as an ability to develop power relative to individual
body weight. The strength needed to perform the jump was found to be
considerably less than the potential force of the legs as determined by
a dynamometer, so the viscosity of the muscles appeared to be the
limiting factor (McCloy, 1932b). Therefore, projecting the body upward
to a maximum height involved the combination of force and the highest
possible contractile velocity of the muscles (McCloy, 1932b; Van Dalen,
1940). In other words, the test is not based primarily on strength but
on how fast the muscles in one's body can work.
Further study revealed that the relationship between the Sargent
jump and body build, relative leg length, height, and weight were not
significant (Sargent, 1924). Sargent (1924) also found that the amount
of squat or dip which preceded the jump had no bearing on the height
jumped. However, the arm swing was viewed as an important factor for
successfully executing the jump. Therefore, the coordination or skill factor
necessary to complete the jump appeared as a possible limitation of the
Sargent Jump test (McCloy, 1932b). To clarify the types of jumps being
used for this test, Van Dalen (1940) analyzed seven variations of the
Sargent Jump. From the results it was concluded that the Sargent jump
was a valuable test for predicting power ability only if the test was
standardized, practiced, and administered correctly (Van Dalen, 1940).
A modification of the Sargent Jump that can also be employed is the
jump and reach test using the Lewis Nomogram chart. This variation
involves measuring the difference between the subject's standing reach
and the height to which he/she can maximally jump and reach with the
fingertips. Height of the jump and body weight are then used to find /
the corresponding power output on the Lewis Nomogram (Fox & Mathews,
1981). Although time is not measured directly using this method, power
output is still reported in one of its true physical units. This type
of test can be easily administered and interpreted and has therefore,
become a commonly used method among physical educators and coaches.
However, according to Vandewalle et al., (1987), the validity of Lewis's
Nonogram was questionable because the formula from which it was derived
reported power as an equivalent of potential energy change divided by
the duration of the ascending flight, instead of the duration of the
thrust. Therefore, Lewis's formula did not take into consideration the
work performed from the crouch position to the takeoff position.
Gray, Start and Glencross (1962a) pointed out that assessing power
in terms of inches jumped and body weight does not comply with the
requirements of power in its true physical sense, but that the vertical
jump may be the best indication of general muscular power. Gray and his
associates (1962a) also suggested that the vertical jump was not a pure
test of leg power because movements such as swinging the arms and
extending the trunk may contribute to the height jumped. Therefore,
they would argue that arm swing should not be used to obtain a
measurement of leg power. Based on that premise, Gray et al., (1962a)
developed a study that eliminated extraneous body movements while
performing the vertical jump and used the center of gravity as the
measurement point. They termed this modification of the Sargent jump
the vertical power jump.
Using the center of gravity technique was based on the following
theoretical assumptions: 1) the center of gravity remains in the same
position relative to the fingertips; 2) movement of the center of
gravity is primarily caused by the vertical thrust and is very minimal
in the anterior, posterior, and lateral directions and; 3) the leg
thrust accelerates the body in a uniform manner (Gray et al., 1962a).
By assuming that the acceleration of the center of gravity was constant,
this method would also calculate the duration of the thrust and account
for the work performed before takeoff. To measure power as it was
scientifically defined, a formula based on the mathematical logic of the
force of gravity, the weight of the person, and the displacement of the
center of gravity was validated and used by Gray et al., (1962a) to
obtain power output in horsepower. In conclusion, Gray et al., (1962a)
established that the vertical power jump had a high test-retest
reliability (r = .985) and seemed a valid test of genuine leg power based
on the coefficient of objectivity (r - .981). After this in depth analysis of the vertical power jump, Gray,
Start and Glencross (1962b) went on to determine the usefulness of their
technique. To accomplish this purpose, the researchers eliminated use of
the center of gravity procedure and simply used body weight and height
jumped to calculate power output. The jump and reach, standing broad

jump, and squat jump were the other tests used to determine if an
absolute measure of leg power, which did not account for time, would
predict power scores on the more precise vertical power jump method. It
was concluded that the modified simple version of the vertical power
jump was acceptable as a substitute for the in-depth mathematical method
(Gray et al., 1962b). It also appeared that the simple jump and reach
version was superior to the other jump tests used as a measure of leg
power.
The more recent experiments that utilized a force platform however,
provided results that disagree with the assumption that acceleration is
constant throughout the vertical jump (Offenbacher, 1971; Davies &
Reenie, 1968; Davies & Young, 1984). These findings would certainly
question the validity of previous results, such as the study done by Gray
and his associates. However, based upon the high correlation found
between the jump height and peak power output as calculated from a force
platform, it would appear that considering jump height would be a simple
way to determine power output (Davies & Young, 1984). Use of force
platforms also made available instantaneous values of force, velocity,
and acceleration, therefore making the calculation of peak/instantaneous
and average power output from a jump rather easy.
When looking at jumping as a measurement of power, Adarnson and
Whitney (1971) described jumping as an impulsive (force x time)
muscular activity. Total impulse can be expressed as the sum of an
infinite number of small impulses and can be viewed as being
mathematically equal to the area under the force-time curve (Hay, 1985;
Miller & Nelson, 1973). Adamson and Whitney (1971) stated that the

success of the subsequent jump was directly related to the size of the
impulse. Therefore, the shape of the impulse curve was the best
indication of the muscular activity used to generate the jump. It was
concluded that power in its strict mechanical sense was an unjustified
concept when dealing with impulsive actions such as jumping (Adamson &
Whitney, 1971). Perhaps this would be true if sophisticated devices
such as the force platform did not exist.
In other words, Adamson and Whitney (1971) were criticizing the use
of instantaneous power when dealing with jumping activities. However,
Bosco, Luhtanen and Komi (1983) pointed out that the development of
instantaneous power does not necessarily parallel the development of
average power. Keeping this is mind, Bosco et al., (1983) developed a
simplified mechanical power jumping test, which recorded work-power
output performed during a 60 second continuous jumping task. The test
was supposed to evaluate the average power output of the leg extensor
muscles during a natural motion. Based on the results, the test
appeared suitable for evaluating leg power while performing an explosive
type exercise involving both stretching and shortening of the extensor
muscles (Bosco et al., 1983).
In an attempt to mechanically validate six different tests
recognized as measures of leg power, Considine (1971) utilized a force
platform. In his study a test similar to the original Sargent jump, but
with restricted arm movement, was used as the criterion measure for leg
power. The tests used in this analysis were the vertical jump and
reach, standing broad jump, chalk board jump, 5 yard sprint, 10 yard
sprint, and a running 5 yard sprint. Basically, Considine (1971)

concluded that use of these tests as valid measures of leg power did not
appear to be justified. More specifically, the vertical jump and reach
test had the greatest relationship to the criterion measure, but once
again was viewed as an invalid assessment of true leg power.
Only a few studies were found that assessed vertical jumping
performance in relation to objective mechanical measures other than
those involving a force platfo&n. Martin and Stull (1969) examined
forty-eight knee angle, foot spacing combinations and revealed that they
independently influenced performance in the vertical jump. It was
concluded that the preliminary stance that resulted in the greatest
inches jumped consisted of a combination of the knees being bent at
approximately a 115 degree angle with the feet spread 5-10 inches
laterally and slightly greater than 5 inches anteriorly-posteriorly
(Martin & Stull, 1969). In an original research investigation,
Robertson and Flemming (1987) determined the vertical jump was a result
of the hip, knee, and ankle muscles contributing 40.0 % , 24.2 % , and
35.8 % respectively. It was also discovered that the leg extension
musculature used to create the external work needed for jumping was
produced by all three muscle moments acting simultaneously.
To mechanically assess power Barlow (1971) used high speed
cinematography and analyzed the jump and reach test and the modified
vertical power jump. The film analysis involved vertical displacement
of the center of gravity, time of displacement, and total body weight.
It was found that the relationship between the administrative score and
actual power developed in the respective tests were negligible (r - .14). Therefore, the subject who attained the highest administrative score did

not necessarily generate the most power. On that premise it was
concluded that the measure obtained by the typical physical jump and
reach test was not indicative of human power (Barlow, 1971). Total
vertical displacement (lowest to peak position) of the body's center of
gravity was also found to be a non-significant factor in power output
for both the jump and reach test (r = .04) and the modified vertical
jump test (r -- -.08). Total body weight was viewed as the most
influential factor effecting the mechanical measure of power in both
variations of the vertical jump used in Barlow's study.
Margaria Stair Test
Margaria et al., (1966) devised another test for measuring
anaerobic power, and felt that their new stair climb test could measure
leg power more precisely than the Sargent Jump. Basically, their new
test consisted of running up a staircase , two steps at a time, as fast
as humanly possibly. A reason this test could be considered more
accurate was because it directly measured time and included this factor
into the power output calculation. Margaria et al., (1966) proposed
that performing the stair climb test did not require a particular skill
and was primarily a measure of leg and lower trunk power.
Subjects performing the stair climb began with a two meter approach
and were instructed to run up the stairs, two steps at a time. Each
step was 17.5 cm, so that each jump of two steps covered a distance of
35 cm. The vertical component of running up the stairs at maximum speed'
was measured using a photoelectric clock, which recorded scores to the
nearest one hundredth of a second. For timing purposes, an even number
of jumps were used so that the subject would be in the same position, or
landing on the same foot, for every other jump. The time used to
determine power was the amount of time recorded to traverse four steps
(70 cm height).
Margaria and his associates (1966) used a two meter acceleration
phase so that the subject could reach maximum forward velocity sooner.
This would also assure that power was being measured when the subject
reached a constant level of speed. To determine the effect that step
height would have on power, the exercise was tested on step heights
ranging from 17 to 41 cm. Margaria et al., (1966) concluded that for
people of normal body build, an optimal step height (2 steps combined)
was approximately 35 cm. If the stairs were any higher than optimal,
muscle contraction was too long and too great a force was needed to
climb the staircase. If a lower than optimal step height was used,
maximal power output was not reached by the subject because too great a
frequency was needed to obtain maximal forward velocity. Through this
experimentation, it was found that a step height of 30 to 38 cm produced
reliable values within margins of 5% (Margaria et al., 1966).
In 1968 Kalamen modified the step test proposed by Margaria. The
major changes that grew out of Kalamen's investigation included the
following: 1) using a six meter approach; 2) running up the staircase
three steps at a time and; 3) recording time as how long it took to
traverse six steps, step 3 to step 9 (Kalamen, 1968). Power was
computed as the product of the subject's body weight and vertical
distance between first and last step divided by time (P - W x D / t). Evaluation of Anaerobic Power Tests
Many standard methods as well as modified methods exist for the

purpose of measuring human muscle power. After looking at the vertical
jump and stair climb methods, it appeared that different results could
be obtained from tests supposedly measuring the same parameter. It was
thought that several of the obvious differences were worth mentioning,
since any one area might be the important factor toward justifying that
these two tests actually measure the same thing.
In the vertical jump, all of the work needed to project the body to
a maximum height must be accomplished in the amount of time the feet are
in contact with the floor. The body will not leave the ground if this
work is done too slowly, but when done fast enough the momentum of the
body will continue and cause the individual to jump off the ground.
Once the subject leaves the ground, he/she becomes a free falling body
and can no longer use the legs to thrust and propel the body upward
against the force of gravity (Sargent, 1924). Therefore, all of the
force needed to vertically jump and reach a maximum height must be
produced between the crouch and the extended positions (Sargent, 1924).
On the other hand, the stair climb allows the subject to make
contact with the ground several times while performing a maximum
muscular effort. This results in power being determined from several
muscular contractions opposed to the single muscular effort of the
vertical jump (Kalamen, 1968). Kalamen (1968) pointed out another
difference as being the number of points making contact with the ground.
In both tests a force great enough to lift the weight of the body upward
' must be produced. However, the difference lies in the way in which
human muscle power is initiated. In the vertical jump, the subject must
contract the muscles of both legs at the same time in order to thrust
the body upward; in the stair run, the subject must contract one leg at
a time in order to climb the stairs.
As stated in Kalamen's 1968 investigation of anaerobic power,
The Sargent Jump test, used so often in physical fitness tests as a legpower measure, does not measure the same thing as stair running tests which can be computed into power directly from the data obtained in the test (p.44).
However, when partialling out the effect of body weight, Kalamen (1968)
found the correlation between power tests to be significant, and
reasoned that body weight should be considered in the tests attempting
to measure individual power efforts. According to Olsen (1987) the
vertical jump and the Margaria stair climb tests are both multijoint '
exercises which measure similar power production elements. A positive
correlation (r = .827) was found between the two tests. Also, it
appeared from the literature that power outputs obtained from various
other methods agree fairly well and share some common elements (Kyle &
Caiozzo, 1986; Alyalon, Inbar & Bar-Or, 1974; Vandewalle et al., 1987)
Relationship of Power to Athletic Performance
McCloy (1932a) used the term athletic ability as reference to the
ability to skillfully utilize force in relation to one's body size at
high speeds. In a sense, this description of athletic ability was
limited to the mechanical use of strength and velocity, and was therefore
expressed as athletic power (McCloy, 1932a). Power events in athletics
were those considered as involving the element of velocity and measured
in terms of time, distance or height (McCloy, 1932a; McCloy, 1942).
Since McCloy (1932a) viewed the measurement of power useful in connection

with track and field events, he went through a comprehensive analysis to
identify and verify a relationship between power and performance in the
sport of track and field. Out of McCloy's extensive research, as well
as other studies, grew the relationship between the Sargent Jump and
power athletics. More specifically, it was concluded that a high
correlation existed between the Sargent jump and track and field events,
and when combined with measures of age, size, and strength it could be
considered a useful predictor of track and field ability (McCloy, 1942).
Over the past 50 years the Sargent jump has been used for purposes
such as classifying students, predicting athletic ability, measuring
physical fitness, and validating new fitness tests (McCloy, 1932b;
Carpenter, 1938; Van Dalen, 1940; DiGiovanna, 1943; Burley & Anderson,
1955). In a study that investigated strength, power and femininity of
college women, Carpenter (1938) concluded that power was by far the
most important factor influencing athletic performance. DiGiovanna
(1943) investigated body build, muscle strength and explosive power in
relation to the following college athletics: 1) baseball; 2) basketball;
3) football; 4) gymnastics; 5) tennis and; 6) track and field. It was
concluded that these three factors were associated with athletic
success, but with no pattern to a specific sport. In agreement with
this finding, Burley and Anderson (1955) found that athletes were
significantly better than non-athletes when looking at vertical jump
scores. This would imply that a good performance on the vertical jump
test would be indicative of athletic success. The same study also
revealed that power was more closely related to baseball, basketball,
track, and swimming opposed to boxing, tennis, wrestling, and football

(Burley & Anderson, 1955). All of these studies used the vertical jump
to measure power which would imply that this test could be used an an
indication of who was going to succeed in athletics.
In an attempt to determine the effects of systematic weight
training on power as it relates to sprinting, jumping, and throwing
events, Chui (1950) found that weight training seemed to have a positive
effect on athletic power. It appeared that systematic weight training
could increase strength, which could provide the extra strength needed
to overcome the viscosity of the muscle, and hence add to the speed of
contraction allowing for greater power outputs (Chui, 1950; Capen,
Relating selected power tests to the 50 yard dash, Kalamen (1968)
contrasted the earlier findings when he established that a non-
significant relationship existed between performance on the Sargent jump
and the all-out sprint. However, it was shown that scores from the
Margaria power test (two-meter, two-step method) and the Kalamen power
test (six-meter, three step method) correlated with performance in the
50 yard dash (Kalamen, 1968). It was concluded by Kalamen (1968) that
both methods could be used to predict potential for athletic success,
but that Margaria's two-meter, two-step test was less accurate.
In an investigation where the primary purpose was establishing and
isolating events that could be used as predictive measures for muscle
velocity and athletic power, Hutto (1938) used a group of high school
boys and analyzed eighteen different tests and measures. Utilizing a
factor analysis method, six common elements were identified as
underlying physical accomplishment. The six major factors included the

following: 1) strength; 2) weight; 3) muscle velocity; 4) structure
such as leg length; 5) arm strength and; 6) artifact of a factor too
small to identify (Hutto, 1938). Based on the results, specific
regression equations were developed which were viewed as being a fairly
easy and accurate method to predict muscle velocity and athletic power.
Factors Influencing Power Production
Over the years, power has been a controversial issue in human
performance and can be a difficult concept to comprehend. Searching the
literature made evident the many components that could influence
performance on a power test. In this section the effort was made to
review factors such as leg strength, leg speed, and body composition as
they relate to human power production.
Originally when investigating the stair climb, Margaria et al.,
(1966) pointed out that step height can affect power output. Caiozzo
and Kyle (1980) further suggested that stride frequency, leg length,
stair angle, or loading might affect one's ability to produce power.
The primary concern for Caiozzo and Kyle's study was to examine external
loading as it relates to power production while performing Margaria's
stair climb. The subject performed the test under the following five
experimental conditions: 1) body weight or no external loading; 2) body
* weight plus 10.1 kg; 3) body weight plus 19.2 kg; 4) body weight plus
24.2 kg and; 5) body weight plus 29.2 kg (Caiozzo & Kyle, 1980). These
conditions represented increases in weight of 0, 14, 27, 33, and 44 %
respectively.
Caiozzo and Kyle (1980) reported a mean power output of 15.9 W/kg
without external loading. This value was representative of the
anaerobic power output set by Margaria et al., (1966), which was 14.7 to
15.7 W/kg. External power outputs significantly increased under the
loaded conditions. On the average, the 29.2 kg situation represented a
16 % increase in power production (Caiozzo & Kyle, 1980).
It was unclear as to why the external loads resulted in increased
power outputs. One possibility discussed by Caiozzo and Kyle (1980) was
that climbing the stars with extra weight optimized the running speed-
load interaction. Added weight producing an increased ground reaction
force might well have been another reason for the increased power
output. It was also thought that the additional weight could
have effected stride length. Therefore, making the stride more
conducive to running up the steps.
The standard staircase can confine stride length and place some
limitations on obtaining true measurements. It was thought that this
built-in limitation probably prevented the subjects from reaching their
maximal capacity while performing the stair task (Caiozzo & Kyle, 1980).
To eliminate the mechanical constraint of stairtreads, Kyle and Caiozzo
(1985) compared running up a staircase to running up a ramp. To test
the subjects an incline of 30 degrees or 58 % gradient was used for both
the staircase and ramp conditions. The five external loading conditions
' used in their previous experiment were also used in this study.
However, a sixth loading condition of 34.2 kg was used in the latter
study when the subjects ran up the ramp.
According to Kyle and Caiozzo (1985), significant differences in
power outputs were found between the ramp and the stairs in each of the
experimental conditions. The ramp produced the highest mean power
output at a load of 19.2 kg, which after this point power values began
to progressively decrease. The ramp revealed a 9 % increase in power
output from the unloaded condition to the loaded condition of 19.2 kg
In contrasting these values to the stairs, the highest average power
output occurred at the 29.2 kg load, which represented a 13.9 % increase
in power from the unloaded condition. Also when comparing the ramp to
the stairs, a 23.5 % increase in power output was reported between the
unloaded condition on the stairs to the 29.2 kg load on the ramp.
Subjects appeared to run up the ramp more easily and faster than
the stairs when carrying the extra weight against gravity. Through this
experiment it became evident that the ramp could produce power values
that reach maximum capacity and begin to level off; whereas in climbing
the staircase, power values at maximum load still seemed to be
increasing (Kyle & Caiozzo, 1985). In the latter study the ramp
materialized as being better than the stairs, possibly because it
allowed subjects to individualize stride length and stride frequency,
However, it is still debatable as to which mode, a properly designed
staircase or a properly designed ramp, could produce the greater power
outputs.
When studying the effects of external loading on power output
4 duringverticaljumping, Davies andYoung(1984) reportedresultsthat
were opposite to those found during stair climbing. It was shown that
adding weight to the subjects produced a linear decrease in power
output, which was due to a decrease in the take-off velocity when
jumping (Davies & Young, 1984). The discrepancy between the studies can

probably be linked to several mechanical factors. One such factor that
was given some consideration was that of kinetic energy.
According to Margaria et al., (1966), when an all-out effort is
expended running up gradients beyond 30 %, the only factor contributing
to external work is body lift. Other factors such as speed changes and
impact of the body on the ground become negligible (Margaria et al.,
1966). Therefore the 58 % incline used by Caiozzo and Kyle would allow
the kinetic energy of the body to be continuously lifted throughout the
test, and the majority of energy produced can be used for external work
(Davies & Young, 1984). Whereas the vertical jump involves an abrupt
change in kinetic energy, thereby consuming rather than converting
energy into external work (Davies & Young, 1984). In regards to the
efficient recovery of kinetic energy, Kyle and Caiozzo (1985) considered
stair climbing intermediate between cycling and the vertical jump.
In other words when performing the vertical jump, all of the energy
produced is wasted upon impact. External loading may require the
subject to produce more energy to initially lift the body off the
ground, therefore decreasing rather than increasing the individual's
ability to produce external power (Davies & Young, 1984). However, it
has been pointed out that within the limits of each exercise, optimal
loading conditions are necessary to determine maximal power outputs
(Kyle & Caiozzo, 1985). Davies and Young (1984) summed up this matter
by stating, "Clearly the effects of human loading experiments on
mechanical power output must be treated with caution. The results do
not have universal application" (p. 354).
Only adding to the problems involved with external loading is the
3 3 ,
consideration of how individual body composition could influence power
output. Several researchers have examined the concept of body
composition and what effect it can have on anaerobic power. When
comparing lean, obese, and average male subjects, Kitagawa, Suzuki and
Miyashita (1980) reported that the obese group had the lowest vertical
velocity but the highest power output per kg of lean body mass. On the
average, the obese individual produced 14 % more power than the lean
individual when lifting only body weight. Kitagawa et al., (1980) also
analyzed the effects of external loading on the lean subjects. They
found that when adding extra weight to give the effect of obesity, the
lean group performed almost equal to that of the obese group (Kitagawa
et al., 1980).
In the experiment by Kitagawa et al. (1980) the added weight
produced lower velocities and higher power outputs. Although no details
of velocity were given in the loading experiments by Kyle and Caiozzo,
according to Davies and Young (1984) the increase in power found in
their experiments was solely due to an increase in the amount of applied
force. Therefore it appears that the role of excess fat or added weight
in power measurements is that of serving as an inert mass (Kitagawa et
al., 1980). In conclusion it would seem that obesity represents a form
of external loading, which serves as an advantage when performing the
stair climb (Kitagawa et al., 1980; Caiozzo & Kyle, 1980; Kyle &
% Caiozzo, 1985). However, the obese individual would be at an apparent
disadvantage when performing the vertical jump (Davies & Young, 1984).
While it appeared that the more ponderous individual had an
advantage when performing the stair climb, Mayhew, Schwegler and Piper

(1986) speculated that this was a superficial correlation caused by the
use of body weight in the computation of power. This point was brought
forward when the researchers used the Margaria-Kalamen test with a six
meter approach to question the relationship of acceleration momentum to
anaerobic power. Overall, it was observed that the greater the
acceleration, the greater the vertical velocity (Mayhew et al., 1986).
The magnitude was low when correlating the two velocities to
absolute power. Acceleration accounted for 9 % and vertical velocity
accounted for 17 % of the total variance. When removing the influence
of body weight, the results showed a negative relationship between power
output and percent fat (Mayhew et al., 1986). This effect also
increased the relationship between absolute power and acceleration
and vertical velocity, so that now over 45 % and 92 % of the
variance could be explained by these two respective variables. Mayhew
and his associates (1986) also reported that for male subjects the
deviations in absolute power scores could be attributed to variations of
63.6 % in body weight, 36.4 % in stair climb time, and about 0.1 % in
acceleration velocity. For the female subjects the variation was
accounted for by 55.5 %, 39.4 % , and 5.1 % respectively.
Considering the influence body weight seems to have on power, the
relationship between anaerobic power and acceleration momentum was also
analyzed in relative terms. According to Mayhew et al., (1986) the
males and females who had faster acceleration times also had greater
relative power outputs. Correlating relative power to absolute power
produced a low relationship, which might indicate that factors other
than body weight can have a major influence on power production.

However, once again the correlation increased when the body weight
factor was held constant. In conclusion, these results suggested that
perhaps the Margaria-Kalamen power test is reflecting body composition
to a greater extent than was ever imagined (Mayhew et al., 1986).
Another important factor that has drawn considerable attention from
several researchers is that of strength and its relationship to power.
Out of a series of tests administered to determine explosive leg power,
Costill, Miller, Meyers, Kehoe and Hoffman (1968) found the squat weight
lift to be the only test significantly related to anaerobic power.
Taking a closer look at this relationship disclosed a correlation
between body weight and the squat lift. Considering body weight is a
direct measurement used in the calculation of power output, it was
implied that this factor rather than dynamic leg strength may have
accounted for the relationship found between anaerobic power and the
squat lift (Costill et al., 1968).
After investigating four different training programs designed to
strengthen the leg and thigh muscles, McClements (1966) concluded that
all programs were equally effective in increasing power production in
the vertical jump. However, the more important issue may be the
conclusion, "although strength (agonistic and antagonistic) is related
to power, gains in strength are not related to gains in power"
(McClements, 1966; p. 78). Also looking at this relationship. Berger (i
and Henderson (1966) established that both static and dynamic leg
strength are related to leg power as measured by the vertical power
jump. Also of prevalence in this study was the finding that static leg
strength and dynamic leg strength are not significantly different from

each other, and that neither one is more related to leg power (Berger &
Henderson, 1966). Considine and Sullivan (1977) provided little support
to these other findings, and concluded that isometric leg strength had
a low correlation to leg power. This would suggest that strength may be
only one component contributing to this complex concept of human power.
German (1984) added support to the idea that power is comprised of
many facets. He indicated that absolute dynamic strength was a good
indicator of absolute power and leg speed was a good indicator of
relative leg power. However, a combination of both leg speed and leg
strength was favorable over any one factor when determining absolute and
relative leg power (German, 1984). After investigating 19 various
measurements taken from the lower limb, analysis revealed that power was
linked to speed opposed to strength (Start, Gray, Glencross & Walsh,
1966). The measure of leg speed is yet another variable that seems to
be related to power.
To look at this relationship between leg speed and anaerobic power,
Gray, Start and Walsh (1962) used the bicycle ergometer to measure leg
speed and the vertical power jump to measure leg power. A positive
correlation was found between leg speed and leg power. Although this
relationship was significant, it was very low and only accounted for
approximately 25 % of the common variance. The evidence presented in
this section should make it clear that anaerobic power is a complex
concept with many influencing factors, and that many unanswered
t questions still remain in this area.

Summarv
Throughout this chapter one can get a feel of the historical
perspective related to anaerobic power. However, it appeared that at
the present time the concept of power is still being misinterpreted. A
review of the literature revealed the inconsistent use of the term
power, as was shown by the many definitions being applied to this
physical trait.
Also, it was shown that muscular power is considered an important
component contributing to athletic performance. Therefore, it becomes
critical that this physical trait is accurately measured in order to
provide reliable information to coaches and other specialists. The
vertical jump and the stair run are viewed as two of the more functional
tests used to estimate power, however various other methods are also
being employed to measure human power output. Although it seemed that
these different power testing procedures obtained similar results, it is
still questionable as to which method would produce maximal power
outputs and assess power in a true mechanical sense.
As was pointed out, power is a complex entity comprised of many
influencing variables. Many researchers have devoted time to
investigating such factors, but it is still apparent that the results
are nondefinitive and further research is needed in the area of human
muscle power. Hopefully, looking at anaerobic power from a mechanical
viewpoint will help resolve some of the presently unanswered questions,
and lead to a clearer understanding of this complicated physical
parameter.

The intent of this project was to go beyond actual eye observation
and utilize high speed cinematography to investigate two frequently used
tests for determining human power output. This investigation was used
to gain an understanding of the mechanical concept of power. The main
problem of the study was to determine the extent to which a standard
method of measuring power output compared to a more complex
cimematographic method of measuring power. A comparison between the two
methods will help determine what effect the application of mechanical
principles had on the power generated in both the Margaria and vertical
jump tests. Details of subject selection, preliminary investigation,
testing procedures, cinematographic procedures, kinematic analysis, and
statistical analysis will be included within this chapter.
Subiect Selection
Track athletes were chosen as participants in this study due to the
relationship found between anaerobic power and performance in track and
Field events (Digiavanna, 1943; Burley & Anderson, 1955; McCloy, 1942).
Those athletes training for jumping and sprinting events were of primary
interest to the study. The sample for this study consisted of a total
of twelve volunteer athletes, both male (n = 7) and female (n = 5), from I
the 1988 track and field teams at the University of Wisconsin -
La Crosse.

Prior to being tested, all subjects were explained the nature of
the experiment and asked to sign an informed consent form. (see Appendix
A). The subjects performed both tests in shorts, shirt, and running
shoes, and the performance was not hindered by any extra devices or
equipment. Prior to the first filming session, each subject was weighed
on a medical scale and this value was recorded in pounds.
Preliminarv Investigation
Prior to testing a pilot study was conducted in the Mitchell Hall
fieldhouse to obtain the proper arrangement for filming purposes. After
viewing the pilot study film, it was concluded that the stairs
constructed for use in the Margaria test were hindering the natural
performance of the subjects. The vertical jump test posed no such
problems in an indoor setting. However, to keep conditions consistent,
a decision was made to film outdoors which allowed for performance in a
more natural setting for both tests.
Testing Procedures
The testing procedures included in this section will describe the
protocols used for the vertical jump and Margaria stair tests. Along
with these procedures, the standard and cinematographic methods used
to determine power output and vertical velocity will also be presented.
Vertical Jump.
The vertical jump test was administered using a Vertec vertical
jump measuring and training device. The standing reach of the subject
' was determined using the method described by Considine and Sullivan
(1973). This was accomplished by having the subject stand beneath the
colored Vertec measurement vanes and s t r e t c h t o reach a s high a s possible
with h i s h e r preferred hand. During t h i s preliminary measurement the
sub jec t ' s f e e t remained f l a t on the ground and the non-preferred hand
remained a t the s ide of the body. This measurement was taken d i r ec t l y
from the Vertec device and was recorded a s the standing reach of the
subject .
For the preparatory phase of the jump, the subjects were to ld t o
stand with t h e i r f e e t approximately shoulder width apar t and both f e e t
s t a t ionary . This two foot take off prevented the subjects from gaining
momentum by stepping in to the jump. To perform the jump the subjects
were ins t ructed t o f l e x t h e i r knees and jump as high as poss ible ,
reaching f o r the colored measurement vanes with t h e i r preferred hand.
The s i ze of the preparatory crouch and the use of the non-preferred arm
were not r e s t r i c t e d , thereby, permitting each subject t o perform as
na tura l ly a s possible.
Once the jump was completed, the height was recorded and the
Vertec device was prepared fo r the next t r i a l . Each subject performed a
t o t a l of s i x t r i a l s . The f i r s t three t r a i l s were considered warm-up or
p rac t ice and the l a s t three t r a i l s were the actual t e s t with scores
being recorded. The highest jump of the l a s t three t r i a l s was the value
used t o determine power output, and was a l so the t r a i l se lected f o r f i lm
analysis . O f the twelve subjects only nine performed the v e r t i c a l jump
t e s t (n = 6 males; n = 3 females).

Standard method. The vertical distance jumped was determined by
taking the difference between the maximum jump height and the standing
reach height. This value, which was recorded in inches, along with the
weight of the subject were marked on the Lewis Nomogram (See Appendix
B) (Fox & Mathews, 1981). A ruler was placed on the Lewis Nomogram to
connect these two values with a straight line. The estimate of power
output was found by reading the value where the straight line
intersected the middle graph on the Lewis Nomogram, and was read in ft- >
lbs/sec. The final value for power output was converted to the metric
units of Watts (1 Watt = .73756 ft-lbs/sec). The Lewis Nomogram
procedure was considered as the standard method for determining power'
output from the vertical jump. The average vertical velocity was
computed by taking the vertical distance jumped, as computed above, and
dividing by the time as derived from film analysis (v = d/t).
v = average vertical velocity (ft/sec) d - vertical displacement of jump (ft) t = amount of time from takeoff to peak position of jump (sec).
Cimematographic method. The cimematographic method of determining
power was based on time and distance measurements derived directly from
the film analysis. The displacement of the center of gravity was
determined from position one, or the low point of the crouch, to position
two, or the peak point in the jump. This displacement value was
considered as the vertical distance jumped, and was used along with body
weight and time to calculate the amount of power generated in the
vertical jump. The formula (P = W x D / t) was used to calculate
power output values in foot-pounds per second which were then converted
to watts of power (Fox & Mathews, 1981).
P = anaerobic power (ft-lbs/sec) W - weight of the subject (lbs) D - displacement of the total body center of gravity from position
one to position two (ft) t - amount of time taken from position one to position two (sec)
The average vertical velocity was computed by taking the vertical
distance jumped, as determined from the center of gravity displacement,
and dividing by the time taken to complete the jump.
Marparia Stair Test
In 1966 Margaria and his colleagues used a two step height of
approximately 35 cm, but concluded that a step height from 30-38 cm
would furnish values that were within 25 % of the results. Margaria et
al., (1966) also noted that the external work for running up an incline
of approximately 30 % was produced primarily by body lift. Therefore,
providing that the effort was maximal while running up a given incline
of steps exceeding this value, the vertical component became the
important contributing factor to mechanical work and power. This would
render that all other factors, such as speed changes at each step and
impact of the body on the ground during the last phase of the step,
became negligible.
For the purpose of this study the Margaria power test was conducted
on the stadium stairs primarily because they met the standard
requirements set forth by the original researchers. The height measured
for two of the stadium steps was equal to 14.5 inches or 36.83 cm.
Also, the stairs had an incline of 27.8 degrees or 52.7 % grade, which
clearly indicated that power could easily be determined based upon

vertical displacement. Secondly, the stadium stairs solved the problem
of finding a standard staircase with the necessary space needed for
filming procedures. Using the stadium stairs allowed for ease of
collecting data in a natural setting which would produce a quality film
for analysis. Lastly, it was also thought that the stadium stairs served
a practical purpose, since it is was an easily accessible place for almost
all coaches and could possibly serve as a common site for testing
athletes.
The stair climb power test was executed according to the methods
described by Margaria et al., (1966). Starting with a two meter
approach, each subject was instructed to run up the stairs two at a time
at maximum speed. The time taken to perform the test was determined by
switchplates placed on the second and sixth step. This permitted the
subject to step on the plates using the same foot, allowing the
measurement of one full step cycle. Time was measured directly from a
Dekan timer accurate to the nearest .O1 second.
A signal light mechanism was wired to the Dekan timer to allow the
investigator to accurately identify when the switchplates were being
activated. The light was turned on when the subject stepped on the
first switchplate to activate the timer; and turned off when the subject
stopped the clock by stepping on the second switchplate. The light
device was placed facing the camera and housed in a black box, which
negated any reflections from the sunlight and made for ease of viewing
the light on film.
Each subject performed a total of six trials; the first three
trials were considered practice and the last three were considered test

trials. Of the three test trials, the one with the fastest time was
used for film analysis and power computations. The time recorded on the
Dekan timer was used solely as a screening mechanism to determine which
trial was the fastest, therefore determining the trial to be used for
film analysis. Time was determined from the film to the nearest .001
second and used in all calculations of power output generated from the
Margaria stair test.
Standard method. Power was determined from the formula in Fox and
Mathews (1981) where P = W x D / t:
I P = anaerobic power (ft-lbs/sec) W = weight of the subject (lbs) D = vertical distance between the second and sixth steps (ft) t = amount of time taken from foot contact on the second step to
foot contact on the sixth step (sec).
Since power was computed in ft-lbs/sec it was converted to Watts of
power by dividing by .73756 ft-lbs/sec (P/.73756). This was considered
the standard method for determining power which used a fixed vertical
distance. In the case of this study the vertical distance between the
second and sixth stair step was equal to 2.417 feet. Determining the
average vertical velocity for this standard method involved using the
fixed vertical distance measurement of 2.417 feet and dividing by the
time taken to complete the stair climb (v - d/t). Cinematographic method. The cinematographic method for computing
power generated in the Margaria power test used the same formula as
previously stated (P - W x D / t), with the exception that vertical
distance was based upon the individual displacement of the body's center
of gravity. The displacement of the center of gravity was determined
by taking the difference between position one (when the subject made

initial contact with the second step) and position two (when the subject
made contact with the sixth step). This value was substituted into the
previous formula (D - displacement of the total body center of gravity from position one to position two), with all other variables remaining
the sac. The power values from this method were also obtained in
measures of foot-pounds per second and converted to Watts of power. The
average vertical velocity for the cinematographic method was computed by
taking the vertical distance measurement based on the center of gravity
displacement, and dividing by time taken to complete the test. Q
Cinematogra~hic - Procedures
The filming of this project took place at two outside locations on
the University of Wisconsin - La Crosse campus. The study consisted of
two separate filming sessions, the vertical jump, and the Margaria stair
test. The Margaria power test was filmed during the first session and
took place on the cement stairs in the bleacher area of Memorial
Stadium (See Figure 1). The following day the vertical jump test was
filmed on the sidewalk outside the West end of Mitchell Hall (See
Figure 2).
A motor driven Cine 8 super 8 motion picture camera capable of a
maximum transport speed of 250 frames per second was used to film this
study. The camera operates with a speed stability of 22 % or one frame,
whichever is the greater. Both testing conditions were filmed at the
selected speed of 150 frames per second. To hold the film stationary
during exposure time, the camera functioned with an intermittent pin
registered film transport mechanism, which had a registration accuracy
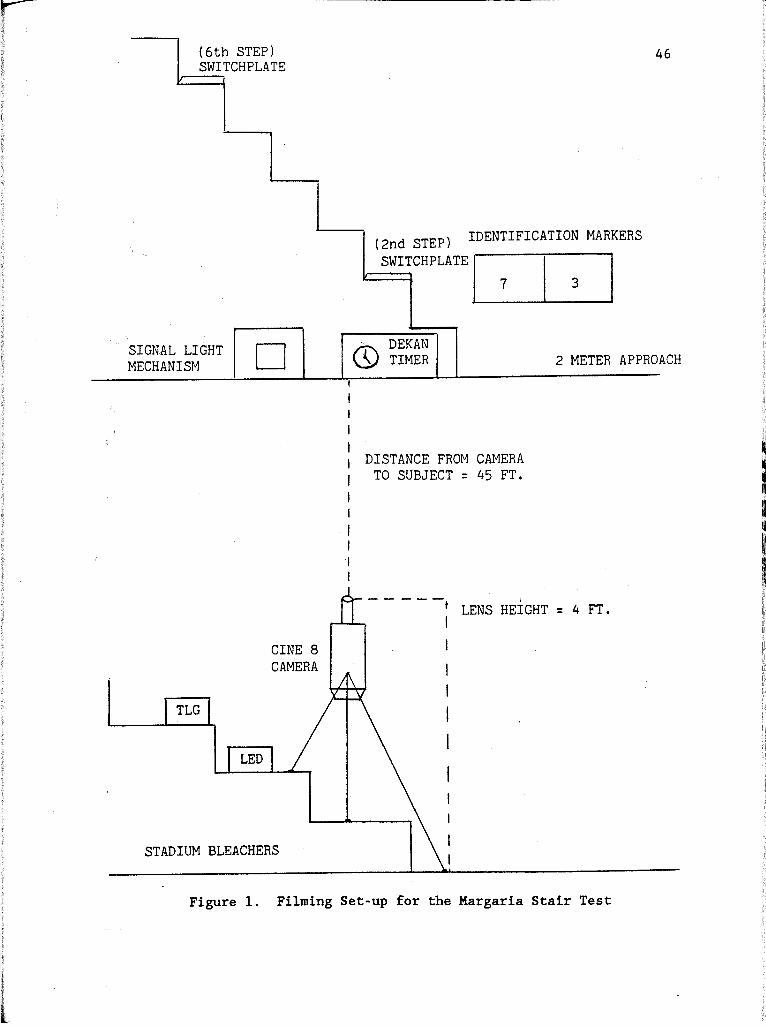
( 6 t h STEP) SWITCHPLATE
( 2 n d STEP) IDENTIFICATION MARKERS
SWITCHPLATE
1 ?
SIGNAL LIGHT DEK AN
MECHANISM a TIMER 2 METER APPROACH
I
I 1 DISTANCE FROM CAMERA
I TO SUBJECT = 45 FT.
- - - - - LENS HEIGHT = 4 FT.
I
CINE 8 1
TLG L
LED
STADIUM BLEACHERS
Figure 1. Filming Set-up for the Margaria Stair Test
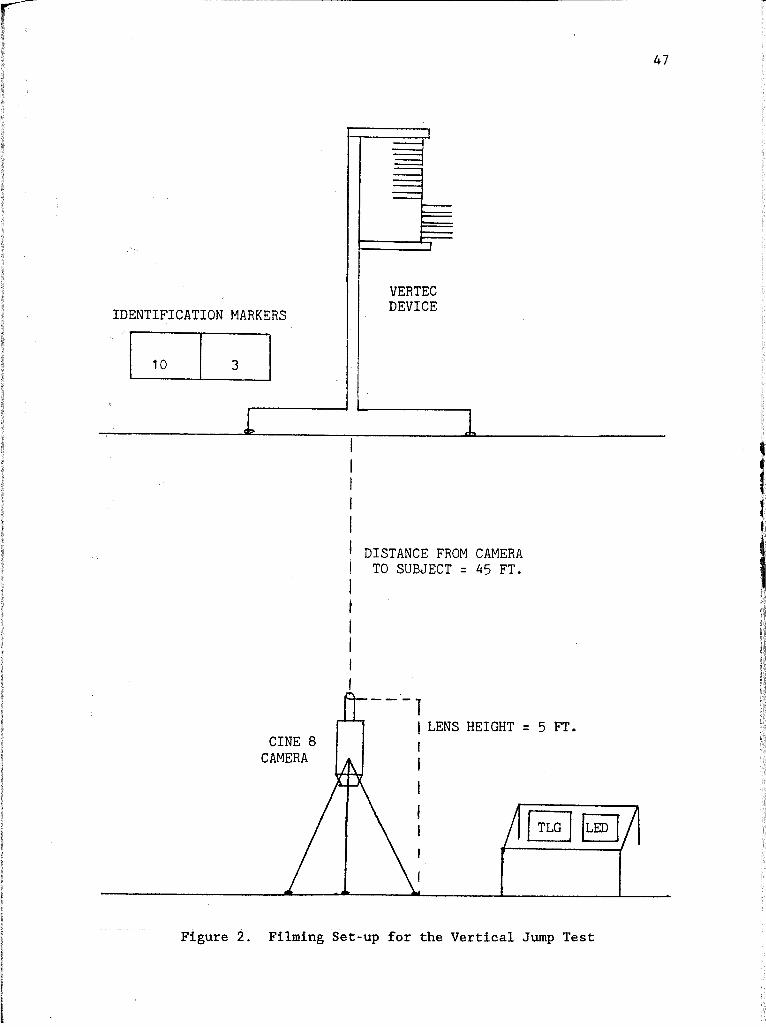
I
- - - - - - t
VERTEC
IDENTIFICATION MARKERS DEVICE
I
I DISTANCE FROM CAMERA I TO SUBJECT = 45 FT.
I t 1 I I I E---7
/ LENS HEIGHT = 5 FT. CINE 8 I
Figure 2. Filming Set-up for the Vertical Jump Test

of 2.0002 inch from frame to frame. To operate the camera an A.C./D.C
power canverter was necessary to change the A.C. source to a 28 Volt
D.C. current.
The variable setting (10 to 160 degrees) double blade shutter was
adjusted to an opening of 120 degrees for both filming sessions. The
camera, equipped with an Angenieux 12-120 mm zoom lens, was attached to a
Quick-Set Husky tripod, leveled and positioned perpendicular to the
plane of action. To minimize perspective error the camera was located a
distance of 45 feet from the subject for both filming sessions. The
tripod was adjusted so that the height to the center of the lens was 5
feet for filming of the vertical jump test and 4 feet for filming of the
Margaria stair test.
The shutter opening and the frame rate determined the exposure
time of 0.0022 second (1/450). The appropriate lens aperture (f-stop)
was found based upon the exposure time, film ASA, and the amount of
available light. A Sekonic light meter was used to measure the
available light and obtain the correct f-stop setting. Natural sunlight
provided adequate lighting to film at high speeds, and an f-stop setting
of 8 was needed for both the Margaira and vertical jump conditions. The
project was filmed with a total of seven Kodak Ektachrome Type G color
film cartridges each with 50 feet of available footage and an ASA of
160.
The camera was also equipped with an internal light emitting diode
(LED) which was connected to a timing light generator (TLG). The
TLG/LED driver was set at 10 Hertz and served the purpose of inputting a

signal which pulsed the camera's internal LED to mark the edge of the 1
I film 10 times per second. After the film was developed, these timing
1 marks were used to compute the actual speed at which the camera was
operating.
A set of identification markers were included within the
photographic field of view, with the first marker indicating the subject
number and the second marker indicating the trial number. At the
beginning of each film cartridge, a three foot reference measure was
filmed in both a horizontal and vertical direction in a plane parallel
to the plane of the film. This reference measure of known length was
used during kinematic analysis to scale film images into life size
dimensions. All three test trials of the the Margaria and vertical jump
tests were filmed from a lateral perspective. The camera was shut off
after each trial and then turned on one second before the next trial to
allow the camera to achieve the selected speed.
Kinematic Analysis
For each subject, the test trials with the greatest distance jumped
and the fastest stair run time were selected for analysis. All films
were carefully reviewed to select the individual frames for analysis in
each trial. The films were projected onto an Editor-Viewer console
using a Lafayette Model 927 Super 8 Motion Analyzer. This is a
precision built movie projector equipped with a mechanical counter and
1 designed for viewing of high speed films. The procedures and equipment
I I
required to collect the kinematic data will be explained within this
section.

A total of 15 frames per trial were digitized for the vertical jump I
test. The frames for each subject were selected as follows:
frames 1-3 downward movement in the preparatory phase of jump frame 4 low point of preparatory phase frame 5 beginning of upward movement from the crouch position frame 6 slightly before takeoff; hands positioned above shoulders frame 7 takeoff; feet leave the ground frame 8 midpoint of ascending flight of jump frame 9 peak point of jump frame 10 beginning of descending flight of jump frame 11 midpoint of descending flight of jump frame 12 contact with the ground frames 13-15 follow through of jump
Three frames were of primary concern for the vertical jump. The frames
of interest were those when the subject reached the low point of the
preparatory phase, takeoff, and peak point of the jump. The remaining
frames were selected subjectively to furnish the necessary data points
needed to obtain various data curves.
A total of 15 frames per trial were also digitized for the Margaria
stair run test. The frames for analysis were selected on the basis of
the following foot positions on each step: 1) foot contact; 2) heel
rise and; 3) toe off. These positions were selected for contact with
the second, fourth, and sixth steps and accounted for nine frames.
Three frames were chosen on the approach step and three'frames on the
follow through of the test, which provided the remaining frames needed
for data smoothing. The two frames of primary concern in the Margaria
test were the frame in which the subject made contact with the second
step to start the timer, and the frame in which the subject made contact
with the sixth step to stop the timer.
The Numonics Model 1224 Electronic Digitizer was used to digitize
each frame. In the digitizing mode, the position of the cursor detected

points in a single plane surface in relation to a Cartesian Coordinate I
System. The graphic data were converted into a series of horizontal (X)
and vertical (Y) coordinates and displayed on the Numonics console. The
information displayed on the console was directly transferred to an IBM
personal computer by depressing a footswitch connected to the digitizer
The IBM personal computer was interfaced with an Epson MX 100-111
printer.
Using the traverse arm with attached cursor, the digitizing
consisted of locating 19 segmental endpoints and one reference point,
for a total of 20 endpoints per frame (See Appendix C). This procedure
for locating X and Y coordinate values was followed for all frames being
analyzed. All of the digitizing was done by the principal
investigator to insure consistency in locating the segmental
endpoints. After all segmental endpoints were digitized per trial, the
data file was considered complete. However, to execute the computer
analysis program a time file also had to be completed.
Temporal data was attained by taking the time per frame, which was
computed based upon the timing marks located on the film. The timing
mark method was used to calibrate the actual frame rate of the camera.
The frame rate was computed by locating two frames with a similar
relationship between the location of the timing marks and the sprocket
holes of the film. The number of frames and timing marks were counted
between these two similar frames. Determining the frames per second
required dividing the number of frames by the number of timing marks,
and then multiplying by the timing pulse rate (10 Hertz). This
procedure was executed on all seven film cartridges, and it was found

that the camera was consistently running at a speed of 148.18 frames per
second. The time interval between two consecutive frames was computed
to be 0.0067 second (1/148.18) and served as the multiplyer for time
between any number of selected frames.
After completion of the data and time files, the JFILM computer
program was executed. The JFILM program was designed in 1979 by James
Richards of Indiana University for use in two-dimensional film analysis.
In 1983 Daniel Abts of the University of Wisconsin - La Crosse converted
the program to basic for use by an IBM personal computer. The computer
program converted digitized film data to produce both linear and angular
kinematic output for each entered endpoint.
Statistical Treatment of Data
The third edition of the Statistics Package for the Social Sciences
(SPSSx) was utilized on the VAX computer operating system manufactured
by Digital Equipment Corporation. The SPSSx is a general statistics
program designed to analyze batch oriented data. Paired t-tests were
executed to determine if a significant difference existed in any of the
stated hypotheses. The .05 level of significance was used for
acceptance or rejection of the null hypotheses.
CHAPTER IV
RESULTS AND DISCUSSION
The purpose of this study was to determine if two functional tests
of anaerobic power are measuring this human trait in its true scientific
form. The results for this study were obtained from a comparison
between a standard and cinematographic method for measuring anaerobic
power. The comparison was based on the variables of power output and
vertical velocity as derived from the stair climb and vertical jump
tests. Using dependent samples, paired t-tests were conducted on the
various combinations to ascertain if any significant differences existed
between the two methods. This chapter will present a summary of the
data as well as an interpretation of the results.
Summary of Results
The data summary will be organized as follows: 1) subject
characteristics; 2) vertical jump test; 3) Margaria stair test;
4) statistical analysis.
Subiect Characteristics
The sample of individuals who performed in this study consisted of
both male (n = 7) and female (n - 5) track athletes. The twelve
subjects ranged in age from 18-21 years and had a mean weight of 153.3
pounds. The characteristics for each subject can be found in Table 1.
The subject order from Table 1 was held constant throughout this chapter
to allow for ease of comparison. The first nine subjects performed both
the Margaria and vertical jump tests, whereas the last three subjects
53

participated in only the Margaria test.
TABLE 1. SUBJECT CHARACTERISTICS
SUBJECT SEX AGE(yrs) WEIGHT(1bs) TRACK & FIELD EVENT
MEAN 19.25 153.31 SD 1.22 22.96
high jump & sprints sprints & hurdles sprints long jump triple jump long jump long jump triple jump & sprints triple jump triple jump & high jump high jump & sprints long jump & sprints
Vertical Jumv Test
The values for power output and vertical velocity were compared
between the standard and cinematographic methods. A summary of the
vertical jump test results are presented in Table 2. The standard
method yielded higher values for average vertical velocity than the
cinematographic method. Since the resistive force or body weight
remained the same for both methods, the greater velocities found in the
standard method also resulted in greater power outputs for this method.
In all cases, except subject 8, power output from the standard or Lewis
Nomogram method was considerably higher than the power output from the
cinematographic method. Considering the cinematographic procedure as a
true scientific measurement of power, the standard method exposed an
approximate 7.7 % overestimation of anaerobic power.
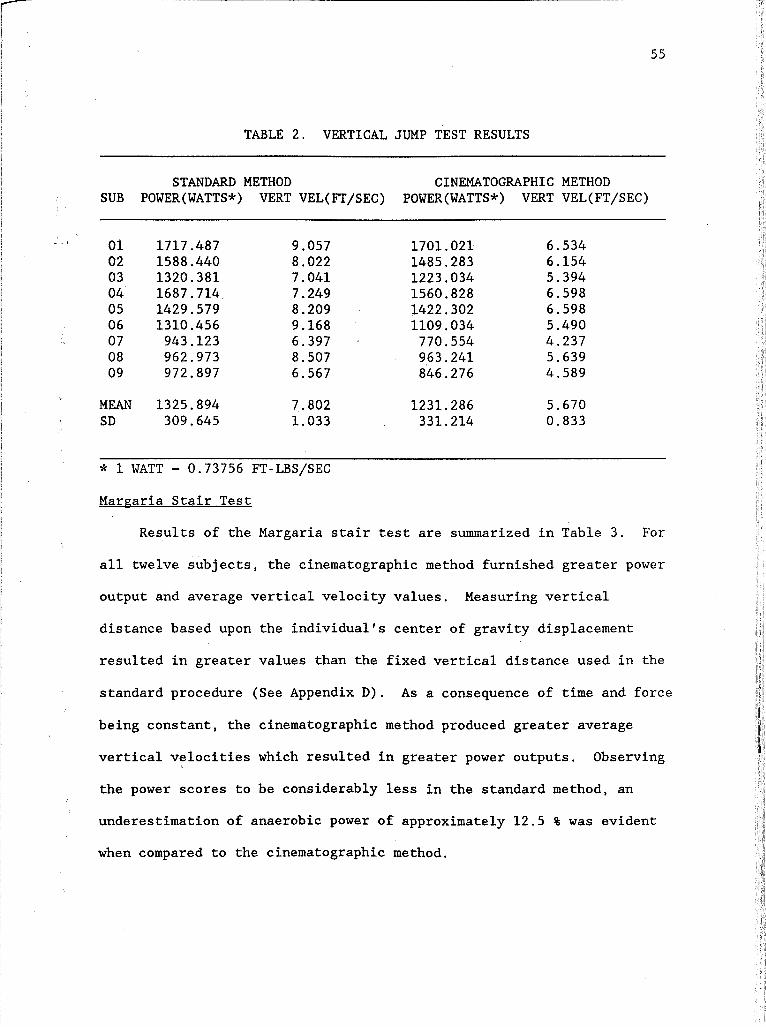
TABLE 2. VERTICAL JUMP TEST RESULTS
STANDARD METHOD CINEMATOGRAPHIC METHOD SUB POWER(WATTS*) VERT VEL(FT/SEC) POWER(WATTS*) VERT VEL(FT/SEC)
MEAN 1325.894 7.802 1231.286 5.670 S D 309.645 1.033 331.214 0.833
* 1 WATT = 0.73756 FT-LBS/SEC
Margaria - Stair Test
Results of the Margaria stair test are summarized in Table 3. For
all twelve subjects, the cinematographic method furnished greater power
output and average vertical velocity values. Measuring vertical
distance based upon the individual's center of gravity displacement
resulted in greater values than the fixed vertical distance used in the
standard procedure (See Appendix D). As a consequence of time and force
being constant, the cinematographic method produced greater average
vertical velocities which resulted in greater power outputs. Observing
the power scores to be considerably less in the standard method, an
underestimation of anaerobic power of approximately 12.5 % was evident
when compared to the cinematographic method.
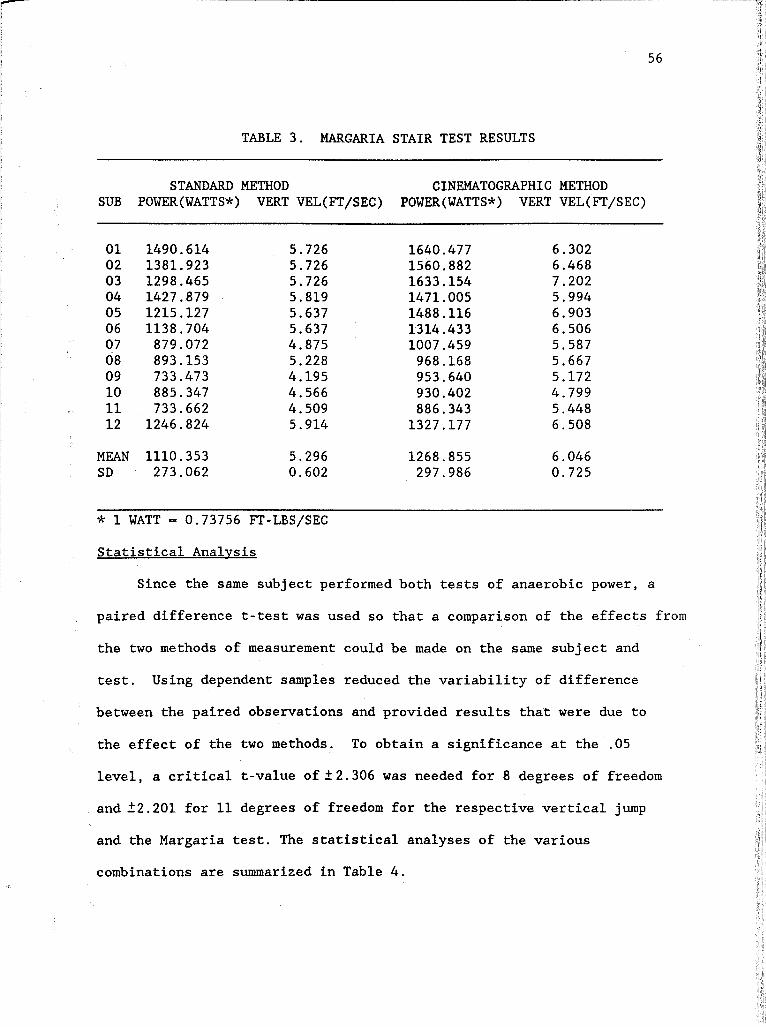
5 6
TABLE 3. MARGARIA STAIR TEST RESULTS
STANDARD METHOD CINEMATOGRAPHIC METHOD SUB POWER(WATTS*) VERT VEL(FT/SEC) POWER(WATTS*) VERT VEL(FT/SEC)
0 1 0 2 03 04 0 5 0 6 07 0 8 0 9 10 11 12
MEAN S D
* 1 WATT - 0.73756 FT-LBS/SEC Statistical Analvsis
Since the same subject performed both tests of anaerobic power, a
paired difference t-test was used so that a comparison of the effects from
the two methods of measurement could be made on the same subject and
test. Using dependent samples reduced the variability of difference
between the paired observations and provided results that were due to
the effect of the two methods. To obtain a significance at the .05
level, a critical t-value ofi2.306 was needed for 8 degrees of freedom
and 22.201 for 11 degrees of freedom for the respective vertical jump
and the Margaria test. The statistical analyses of the various
combinations are summarized in Table 4.

TABLE 4. RESULTS OF PAIRED T-TEST STATISTICAL ANALYSIS
VARIABLES NUMBER MEAN TWO - TAIL OF CASES DIFFERENCE T-VALUE PROBABILITY
POWSRS WITH POWSRF 12 -158.501 -6.29 0. OOO* POWJS WITH POWVJF 9 94.609 3.90 0.005* POWSRS WITH POWVJS 9 -163.849 -5.57 0. OOl* POWSRF WITH POWVJF 9 106.196 2.02 0.078
VELSRS WITH VELSRF 12 -0.750 -6.72 0. 000* VELVJS WITH VELVJF 9 2.132 7.91 0. OOO* VELSRS WITH VELVJS 9 -2.406 -8.44 0. 000* VELSRF WITH VELVJF 9 0.530 2.19 0.060
* SIGNIFICANT AT THE .05 LEVEL POWSRS = Power Stair Run Standard Method POWSRF - Power Stair Run Film Method POWVJS - Power Vertical Jump Standard Method POWVJF = Power Vertical Jump Film Method VELSRS = Vertical Velocity Stair Run Standard Method VELSRF - Vertical Velocity Stair Run Film Method VELVJS - Vertical Velocity Vertical Jump Standard Method VELVJF = Vertical Velocity Vertical Jump Film Method
As shown in Table 4, all pairs were significant at the .05 level
except two. The two insignificant differences were found between the
pairs of POWSRF with POWVJF and VELSRF with VELVJF. This would indicate
that the Margaria and vertical jump test produced similar results when
I based upon the cinematographic method of measurement involving I
I
I mechanical principles.
Discussion of Results
Anaerobic power is a very complex human movement parameter.
Mechanically, power combines force, displacement, and time or all three
of the fundamental measures of motion. Therefore, the concept of power

becomes extremely important to the analysis and description of almost
all human movement. This may also explain why the ability to develop
power becomes such a critical factor contributing to athletic success.
Thus, the need to kinematically and kinetically investigate the physical
trait of human power becomes quite relevant to the exercise sciences.
The discussion that follows will examine the results of this qualitative
study on anaerobic power along with an interpretation of the factors
which may have been of influence.
Maximal power output is related to both force and velocity of the
muscular effort (Winter, 1979; Vandewalle et al., 1987). Muscular power
can be viewed as the ability of the muscles to contract forcefully with
speed or simply as the rate of work done by the muscles. Regardless,
power must be integrated over a period of time since the rate of work
done by the muscles is rarely constant (Winter, 1979). According to
Sapega and Drillings (1983) that time is either at some instant or over
some period, and to qualify as a true scientific measurement, power
must be expressed as either instantaneous or average values and reported
in either units of Joules per second (Watts), foot-pounds per second or
horsepower.
Although time is not directly measured in the standard method of
the vertical jump, it has been accepted that the derived formula of the
Lewis Nomogram indirectly incorporates a time component (Fox & Mathews,
1981). Gray et al., (1962a) investigated a jump and reach procedure
based on scientific principles and decided that what he termed the
vertical power jump was a valid measure of true power. It has also been
found that a simple jump and reach technique is an acceptable substitute
for the in-depth scientific method (Gray et al., 1962b). Reporting
results from the standard method of the vertical jump in Watts should
therefore be considered a true measure of anaerobic power. However,
others have objectively studied the vertical jump and concluded that
- this commonly administered test was unjustified as a measure of human
power (Barlow, 1971; Considine, 1971). The standard method of the
Margaria stair test directly measures time and the validity of this
anaerobic power test has not been questioned like that of the vertical
jump. Also, the cinematographic methods for the two functional tests
incorporate all three quantities of motion required for power output,
thereby making it correct to be reported as such a measure.
Instantaneous values are difficult to obtain unless one has force
plates or other sophisticated and expensive measuring devices. It
should be noted that the power values reported in this study were in no
way instantaneous, and therefore should be considered as average
measurements of power. The primary reason why the methods for the
Margaria and vertical jump tests used in this study render only average
measures is related to the force component of anaerobic power.
Based on Newton's Third Law of Motion, we know that for every
action there is an equal and opposite reaction (Hay, 1985). This L
\ action-reaction principle would indicate that in order for the body to
move against gravity it would have to exert a muscular force against the
ground that was greater than body weight. Therefore, simply using body
weight as the force component for computing power would not result in
optimal power outputs. Biomechanical studies have found that the forces
involved with jumping are actually two to three times greater than one's
own body weight (Davies & Reenie, 1968; Brancazio, 1984; Offenbacher,
1970; Miller & Nelson, 1973). Also, using just body weight as the
resistive force does not account for the acceleration of the body mass,
which provides an important contribution to force production. This could
possibly lead to some of the discrepancies associated with the effect of
body weight on power production.
Barlow (1971) found that power as it was scientifically measured
from the vertical jump had a high positive correlation with body weight,
which was also the case in the stair test. Mayhew et al., (1986) noted
that for males performing the Margaria-Kalamen stair test, a difference
of 63.7 % in power was accounted for by variances in body weight and
36.4 % by variations in stair run times , and for female subjects these
percentages were 55.5 % and 39.4 % respectively. When investigating the
effects of external loading or added body weight on power output from
the vertical jump (Davies & Young, 1984) and the Margaria test (Caiozzo
& Kyle, 1980; Kyle & Caiozzo, 1985), the results reported were not in
agreement. Mayhew and his associates (1986) also found that removing
the effects of body weight significantly improved the correlation
between power, acceleration, and vertical velocity as determined from
the Margaria-Kalamen anaerobic power test. These several studies might
well be an indication that the Margaria and vertical jump tests express
body composition to a greater degree than was expected, and that the
effects of body weight on power output should be carefully examined when
interpreting results from these two tests.
The path that the center of mass takes during any activity is an
important concern when dealing with human motion. Any object,

including the human body, has a specific point or center of gravity
around which the mass of that object is balanced. Therefore, the human
body moves as if all its mass was centered around the point through
which the force of gravity acts (Brancazio, 1984; Miller & Nelson,
1973).
In tests such as the Margaria stair and the vertical jump, it is
assumed that the vertical displacement of the center of gravity is equal
to the measured vertical distance. However, as shown from this study, a
significant difference was found between the standard and cinematographic
methods of measuring power. Every subject who performed the Margaria
test showed an increase in vertical displacement over the fixed vertical
displacement measured in the standard method (See Appendix D). Since
time and body weight remained the same in the standard and
cinematographic method of the Margaria test, the factor contributing to
the significant difference would appear to be vertical displacement of
the body's center of gravity. The increase in vertical displacement
would also indicate that an increased amount of work was performed in
the same amount of time, which would provide the increase shown in
power output from the cinematographic method. Additionally, the
cinematographic method seemed to bring about individual differences
attributed to body positions at the beginning and end of the test. This
implied that using a fixed vertical distance could be a possible
limitation of power production from the Margaria stair test, therefore
explaining the underestimation of anaerobic power shown in the standard
method . A significant difference was also discovered between the standard
and cinematographic methods of the vertical jump. This test condition
posed a different situation in that the standard method overestimated
power outputs when compared to the cinematographic method. However, the
significance found between the two methods of the vertical jump can
likewise be attributed to vertical displacement of the body's center of
gravity.
The standard method of the vertical jump using the Lewis Nomogram
does not take into consideration the muscular effort needed to lift the
body from the crouch position to takeoff. However, this is the portion
of the jump that determines what happens once the jumper leaves the
ground. It is this period, while the jumper is in contact with the
ground, that he/she must generate enough force to project the body
upward. Therefore, it would make sense to include this portion of the
jump when computing power outputs.
Although the jumper was in flight the same amount of time for both
methods, the addition of the crouch phase increased the vertical
displacements as well as the amount of time taken to complete the jump.
The increases seen in the cinematographic method resulted in the
subjects having slower average vertical velocities, which in turn
produced less power because force remained constant. Barlow (1971)
found that vertical displacement of the total body center of gravity was
not a significant factor in the development of power produced in the
vertical jump. However, this study would indicate that the vertical
displacement of the body's center of gravity does contribute to the
significance between two methods of measurement, and that the method of
measurement can make a difference in the power outputs obtained from the
vertical jump. It appears that the preparatory phase is critical to the
production of power and not accounting for it could produce inadequate
estimates, which could possibly explain the overestimation of power
output derived from the standard method of the vertical jump.
Comparing the standard method of the Margaria and vertical jump
tests revealed a significance at the .001 level. As discussed, the
standard methods of these two tests inaccurately measure vertical
displacement when compared to the more scientific means of measurement.
So it should come as no surprise to find that comparison between the
standard methods provided significantly different power outputs. The
significance could, however, also be related to other differences that
can be detected when observing how each test is performed. This could
be supported by the moderate correlations found between the Margaria and
vertical jump tests which would imply that they are not perfectly
related tests (Olsen, 1987; Kalamen, 1968). Although measuring these
other differences was beyond the scope of this research project, they
could be very important when evaluating anaerobic power from a
mechanical viewpoint.
A primary difference between the two tests is the process by which
the muscular power is initiated. In the vertical jump both legs are
contracting simultaneously to thrust the body upward. However, in the
Margaria test only one leg at a time contracts in order to climb the
stairs. This can also be related to how the body utilizes the kinetic
energy that is produced during the muscular efforts. (Davies & Young,
1984; Kyle & Caiozzo, 1985; Vandewalle et al., 1987).
Another difference between the two tests is the number of times the
subject makes contact with the ground. The vertical jump requires that
all the force needed to vertically jump to a maximum height be produced
while the feet are in contact with the ground; whereas the stair climb
allows force to'be produced each time contact is made with a step.
Therefore, this difference results in power being determined from
several muscular contractions opposed to a single muscular effort from
the vertical jump. This also affects how the subject can be analyzed
based on mechanical principles. In the vertical jump once the subject
breaks contact with the ground he/she can be treated as a free falling
body. However, in the Margaria test the subject has contact with the
ground several times and those same free falling biomechanical
principles cannot be as easily applied to this condition. This may pose
,some problem when trying to compare takeoff velocities between the two
tests. However, a way to reinforce this difference may be to
investigate what is referred to as impulse.
This impulse, or force that acts over an interval of time, causes a
change in the motion known as momentum (Miller & Nelson, 1973). The
amount of time the subject is in contact with the ground is one area
that can be easily measured from biomechanical studies, and as found in
this study that time was different between the two tests (See Appendix
D). To achieve a successful performance in both the Margaria and the
vertical jump however, the subject must generate a substantial impulse
from the ground reaction force. Adamson and Whitney (1971) criticized
the connection of power to impulsive actions such as jumping, but
perhaps this would be a way to analyze power between the Margaria and
vertical jump tests. However, impulsive actions are better suited to be
reported as instantaneous values and researching this concept with force
plates would be much more valuable than the average values obtained in
this study.
In the case of this study, the nonsignificant result found when
cgmparing the cinematographic methods of the two tests was a good
indication. This meant that when evaluating power using the same
mechanical principles the individual was producing somewhat equal
estimates of power output. Using total body center of gravity as the
vertical displacement measurement appeared not to impose any limitations
on the tests, which permitted the subjects to perform each test relative
to their mechanical capabilities.
The similarities between the two tests may be related to factors
such as those mentioned by Sargent in his 1924 investigation of the
vertical jump. The common features shared by the Margria and vertical
jump test include the following: 1) both are functional field tests of
anaerobic power; 2) both require several muscle groups to produce a
1 force greater than body weight; 3) both are multijoint impulsive actions
1 and; 4) both involve neuromuscular efficiency or an agility and i 1 coordination factor. !
1 The results reported for vertical velocity followed the same pattern
as the variable of power output. A significant difference was found
i between the cinematographic and standard methods for both the Margaria
and vertical jump, as well as significance between standard methods.
1 I This should be expected since velocity is derived from distance divided $
by time. The variance found between vertical displacement of the two
methods would account for the difference in vertical velocities, which

also would explain the varying power values already discussed. The
nonsignificance revealed between the vertical velocities produced by the
cinematographic method would simply reinforce the idea that the two
tests are providing similar measurements of anaerobic power. Finding
that the Margaria and vertical jump tests can produce similar measures
of power perhaps may warrant that the matter be further investigated, so
that a regression equation could be developed to predict scores on the
complex cinematographic methods based upon the simple standard methods.
Despite all the significant differences found when comparing the
two methods of measurement, the nonsignificant results provided some
evidence that the Margaria and vertical jump tests could be considered
as similar average values of human power output when measured from a
strictly mechanical procedure. Also, basing the investigation on true
scientific measures appeared to bring out the individual differences
between the subjects. The results of this study would imply that
different tests of anaerobic power can provide comparable measures of
human power output when this scientific concept is accurately and
consistently defined.

CHAPTER V
SUMMARY, FINDINGS, CONCLUSIONS, RECOMMENDATIONS
Anaerobic power is a very complex physical trait and is quite often
a misinterpreted concept. The study was undertaken in an attempt to
discover if two functional tests of anaerobic power were measuring the
same trait based upon the true physical definition of the term power. A
biomechanical analysis was employed to objectively investigate the
Margaria and vertical jump power tests. High speed filming procedures
were utilized so that a comparison could be made between common field I
procedures used in testing anaerobic power. Therefore, this study was
designed to determine if significant differences existed between the
more complex cinematographic methods and the frequently used standard
methods of measuring anaerobic power output. Twelve track athletes
trained for jumping and sprinting events were tested and filmed while
performing the Margaria and vertical jump tests. For each subject, the
trial with the fastest Margaria stair time and the highest vertical jump
were analyzed. Paired t-tests were computed to statistically determine
if a significant difference existed between any of the methods.

Findings
Based on the hypotheses tested the following statistical results
were obtained:
1. There was a significant difference when comparing the power
outputs derived from the standard methods of the Margaria and vertical
jump tests.
2. There was no significant difference when comparing the power
I outputs derived from the cinematographic methods of the Margaria and
vertical jump tests.
3 . There was a significant difference when comparing the power
outputs derived from the standard and cinematographic methods of the
Margaria test.
4 . There was a significant difference when comparing the power
outputs derived from the standard and cinematographic methods of the
vertical jump test.
5. There was a significant difference when comparing the average
vertical velocity derived from the standard methods of the Margaria and
vertical jump power tests.
6 . There was no significant difference when comparing the average
vertical velocity derived from the cinematographic methods of the
Margaria and vertical jump tests.
7. There was a significant difference when comparing the average
vertical velocity derived from the standard and cinematographic
method of the Margaria test.

8 . There was a significant difference when comparing the
average vertical velocity derived from the standard and cinematographic
method of the vertical jump test.
Conclusions
This research project investigating anaerobic power provided the
following conclusions:
1. The Margaria and vertical jump tests can be considered I
functional for they do provide an average value that is an estimation of
anaerobic power output.
2. The standard method of the vertical jump test appears to
overestimate power output whereas the standard method of the Margaria
stair test appears to underestimate power output when compared to the
cinematographic methods.
3 . The Margaria and vertical jump tests appear to produce similar
scientific measures of anaerobic power when based upon cinematographic
methods involving displacement of the body's center of gravity.
Recommendations
The following recommendations were made as a result of this study:
1. A similar study could be done that uses a larger sample size of
either male or female subjects.
2 . A similar study could be done that investigates power outputs
from subjects in a specific track event or perhaps in one of the
other power sports.

3 . A similar research project could be done to develop a
regression equation that could predict power output from the
cinematographic methods based upon the measurements reported from the
standard methods.
4. A similar study could be done using external loading to
investigate the mechanical components of power.
5 . A similar study could be done involving a pre/post season
investigation to see if the significant differences found would hold
true over a length of time.
REFERENCES CITED
Adamson, G.T., & Whitney, R.J. (1971). Critical appraisal of jumping as a measure of human power. In E. Jokl & M. Hebbelnick (Eds.), Medicine and Svort: vol 6.. Biomechanics I1 (pp. 208-211). Baltimore, MD: University Park Press.
Ayalon, A., Inbar, O., & Bar-Or, 0. (1974). Relationship among measurements of explosive strength and anaerobic power. In R.C. Nelson & C.A. Morehouse (Eds.), Biomechanics IV: International Series on Sport Sciences (pp. 572-577). Baltimore, MD: University Park Press.
Barlow, D.A. (1971). Relation between power and selected variables in the vertical jump. In J.M. Cooper (Ed.), Biomechanics: Proceedings of the CIC synvosium (pp. 233-241). Chicago: Athletic Institute.
Beckenholdt, S.E., & Mayhew, J.L. (1983). Specificity among anaerobic power tests in male athletes. The Journal of Svorts Medicine and Phvsical Fitness, 23, 326-332.
Berger, R.A., & Henderson, J.M. (1966). Relationship of power to static and dynamic strength. Research Quarterly, 37, 9-13.
Bosco, C., Luhtanen, P., & Komi, P.V. (1983). A simple method of mechanical power in jumping. Eurovean Journal of Avvlied Phvsiology, 50, 273-282. -
Brancazio, P.J. (1984). Svort science: Phvsical laws and optimal performance. New York: Simon & Schuster.
Burley, L.R., & Anderson, R.L. (1955). Relation to jump and reach measures of power to intelligence scores and athletic performance. Research Ouarterlv, 26, 28-35.
Caiozzo, V.J., & Kyle, C.R. (1980). The effect of external loading upon power output in stair climbing. Eurovean Journal of Avvlied Phvsiolo~y, 44, 217-222.
Capen, E.K. (1950). The effect of systematic weight training on power, strength, and endurance. Research Quarterly, 21, 83-93.
Carpenter, A. (1938). Strength, power, and "femininity" as factors influencing the athletic performance of college women. Research Quarterly, 2, 120-127.

Chui, E. (1950). The effect of systematic weight training on athletic power. Research Quarterly, 21, 188-194.
Considine, W.J. (1971). A validity of selected leg power tests, utilizing a force platform. In J.M. Cooper (Ed.), Biomechanics: Proceedin~s of the CIC svm~osium (pp. 243-250). Chicago: Athletic Institute.
Considine, W.J., & Sullivan, W.J. (1977). Relationship of selected tests of leg strength and leg power on college men. Research
t Quarterly, 44, 401-416.
Costill, D.L., Miller, S.J., Myers, W.C., Kehoe, F.M., & Hoffman, W.H. (1968). Relationship among selected tests of explosive leg strength and leg power. Research Ouarterlv, 39, 785-787.
Counsilman, J. (1976). Power: What it is and how to use it. Track Techniques, 39, 785-787.
Davies, C.T.M., & Rennie, R. (1968). Human power output. Nature, 217, 770-771. -
Davies, C.T.M., & Young, K. (1984). Effects of external loading on short term power output in children and young male adults. European Journal of Avvlied Phvsiology, 52, 351-354.
DiGiovanna, V. (1943). The relation of selected structural and functional measures to success in college athletics. Research Quarterly, l4, 199-216.
Fox, E.L., & Mathews, D.K. (1981). The ~hvsiological bases of phvsical education and athletics (3rd ed.). Philadelphia, PA: Saunders College Publishing.
Gray, R.K., Start, K.B., & Glencross, D.J. (1962a). A test of leg power. Research Quarterly, 33, 44-50.
Gray, R.K., Start, K.B., & Glencross, D.J. (1962b). A useful modification of the vertical power jump. Research Quarterly, 33, 230-235.
Gray, R.K., Start, K.B., & Walsh, A. (1962). Relationship between leg speed and leg power. Research Quarterly, 33, 395-399.
German, T.M. (1984). The relationship of absolute and relative Dower to strength and speed. Unpublished master's thesis, University of Wisconsin, Lacrosse.
Hay, J.G. (1985). The biomechanics of sports techniaues (3rd ed.). Englewood Cliffs, NJ: Prentice Hall.

Hutto, L.E. (1938). Measurement of the velocity factor and of athletic power in high school boys. Research Ouarterlv, 9, 109-128.
Kalamen, J.L. (1968). Measurement of maximum muscular power in man. Unpublished doctoral dissertation. Ohio State University, Ohio.
Kitagawa, K., Suzuki, M., & Miyashita, M. (1980). Anaerobic power output of young men: Comparison with non-obese men and the role of excess fat. European Journal of Applied Phvsiolo~v, 43, 229-234.
Knuttgen, H.G. (1978). Force, work, power, and exercise. Medicine and Science in Sports, J.0, 227-228.
Kyle, C.R., & Caiozzo, V.J. (1985). A comparison of the effect of external loading upon power output in stair climbing and running up
, a ramp. European Journal of Avvlied Phvsiolo~v, 54, 99-103.
Kyle, C.R., & Caiozzo, V.J. (1986). Experiments in human ergometry as applied to the design of human powered vehicles. International Journal of Sport Biomechanics, 2, 6-19.
Laird, C.E., & Rozier, C.K. (1979). Toward understanding the terminology of exercise mechanics. Physical Thera~y, 59, 287-292.
Lamb, D.R. (1984). Phvsiolo~v of exercise. New York: Macmillian Publishing.
Margaria, R., Aghemo, R., & Rovelli, E. (1966). Measurement of muscular power (anaerobic) in man. Journal of Applied Ph~siolo~v, 21, 1662-1664. -
Martin, T.P., & Stull, G.A. (1969). Effects of various knee angles and foot spacing combinations on performance in the vertical jump. Research Ouarterlv, 40, 324-331.
Mayhew, J.L., Schwegler, M.A., & Piper, F.C. (1986). Relationship of acceleration momentum to anaerobic power measurements. The Journal of Sports Medicine and Phvsical Fitness, 26, 209-213.
McClements, L.E. (1966). Power relative to strength of leg and thigh muscles. Research Quarterly, 37, 71-78.
McCloy, C.H. (1932a). The measurement of athletic Dower. New York: A.S. Barnes & Co.
~ccloy, C.H. (1932b). Recent studies in the Sargent jump. Research Quarterly, 3, 235-242.
McCloy, C.H. (1942). Tests and measurements in health and phvsical education (2nd ed., p. 56-65). New York: F.S. Crofts & Co.

Moffroid, M.A., & Kusiak, E.T. (1975). The power struggle: Definition and evaluation of power of muscular performance. Phvsical Therapy, 55, 1098-1104. -
Offenbacher, E.L. (1970). Physics and the vertical jump. American Journal of Physics, 38, 829-836.
Olsen, E.M. (1987). A correlation of ~ower tests: Vertical iumv, Margaria Dower test. and cvbex leg - Dower test. Unpublished master's thesis, University of Wisconsin, Lacrosse.
Robertson, D.G.E., & Fleming, D. (1987). Kinetics of standing broad and vertical jumping. Canadian Journal of Sport Sciences, l2(1), 19-23.
Sargent, D.A. (1921). The physical test of man. American Physical Education Review, 26, 188-194.
Sargent, L.W. (1924). Some observations on the Sargent test of neuro- muscular efficiency. American Phvsical Education Review, 29, 47-56.
Sapega, A.A., & Drillings, G. (1983). The definition and assessment of muscular power. The Journal of Orthovaedic and Sports Physical Therapv, 5, 7-9.
Stamford, B. (1985). The difference between strength and power. The Phvsician and S~ortsmedicine, l3(7), 155.
Start, K.B., Gray, R.K., Glencross, D.J., & Walsh, A. (1966). A factorial investigation of power, speed, isometric strength, and anthropometric measures in the lower limb. Research Quarterly, 37, 553-559. -
Van Dalen, D. (1940). New studies in the Sargent jump. Research Ouarterlv, 11, 112-115.
Vandewalle, H., Peres, G., & Monod, H. (1987). Standard anaerobic tests. Sports Medicine, 4, 268-289.
Wilkie, D.R. (195Oa). Man as a source of mechanical power. Ergonomics, 3, 1-8. -
Wilkie, D.R. (1950b). The relation between force and velocity in human muscle. Journal of Physiolog~, 110, 249-280.
Winter, D.A. (1979). Biomechanics of human movement. New York: John Wiley & Sons.

APPENDIX A
INFORMED CONSENT FORM

INFORMED CONSENT FORM University of Wisconsin-La Crosse
La Crosse, WI 54601
Project Title: A Biomechanical Comparison of the Vertical Jump and Margaria Power Tests
Principal Investigator: Mary L. Wolk
I am agreeing to participate in a biomechanical analysis of two anaerobic power tests. In this study I will perform the vertical jump test (jumping and reaching as high as possible) and the Margaria stair
I test (running up steps, two at a time, as fast as possible) while being
filmed by high speed cinematographic techniques. The testing will involve two filming sessions, each approximately 15 minutes.
As with any exercise or testing situation, there is a certain , degree of risk involved. Through the explanation of proper techniques,
every attempt will be made to reduce any of the potential discomforts and risks (muscle strains, muscle soreness, tripping on the steps). I hereby am fully aware of and understand the nature of the testing situation. The principal investigator will answer any and all inquiries concerning procedures, risks or benefits.
I , being of sound mind and years of age, do hereby consent to, authorize and request the person named above, Mary L. Wolk (and her assistants) to undertake and perform on me the proposed procedure, treatment, research or investigation (herein called "procedure").
I have read the above document, and have been fully advised of the nature of the procedure and the possible risks and complications involved in it, all of which risks and complications I hereby assume voluntarily.
I hereby acknowledge that no representation, warranties, guarantees or assurances of any kind pertaining to the procedure have been made to me by the University of Wisconsin-La Crosse, the officers, administration, employees or by anyone acting on behalf of any of them.
I understand that I may withdraw from the project at any time.
Signed at this day of t 19-, in the presence of the witnesses whose signatures appear below opposite my signature.
(SUBJECT)
(WITNESSED BY)

APPENDIX B
LEWIS NOMOGRAM

The kno
METRIC UNITS RIRMUU (kg -rn/tec)
P'(.&(wEK;HT)m)
Ltwts Nomogram. A person9s power output can wing the score on the jump reach and the body
I be dete weight

APPENDIX C
KINEMATIC DATA INPUT PROCEDURE

Data Invut
When d ig i t i z i ng segmental endpoints f o r a t o t a l body ana lys i s , the coordinate data points from each selected frame of f i lm should be input i n the following order.
Order X - Y Data Point
Right hand extremity Right ulnar s t y lo id process Right center of elbow Right coracoid process Left coracoid process Left center of elbow Left ulnar s t y lo id process Left hand extremity Right foot extremity Right medial malleolus Right center of knee Right greater trochanter Left greater trochanter Left center of knee Left medial malleolus Left foo t extremity Tragus of ea r Top of sternum Crotch o r midpoint of trochanters Center of gravi ty of object ( i f present) Reference point
B
APPENDIX D
DISPLACEMENT AND TIME DATA

VERTICAL JUMP TEST
DISPLACEMENT(FT) TIME(SEC) SUBJECT STANDARD CINEMATOGRAPHIC TOTAL CONTACT-k
MEAN 2.26 3.09 S D .54 .64
*CONTACT = AMOUNT OF TIME FROM LOW POINT OF CROUCH TO TAKEOFF
MARGARIA STAIR TEST
DISPLACEMENT(FT) TIME(SEC) SUBJECT STANDARD CINEMATOGRAPHIC TOTAL CONTACT*
MEAN 2.42 2 .76 S D . 00 .18
*CONTACT = AMOUNT OF TIME ON SECOND STEP + AMOUNT OF TIME ON FOURTH STEP